1. Introduction
The uncontrolled duplication of cells as a result of the alteration in their normal function leads to a disease called cancer [
1]. Recently, 9.6 million deaths were reported to be caused by cancer in 2018 [
2]. PDT is one of the treatment modalities for destroying cancer cells with appropriate light of a particular wavelength and a photosensitizer. It is also a targeted therapy preventing the division, dispersal, and growth of cancer cells. By activating the photosensitizer with light, a form of oxygen “REACTIVE OXYGEN SPECIES” is produced that damages cancer cells [
3].
Photosensitizers are activated by certain wavelengths of light and are localized to a preferred area of the cancer cells. When a PS absorbs photons, it becomes unstable in its excited singlet state. After that, intersystem crossing converts it into an excited triplet state. It can again go back to ground state by phosphorescent emission, providing light for imaging purposes and cancer treatment. Before using a photosensitizer, the light absorption wavelength, the concentration in cancer cells, and its toxicity without photonic interactions should be evaluated [
4].
The research purpose of this work is to investigate the preliminary photodynamic feasibility of Rhodamine-640 perchlorate as a photosensitizer on Rhabdomyosarcoma cancer cells. The absorption capability at specific wavelengths, the feasibility at optimal times, and the cytotoxicity of Rh-640 perchlorate will let us determine whether it may be effective for PDT of human RD cancer cells without any lethal effects.
2. Materials and Methods
Vessels and reagents, an incubator, an inverted microscope, a microwell plate reader, a UV–visible spectrophotometer, and 96-well culturing plates were all provided by Biophotonics and Photomedicine Laboratory DPAM, PIEAS and purchased from “Sigma Chemical Co.” (Burlington, MA, USA) The cell line was obtained from National Institute of Health Sciences (NIH), Islamabad, Pakistan.
2.1. UV Spectra of Rh 640 Perchlorate
The UV–visible spectrophotometer was used to observe the absorption spectra of Rh640 perchlorate. The 5 mM stock solution for the PS was prepared and further diluted to 500 µM. The absorption spectra were observed in the wavelength range of 400 to 700 nm.
2.2. Subculturing and Optimum Uptake Time
The cultured flask was brought to a biosafety cabinet and subculturing was performed. For optimum uptake time, a stock solution of the PS was prepared and diluted. A PS concentration of 50 μM was introduced to the plate at different times. At intervals of 30 min, the absorbance was found and a graph was plotted between time and absorbance.
2.3. Cytotoxicity
For cytotoxicity, the common method involves an 18 h incubation of the plates; then, the medium is removed and washed with PBS. The MEM medium was added to the cells. PS concentrations of 10, 20, 40, 50, 60, 80, 100, and 150 µL/mL were administered and incubated for 3 h. The absorbance was obtained using a microwell plate reader and MTT was performed for cytotoxicity. The condition of the cells was checked by an inverted microscope.
3. Results
3.1. Visible Absorption Spectra
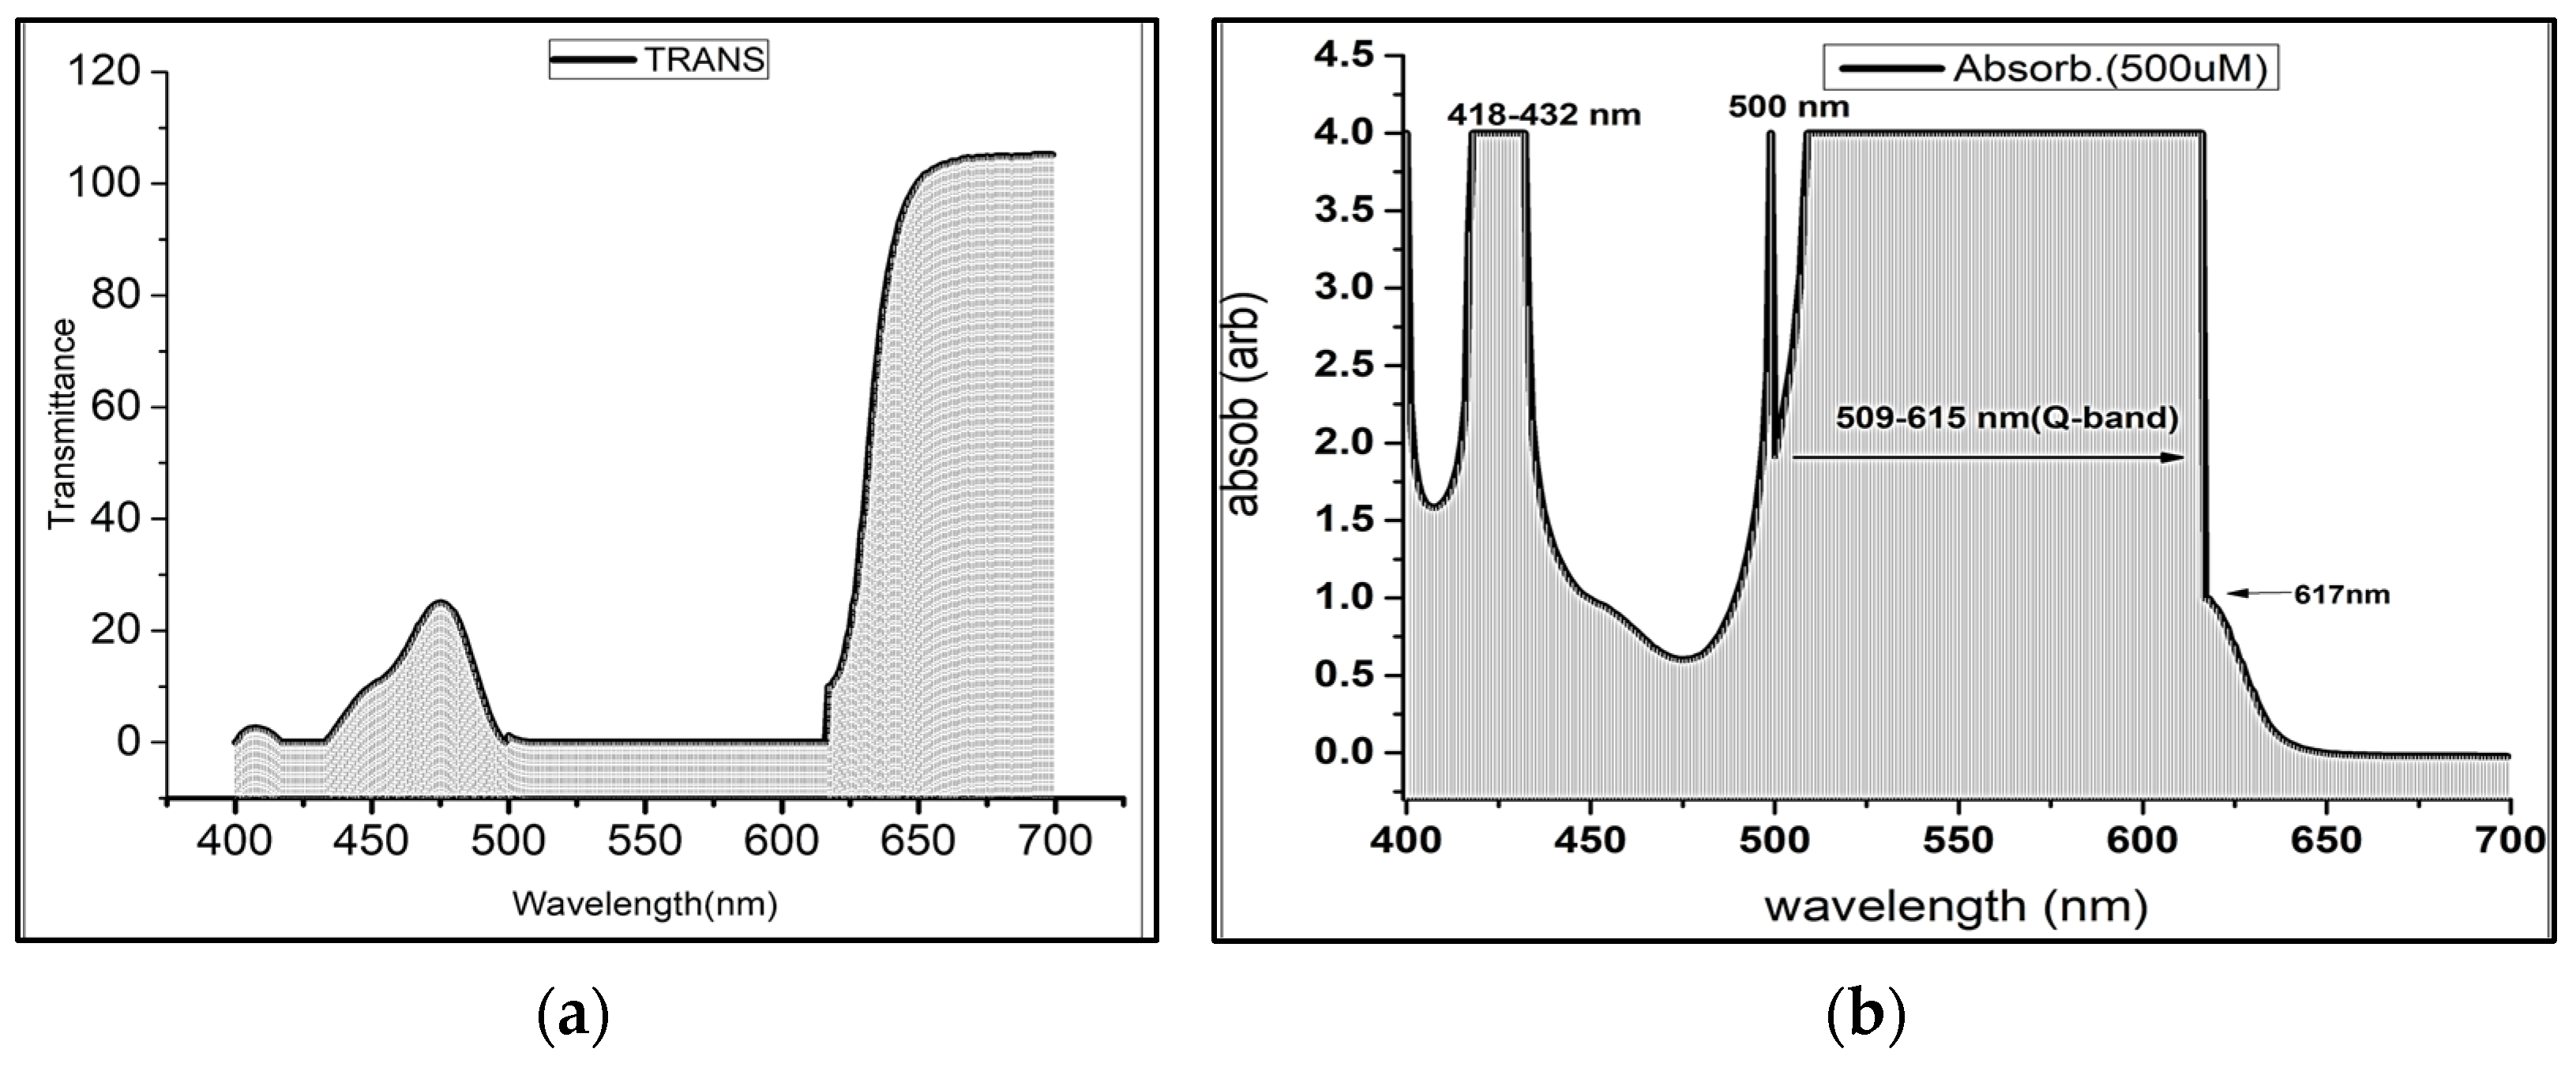
The Visible absorption spectra of the PS was determined to check its trend of absorption in the visible range. In the transmission spectrum given in
Figure 1a, it is clear that all the light in the range from 500 to 630 nm will be completely absorbed by the Photosensitizer. The absorption spectra of Rh-640 perchlorate are given in
Figure 1b. The Q band absorption maxima are higher, more than 100 nm (509–615) nm than the Soret band.
3.2. Optimum Uptake Time and Standard Curve
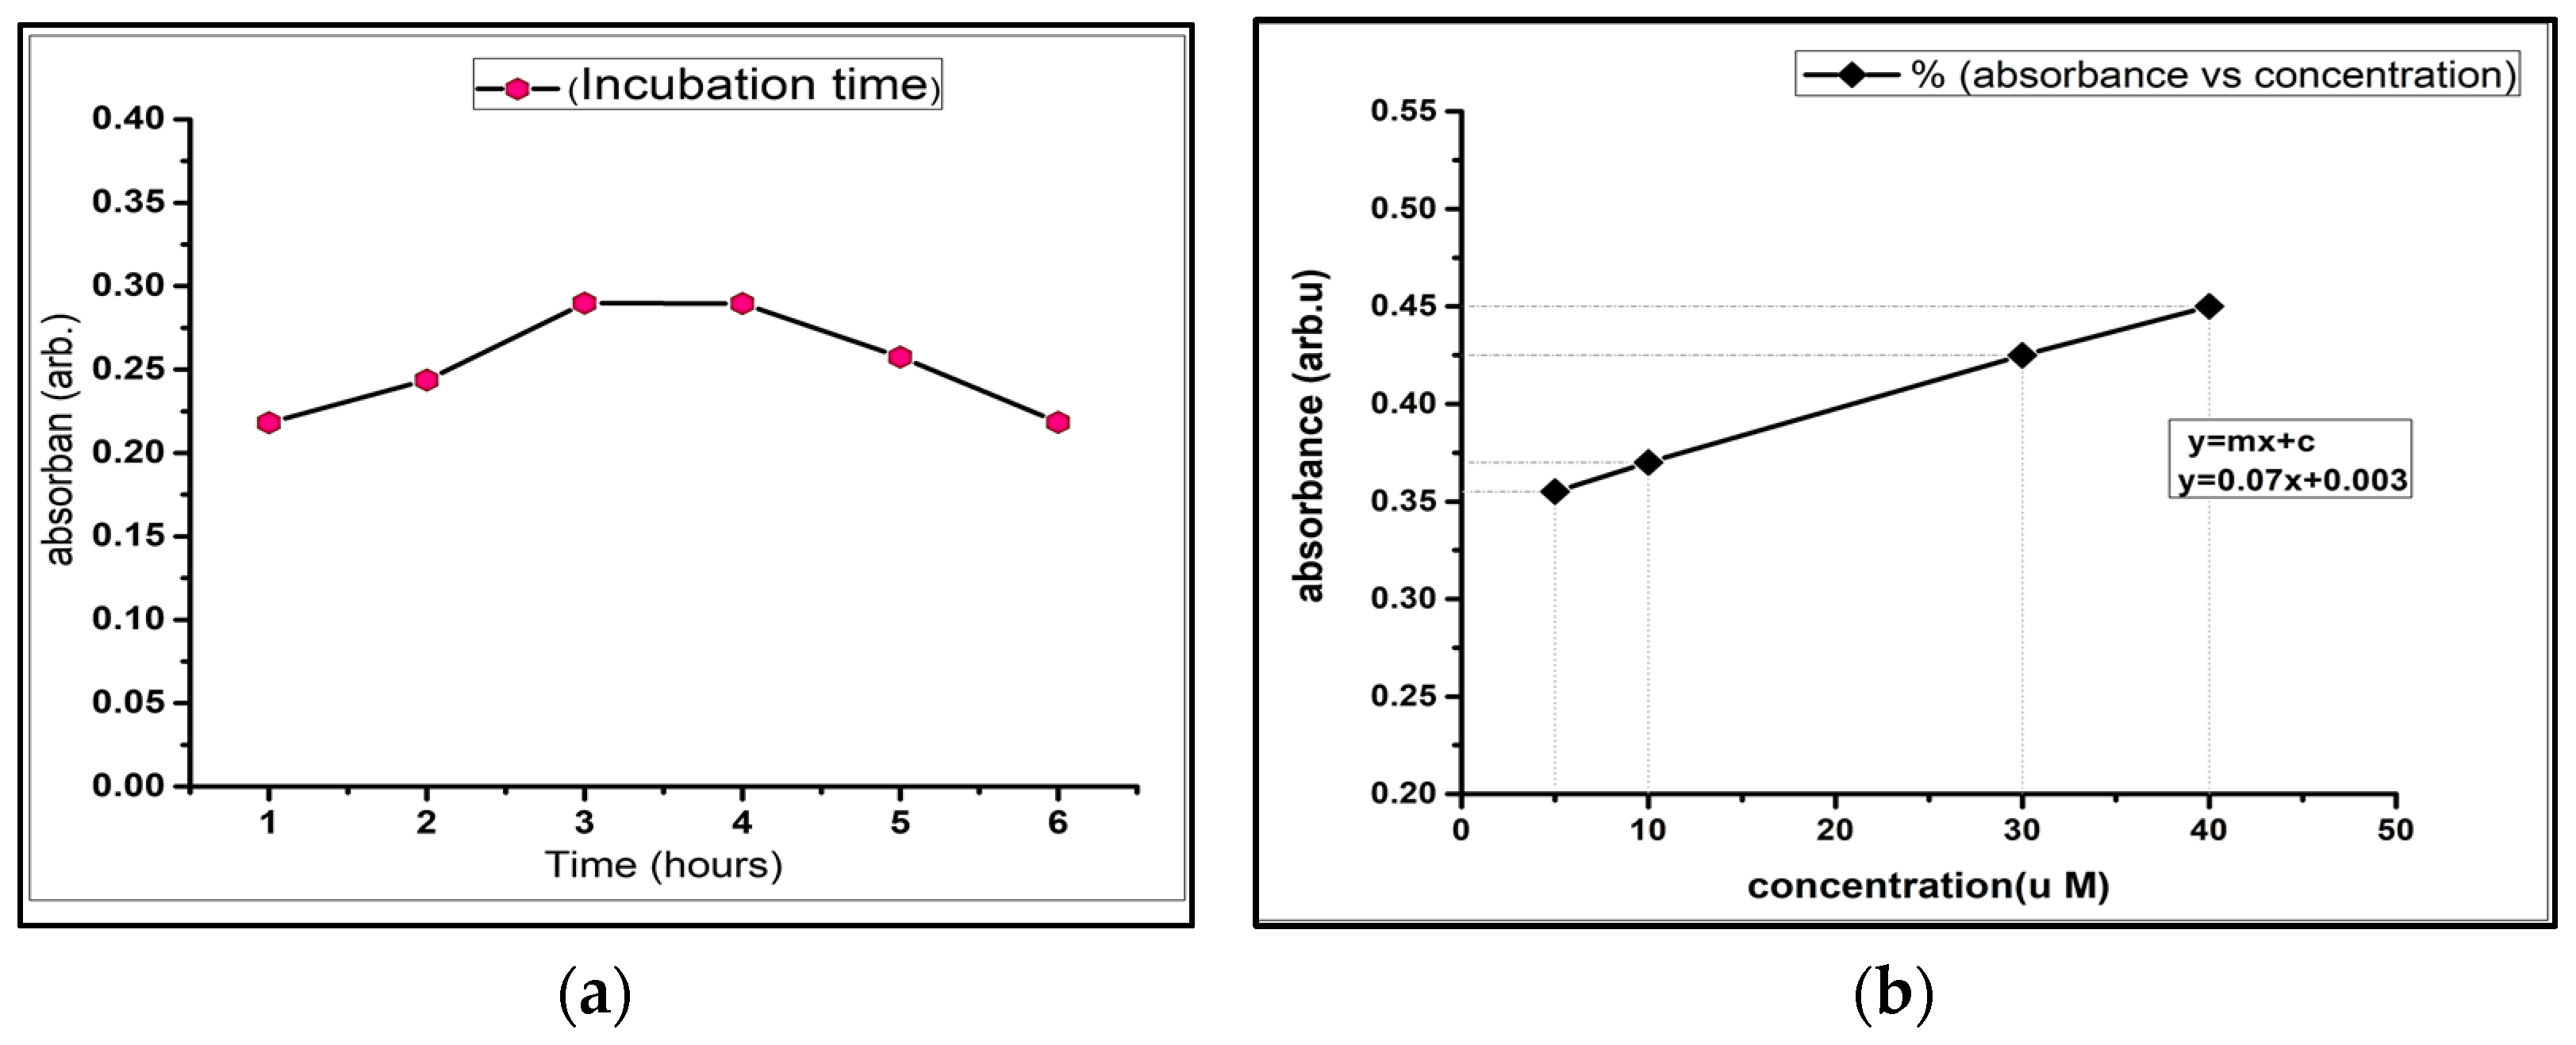
To determine the uptake of the PS, a graph was plotted between time and absorbance. The maximum absorbance would show the optimum uptake time of Rh-640 perchlorate. From the graph, the optimum time is with the highest absorbance; in this case, it is 3 to 4 h.
A standard curve would show the relation between absorbance and different concentrations of the PS. The absorbance was plotted on the ordinate and the concentration on the abscissa. The plot was ideal, as it demonstrated a gradual increase in absorbance with concentration.
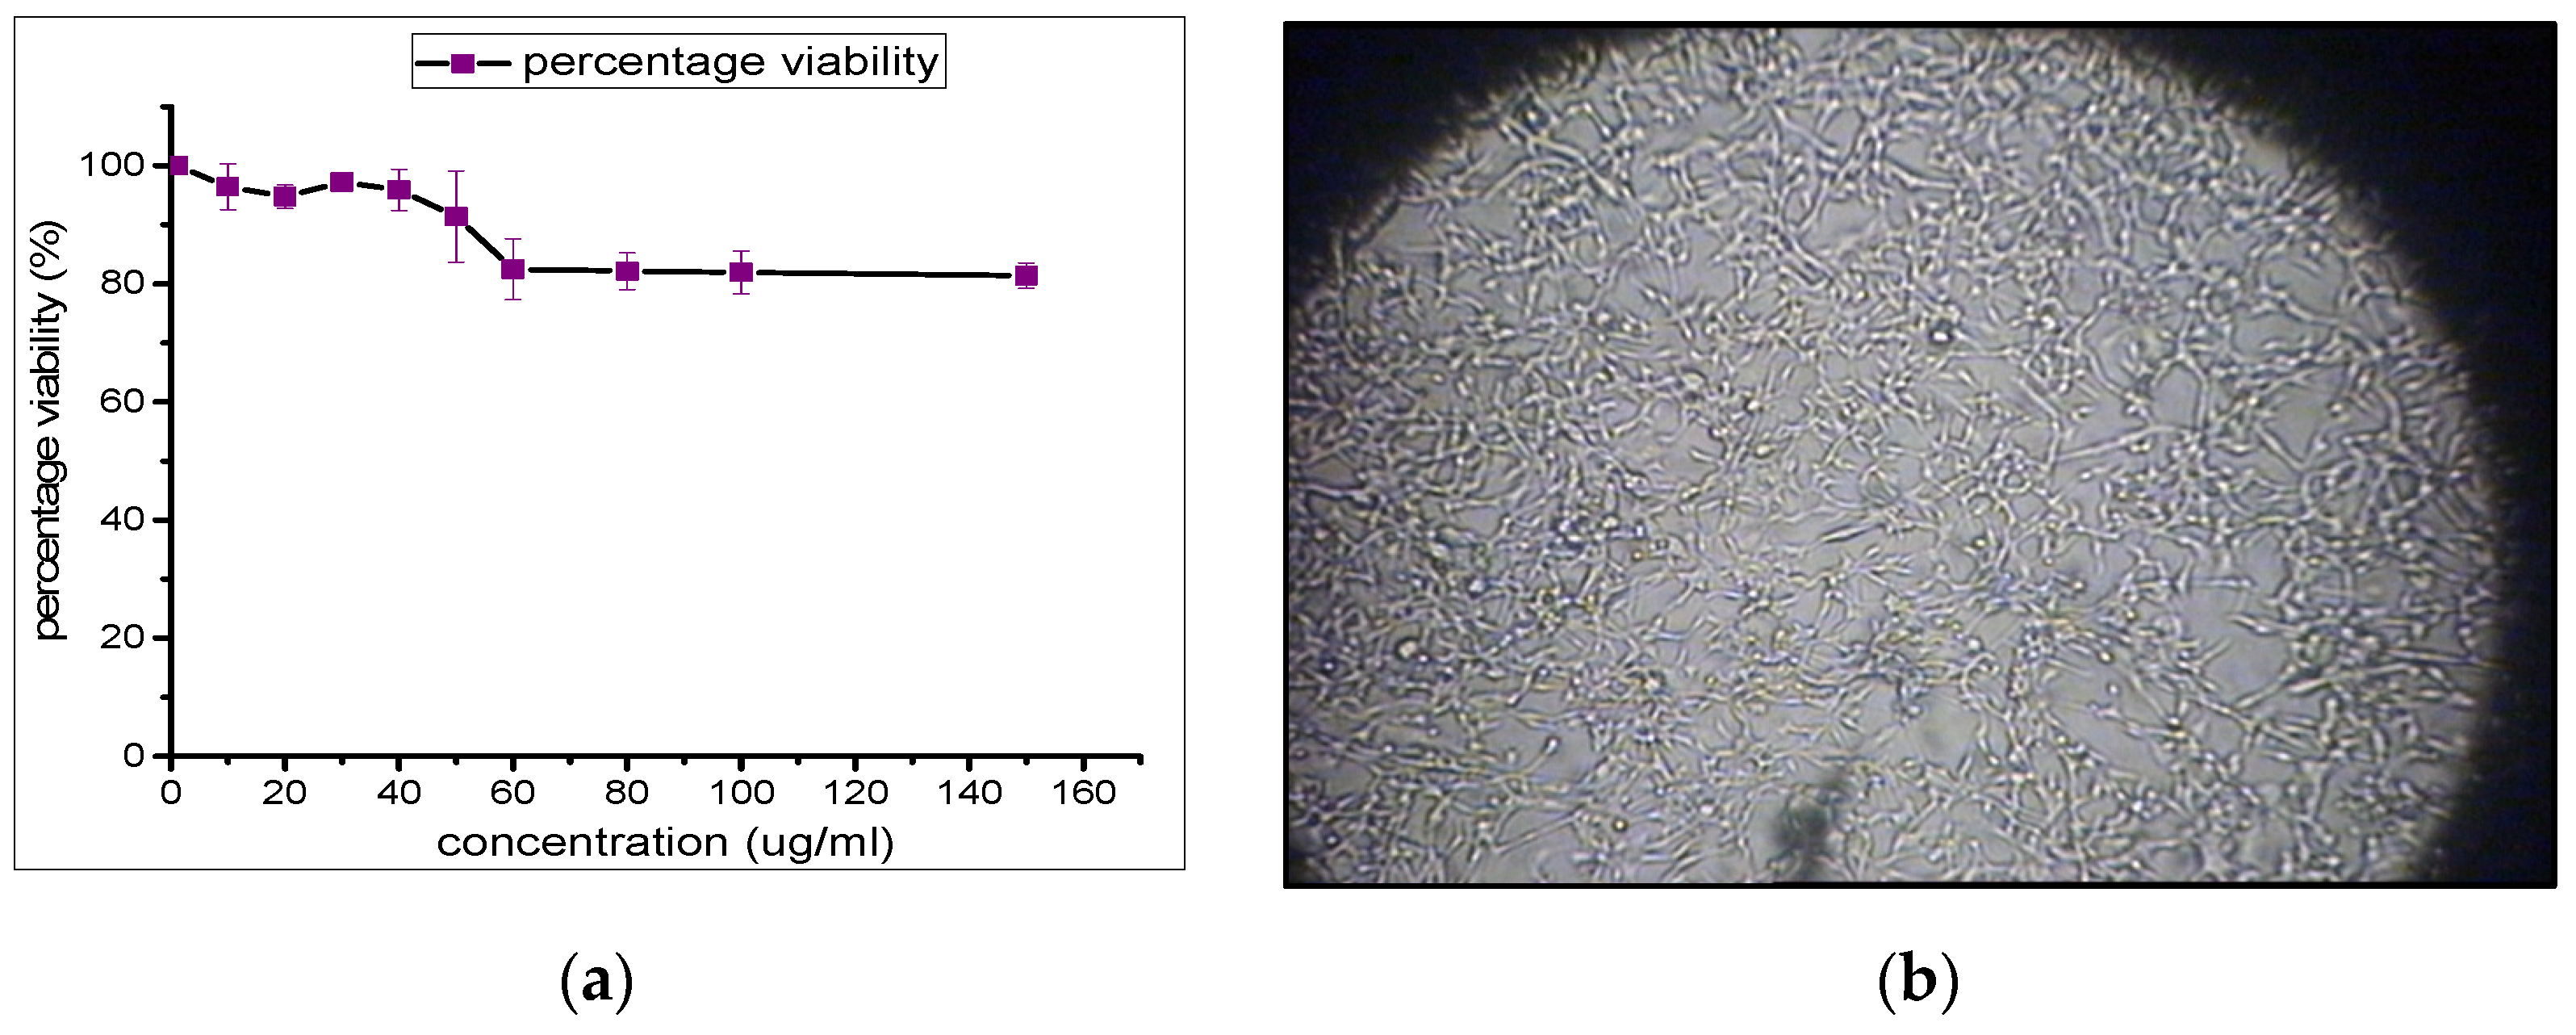
3.3. Cytotoxicity
To analyze the cytotoxic effect, cells were incubated with different µM concentrations for optimum hours at 37 °C. The amount of damage caused to RD cancer by the PS without light irradiation was investigated from the above results. The percentage of viability in the cell population was found using the following formula:
where Mean
Abt is the mean absorbance in the treated cells and Mean
Abcon is the mean absorbance of the controlled cells which are not exposed to light.
4. Discussion
The spectra in
Figure 1 show that the PS shows an absorption maximum in the yellow-red wavelength range. The light absorption capability of myoglobin and hemoglobin proteins present in tissues decreases above 600 nm [
5]. This raises the possibility that the PS and cancer cells will utilize more irradiated light than other blood components. For an optimal penetration of light in tissue, the absorption window of the PS should be within the 600–800 nm range. The PS with absorption λ > 600 nm preserves its ability to damage mitochondria in cancer cells. The PS will produce high penetration into tissues in the wavelength range λ > 600 nm (630 nm). As explained above, for PDT incorporating Rh-640 as a PS, 630 nm may prove to be an effective wavelength of light for targeting mitochondria in RD cells [
5,
6]. These spectra report the ability of the PS to absorb light in a therapeutic window for employment in PDT.
In
Figure 2, a higher absorption of the PS at an optimal uptake time may be ascribed to a higher trans-membrane potential in RD cells. This may increase the mitochondrial membrane permeability resulting in apoptosis and decrease the viability [
7,
8]. The standard curve depicts that the absorbance increases with concentration.
As shown in
Figure 3, after a certain concentration, cytotoxicity decreases because the cells are saturated with the PS. The condition of RD cells after dark cytotoxicity is demonstrated above. The type of cell line, dose of the PS, and uptake time affect the viability of cells [
9]. Cells are elongated and continue growing. This means that the PS caused no damage in the absence of light. A summary of various optimized parameters is given in
Table 1 below.
5. Conclusions
The research in this paper shows that the preliminary absorption spectra of Rh-640 perchlorate are suitable for laser light absorption. The compatibility of absorption for PDT lies in the yellow-red range. If Rh-640 perchlorate is administered individually, it cannot cause enough of a toxic response to RD cancer cells. A concentration of 50 µM with 92% of cell viability may be considered the optimum cytotoxic value. Thus, it has no apparent influence on the proliferation of RD cells in the absence of light.
Author Contributions
For the aforementioned research, the methodology was performed by M.Y. The draft editing, review, and formal analysis were performed by A.K., H.U. and T.G., respectively. All authors have read and agreed to the published version of the manuscript.
Funding
This research received no external funding.
Institutional Review Board Statement
Not applicable.
Informed Consent Statement
Not applicable.
Data Availability Statement
Data are contained within the article.
Acknowledgments
We are pleased to acknowledge the School of Chemicals and Materials Engineering, NUST, Islamabad, Pakistan for providing a platform for sharing research. We also acknowledge PIEAS for technical support during the experimental work.
Conflicts of Interest
The authors declare no conflicts of interest.
References
- Cancer.Net. How Cancer Is Treated? Available online: https://www.cancer.net/navigating-cancer-care/how-cancer-treated (accessed on 14 September 2023).
- DeVita, V.T., Jr.; Chu, E. A history of cancer chemotherapy. Cancer Res. 2008, 68, 8643–8653. [Google Scholar] [CrossRef] [PubMed]
- Wilson, B.C. Photodynamic therapy for cancer: Principles. Can. J. Gastroenterol. 2002, 16, 393–396. [Google Scholar] [CrossRef] [PubMed]
- Manda, G.; Hinescu, M.E. Emerging Therapeutic Targets in Oncologic Photodynamic Therapy. Curr. Pharm. Des. 2018, 24, 5268–5295. [Google Scholar] [CrossRef] [PubMed]
- Lovell, J.F.; Liu, T.W.B. Activatable Photosensitizers for Imaging and Therapy. Chem. Rev. 2010, 110, 2839–2857. [Google Scholar] [CrossRef] [PubMed]
- Davies, K.S.; Linder, M.K. Extended rhodamine photosensitizers for photodynamic therapy of cancer cells. Bioorganic Med. Chem. 2016, 24, 3908–3917. [Google Scholar] [CrossRef] [PubMed]
- Don, A.S.; Hogg, P.J. Mitochondria as cancer drug targets. Trends Mol. Med. 2004, 10, 372–378. [Google Scholar] [CrossRef] [PubMed]
- Waterhouse, N.; Goldstein, J. Cytochrome c maintains mitochondrial transmembrane potential and ATP generation after outer mitochondrial membrane permeabilization during the apoptotic process. J. Cell Biol. 2001, 153, 319–328. [Google Scholar] [CrossRef] [PubMed]
- Powers, S.K.; Pribil, S. Laser photochemotherapy of rhodamine-123 sensitized human glioma cells in vitro. J. Neurosurg. 1986, 64, 918–923. [Google Scholar] [CrossRef] [PubMed]
| Disclaimer/Publisher’s Note: The statements, opinions and data contained in all publications are solely those of the individual author(s) and contributor(s) and not of MDPI and/or the editor(s). MDPI and/or the editor(s) disclaim responsibility for any injury to people or property resulting from any ideas, methods, instructions or products referred to in the content. |
© 2024 by the authors. Licensee MDPI, Basel, Switzerland. This article is an open access article distributed under the terms and conditions of the Creative Commons Attribution (CC BY) license (https://creativecommons.org/licenses/by/4.0/).


