Reduction of Heavy Hydrocarbons from Oilfield Produced Water


Department of Chemistry, University of Mining and Geology “St. Ivan Rilski”, 1700 Sofia, Bulgaria
*
Author to whom correspondence should be addressed.
Pollutants 2022, 2(2), 234-251; https://doi.org/10.3390/pollutants2020016
Submission received: 20 November 2021
/
Revised: 6 April 2022
/
Accepted: 12 April 2022
/
Published: 7 May 2022
Abstract
:This paper presents attempts to reduce the concentration of organic pollutants in oilfield produced wastewater before its discharge into natural water bodies or reinjection into the wells. The contaminant content was significantly decreased by wastewater treatment, based on solid phase adsorption, photocatalytic degradation of organic molecules and chemical oxidation of oily compounds. The study was conducted with real wastewater, which is in practice released in the environment. The produced water samples, taken from four sampling points in the oilfield site, were analyzed for physicochemical (temperature, redox potential (Eh), conductivity, pH, dissolved oxygen) and specific (chemical oxygen demand (COD), total oily hydrocarbons (TOH), phenols) parameters, cations (Ca2+, Mg2+, Na+, K+) and anions (Cl−, HCO3−, SO42−, S2−), in order to determine the initial water status. The organic contaminants in oilfield produced water showed COD of 39–58 mg/L, TOH of 152–363 mg/L and phenols of 0.07–0.21 mg/L. The TOH was chosen as a suitable parameter for the evaluation of the treatment method efficiency. The adsorption on activated charcoal decreased the TOH levels up to 52 mg/L, which corresponds to 85% removal of oily compounds. Chemical oxidation, carried out with Ca(ClO)2 in a concentration of 400 mg/L for 1 h at room temperature, showed TOH removal in the range of 80–94% for different wastewater samples. The use of 300 mg/L TiO2 or ZnO under UV irradiation for 12 h led to TOH removal of 25–78% and 82–92%, respectively. Both photocatalysts were characterized by using X-ray diffraction, reflectance UV-vis spectroscopy and scanning electron microscopy. The crystal forms anatase and wurtzite for TiO2 and ZnO, respectively, were found. The estimated band gap of 3.48 eV for direct transition in TiO2 and 3.25 eV for ZnO agrees well with that reported in the literature. Higher photodegradation of organic compounds was observed for ZnO, indicating that it absorbed more light photons than TiO2 did. A mechanism for photocatalytic degradation over a more efficient photocatalyst, ZnO, was proposed based on the GC-MS analysis of raw water and treated effluents produced for 6 and 12 h.
1. Introduction
Nowadays, petroleum products and their derivatives are widely used in everyday life and modern industry. In terms of energy generation, fossil fuels still dominate over renewable sources. Although the share of the latter gradually increases, the production of crude oil, natural gas and coal remains an intensive process and a crucial economic factor [1].
During crude oil exploration, production and processing, the main waste stream is the produced water, which must meet the quality requirements predefined by legislation to be discharged in the environment or to be reused [2]. The composition of oilfield produced water varies in a wide concentration range of dissolved and dispersed hydrocarbons, carboxylic acids, phenols, aromatic and polyaromatic compounds as well as inorganic matter such as minerals, gases, metal ions and anions of inorganic acids [3,4,5]. The type and amount of constituents in produced water depend on the geological age and location, field position, type of production wells, chemicals used for drilling, etc. [6]. Various chemical compounds in produced water are potentially toxic to marine organisms and the environment, therefore, effective treatment of produced water is needed prior to its disposal into natural water bodies.
Due to the complex physicochemical characteristics of produced water, the treatment methods must be evaluated in advance in order to ensure effective reduction of various contaminants [7,8]. Different approaches involving physical, chemical and biological methods as standalone or combined applications have been used to improve the quality of oilfield produced water [9,10]. A combination of Fenton oxidation, settlement, activated carbon adsorption and ultrafiltration reduce the COD from 150–170 mg/L to below 50 mg/L for conventional plant-produced water [11].
Generally, the upcoming production fluid consists of an oil–water emulsion and suspended solids that are separated by physical techniques such as gravity separation, flocculation and coagulation. Flotation, electro-coalescence, biological and membrane processes are applied for the removal of dissolved and dispersed compounds [5,12,13,14]. The further produced water treatment by means of advanced oxidation processes aims to reduce the concentration of dissolved organic compounds through their mineralization to harmless final products CO2 and H2O. One possible solution is the implementation of chemical oxidation that uses oxidizing agent such as ozone [13,15], hydrogen peroxide [16,17] and hypochlorite to cause oxidation of organic contaminants [18]. Chemical oxidation of hydrocarbons in gas-field-produced water by three oxidants (Ca(ClO)2, O3 and H2O2) demonstrates different levels of reduction of chemical oxygen demand (COD). The highest elimination of organics is achieved by calcium hypochlorite, as it is a reagent with strong oxidizing ability [18]. However, a drawback of hypochlorite treatment is the high concentration of residual active chlorine in treated water that may form chlorinated byproducts like trihalomethanes, haloacetic acids, haloacetonitriles, haloketones, etc. [19]. When the effluents are discharged in the environment, such chloro-substituted compounds might have a toxic effect on aquatic organisms. These disadvantages of chemical oxidation could be overcome by using photocatalysis, which is another advanced oxidation method, that allows degradation of persistent organic compounds like aromatic and polyaromatic compounds, heavy molecular aliphatic hydrocarbons, etc., and leads to the formation of less toxic intermediates. In the course of photocatalysis, the highly reactive hydroxyl and superoxide radicals that are generated in produced water in the presence of semiconductor metal oxides under light irradiation are capable of inducing the complete oxidation of organic pollutants in wastewaters [20]. Many studies have been carried out to evaluate the effectiveness of photocatalytic treatment of oilfield produced water [20,21,22,23,24,25].
An average of 80% removal of phenol, oil and grease from refinery wastewater is achieved through photocatalytic degradation under optimized conditions (aeration, TiO2 dose 8 g/L and treatment time of 90 min) [26].
The results for the degradation of oil pollutants in real refinery wastewater with TiO2, ZnO and H2O2 have shown that TiO2 is more effective than ZnO and H2O2 [27,28]. Dionysiou et al. found that adding H2O2 in small concentrations to TiO2 significantly increases the reaction rate, while at higher concentrations, H2O2 has an inhibiting effect on the photocatalytic decomposition of 4-chlorobenzoic acid [29]. Hassan et al. reported photocatalytic degradation of oily wastewater with TiO2, ZnO and Al2O3 under solar energy irradiation [30]. Enhanced photocatalytic activity is found for TiO2 loaded on bentonite in the degradation of produced water [31]. A hybrid of ZnO-TiO2 supported on clinoptilolite demonstrates higher activity towards phenol degradation in wastewater than the monophase metal oxide/clinoptilolite composites do [32]. Other authors also confirm that the combined photocatalysts ZnO and TiO2 show high performance in petroleum wastewater treatment under sunlight and aeration [33]. ZnO nanoparticles irradiated with UV light were successfully used as a photocatalyst in oilfield produced water [34]. ZnO nanorods grown on a glass substrate were tested in the visible light photocatalytic decomposition of benzene, toluene, ethylbenzene and xylene. Intermediate compounds as well as the release of CO2 as a final product of mineralization were proven by GC-MS and HPLC [35]. A conjugation of ZnO with other metal oxides, for example ZnO/Fe2O3, allows for the photocatalytic activity under solar radiation, and it was employed for phenol degradation [36].
Adsorption is a commonly used technique for the treatment of oilfield produced water [37,38,39]. Activated charcoal is a well-recognized and conventionally used sorbent with very good properties due to its hydrophobicity and chemical stability [40,41]. By exploring and applying advanced forms of carbon such as carbon nanotubes and nanofibers, graphene oxide, carbon aerogel [42,43], etc., the efficiency of the sorption process can be improved through enhancing the surface area, porosity and density of the materials. Activated carbon is often used in the pretreatment stage of wastewater remediation alone or as a part of integrated adsorbent prior to membrane separation of produced water [44,45]. Due to its capability to adsorb organic molecules, we chose to examine the solid phase adsorption of long-chain hydrocarbons from heavy oil-produced water and then to compare the results with those from advanced oxidation methods.
In this work, we report on photocatalysis with TiO2 and ZnO, chemical oxidation with Ca(ClO)2 and activated charcoal adsorption for real oilfield produced water remediation. In order to evaluate the efficiency of each process, the change in concentration of tetrachloromethane-extractable organics against the time was monitored. The chemical compounds in raw produced water were firstly identified by GC-MS analysis, and then their degradation by photocatalysis with ZnO was examined.
2. Materials and Methods
2.1. Sampling
Oilfield produced wastewater samples were collected from an oilfield site in Bulgaria, where four different discharge points were chosen. The sampling was done from continuously flowing water coming from reservoirs. The samples from these four points are denoted herein as sample I–IV. For each wastewater sample (I–IV) the aliquots were taken according to the type of analysis and treatment. The fresh samples were used to determine the physicochemical parameters of produced water on site. To determine the amount of dissolved oxygen, separate samples were picked up and were fixed with a MnSO4 solution and an alkaline solution of KI, then, the bottles were sealed and transported to the laboratory under refrigerated conditions in the dark. For oily hydrocarbons and phenols, the water samples were collected in 1-liter amber glass bottles and pretreated with H2SO4. For other macro- and meso-components determination and treatment tests, the water samples were preserved according to the standard operational procedures [46] and were kept at a temperature of 4 °C before analysis. All analyses were carried out in duplicates, and the average values are reported in the tables below.
2.2. Analysis on Site of Fresh Samples
Immediately after sampling, several parameters were measured by electrometric methods using a WTW Multi 340i/SET device; they were as follows: temperature, pH, Eh, specific conductance, index of water saturation with respect to CaCO3 (ΔpH). The data are summarized in Table 1.
2.3. Laboratory Analysis of Chemical Composition
2.3.1. Determining Macro- and Meso-components
The dissolved oxygen was determined by iodometric titration according to the Winkler method. The hardness of water, presented by calcium and magnesium ion concentration, was found by titration with EDTA. The chloride ions concentration was determined by titration with a standard solution of AgNO3 and K2CrO4 as an indicator. The hydrogencarbonate ion was titrated against hydrochloric acid in the presence of a methyl orange indicator. The concentration of sulfate ions was determined by the turbidimetric method. The concentration of Na+ and K+ was determined by the Inductively Coupled Plasma Atomic Emission Spectroscopy (ICP-AES) method. The sulfide ion concentration was determined by the spectrophotometric method. S2− and H2S reacted with dimethyl paraphenylenediamine in an acidic medium to form methylene blue, and its absorption at 664 nm was measured. The described procedures followed the standards for macro- and meso-components determination [46].
2.3.2. Determining Specific Parameters
The concentration of total oily hydrocarbons (TOH) was determined by the spectrophotometric method. First, the extraction of 0.500 L wastewater with 5 mL CCl4 was carried out, and then the absorption at 265 nm of the organic fraction was measured on a BOECO S-220 UV/VIS spectrophotometer. A calibration curve in the linear range 0.02–0.10 g/L was used for the quantification of the oily hydrocarbons [47].
The phenol concentration was determined spectrophotometrically by using Spectroquant NOVA 60 and the Spectroquant phenol tests. Phenol and its ortho- and meta-substituted compounds reacted with 4-aminoantipyrine in the presence of an oxidizing agent to form a red compound that was determined photometrically. The method is analogous to the EPA 420.1, APHA 5530 C+D and ASTM D 1783-01 methods.
The chemical oxygen demand (COD) was determined spectrophotometrically by using a Merck COD cell test. Prior to analysis, the chloride ions content of the water sample was depleted with sulfuric acid and absorber. The method of chloride depletion corresponds to DIN 38409-41-2. Then, the water sample was oxidized with a hot acidified solution of K2Cr2O7 in the presence of Ag2SO4 as a catalyst in a Spectroquant TR420. The concentration of green Cr3+ ions, produced from reduction of dichromate ions, was determined by measuring its absorption, and thus the COD was estimated on the Spectroquant NOVA 60 instrument. The method corresponds to DIN ISO 15705 and is analogous to the EPA410.4, APHA 5220 D and ASTM D 1252-06 B methods.
The hydrocarbon composition of produced water was determined by gas-chromatography/mass spectrometry (GS-MS) analysis conducted on an Agilent Technologies 7890A device equipped with a 5975C mass detector. A capillary chromatographic column with a length of 30 m, an internal diameter of 0.25 mm and a thickness of polyethylene glycol layer of 0.25 µm was used. The applied temperature on the injector was 280 °C; the column was programmed for heating from 100 °C (2 min) to 250 °C (10 min). The duration of the analysis was 27 min. Helium was used as a gas carrier with a velocity of 1.5 mL/min. The injected sample volume was 2 µL. The compounds were identified according to their retention time and based on the mass-spectrometer library (NIST 05a). Prior to the chromatographic measurements, the organic compounds were extracted with CCl4 from the raw produced water and from the treated waters.
2.4. Oilfield Produced Water Treatment
2.4.1. Adsorption
Commercial activated charcoal was purchased from two companies (Valerus, Ltd., Sofia, Bulgaria and Sigma-Aldrich, Merck KGaA, Darmstadt, Germany). These two types of charcoal are denoted here as Charcoal 1 and Charcoal 2, respectively. According to the product specifications, the BET surface was 800–1000 m2/g for Charcoal 1 and 600–800 m2/g for Charcoal 2, and their pH was in the range of 8.5–8.8.
The removal of organic pollutants was carried out by treating produced water with activated charcoal in the ratio of solid-to-liquid of 1:100 for 4 h at room temperature and under stirring with a rotation speed of 100 rpm. After that, the sorbent was separated by filtration, and the treated water was extracted with CCl4 for TOH analysis.
2.4.2. Chemical Oxidation
Calcium hypochlorite (Ca(ClO)2) was purchased from Teocom, Ltd., Sofia, Bulgaria and was used without further purification. The optimized reaction conditions for the chemical oxidation were taken from our previous study on the removal of heavy oily compounds by oxidation with Ca(ClO)2 [48]. Four hundred milligrams of calcium hypochlorite, Ca(ClO)2, was added to 1000 mL of produced water, and the mixture was stirred for 60 min. After that, the solid was separated by filtration, and the filtrate was extracted with CCl4 to determine oily hydrocarbons spectrophotometrically in the UV range.
All experiments were performed in duplicate, and the average values of the results are reported.
In all cases, the removal of total oily hydrocarbons (TOH) was calculated by the formula:
where Ci is the concentration of the oily hydrocarbons at a certain time, and Co is the initial concentration.
2.4.3. Photocatalysis
Commercially available ZnO and TiO2 from Reachim, Chimspectar, Sofia, Bulgariaand Riedel-de-Haen, Seelze, Germany were used as photocatalysts. Three hundred milligrams of photocatalyst was added to 1000 mL of produced water, and the reaction mixture was kept in the dark for 30 min under constant stirring. Then, it was irradiated with UV light for 3, 6 and 12 h, in order to find the optimal time for photocatalytic treatment. An 18 W UV lamp (Phillips) with a wavelength of 365 nm was used. After each test, the catalyst was removed, and a portion of 500 mL of treated water was extracted with CCl4 for determining the oily hydrocarbons.
2.5. Materials’ Characterization
The morphology of activated charcoal, TiO2 and ZnO was studied by scanning electron microscopy (SEM). The SEM images were obtained on a JEOL 6390 scanning electron microscope (JEOL, Tokyo, Japan). The XRD patterns of TiO2 and ZnO were obtained on a Bruker D8 Advance powder diffractometer (Bruker, Karlsruhe, Germany) with Cu Kα radiation and a LynxEye detector (Bruker, Karlsruhe, Germany). The diffuse-reflectance UV-vis spectra of TiO2 and ZnO were taken on an Evolution 300 UV-Vis Spectrophotometer (Thermo Fisher Scientific, Waltham, MA, USA). Spectralon was used for the background measurements.
3. Results and Discussion
3.1. Produced Water Characterization
The physicochemical parameters such as temperature, pH, ΔpH value, Eh value and specific conductivity of produced water are presented in Table 1. As can be seen, the pH was practically neutral, the specific conductivity was close to that of brine water, the ΔpH value indicated that water was close to equilibrium with respect to CaCO3, the measured Eh values and very low concentrations of dissolved oxygen were indicative for anaerobic conditions in all samples.
The concentration of macro- and meso-components of the studied samples are listed in Table 2. Among cations and anions, Na+ and Cl− ions, respectively, had the highest concentrations, which is typical for the ground waters in the location, since it is influenced by sea water intrusion. Similarly, as it could be expected, the produced water was hard, in accordance with high concentrations of Ca2+ and Mg2+ ions.
Specific parameters of oilfield produced water such as chemical oxygen demand (COD), total oily hydrocarbons (TOH) and phenols are given in Table 3. The phenols are aromatic compounds well-soluble in water and are well-known carcinogens. Their measured values are below the threshold of 1.0 mg/L given in the regulations for discharge of oilfield produced water into natural water bodies [49]. The COD is the amount of oxygen required to oxidize the organic compounds in water, thus it refers to the organic pollutants which can be oxidized during the analysis. The observed COD values are close to the required discharge limit of 50 mg/L [11]. The organic compounds in produced water identified by the GS-MS analysis were mainly high-molecular saturated hydrocarbons (C12-C22) with a straight and branched carbon chain that are typical for heavy crude oil (see Section 3.2.3 [12,50]. Such molecules require hard conditions (temperature, pressure and oxidant) to break C-C and/or C-H bonds and to form low-molecular fragments or to be oxidized to CO2 and H2O. Therefore, in this study, heavy hydrocarbons were subject of photocatalytic degradation and chemical oxidation on one side, and the total amount of oily hydrocarbons was chosen as an indicator for the water treatment changes on the other side. In order to characterize quantitatively the total oily hydrocarbons, the water samples were extracted with CCl4, which is a solvent capable of dissolving nonpolar and long-chain hydrocarbons, and then their concentration was determined based on the absorption of UV light. Thus, the oily hydrocarbons were determined by the spectrophotometric method after extraction with CCl4. This parameter gives information on all extractable organic pollutants, including high-molecular hydrocarbons, which are dispersed in produced water as tiny droplets and are hardly oxidizable. It was found that TOH was a suitable parameter for the assessment of the effectiveness of treatment methods in this study.
3.2. Produced Water Treatment
The results from produced water treatment tests through adsorption, photocatalysis and chemical oxidation are presented in Table 4. Each sample I–IV was treated separately by each technique, and TOH removal was evaluated.
3.2.1. Adsorption on Activated Charcoal
A schematic diagram for adsorption treatment is presented in Scheme 1.
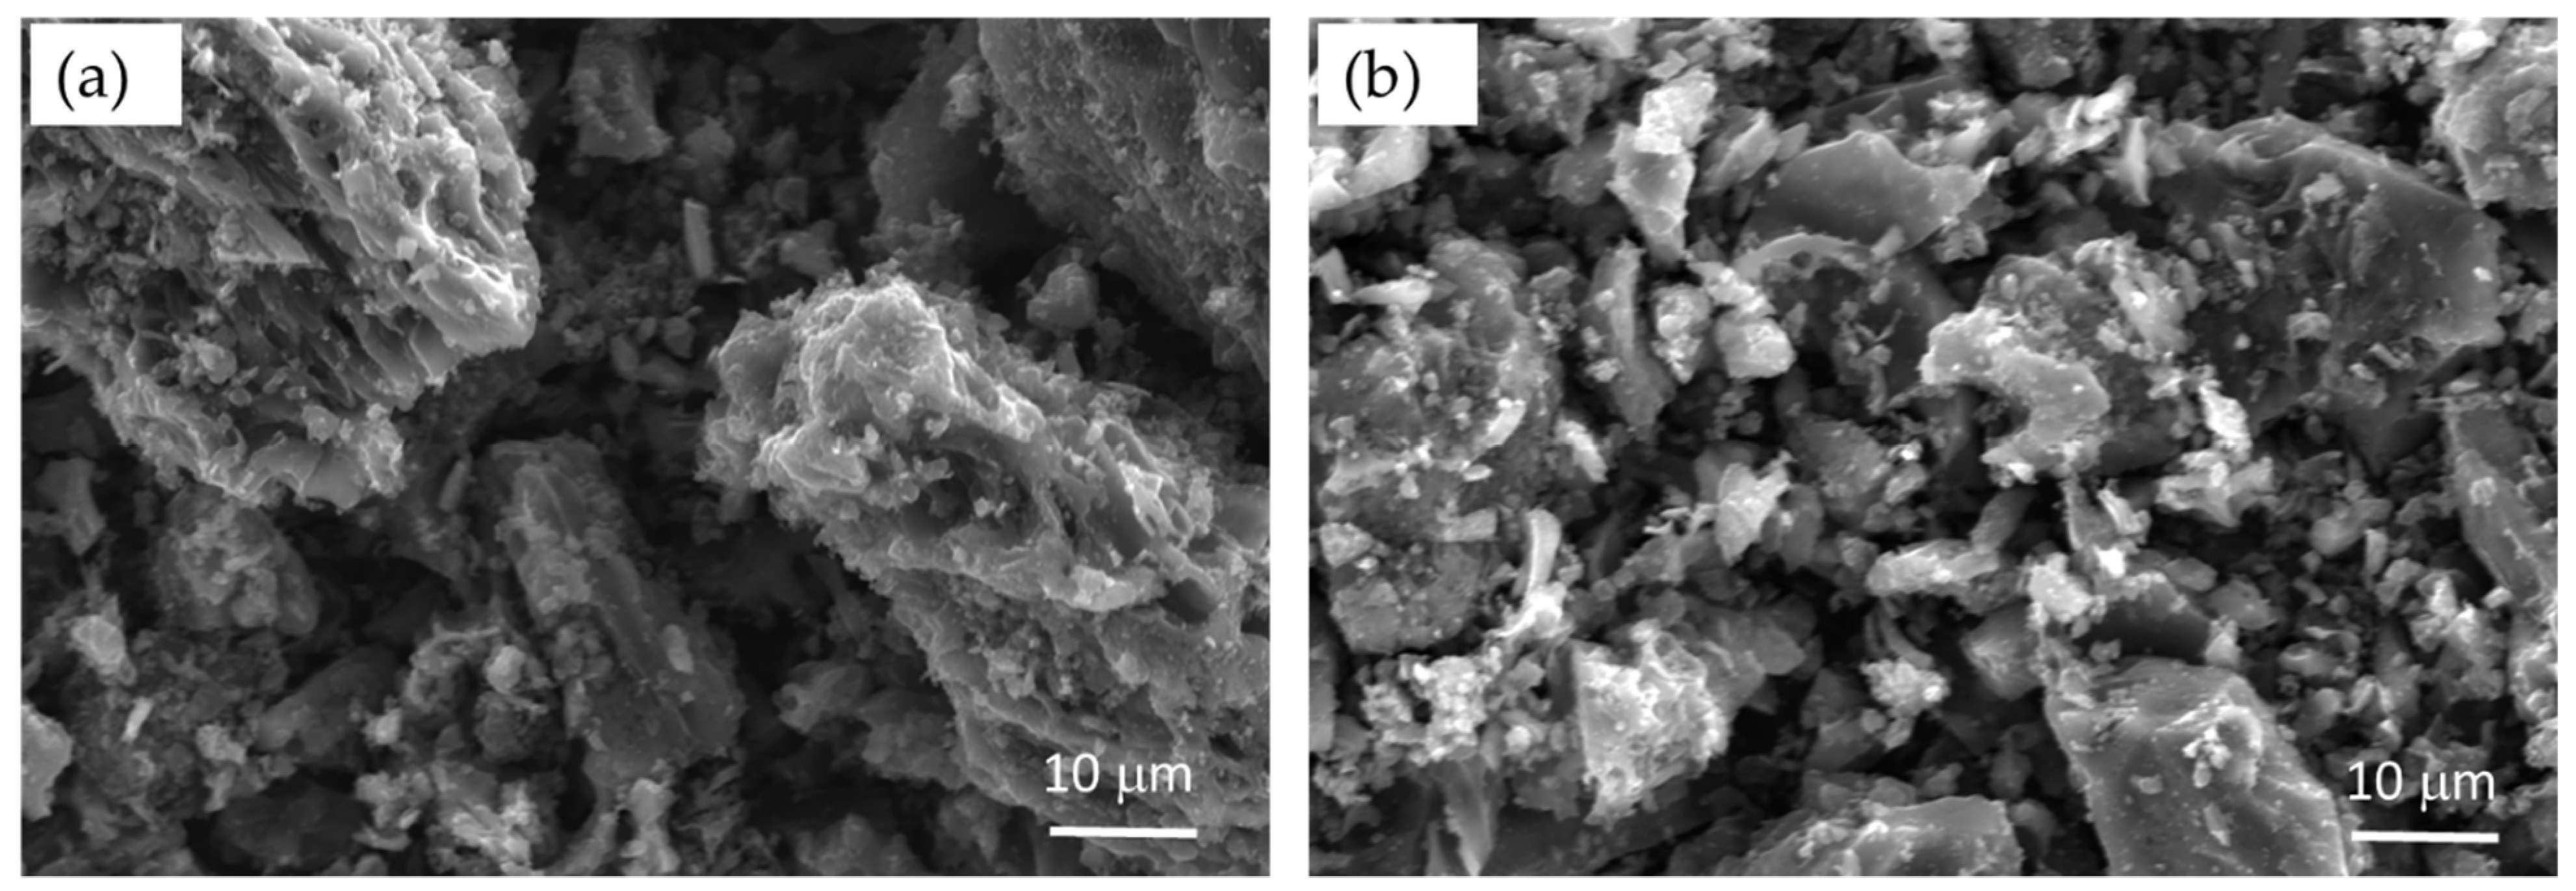
The adsorption efficiency was determined for the two adsorbents by contacting water samples with different initial TOH contents using an adsorbent dose of 10 g/L. The results obtained are in the wide removal range from 17 to 85%. Okiel et al. reported 93.54% oil removal by adsorption on 1 g powdered activated carbon in 200 mL of oil–water emulsion after 4 h of stirring. They also found a concentration dependence of adsorption, indicating that when the initial oil concentration increased (from 836 to 1613 mg/L), oil removal decreased (from 82.6 to 72.5%) [37]. In this study, the initial TOH concentrations were much lower than in [37], and the uncertainty of the results after treatment increased, thus, no well-defined trend in the experimental data of the samples was observed. The chemical composition (macrocomponents and hydrocarbons) may also affect the effectiveness of the adsorption process. The highest efficiency of adsorption on activated charcoal (85% and 83% for Charcoal 1 and Charcoal 2, respectively) was observed for sample III that possessed the highest pH value (pH 7.57). El-Naas et al. found enhanced COD removal for pH above 7.5 [38]. We suppose that the process is facilitated if the pH value of produced water subjected to the treatment is near to the pH of the used activated carbon. The low adsorption for sample II might be explained by the content of well-dispersed and well-dissolved hydrocarbons that were not adsorbed on the carbon surface efficiently and remained in the liquid phase. This hypothesis is supported by the higher removal degree for sample II (85% and 94%) through the photocatalysis with ZnO and the oxidation with Ca(ClO)2, respectively, indicating that the chemical and photocatalytic oxidation were favorable treatment processes for that water sample. A comparison between both types of activated charcoal shows that Charcoal 1 demonstrated better performance in accordance with its higher specific surface area (BET 800–1000 m2/g for Charcoal 1 and 600–800 m2/g for Charcoal 2). Additionally, the morphology of Charcoal 1 and Charcoal 2 was studied. The SEM images of both adsorbents are shown in Figure 1. Charcoal 1 had a layer structure and polydispersed particles (Figure 1a), and Charcoal 2 showed irregular shape and various sizes of particles (Figure 1b).
3.2.2. Chemical Oxidation with Ca(ClO)2
A schematic diagram for chemical oxidation of produced water is presented in Scheme 2.
Ca(ClO)2 is a widely used for disinfection and cleaning [51]. Its effectiveness depends on the concentration and pH of solution. Its dissociation in water gives a hypochlorite ion (ClO−), which further undergoes protonation to weak hypochlorous acid, HOCl. Both HOCl and ClO− are strong oxidazing agents that react with a wide variety of biological molecules and organic compounds [52]. In aqueous solution, chlorine exists in three forms, Cl2, HOCl and ClO−, which are known as free chlorine. The equilibrium between these forms strongly depends on the pH of the solution. At pH 8.5–10, deprotonated ion ClO− exists, when pH is around 4–6, HOCl dominates, and at pH less than 4, the equilibrium is shifted towards Cl2 (Scheme 2). That is why, when acidified or heated, hypochlorite solutions release chlorine gas. In our experiments, the natural pH of produced water (pH 7.0–8.0) was used. The TOH removal in the range of 80–94% for samples I–IV was achieved by applying Ca(ClO)2 at a concentration of 400 mg/L for 1 h at room temperature. For comparison, hydrocarbon removal from gas-field wastewater by oxidation with hydrogen peroxide, ozone and calcium hypochlorite showed the highest COD removal of 36–70% by Ca(ClO)2 [18]. However, residual chlorine in the treated water should be eliminated before any further use of water [18]. Oxidation of textile wastewater by Ca(ClO)2 resulted in decolorization and reduction of COD by more than 90% [53].
Thus, in this study, the chemical oxidation with Ca(ClO)2 gave a high degree of elimination of organics in all samples (I–IV) and it could be considered as a suitable method for produced water treatment. However, some drawbacks should be taken into account, for example, residual free chlorine, some chlorinated byproducts or metals in a high oxidation state may exist in the treated water.
3.2.3. Photocatalysis with TiO2 and ZnO
Characterization of Photocatalysts
The TiO2 and ZnO materials used in this study were characterized by XRD, SEM and Reflectance UV-vis spectroscopy.
Figure 2 shows the XRD patterns of TiO2 (Figure 2a) and ZnO (Figure 2b). The peak positions were in good agreement with the anatase phase of TiO2 (PDF 00-001-0562) and hexagonal wurtzite structure of ZnO (PDF 01-089-1397). The average size of the crystallites was determined from XRD patterns by using the Scherrer Equation (1):
where L is the size of the crystallite (nm), K is the shape factor (0.94), λ is the X-ray wavelength (Cu K-α, 0.15418 nm), B is the line broadening at half the maximum intensity (FWHM) in radians, and θ is the Bragg angle [54]. The calculated size of TiO2 and ZnO nanoparticles was 33 and 30 nm, respectively. The SEM images in Figure 3 revealed that TiO2 nanoparticles were spherical (Figure 3a), while ZnO nanoparticles were with plate-like shape and various sizes (Figure 3b).
The diffuse reflectance UV-vis spectra and Tauc’s plot are shown in Figure 4. The band gap energy can be determined by applying the Kubelka–Munk function [55] and Tauc’s Equation (2) [56].
where α is the absorption coeficient, hν is the photon energy, Eg is the band gap, n = 1/2 for direct band gap transition, and A is a constant that is different for different transitions.
The band gap values were evaluated as an intercept over the X-axis of extrapolated tangent to the linear part of the plot, drawn by (αhν)2 against photon energy, hν, as is shown in Figure 4b [57]. The Eg values were estimated to be 3.25 and 3.48 eV for direct transitions of ZnO and TiO2, respectively, which are in good agreement with those reported previously in the literature [58,59,60,61].
Photocatalytic Activity
The photocatalysis of produced water with 300 mg/L TiO2 or ZnO under UV irradiation for 12 h at constant stirring was carried out. The TOH removal was found to be in the range of 25–78% for the photocatalysis with TiO2 and 82–92% for the photocatalysis with ZnO for water samples I–IV. TiO2 is a widely studied photocatalyst for oil and gas wastewater treatment [20,27,45]. Early works of Grzechulska et al. [21] and Bessa et al. [24] showed photocatalysis induced by TiO2 as a promising method for oily wastewater treatment.
The percentage removal of hydrocarbons by photocatalysis in the presence of ZnO under UV irradiation for 12 h varied from 82 to 92% and indicated that this process was effective for the treatment of produced water containing heavy hydrocarbons. Hassan et al. reported 95.2% removal of oily compounds over ZnO photocatalysts under sunlight irradiation for 120 min [30]. Moreover, in another study, a combination of ZnO/TiO2 enhanced the photocatalytic performance to 99.3% of TOC and 76% of COD removal for a reaction time of 170 min [33]. The use of ZnO nanoparticles under UV irradiation allows for complete oil removal from oilfield produced water at pH = 3 in a batch reactor [34].
As can be seen in Table 4, the photocatalytic potency of ZnO overmatched that of TiO2 for all samples under the same experimental conditions. Although many factors such as particle size, surface area, active surface sites and defects can affect the photocatalytic activity of materials, one possible explanation could be the effect of a band gap. As can be seen above, ZnO had a band gap lower (3.25 eV) than that of TiO2 (3.48 eV), thus it could harvest more photons from the UV light with energy 3.40 eV used for irradiation. The larger quantum efficiency of ZnO resulted in more generated electron–hole pairs accounting for more effective photocatalysis [62,63].
The duration of the photocatalytic test with ZnO was investigated for 3, 6 and 12 h, and it was found that the removal gradually increased with the time. The final concentration of oily hydrocarbons from the photocatalytic experiments performed with 12 h UV-light irradiation was determined and is reported in Table 4.
The effluents from the photocatalysis with ZnO for 6 and 12 h were analyzed by the GC-MS method. Their chromatograms are presented in Figure 5. The compounds presented in raw produced water (Figure 5A), in six-hour-treated water (Figure 5B) and in twelve-hour-treated water (Figure 5C) were identified and are listed in Table 5. The intensive peaks in raw produced water were assigned to the alkanes with a straight carbon chain (C13-C22) and the branched C12-C22 alkanes. The structural formulas are shown in Table 5. Intriguingly, new peaks were observed in chromatogram B that corresponded to mainly primary alcohols with straight and branched chains of C11-C17 carbon atoms, as well as to byproducts of secondary alcohols (12’), alkenes (7’and 8’) and aldehydes (13’ and 14’). All these compounds showed the photocatalytic oxidation of alkanes by hydroxyl radicals formed on the ZnO surface. Moreover, there was evidence for the next step in the oxidation of organics, namely from alcohols to aldehydes, as shown by the presence of the couples hexadecan-1-ol (10’), heptadecan-1-ol (11’) and hexadecanal (13’), heptadecanal (14’), respectively. We believe that the further photocatalytic oxidation of organic molecules to final products CO2 and H2O took place, since we observed only weak peaks of residual alkanes in the chromatogram C (peaks 7,8,10,11,14 and 16 in Figure 5).
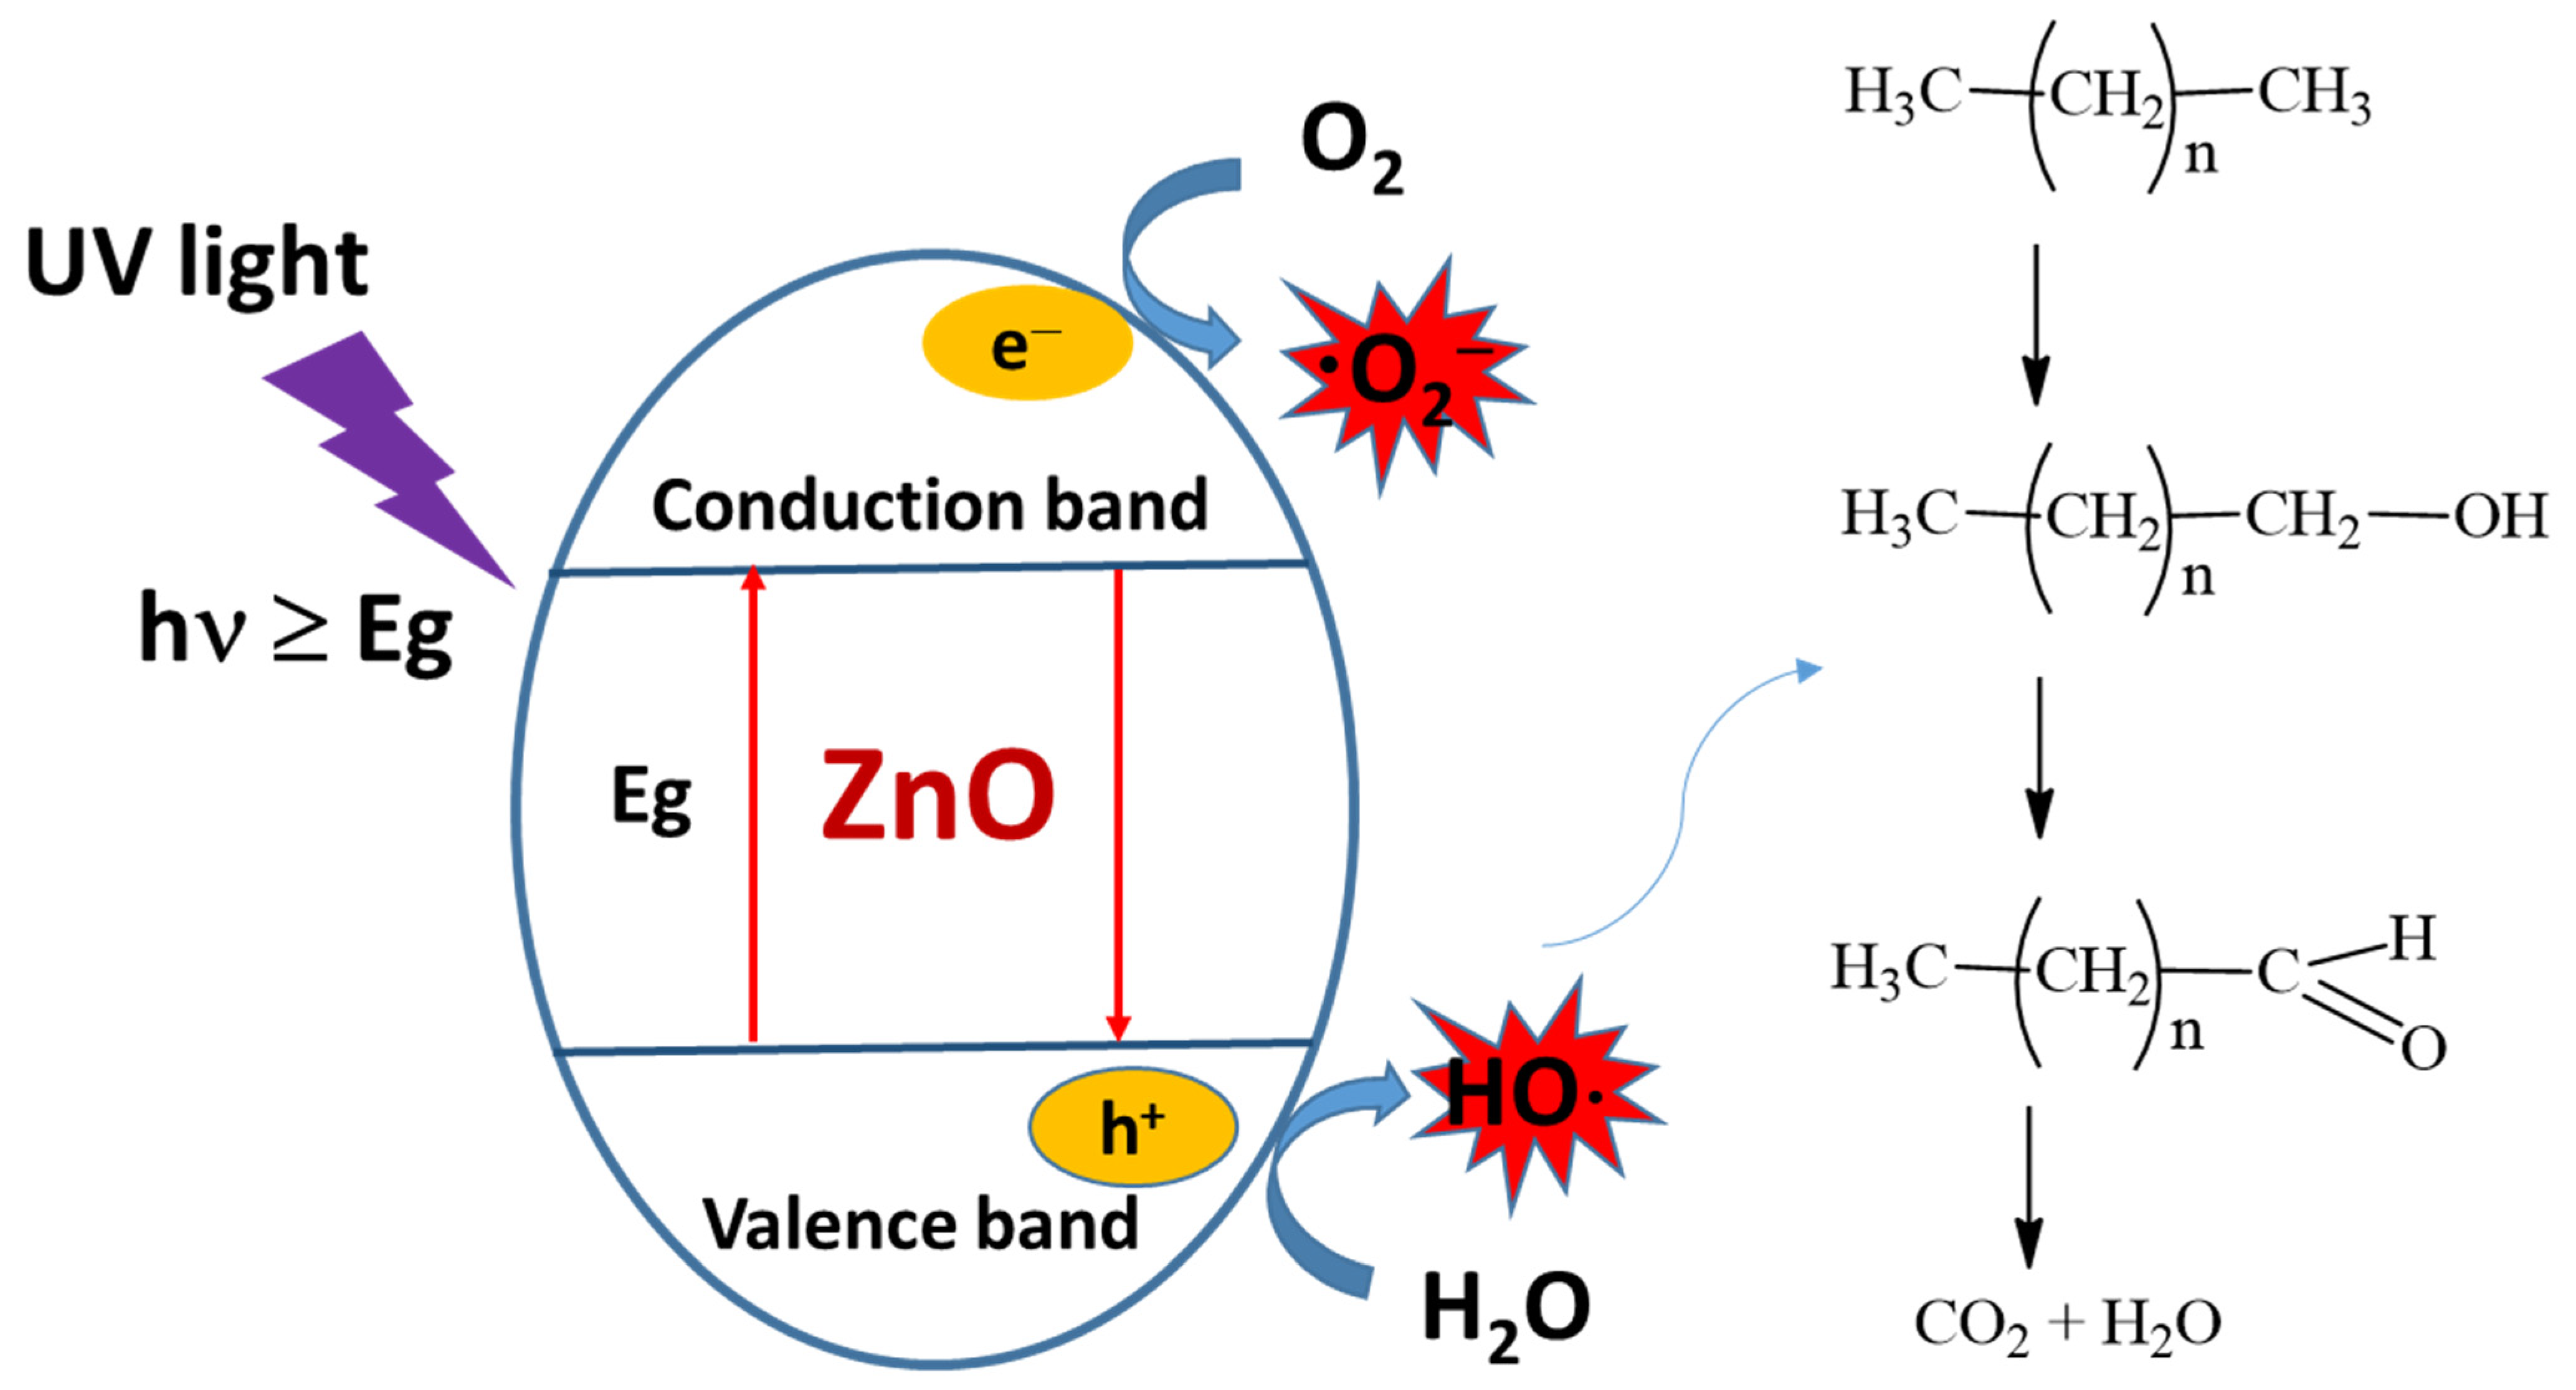
It is well-known that the mechanism of photocatalytic oxidation on ZnO (Figure 6) involves several steps: (i) when the semiconductor is irradiated by light with an energy equal to or higher than its band gap, an electron from the valence band gets excited to the conduction band, leaving behind an electron–hole pair (e––h+); (ii) the excited electron can be easily accepted by electron acceptors on the catalyst surface such as adsorbed O2, producing a superoxide radical anion (·O2−); (iii) the hole in the valence band can interact with electron donors such as OH− or H2O to form a hydroxyl free radical ·OH; (iv) these strong oxidizing agents (·O2−, ·OH and h+) readily oxidize the organic molecules [64,65]. The hydroxyl free radicals attack the C-H bond in alkanes from the produced water to form various alcohols, both with straight and branched chains, as well as cause cleavage of C-C bonds, producing compounds with shorter carbon chains, as can be seen in Table 5. The formation of aldehydes such as 13’ and 14’ indicates that the oxidation process goes further. At the end of the 12 h photocatalysis, all alcohols and aldehydes were oxidized to CO2 and H2O. Thus, both the GC-MS analysis and TOH results revealed significant decrease in the concentration of the heavy alkanes as a result of the photocatalytic degradation over ZnO.
4. Conclusions
In this study, the total amount of oily hydrocarbons was determined by measuring their absorption of tetrachloromethane extract of produced water. The TOH was used for monitoring the quality of the produced water before and after treatment. According to the GC-MS analysis, the raw oilfield produced water contained mainly heavy alkanes with straight and branched carbon chains. The GC-MS analysis of effluents from the photocatalysis with ZnO revealed that for 6 h UV-light irradiation, straight and branched primary alcohols and aldehydes were obtained that resulted from oxidation of alkanes. Further irradiation (for 12 h) caused degradation of organic molecules in very high degree, since only weak peaks were observed in the chromatogram. This finding confirmed the mechanism of photocatalytic degradation that involved oxidation of organic molecules by superoxide and hydroxyl free radicals.
The reduction of organic pollutants by three methods (adsorption, photocatalysis and chemical oxidation) was found to be in the following ranges: 36–85% for the adsorption with Charcoal 1, 17–83% for the adsorption with Charcoal 2, 82–92% for the photocatalysis with ZnO, 25–78% for the photocatalysis with TiO2 and 80–94% for the chemical oxidation with Ca(ClO)2. For each method, a different degree of oily hydrocarbons’ removal for samples I–IV could be explained by their different macro- and meso-composition that affected the efficiency of the treatment method. Such factors should be investigated further to evaluate the optimal conditions for each method and to assess the appropriate approach as a measure to alleviate the environmental impact of oilfield produced water when it is discharged into natural water bodies.
Author Contributions
Conceptualization, N.M. and G.G.; methodology, M.P.; investigation, N.M., G.G., and M.P.; resources, G.G.; writing—original draft preparation, G.G. and N.M.; writing—review and editing, M.P.; project administration, N.M. All authors have read and agreed to the published version of the manuscript.
Funding
This research was funded by the University of Mining and Geology, Sofia, grant number MTF-180/2021.
Funding
This research was funded by the University of Mining and Geology, Sofia, grant number MTF-180/2021.
Institutional Review Board Statement
Not applicable.
Informed Consent Statement
Nor applicable.
Data Availability Statement
The data presented in this study are available upon request by contact with the corresponding author.
Conflicts of Interest
The authors declare no conflict of interests.
References
- Sanchez, B. Fossil Fuels Account for the Largest Share of U.S. Energy Production and Consumption. Available online: https://www.eia.gov/todayinenergy/detail.php?id=45096 (accessed on 10 November 2021).
- Fakhru’l-Razi, A.; Pendashteh, A.; Abdullah, L.C.; Biak, D.R.A.; Madaeni, S.S.; Abidin, Z.Z. Review of technologies for oil and gas produced water treatment. J. Hazard. Mater. 2009, 170, 530–551. [Google Scholar] [CrossRef] [PubMed]
- Olajire, A.A. Recent advances on the treatment technology of oil and gas produced water for sustainable energy industry-mechanistic aspects and process chemistry perspectives. Chem. Eng. J. Adv. 2020, 4, 100049. [Google Scholar] [CrossRef]
- Igunnu, E.T.; Chen, G.Z. Produced water treatment technologies. Int. J. Low-Carbon Technol. 2014, 9, 157–177. [Google Scholar] [CrossRef] [Green Version]
- Nasiri, M.; Jafari, I. Produced water from oil-gas plants: A short review on challenges and opportunities. Period. Polytech. Chem. Eng. 2017, 61, 73–81. [Google Scholar] [CrossRef] [Green Version]
- Lu, J.; Wang, X.; Shan, B.; Li, X.; Wang, W. Analysis of chemical compositions contributable to chemical oxygen demand (COD) of oilfield produced water. Chemosphere 2006, 62, 322–331. [Google Scholar] [CrossRef]
- Hu, G.; Li, J.; Zeng, G. Recent development in the treatment of oily sludge from petroleum industry: A review. J. Hazard. Mater. 2013, 261, 470–490. [Google Scholar] [CrossRef]
- Kurniawan, T.A.; Lo, W.H.; Chan, G.Y. Physico-chemical treatments for removal of recalcitrant contaminants from landfill leachate. J. Hazard. Mater. 2006, 129, 80–100. [Google Scholar] [CrossRef]
- El-Naas, M.H.; Alhaija, M.A.; Al-Zuhair, S. Evaluation of a three-step process for the treatment of petroleum refinery wastewater. J. Environ. Chem. Eng. 2014, 2, 56–62. [Google Scholar] [CrossRef]
- Golestanbagh, M.; Parvini, M.; Pendashteh, A. Integrated systems for oilfield produced water treatment: The state of the art. Energy Sources Part A Recovery Util. Environ. Eff. 2016, 38, 3404–3411. [Google Scholar] [CrossRef]
- Dai, X.; Fang, J.; Li, L.; Dong, Y.; Zhang, J. Enhancement of COD removal from oilfield produced wastewater by combination of advanced oxidation, adsorption and ultrafiltration. Int. J. Environ. Res. Public Health 2019, 16, 3223. [Google Scholar] [CrossRef] [Green Version]
- Li, G.; Guo, S.; Li, F. Treatment of oilfield produced water by anaerobic process coupled with micro-electrolysis. J. Environ. Sci. 2010, 22, 1875–1882. [Google Scholar] [CrossRef]
- Dwyer, B.P.; McDonald, F. Treatment of Oil & Gas Produced Water; Sandia National Laboratories: Livermore, CA, USA, 2016. [Google Scholar]
- Yu, L.; Han, M.; He, F. A review of treating oily wastewater. Arab. J. Chem. 2017, 10, S1913–S1922. [Google Scholar] [CrossRef] [Green Version]
- Chen, C.; Wei, L.; Guo, X.; Guo, S.; Yan, G. Investigation of heavy oil refinery wastewater treatment by integrated ozone and activated carbon-supported manganese oxides. Fuel Process. Technol. 2014, 124, 165–173. [Google Scholar] [CrossRef]
- Wenhu, Z.; Dejin, W.; Ruoyu, F.; Feng, L. Studies on affecting factors and mechanism of oily wastewater by wet hydrogen peroxide oxidation. Arab. J. Chem. 2017, 10, S2402–S2405. [Google Scholar] [CrossRef] [Green Version]
- Stepnowski, P.; Siedlecka, E.M.; Behrend, P.; Jastorff, B. Enhanced photo-degradation of contaminants in petroleum refinery wastewater. Water Res. 2002, 36, 2167–2172. [Google Scholar] [CrossRef]
- Shokrollahzadeh, S.; Golmohammad, F.; Naseri, N.; Shokouhi, H.; Arman-mehr, M. Chemical oxidation for removal of hydrocarbons from gas–field produced water. Proced. Eng. 2012, 42, 942–947. [Google Scholar] [CrossRef] [Green Version]
- Lee, K.J.; Kim, B.H.; Hong, J.H.; Pyo, H.S.; Park, S.J.; Lee, D.W. A study on the distribution of chlorination by-products (CBPs) in treated water in Korea. Water Res. 2001, 35, 2861–2872. [Google Scholar] [CrossRef]
- Chong, M.N.; Jin, B.; Chow, C.W.; Saint, C. Recent developments in photocatalytic water treatment technology: A review. Water Res. 2010, 44, 2997–3027. [Google Scholar] [CrossRef]
- Grzechulska, J.; Hamerski, M.; Morawski, A.W. Photocatalytic decomposition of oil in water. Water Res. 2000, 34, 1638–1644. [Google Scholar] [CrossRef]
- Saien, J.; Shahrezaei, F. Organic pollutants removal from petroleum refinery wastewater with nanotitania photocatalyst and UV light emission. Int. J. Photoenergy 2012, 2012, 703074. [Google Scholar] [CrossRef]
- Azevedo, E.B.; Tôrres, A.R.; Aquino Neto, F.R.; Dezotti, M. TiO2-photocatalyzed degradation of phenol in saline media in an annular reactor: Hydrodynamics, lumped kinetics, intermediates, and acute toxicity. Braz. J. Chem. Eng. 2009, 26, 75–87. [Google Scholar] [CrossRef] [Green Version]
- Bessa, E.; Sant’Anna, G.L., Jr.; Dezotti, M. Photocatalytic/H2O2 treatment of oil field produced waters. Appl. Catal. B Environ. 2001, 29, 125–134. [Google Scholar] [CrossRef]
- Soltanian, G.R.; Havaee Behbahani, M. The effect of metal oxides on the refinery effluent treatment. Iran. J. Environ. Health Sci. Eng. 2011, 8, 169–174. [Google Scholar]
- Tetteh, E.K.; Rathilal, S.; Naidoo, D.B. Photocatalytic degradation of oily waste and phenol from a local South Africa oil refinery wastewater using response methodology. Sci. Rep. 2020, 10, 8850. [Google Scholar] [CrossRef] [PubMed]
- Khan, W.Z.; Najeeb, I.; Tuiyebayeva, M.; Makhtayeva, Z. Refinery wastewater degradation with titanium dioxide, zinc oxide, and hydrogen peroxide in a photocatalytic reactor. Process Saf. Environ. Prot. 2015, 94, 479–486. [Google Scholar] [CrossRef]
- Santos, F.V.; Azevedo, E.B.; Sant’Anna, G.L., Jr.; Dezotti, M. Photocatalysis as a tertiary treatment for petroleum refinery wastewaters. Braz. J. Chem. Eng. 2006, 23, 451–460. [Google Scholar] [CrossRef]
- Dionysiou, D.D.; Suidan, M.T.; Baudin, I.; Laîné, J.M. Effect of hydrogen peroxide on the destruction of organic contaminants-synergism and inhibition in a continuous-mode photocatalytic reactor. Appl. Catal. B Environ. 2004, 50, 259–269. [Google Scholar] [CrossRef]
- Hassan, A.A.; Naeema, H.T.; Hadi, R.T. Degradation of oily waste water in aqueous phase using solar (ZnO, TiO2 and Al2O3) catalysts. Pak. J. Biotechnol. 2018, 15, 909–916. [Google Scholar]
- Ali, D.; Hosein, G.M. Photocatalytic degradation of kermanshah refinery wastewater using nano-TiO2 supported on bentonite. World Appl. Sci. J. 2012, 19, 874–879. [Google Scholar] [CrossRef]
- Nezamzadeh-Ejhieh, A.; Bahrami, M. Investigation of the photocatalytic activity of supported ZnO–TiO2 on clinoptilolite nano-particles towards photodegradation of wastewater-contained phenol. Desalin. Water Treat. 2015, 55, 1096–1104. [Google Scholar] [CrossRef]
- Aljuboury, D.A.; Palaniandy, P.; Abdul Aziz, H.B.; Feroz, S.; Abu Amr, S.S. Evaluating photo-degradation of COD and TOC in petroleum refinery wastewater by using TiO2/ZnO photo-catalyst. Water Sci. Technol. 2016, 74, 1312–1325. [Google Scholar] [CrossRef] [PubMed]
- Alkhazraji, H.A.J.; Alatabe, M.J.A. Oil recovery from oilfield produced water using zinc oxide nano particle as catalyst in batch and continuous system. J. Ecol. Eng. 2021, 22, 278–286. [Google Scholar] [CrossRef]
- Al-Sabahi, J.; Bora, T.; Al-Abri, M.; Dutta, J. Efficient visible light photocatalysis of benzene, toluene, ethylbenzene and xylene (BTEX) in aqueous solutions using supported zinc oxide nanorods. PLoS ONE 2017, 12, e0189276. [Google Scholar] [CrossRef] [PubMed] [Green Version]
- Haiqi, O.A.; Nour, A.H.; Bargaa, R.; Ayodele, B.V. Effect of process parameters on the photocatalytic degradation of phenol in oilfield produced wastewater using ZnO/Fe2O3 nanocomposites. Bull. Chem. React. Eng. Catal. 2020, 15, 128–136. [Google Scholar] [CrossRef] [Green Version]
- Okiel, K.; El-Sayed, M.; El-Kady, M.Y. Treatment of oil–water emulsions by adsorption onto activated carbon, bentonite and deposited carbon. Egypt. J. Pet. 2011, 20, 9–15. [Google Scholar] [CrossRef] [Green Version]
- El-Naas, M.H.; Al-Zuhair, S.; Alhaija, M.A. Reduction of COD in refinery wastewater through adsorption on date-pit activated carbon. J. Hazard. Mater. 2010, 173, 750–757. [Google Scholar] [CrossRef]
- Anisuzzaman, S.M.; Joseph, C.G.; Taufiq-Yap, Y.H.; Krishnaiah, D.; Tay, V.V. Modification of commercial activated carbon for the removal of 2,4-dichlorophenol from simulated wastewater. J. King Saud Univ.-Sci. 2015, 27, 318–330. [Google Scholar] [CrossRef] [Green Version]
- Gupta, S.; Tai, N.-H. Carbon materials as oil sorbents: A review on the synthesis and performance. J. Mater. Chem. A 2016, 4, 1550–1565. [Google Scholar] [CrossRef]
- Sun, H.; Li, A.; Zhu, Z.; Liang, W.; Zhao, X.; La, P.; Deng, W. Superhydrophobic activated carbon-coated sponges for separation and absorption. ChemSusChem 2013, 6, 1057–1062. [Google Scholar] [CrossRef]
- Zhan, B.; Liu, Y.; Zhou, W.-T.; Li, S.-Y.; Chen, Z.-B.; Stegmaier, T.; Aliabadi, M.; Han, Z.W.; Ren, L.Q. Multifunctional 3D GO/g-C3N4/TiO2 foam for oil-water separation and dye adsorption. Appl. Surf. Sci. 2021, 541, 148638. [Google Scholar] [CrossRef]
- Yang, H.; Sun, J.; Zhang, Y.; Xue, Q.; Xia, S. Preparation of hydrophobic carbon aerogel using cellulose extracted from luffa sponge for adsorption of diesel oil. Ceram. Int. 2021, 47, 33827–33834. [Google Scholar] [CrossRef]
- Kusworo, T.D.; Aryanti, N.; Qudratun; Utomo, D.P. Oilfield produced water treatment to clean water using integrated activated carbon-bentonite adsorbent and double stages membrane process. Chem. Eng. J. 2018, 347, 462–471. [Google Scholar] [CrossRef]
- Liu, X.; Ruan, W.; Wang, W.; Zhang, X.; Liu, Y.; Liu, J. The perspective and challenge of nanomaterials in oil and gas wastewater treatment. Molecules 2021, 26, 3945. [Google Scholar] [CrossRef] [PubMed]
- Bulgarian State Standards: Environment Protection, 1989 or Bulgarian State Standards: Environment Protection 1989, v.1; Bulgarian Institute for Standardization: Sofia, Bulgaria, 1989.
- Petrova, Y.; Aleksiev, A.; Momchilova, S.; Zdravkova, Z. Laboratory Practicals in Analysis of Toxic Compounds; Sofia University press: Sofia, Bulgaria, 2004. [Google Scholar]
- Panayotova, M.; Gicheva, G.; Dzherahov, L.; Mintcheva, N. Liquid phase oxidation as a possibility for the removal of oil compounds from produced water. J. Min. Geol. Sci. Part II Min. Technol. Miner. Process. 2017, 60, 110–115. [Google Scholar]
- Bulgarian Council of Ministers. Decree 6/9.11.2000 on Emission Standards for Permissible Content of Harmful and Dangerous Substances in Wastewater Discharged into Water Bodies, Bulgarian State Gazette No. 97/28.11.2000 and No. 24/23.03.2004; National Assembly of the Republic of Bulgaria: Sofia, Bulgaria, 2000. [Google Scholar]
- Tellez, G.T.; Nirmalakhandan, N.; Gardea-Torresdey, J.L. Performance evaluation of an activated sludge system for removing petroleum hydrocarbons from oilfield produced water. Adv. Environ. Res. 2002, 6, 455–470. [Google Scholar] [CrossRef]
- Tully, E.J. A study of calcium hypochlorite as a disinfectant of water. Am. J. Public Health 1914, 4, 423–435. [Google Scholar] [CrossRef] [Green Version]
- Fukuzaki, S. Mechanisms of actions of sodium hypochlorite in cleaning and disinfection processes. Biocontrol Sci. 2006, 11, 147–157. [Google Scholar] [CrossRef]
- Khandaker, N.R.; Afreen, I.; Diba, D.S.; Huq, F.B.; Akter, T. Treatment of textile wastewater using calcium hypochlorite oxidation followed by waste iron rust aided rapid filtration for color and COD removal for application in resources challenged Bangladesh. Groundw. Sustain. Dev. 2020, 10, 100342. [Google Scholar] [CrossRef]
- Mintcheva, N.; Gicheva, G.; Panayotova, M.; Kulinich, S.A. Room-temperature synthesis of ZnS nanoparticles using zinc xanthates as molecular precursors. Materials 2020, 13, 171. [Google Scholar] [CrossRef] [Green Version]
- Kubelka, P.; Munk, F. Ein Beitrag Zur Optik der Farbanstriche. Z. Tech. Phys. 1931, 12, 593–601. [Google Scholar]
- Tauc, J.; Grigorovici, R.; Vancu, A. Optical properties and electronic structure of amorphous germanium. Phys. Status Solidi B 1966, 15, 627–637. [Google Scholar] [CrossRef]
- Sáenz-Trevizo, A.; Amézaga-Madrid, P.; Pizá-Ruiz, P.; Antúnez-Flores, W.; Miki-Yoshida, M. Optical band gap estimation of ZnO nanorods. Mater. Res. 2016, 19, 33–38. [Google Scholar] [CrossRef]
- Reyes-Coronado, D.; Rodríguez-Gattorno, G.; Espinosa-Pesqueira, M.E.; Cab, C.; de Coss, R.; Oskam, G. Phase-pure TiO2 nanoparticles: Anatase, brookite and rutile. Nanotechnology 2008, 19, 145605. [Google Scholar] [CrossRef] [PubMed]
- Kang, X.; Berberidou, C.; Galeckas, A.; Bazioti, C.; Sagstuen, E.; Norby, T.; Poulios, I.; Chatzitakis, A. Visible light driven photocatalytic decolorization and disinfection of water employing reduced TiO2 nanopowders. Catalysts 2021, 11, 228. [Google Scholar] [CrossRef]
- Srikant, V.; Clarke, D.R. On the optical band gap of zinc oxide. J. Appl. Phys. 1998, 83, 5447–5451. [Google Scholar] [CrossRef]
- Pawar, V.; Jha, P.K.; Panda, S.K.; Jha, P.A.; Singh, P. Band-gap engineering in ZnO thin films: A combined experimental and theoretical study. Phys. Rev. Appl. 2018, 9, 054001. [Google Scholar] [CrossRef]
- Sakthivel, S.; Neppolian, B.; Shankar, M.V.; Arabindoo, B.; Palanichamy, M.; Murugesan, V. Solar photocatalytic degradation of azo dye: Comparison of photocatalytic efficiency of ZnO and TiO2. Sol. Energy Mater. Sol. Cells 2003, 77, 65–82. [Google Scholar] [CrossRef]
- Aggelopoulos, C.A.; Dimitropoulos, M.; Govatsi, A.; Sygellou, L.; Tsakiroglou, C.D.; Yannopoulos, S.N. Influence of the surface-to-bulk defects ratio of ZnO and TiO2 on their UV-mediated photocatalytic activity. Appl. Catal. B 2017, 205, 292–301. [Google Scholar] [CrossRef]
- Zheng, Y.; Chen, C.; Zhan, Y.; Lin, X.; Zheng, Q.; Wei, K.; Zhu, J.; Zhu, Y. Luminescence and photocatalytic activity of ZnO nanocrystals: Correlation between structure and property. Inorg. Chem. 2007, 46, 6675–6682. [Google Scholar] [CrossRef]
- Lee, K.M.; Lai, C.W.; Ngai, K.S.; Juan, J.C. Recent developments of zinc oxide based photocatalyst in water treatment technology: A review. Water Res. 2016, 88, 428–448. [Google Scholar] [CrossRef]
Scheme 1.
Diagram for activated carbon adsorption of produced water.
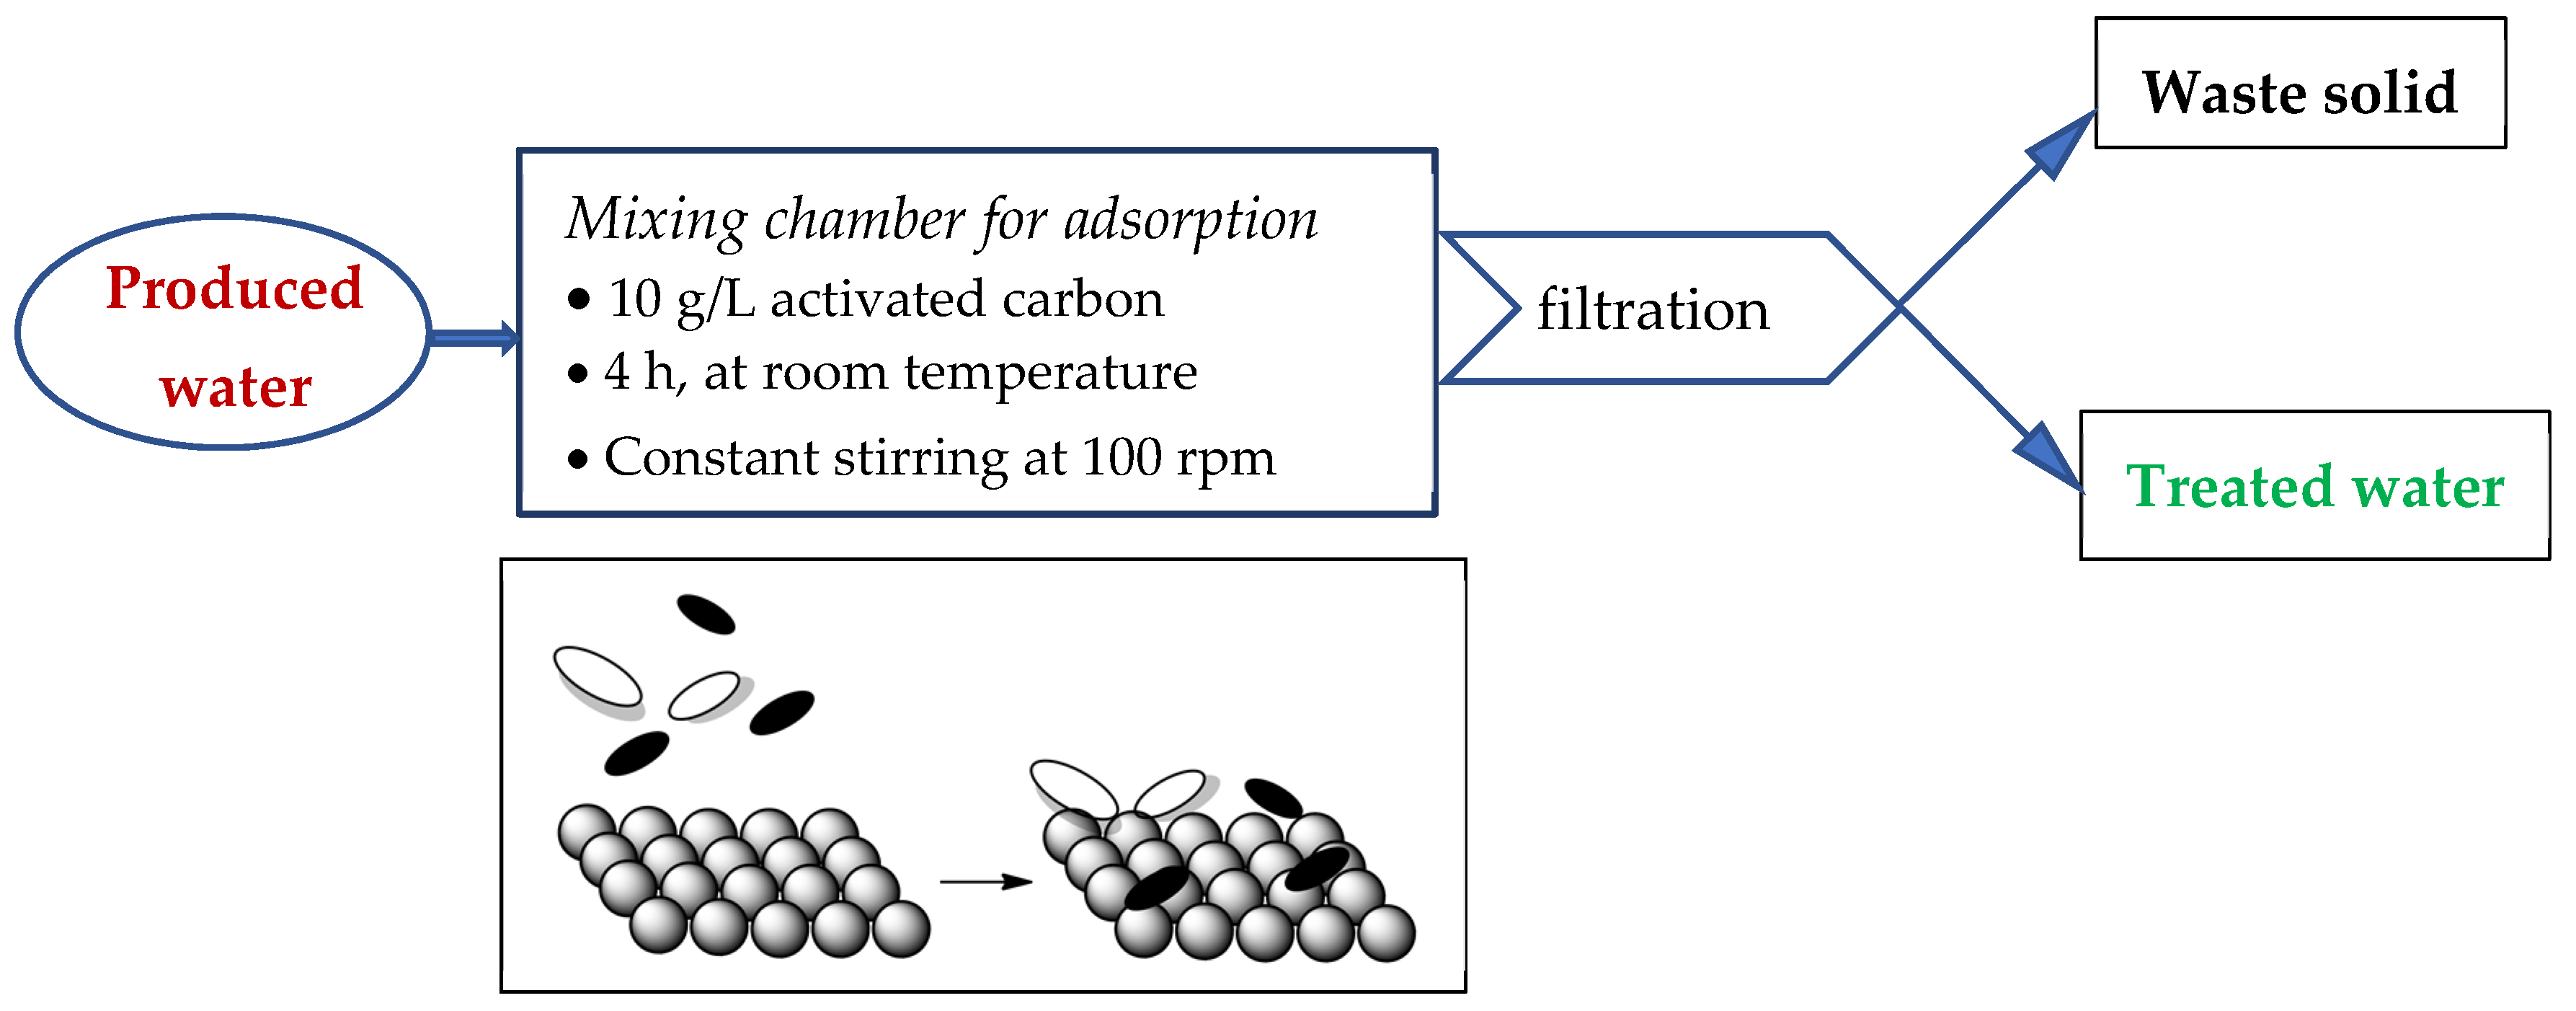
Figure 1.
SEM images of (a) Charcoal 1 and (b) Charcoal 2.
Scheme 2.
Diagram for chemical oxidation of produced water.

Figure 2.
XRD patterns of (a) TiO and (b) ZnO.

Figure 3.
SEM images of (a) TiO2 and (b) ZnO.

Figure 4.
(a) Diffuse reflectance UV-vis spectra and (b) Tauc’s plot of ZnO and TiO2.
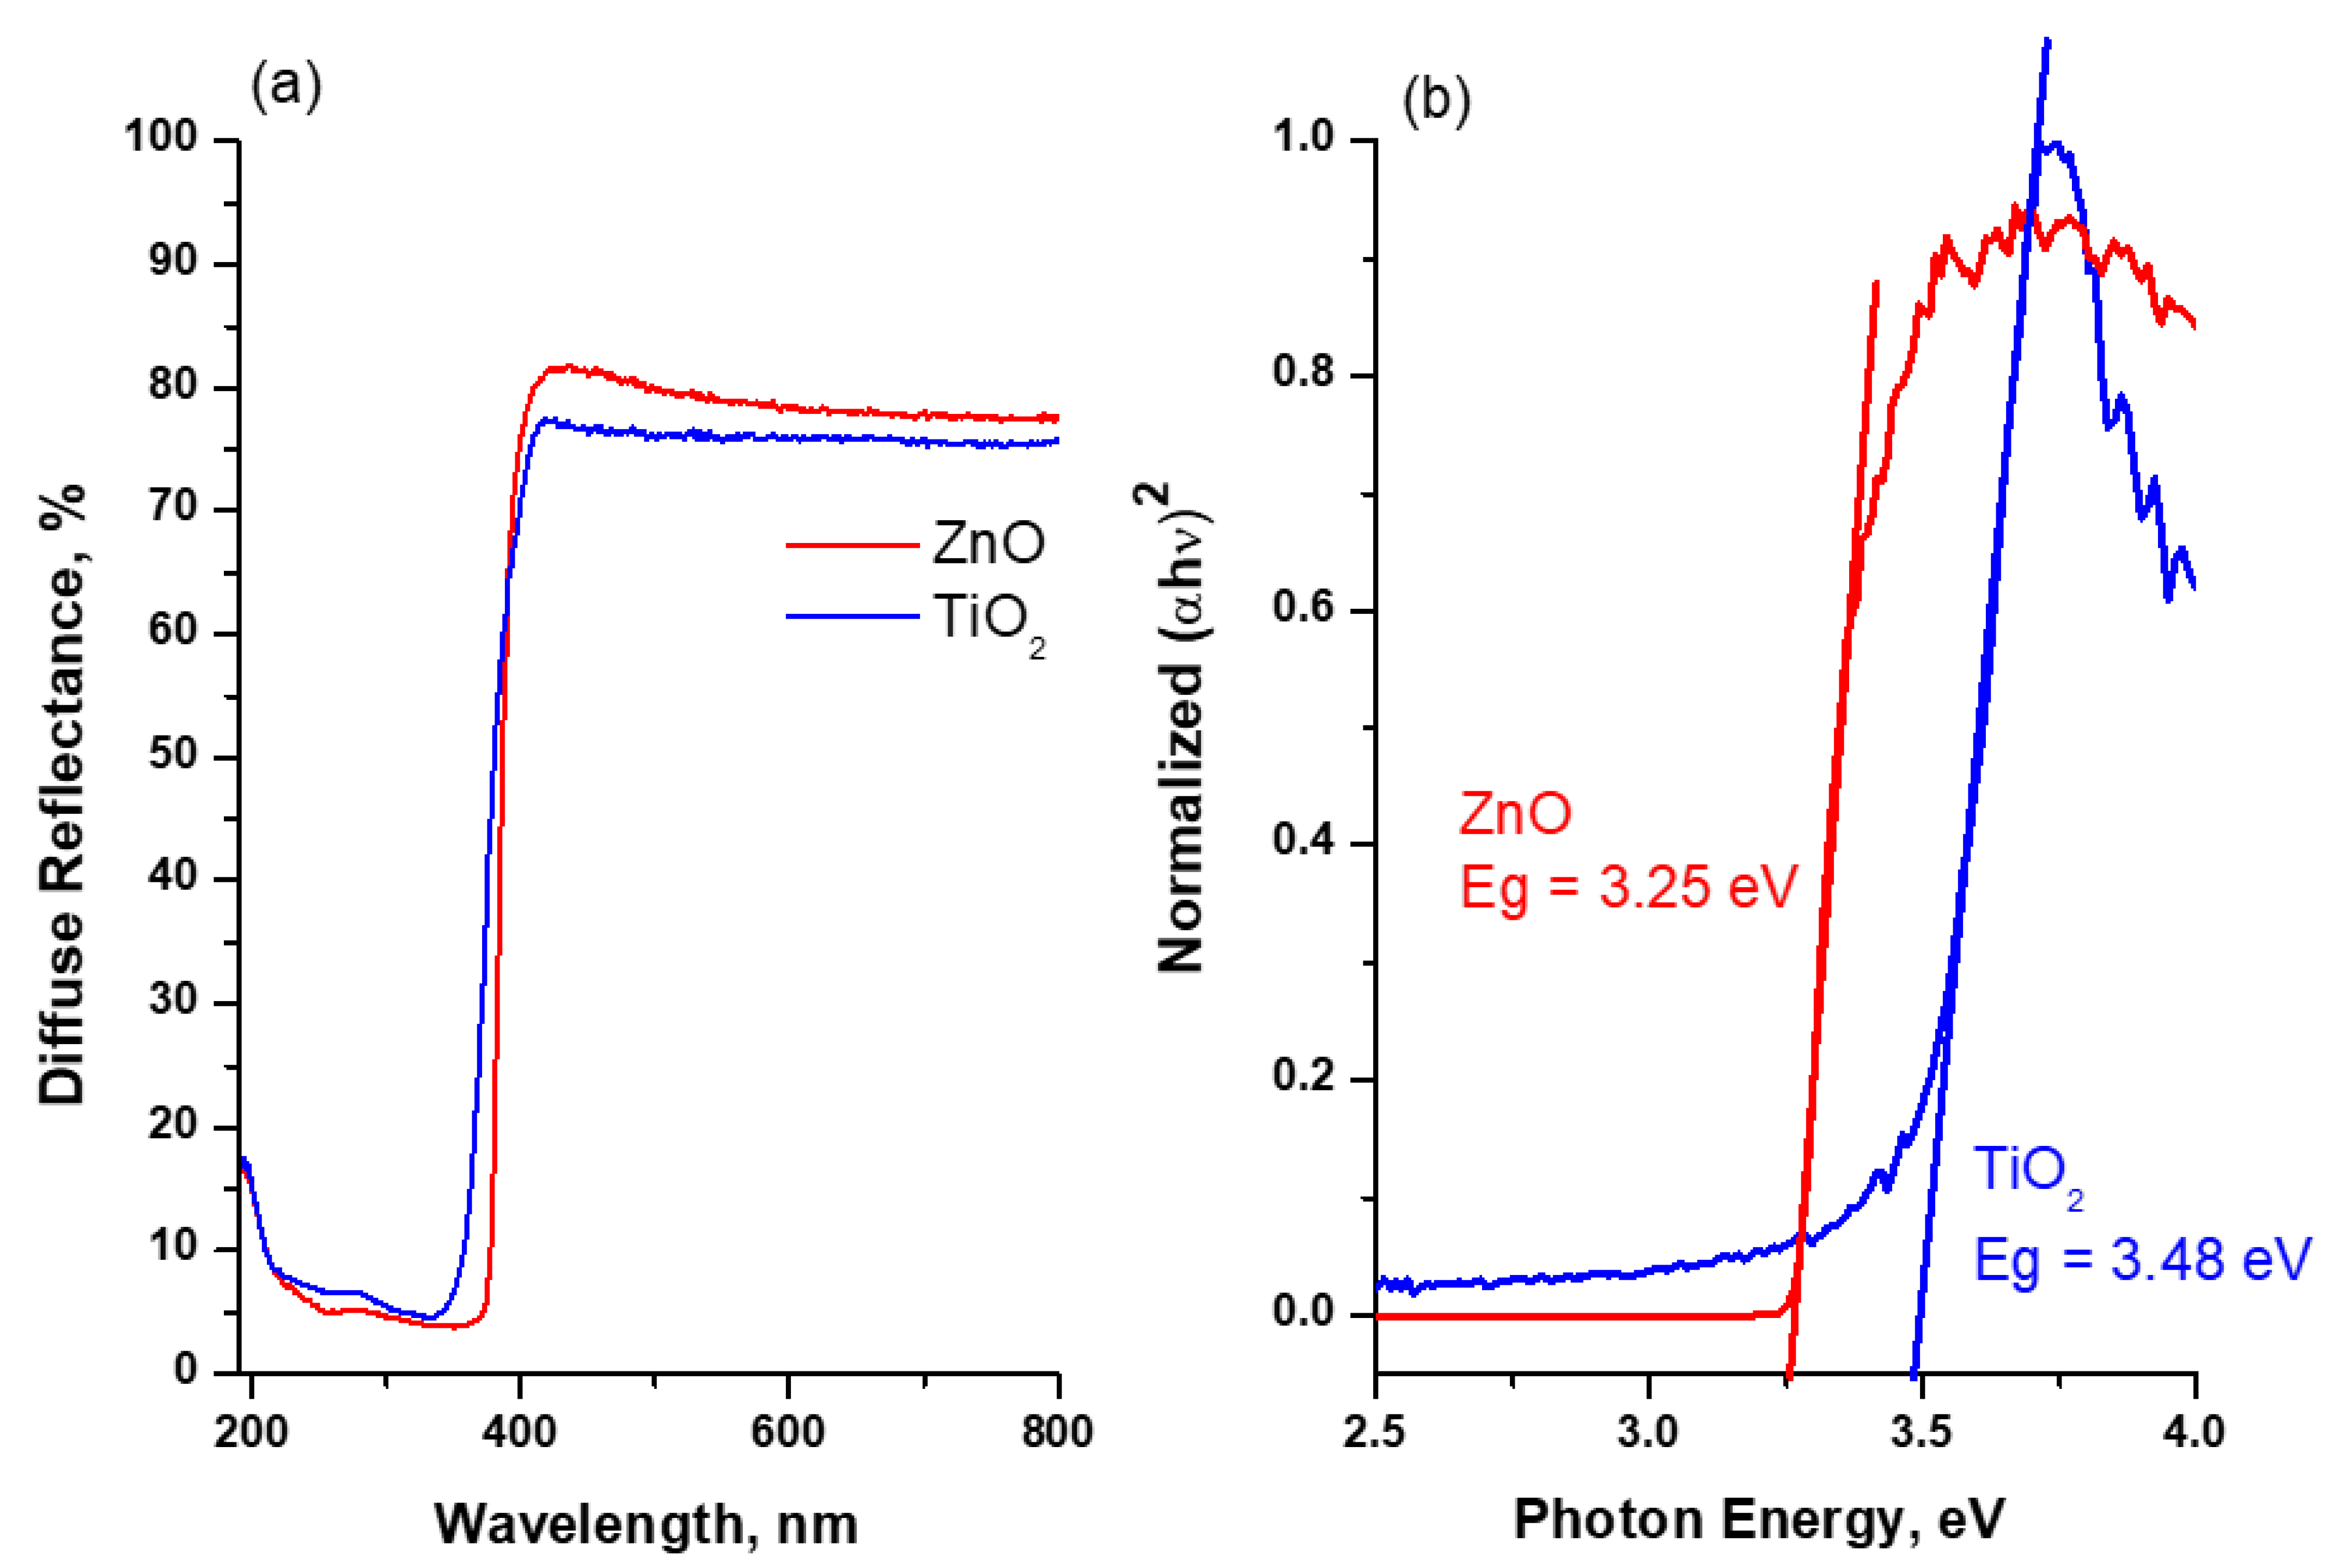
Figure 5.
GC-MS chromatograms: (A) raw produced water; (B) water treated by photocatalysis with ZnO for 6 h; (C) water treated by photocatalysis with ZnO for 12 h. The solvent peak is denoted by an asterisk.
Figure 5.
GC-MS chromatograms: (A) raw produced water; (B) water treated by photocatalysis with ZnO for 6 h; (C) water treated by photocatalysis with ZnO for 12 h. The solvent peak is denoted by an asterisk.
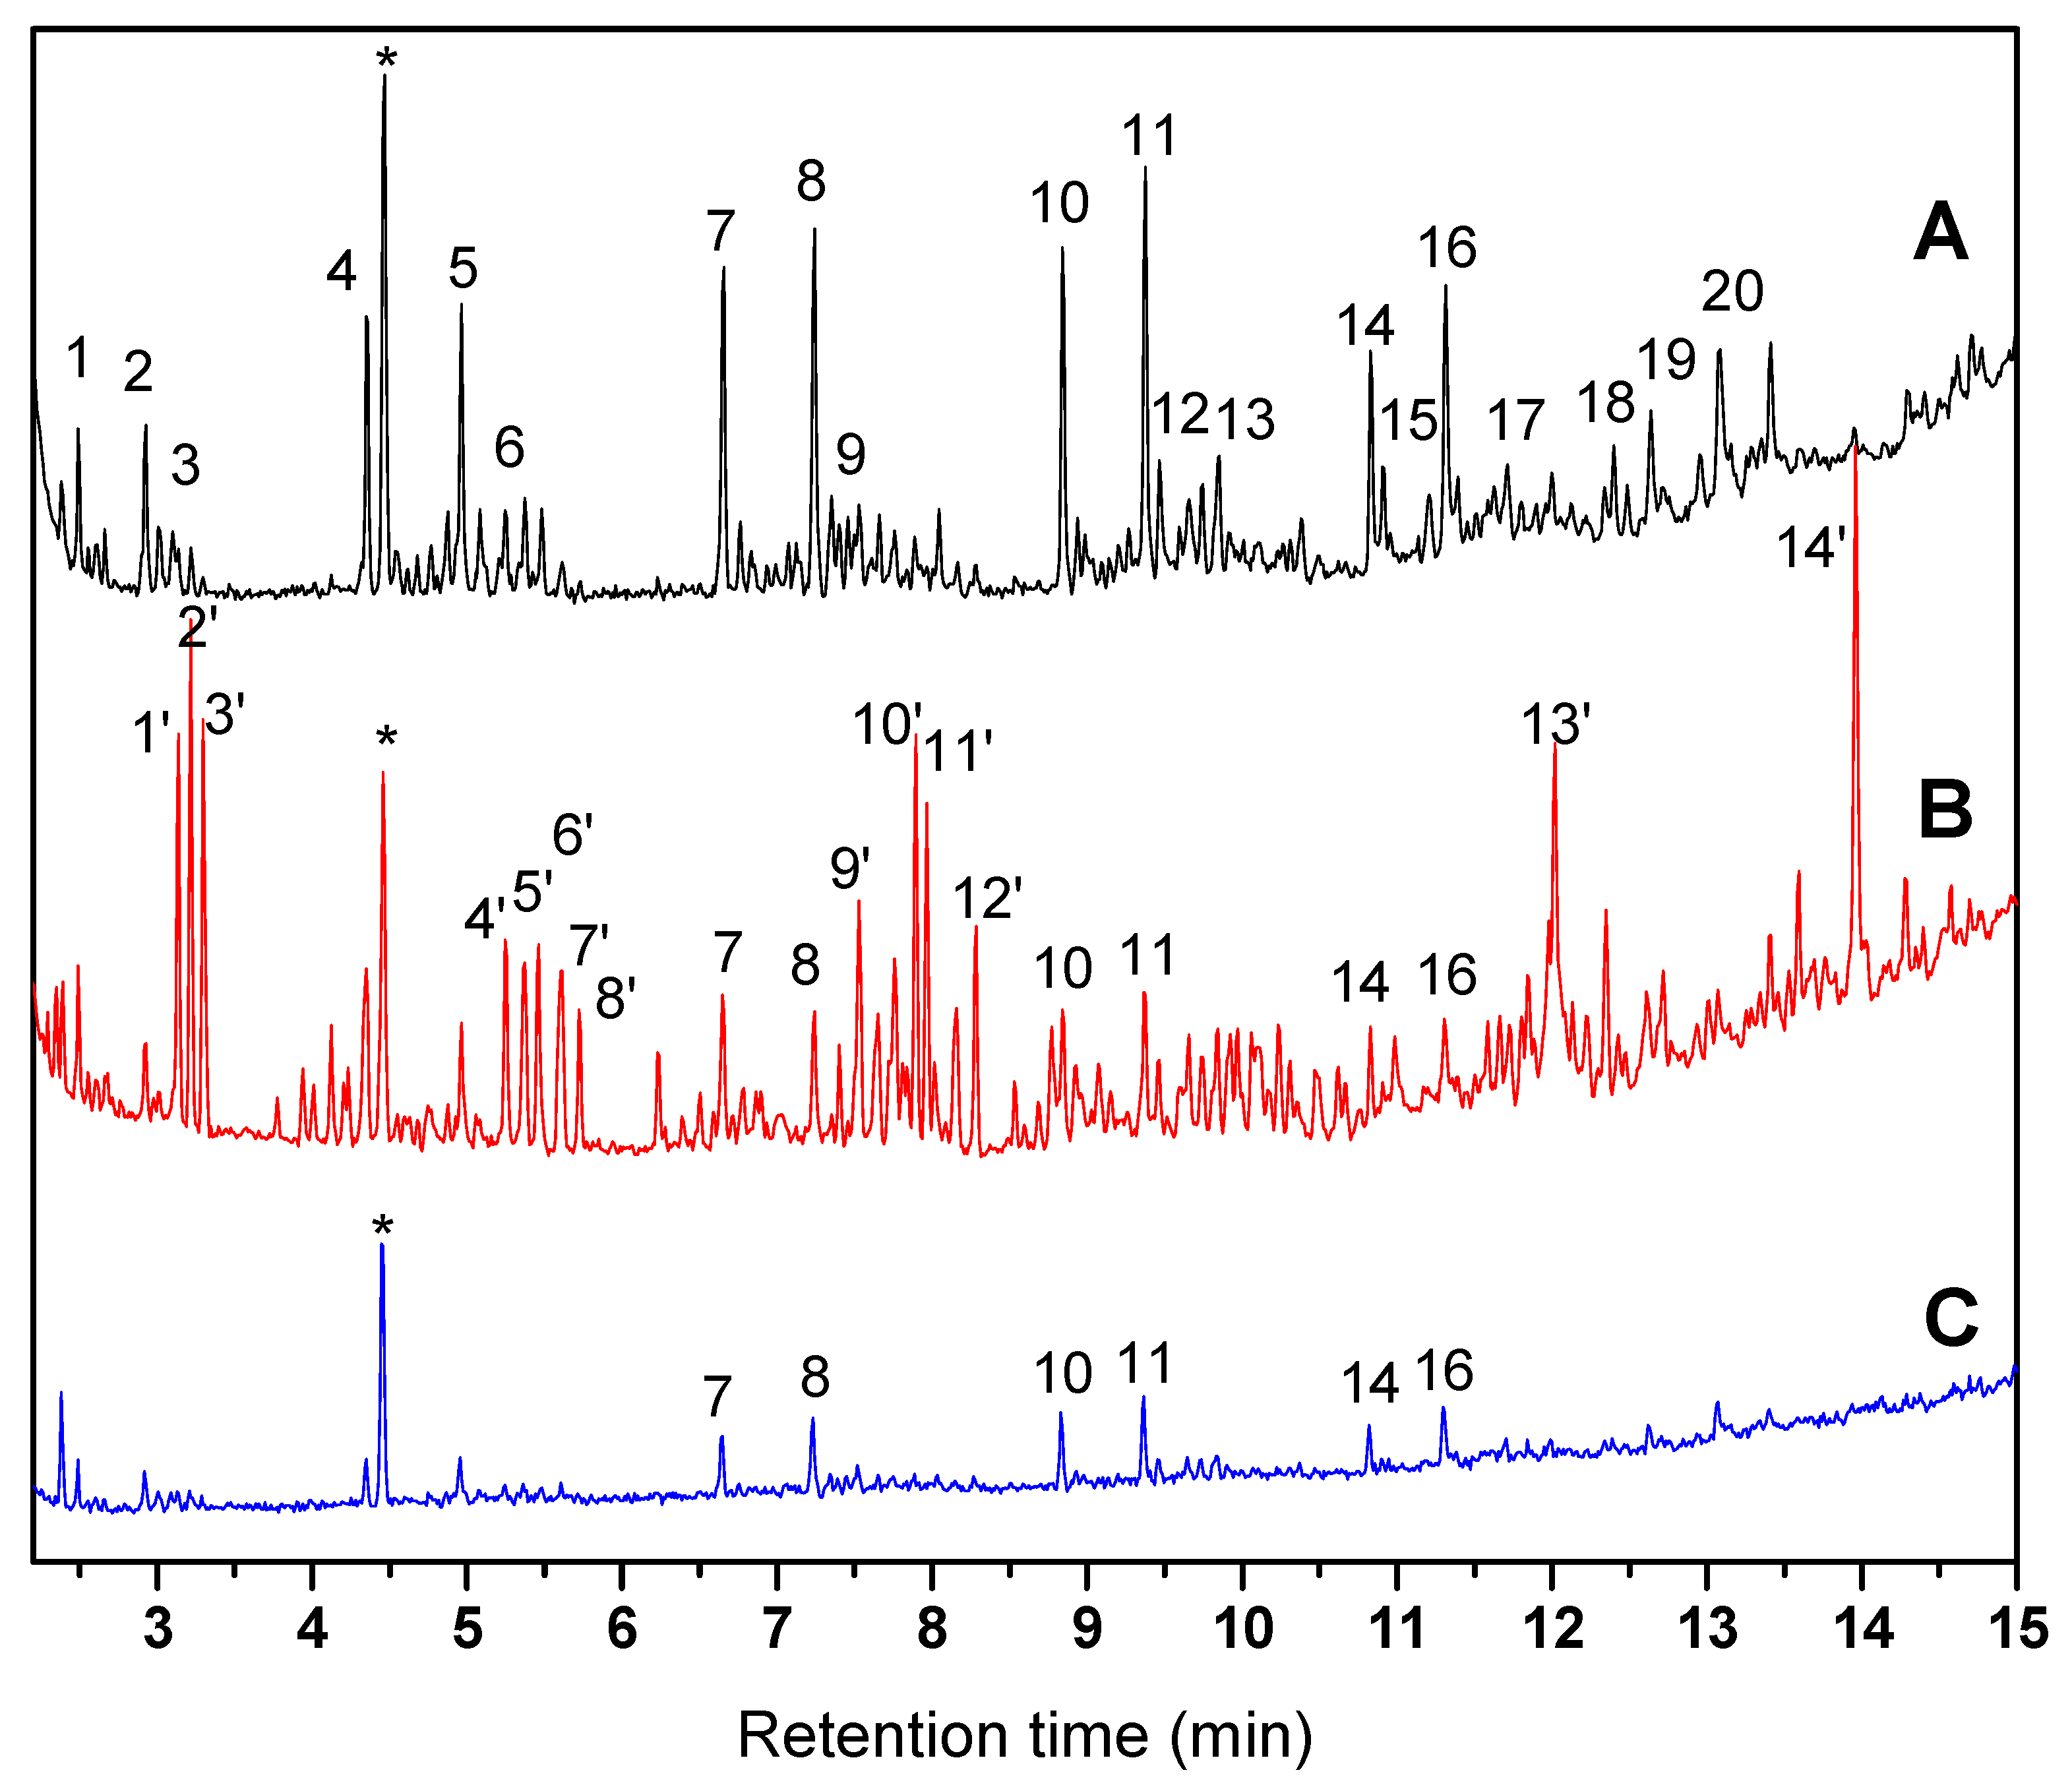
Figure 6.
Mechanism of the photocatalytic degradation of organic molecules.

Table 1.
Physicochemical parameters of the produced water.
| Sample № | T °C | pH | Eh mV | χ mS/cm | ΔpH | Dissolved O2 mg/L |
|---|---|---|---|---|---|---|
| I | 20.2 | 7.40 | −12 | 5.65 | +0.10 | <0.08 |
| II | 19.8 | 7.38 | −15 | 3.55 | −0.01 | <0.08 |
| III | 22.2 | 7.57 | −81 | 4.41 | −0.01 | <0.08 |
| IV | 25.3 | 7.18 | −139 | 5.70 | −0.08 | <0.08 |
Table 2.
Concentration (in mg/L) of macro- and meso-components of the produced water.
| Sample № | I | II | III | IV |
|---|---|---|---|---|
| Ca2+ | 110 | 77 | 88 | 103 |
| Mg2+ | 57 | 43 | 50 | 60 |
| Na+ | 1260 | 805 | 1020 | 1201 |
| K+ | 18 | 16 | 17 | 19 |
| Cl− | 1777 | 975 | 1310 | 1761 |
| HCO3− | 440 | 510 | 577 | 585 |
| SO42− | 448 | 445 | 460 | 470 |
| S2− | 2.40 | 3.42 | 1.96 | 9.76 |
| Hardness * | 5.09 | 3.70 | 4.26 | 5.05 |
* in mmol/L.
Table 3.
Specific parameters for the produced water.
| Sample № | COD, mg/L | TOH, mg/L | Phenols, mg/L |
|---|---|---|---|
| I | 49 | 363 | 0.11 |
| II | 39 | 317 | 0.18 |
| III | 39 | 336 | 0.07 |
| IV | 58 | 152 | 0.21 |
Table 4.
Results from produced water treatment tests.
| Sample № | TOH Initial | Adsorption | Photocatalysis | Chemical Oxidation | |||||||
|---|---|---|---|---|---|---|---|---|---|---|---|
| Charcoal 1 | Charcoal 2 | TiO2 | ZnO | Ca(ClO)2 | |||||||
| TOH | Removal | TOH | Removal | TOH | Removal | TOH | Removal | TOH | Removal | ||
| I | 363 | 91 | 75 | 138 | 62 | 271 | 25 | 65 | 82 | 27 | 93 |
| II | 317 | 203 | 36 | 262 | 17 | 120 | 62 | 47 | 85 | 19 | 94 |
| III | 336 | 52 | 85 | 56 | 83 | 96 | 71 | 28 | 92 | 66 | 80 |
| IV | 152 | 58 | 62 | 109 | 28 | 33 | 78 | 24 | 84 | 27 | 82 |
TOH in mg/L; removal in %.
Table 5.
Assignment of chromatographic peaks.
| Peak № | Name and Formula (Chromatogram A) | Peak № | Name and Formula (Chromatogram B) |
|---|---|---|---|
| 1 | 2-methylundecane (C12H26) | 1’ | 2-isopropyl-5-methylheptan-1-ol (C11H24O)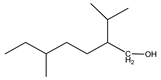 |
| 2 | 2,6-dimethyldecane (C12H26)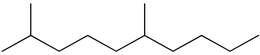 | 2’ | 2-methyldecan-1-ol (C11H24O)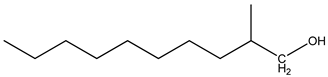 |
| 3 | n-Tridecane (C13H28) | 3’ | 2-methylundecan-1-ol (C12H26O)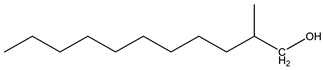 |
| 4 | 2-methyltetradecane (C15H32)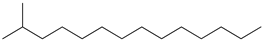 | 4’ | 2-hexyloctan-1-ol (C14H30O)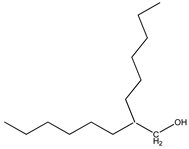 |
| 5 | 2,6,11-trimethyldodecane (C15H32)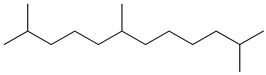 | 5’ | 2-ethyldodecan-1-ol (C14H30O) |
| 6 | n-Pentadecane (C15H32) | 6’ | 3,7,11-trimethyldodecan-1-ol (C15H32O)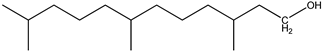 |
| 7 | 2-methyloctadecane (C19H40) | 7’ | Pentadecene (C15H30) |
| 8 | 2,6,10,14-tetramethylhexadecane (C20H42)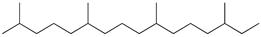 | 8’ | Hexadecene (C16H32) |
| 9 | n-Heptadecane (C17H36) | 9’ | 2-hexyldecan-1-ol (C16H34O)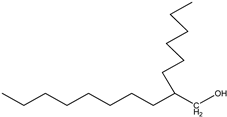 |
| 10 | 2-methylnonadecane (C20H42) | 10’ | hexadecan-1-ol (C16H34O) |
| 11 | 2,6,11,15-tetramethylheptadecane (C21H44)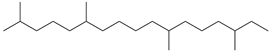 | 11’ | heptadecan-1-ol (C17H36O)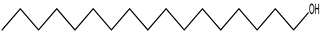 |
| 12 | n-Nonadecane (C19H40) | 12’ | 6,10,14-trimethylpentadecan-2-ol (C18H38O) |
| 13 | 2,6,10,15-tetramethylheptadecane (C21H44)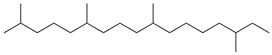 | 13’ | Hexadecanal (C16H32O)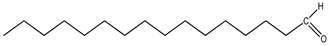 |
| 14 | 2-methyleicosane (C21H44) | 14’ | Heptadecanal (C17H34O) |
| 15 | n-Eicosane (C20H42) | ||
| 16 | 8-hexylpentadecane (C21H44)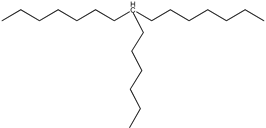 | ||
| 17 | n-Heneicosane (C21H44) | ||
| 18 | 2-methylheneicosane (C22H46) | ||
| 19 | n-Docosane (C22H46) | ||
| 20 | 8-heptylpentadecane (C22H46) |
Publisher’s Note: MDPI stays neutral with regard to jurisdictional claims in published maps and institutional affiliations. |
© 2022 by the authors. Licensee MDPI, Basel, Switzerland. This article is an open access article distributed under the terms and conditions of the Creative Commons Attribution (CC BY) license (https://creativecommons.org/licenses/by/4.0/).
Share and Cite
MDPI and ACS Style
Mintcheva, N.; Gicheva, G.; Panayotova, M. Reduction of Heavy Hydrocarbons from Oilfield Produced Water. Pollutants 2022, 2, 234-251. https://doi.org/10.3390/pollutants2020016
AMA Style
Mintcheva N, Gicheva G, Panayotova M. Reduction of Heavy Hydrocarbons from Oilfield Produced Water. Pollutants. 2022; 2(2):234-251. https://doi.org/10.3390/pollutants2020016
Chicago/Turabian StyleMintcheva, Neli, Gospodinka Gicheva, and Marinela Panayotova. 2022. "Reduction of Heavy Hydrocarbons from Oilfield Produced Water" Pollutants 2, no. 2: 234-251. https://doi.org/10.3390/pollutants2020016