
Techno-Economic Assessment of Solar–Grid–Battery Hybrid Energy Systems for Grid-Connected University Campuses in Kenya


Abstract
1. Introduction
2. Literature Review
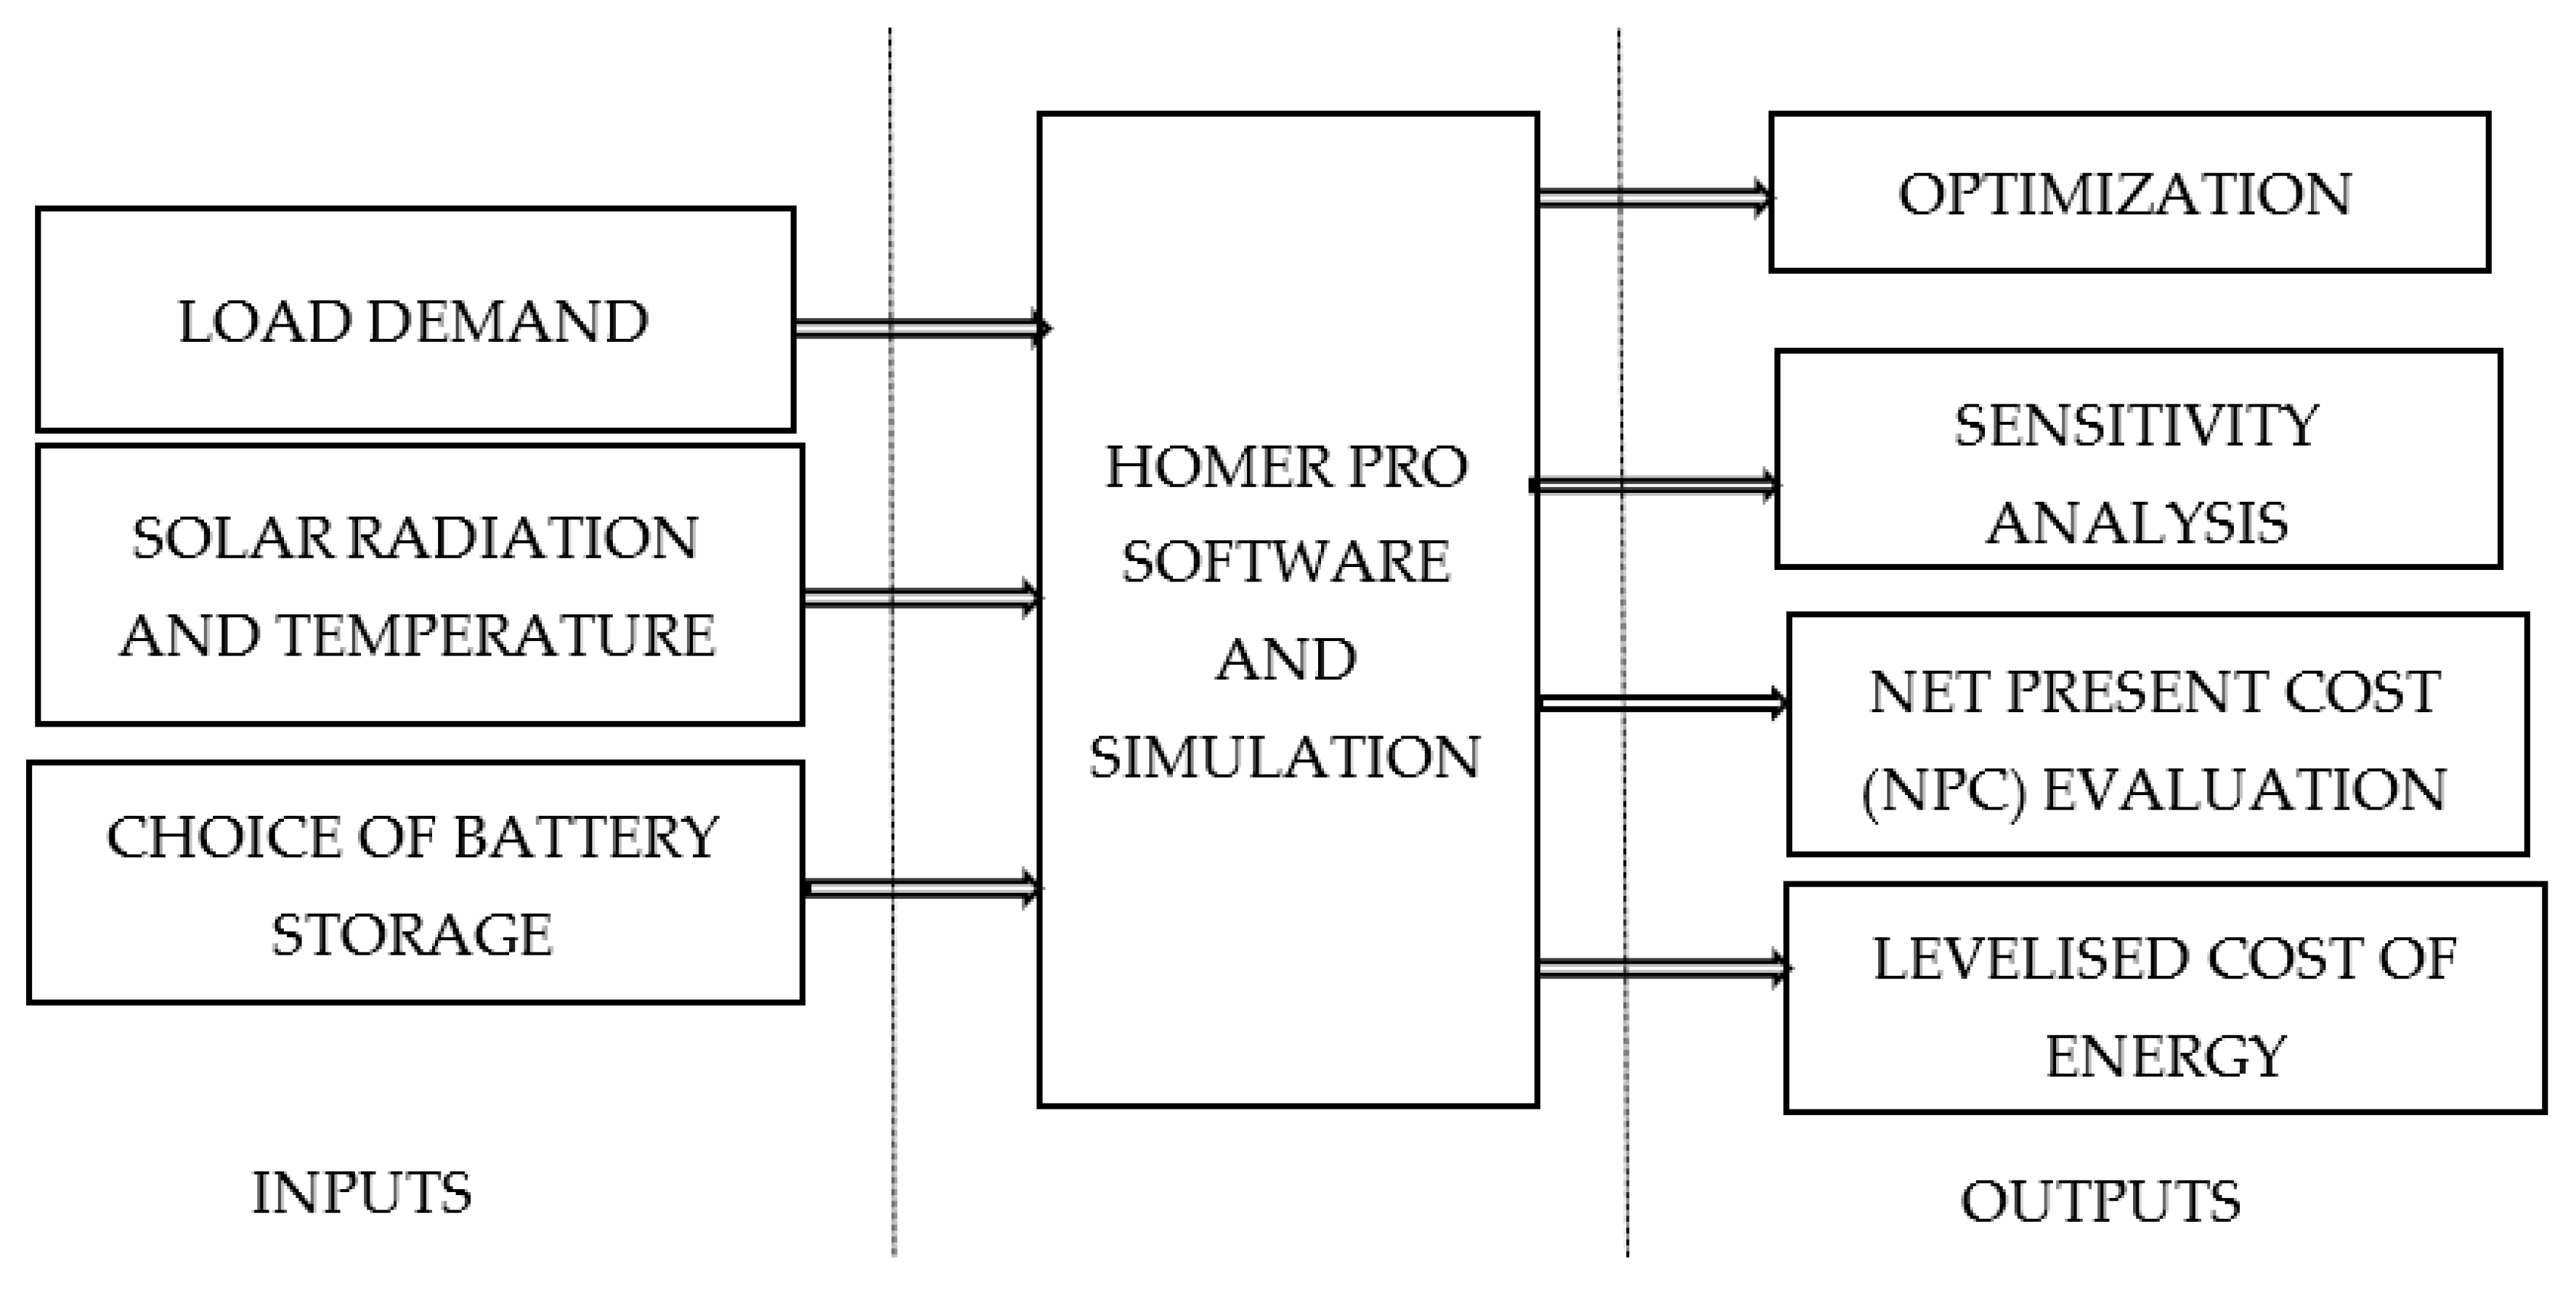
3. Materials and Methods
3.1. Grid
3.2. Solar PV
3.3. Battery Storage
3.4. Inverter
3.5. Charge Controller
3.6. Economic Parameters
4. Results and Discussion
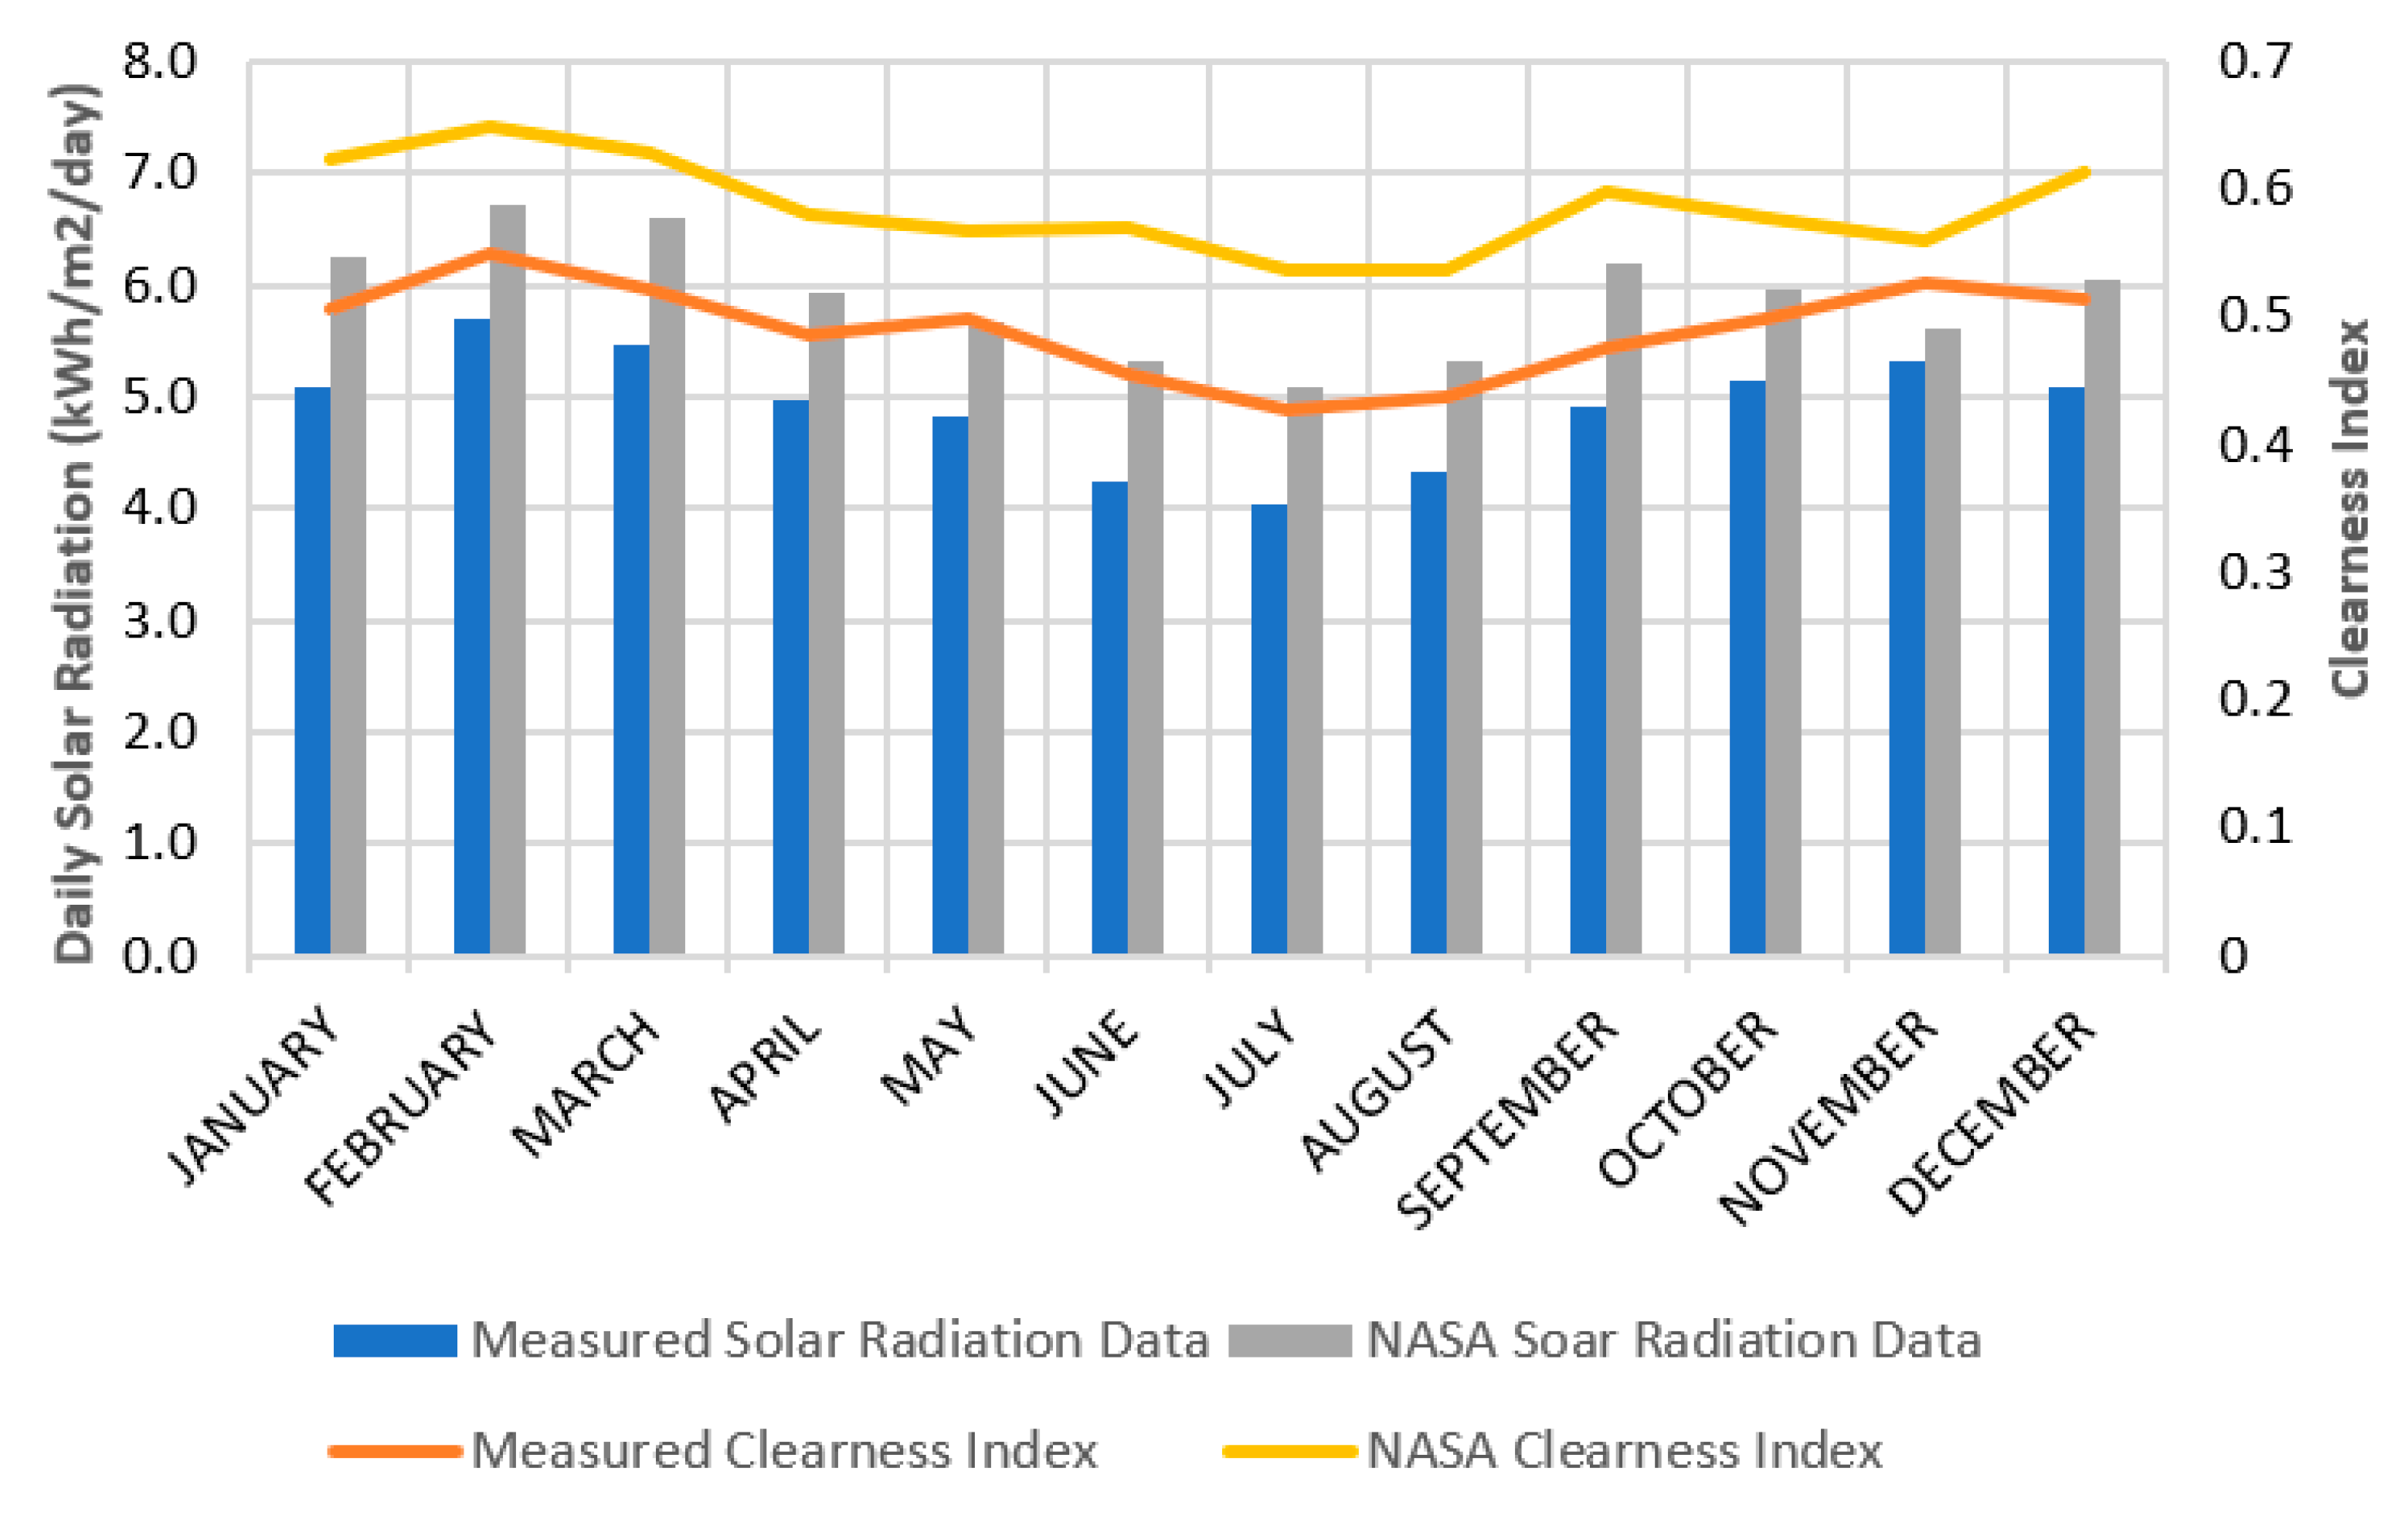
4.1. Solar Radiation
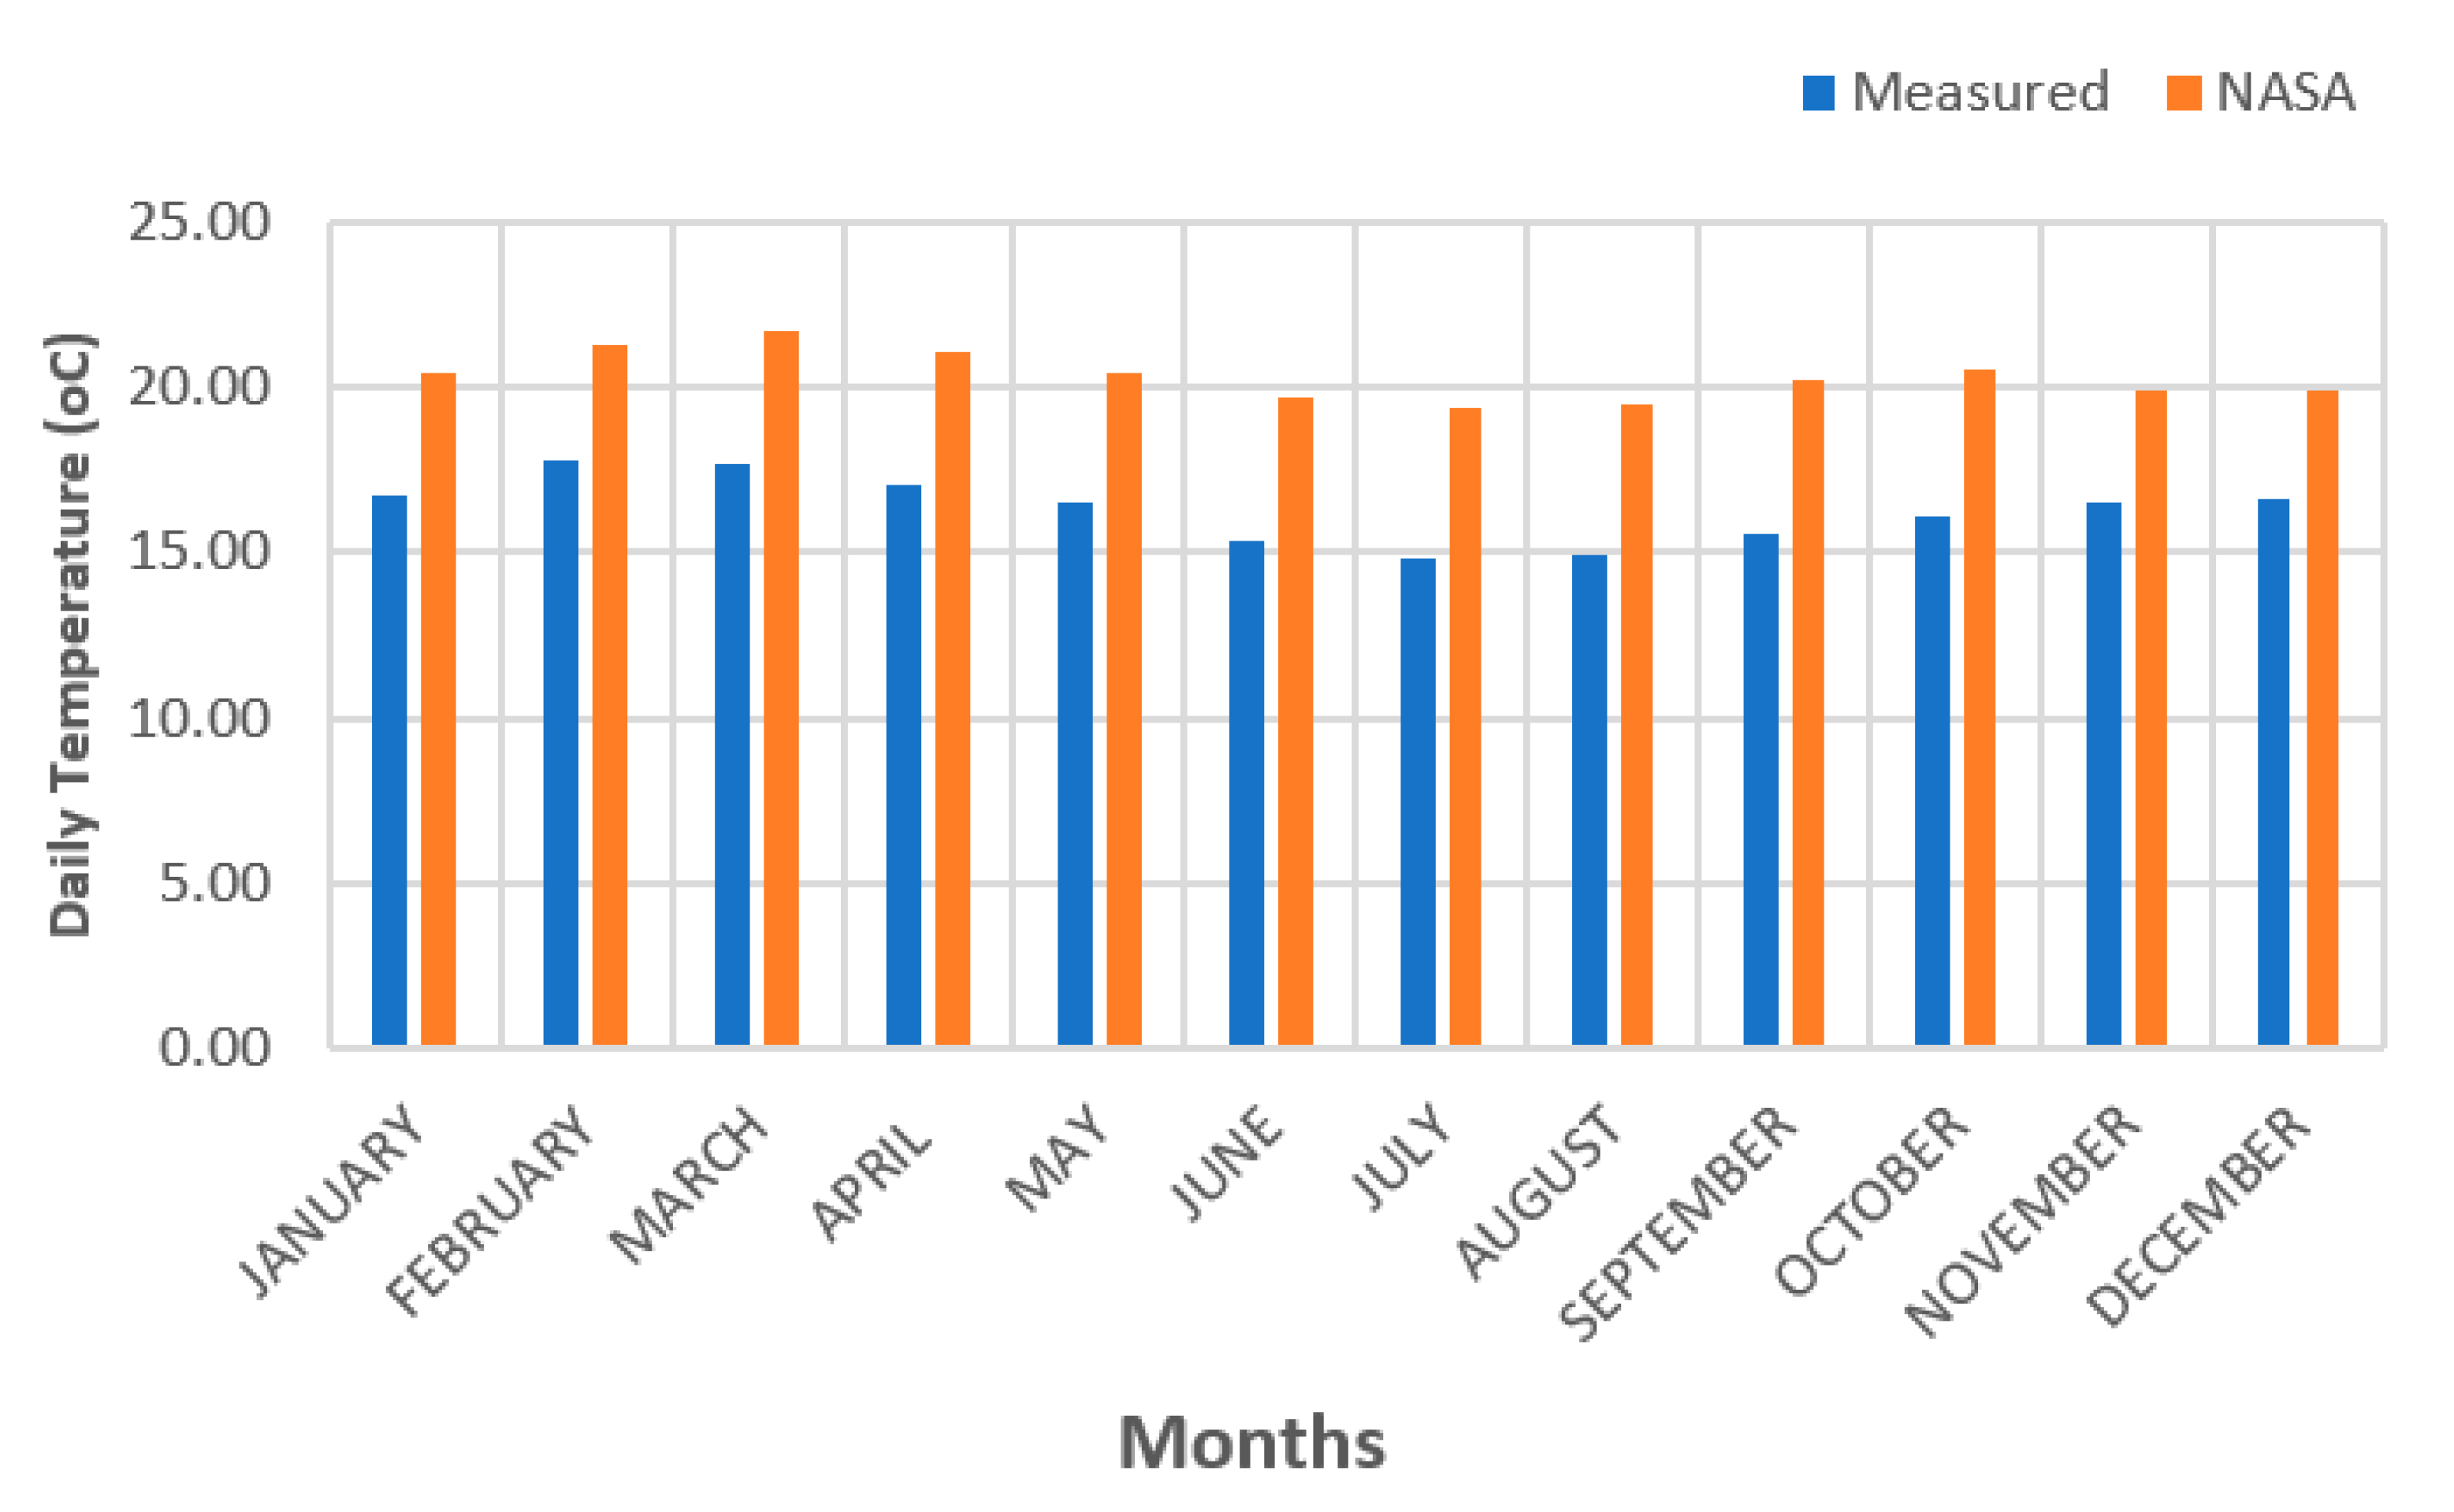
4.2. Temperature
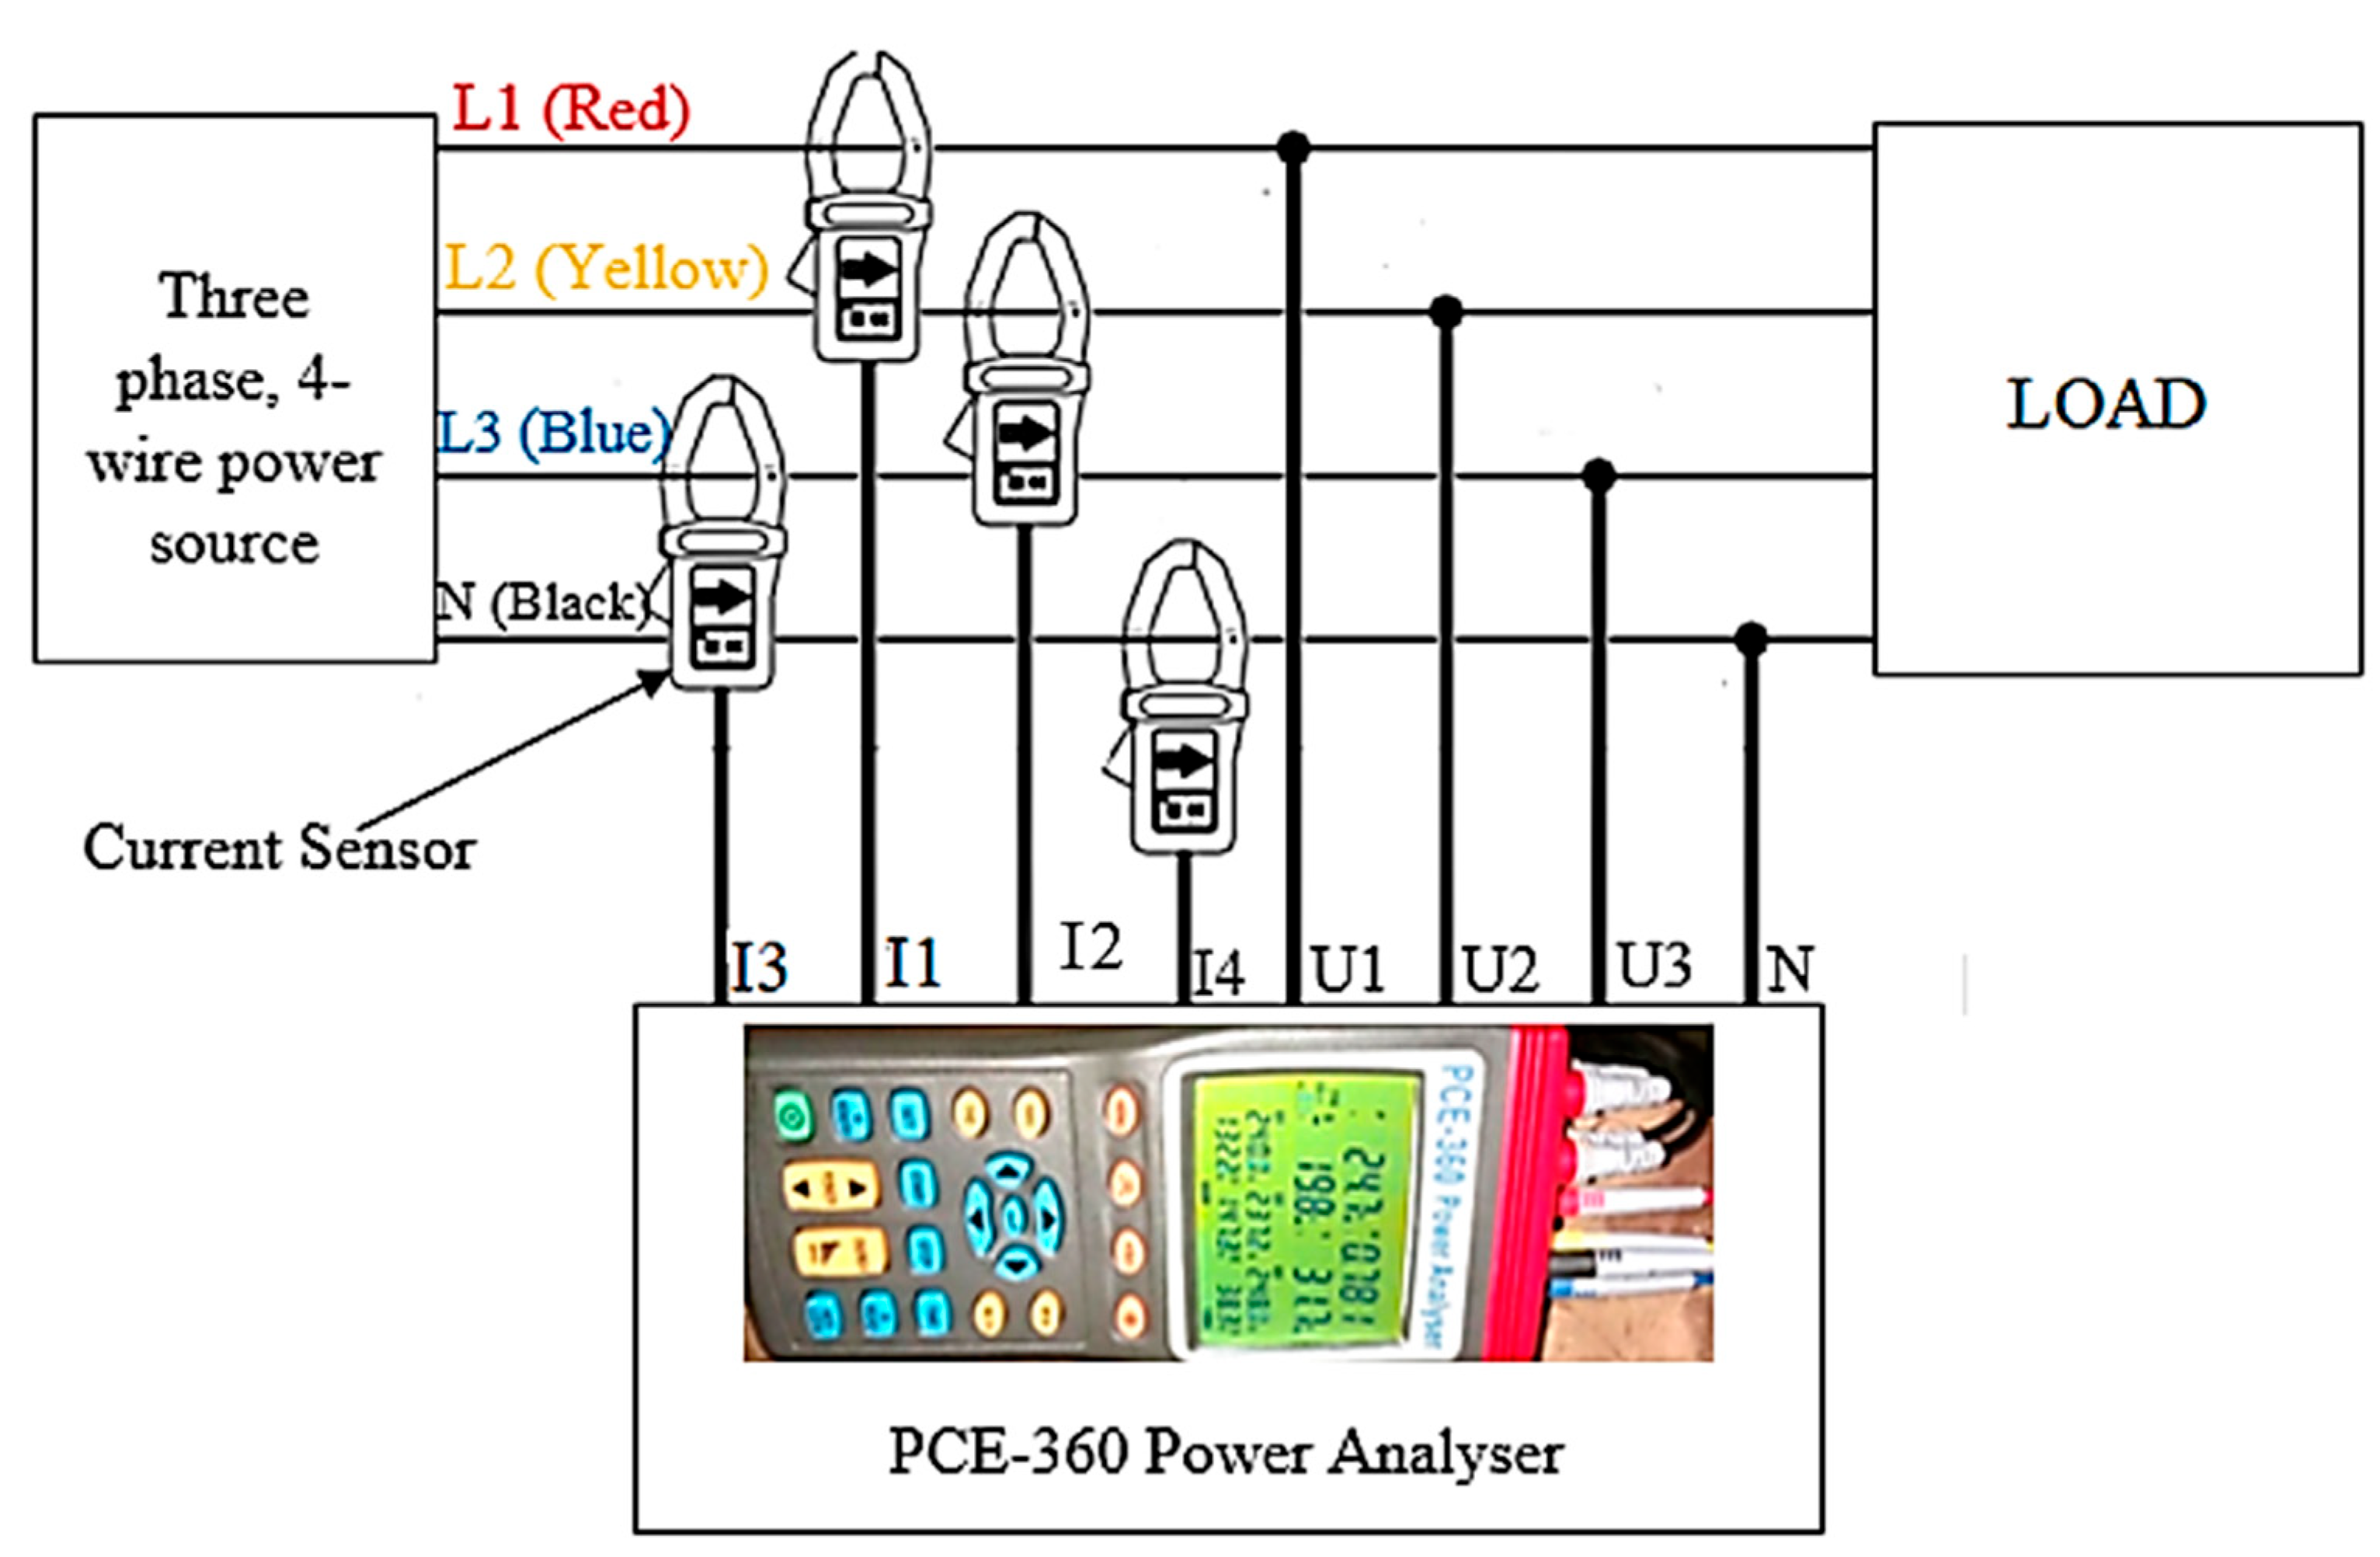
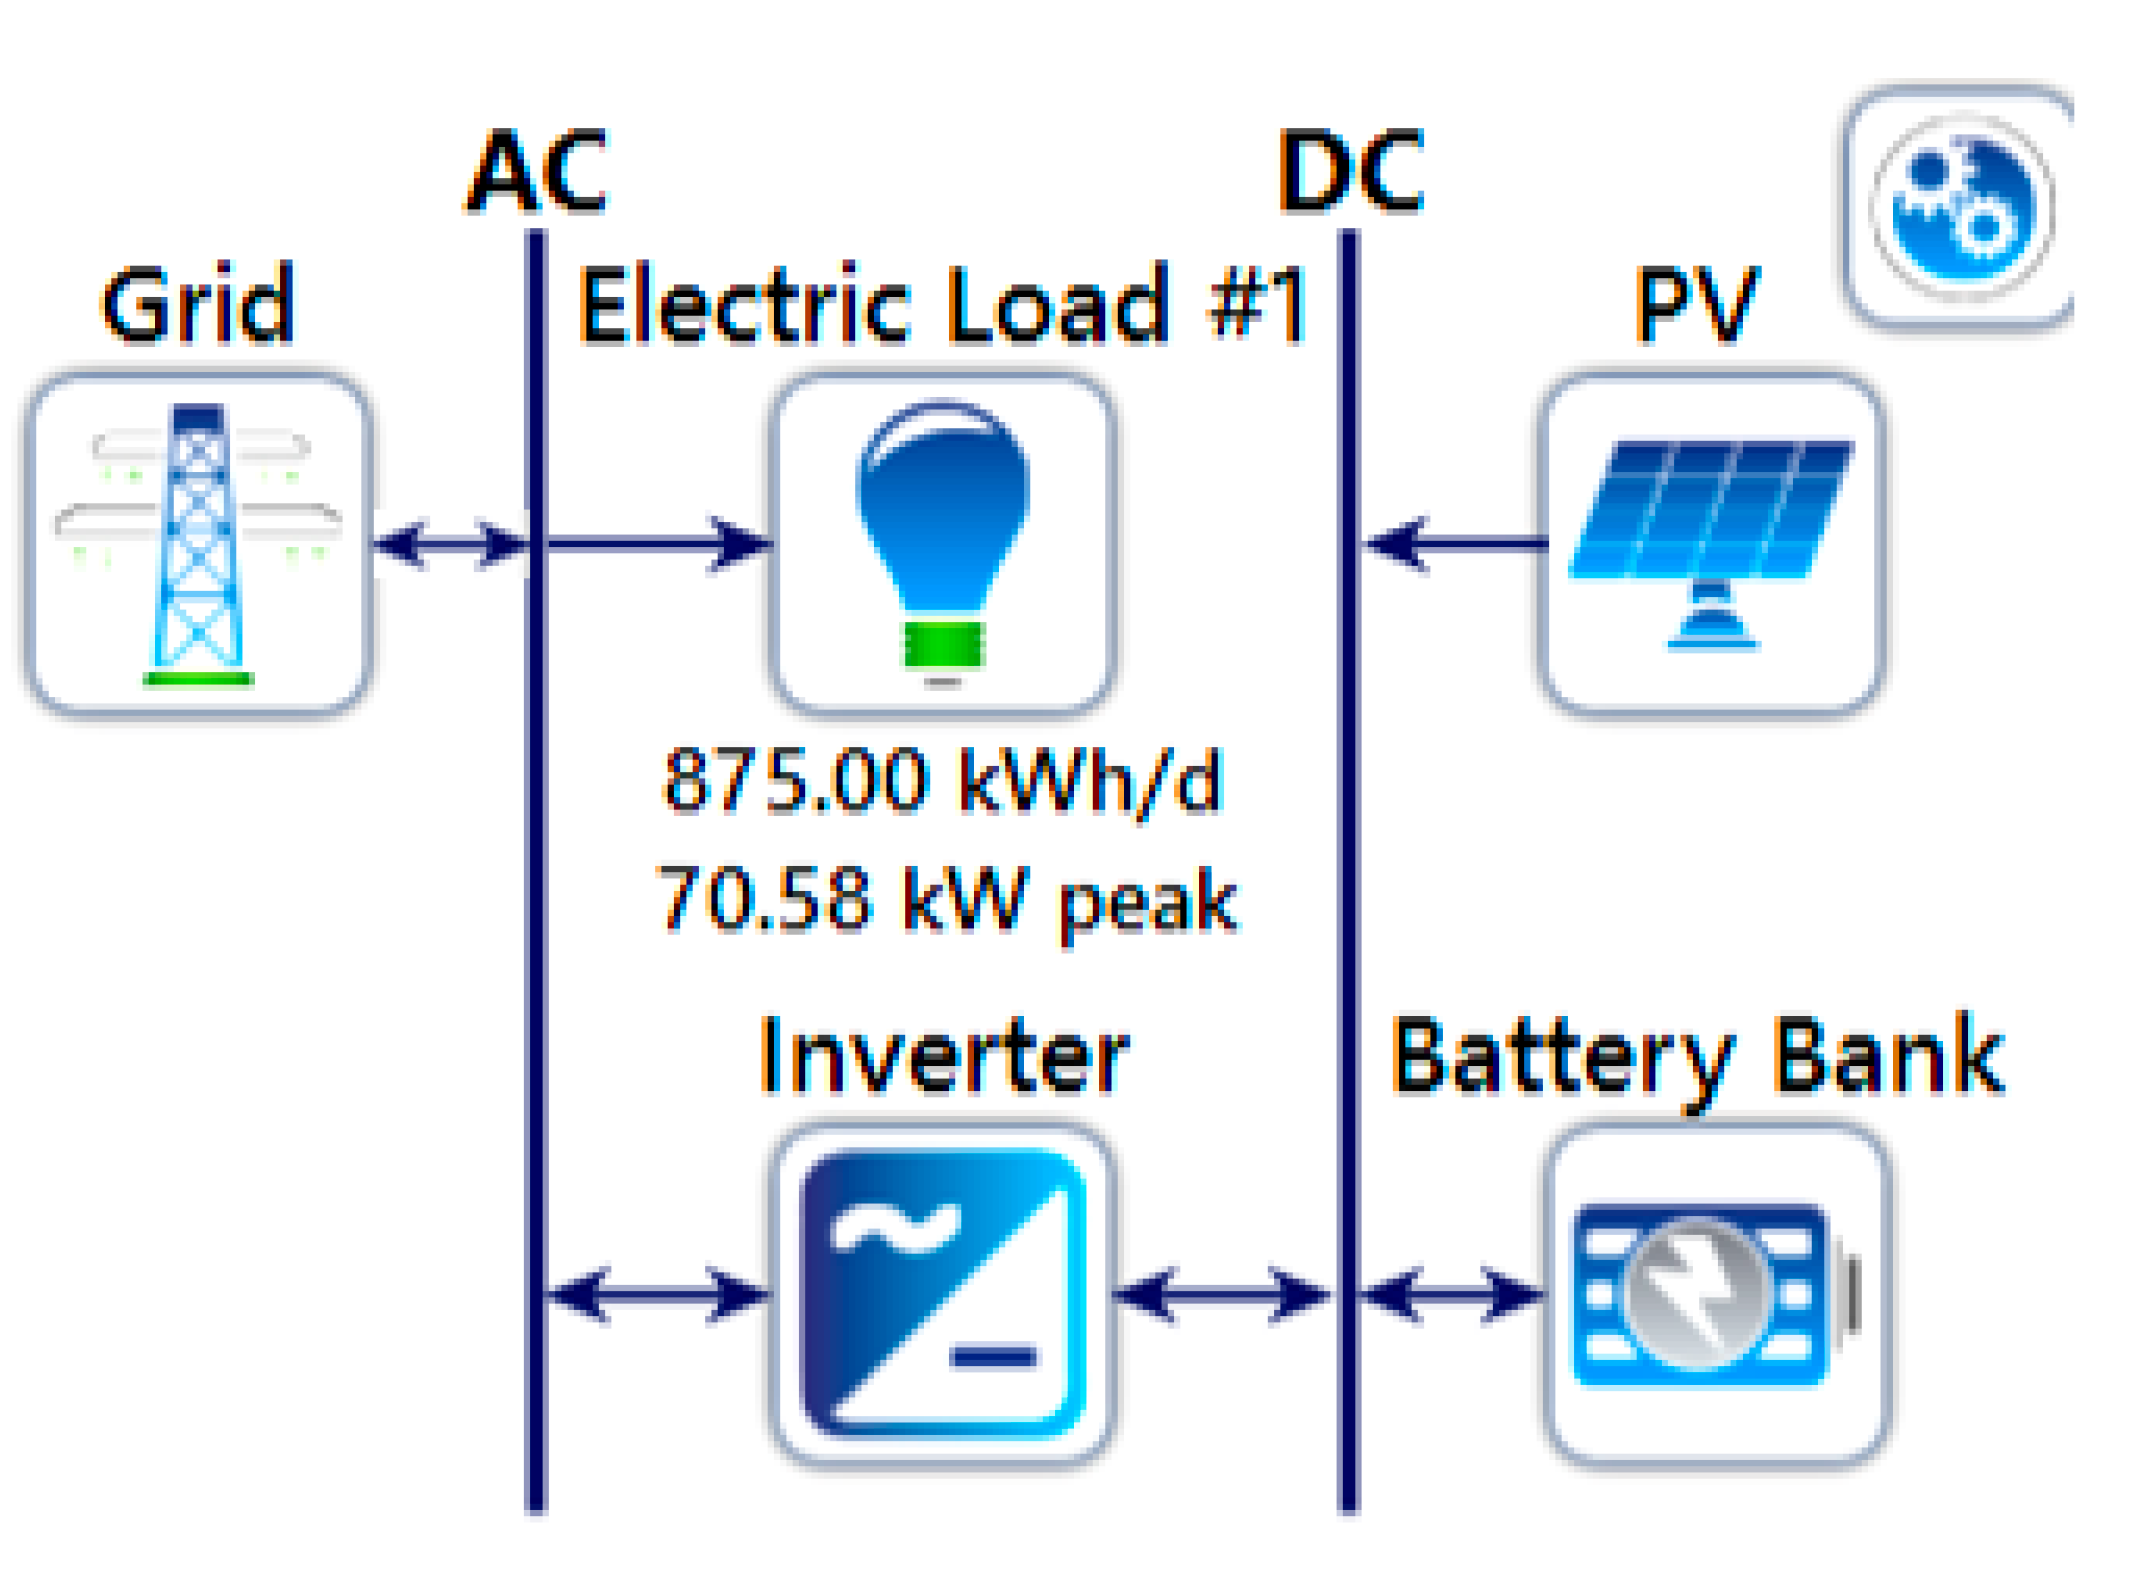
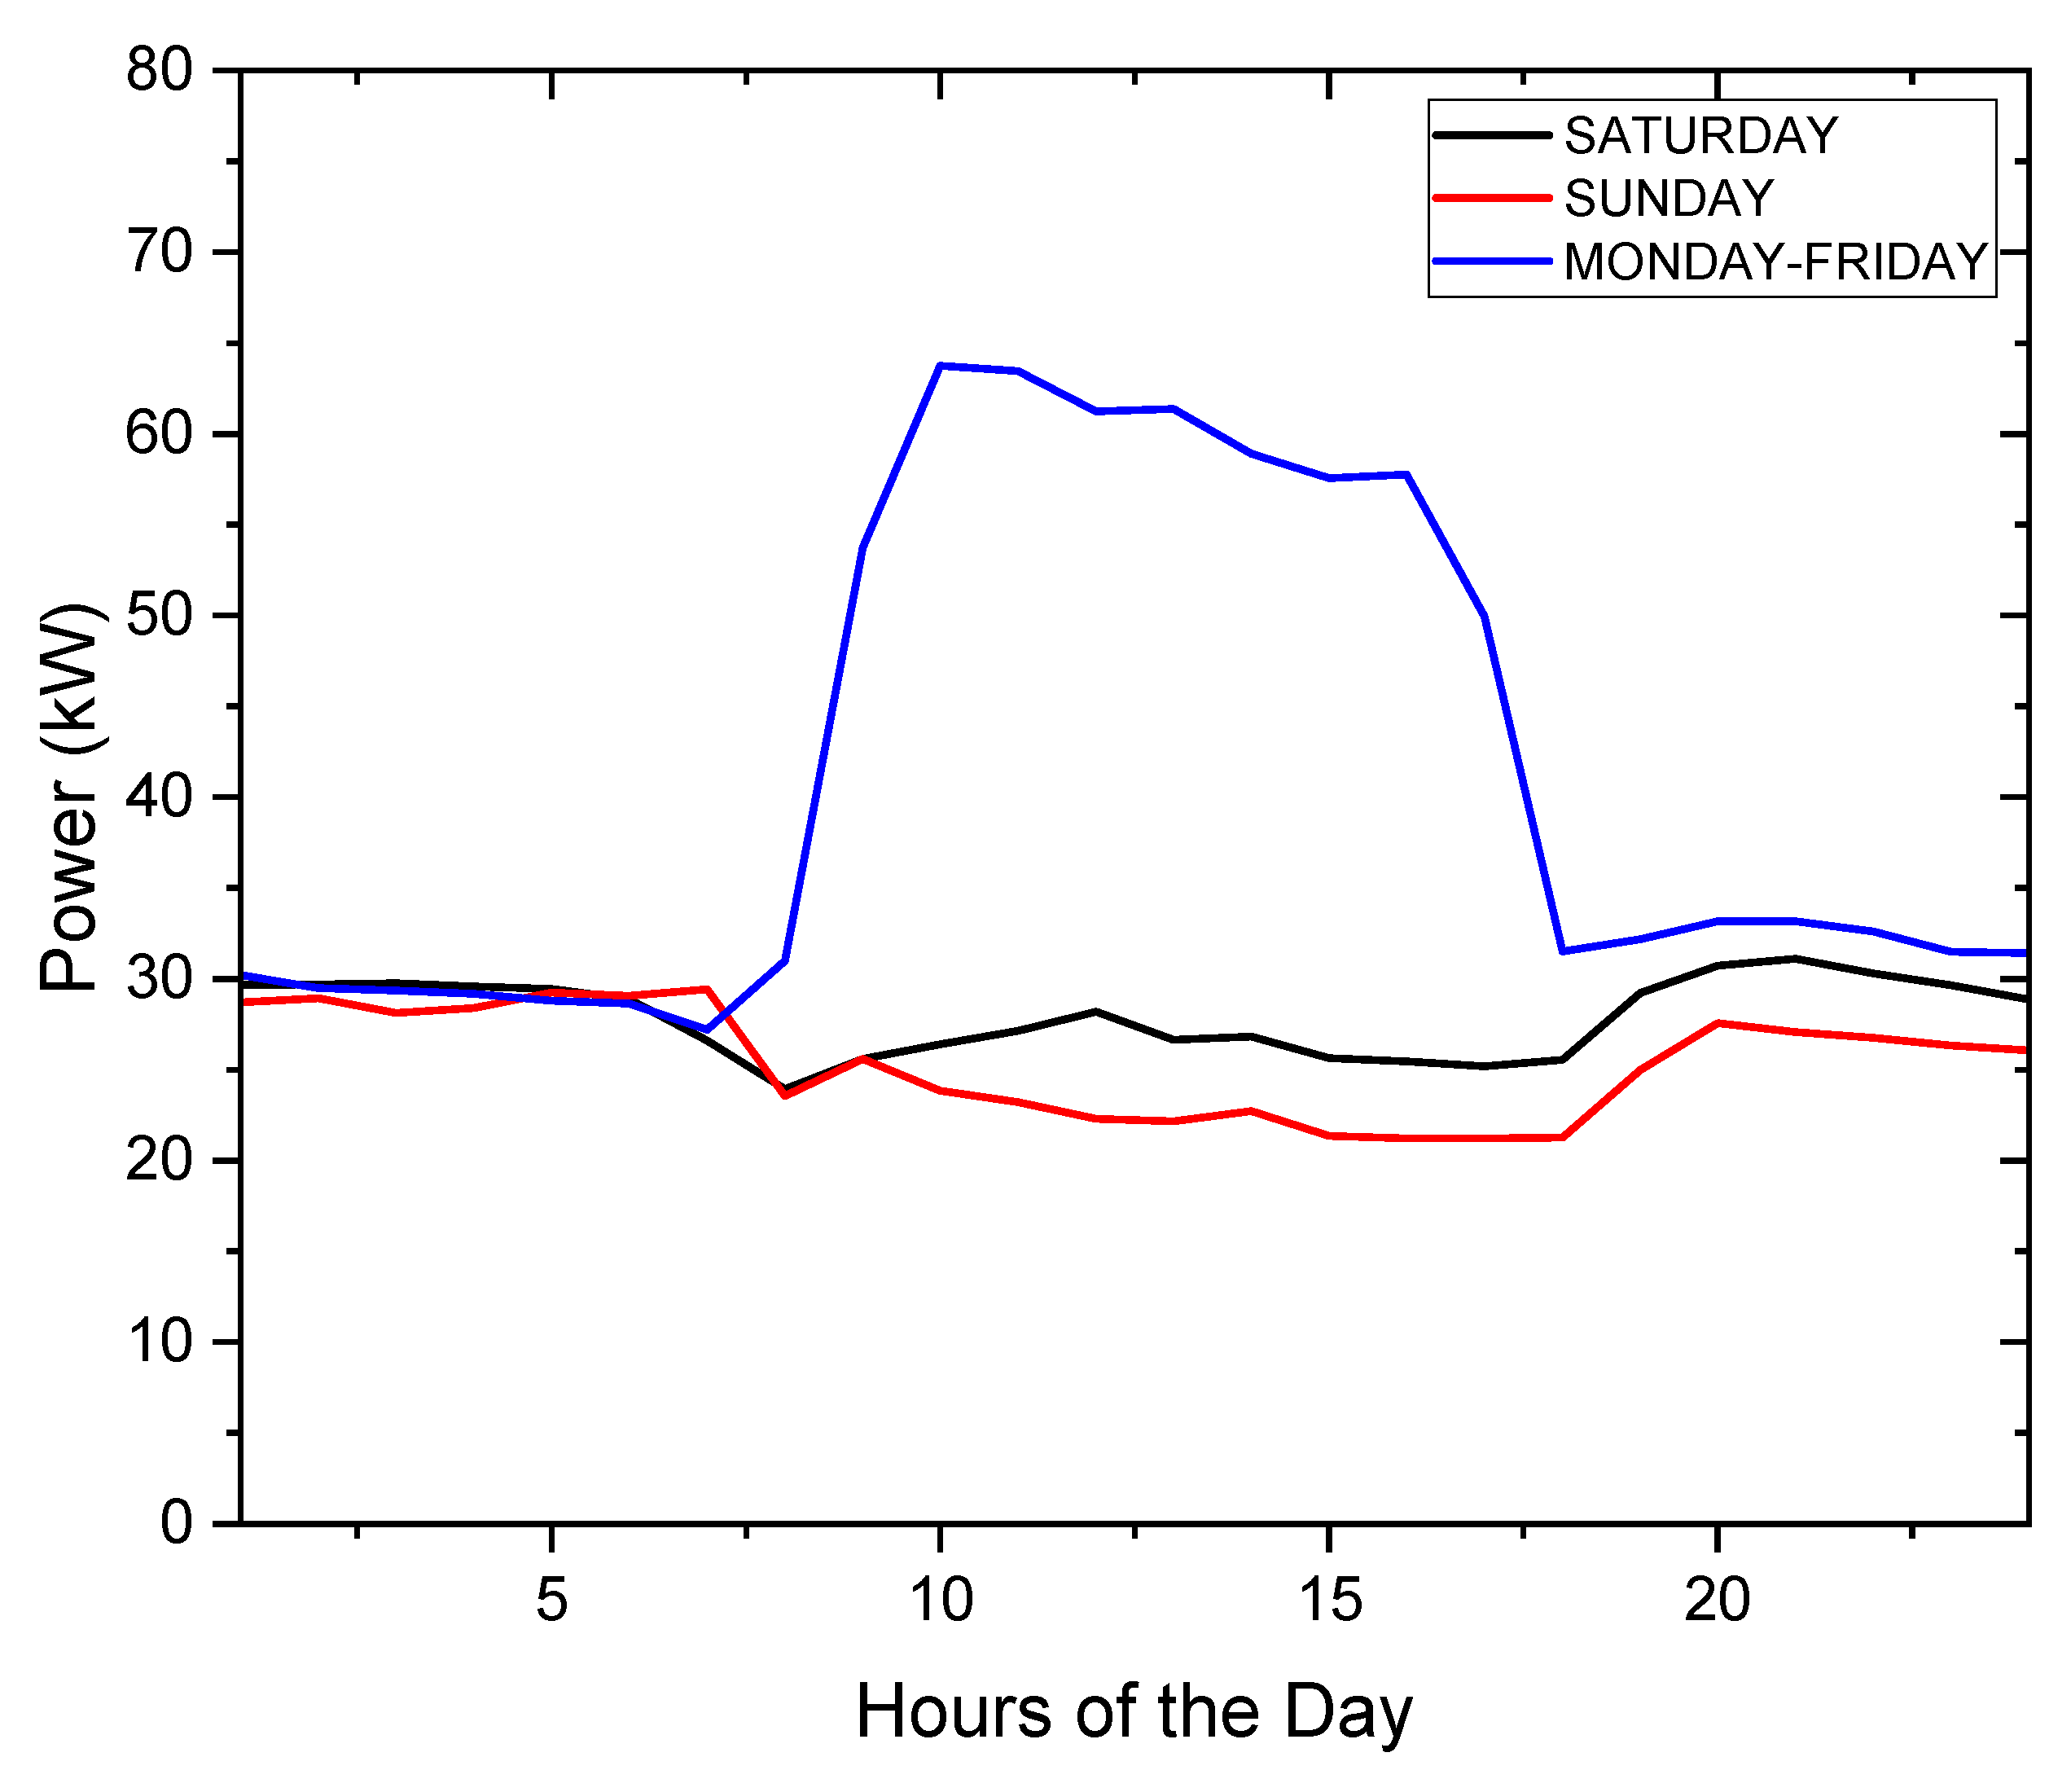
4.3. Load Demand
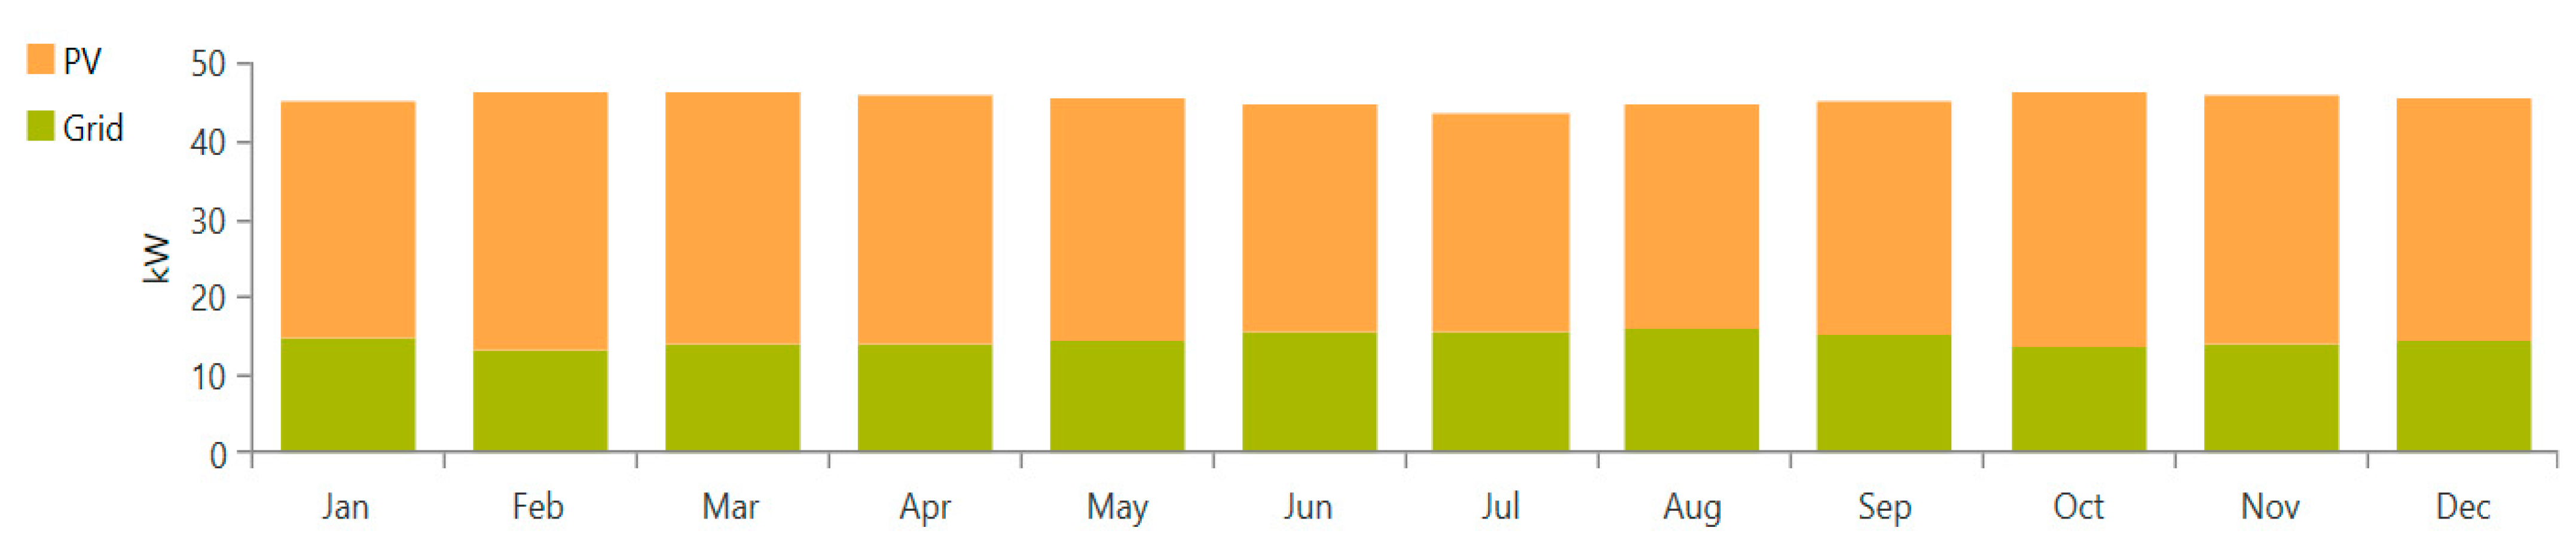
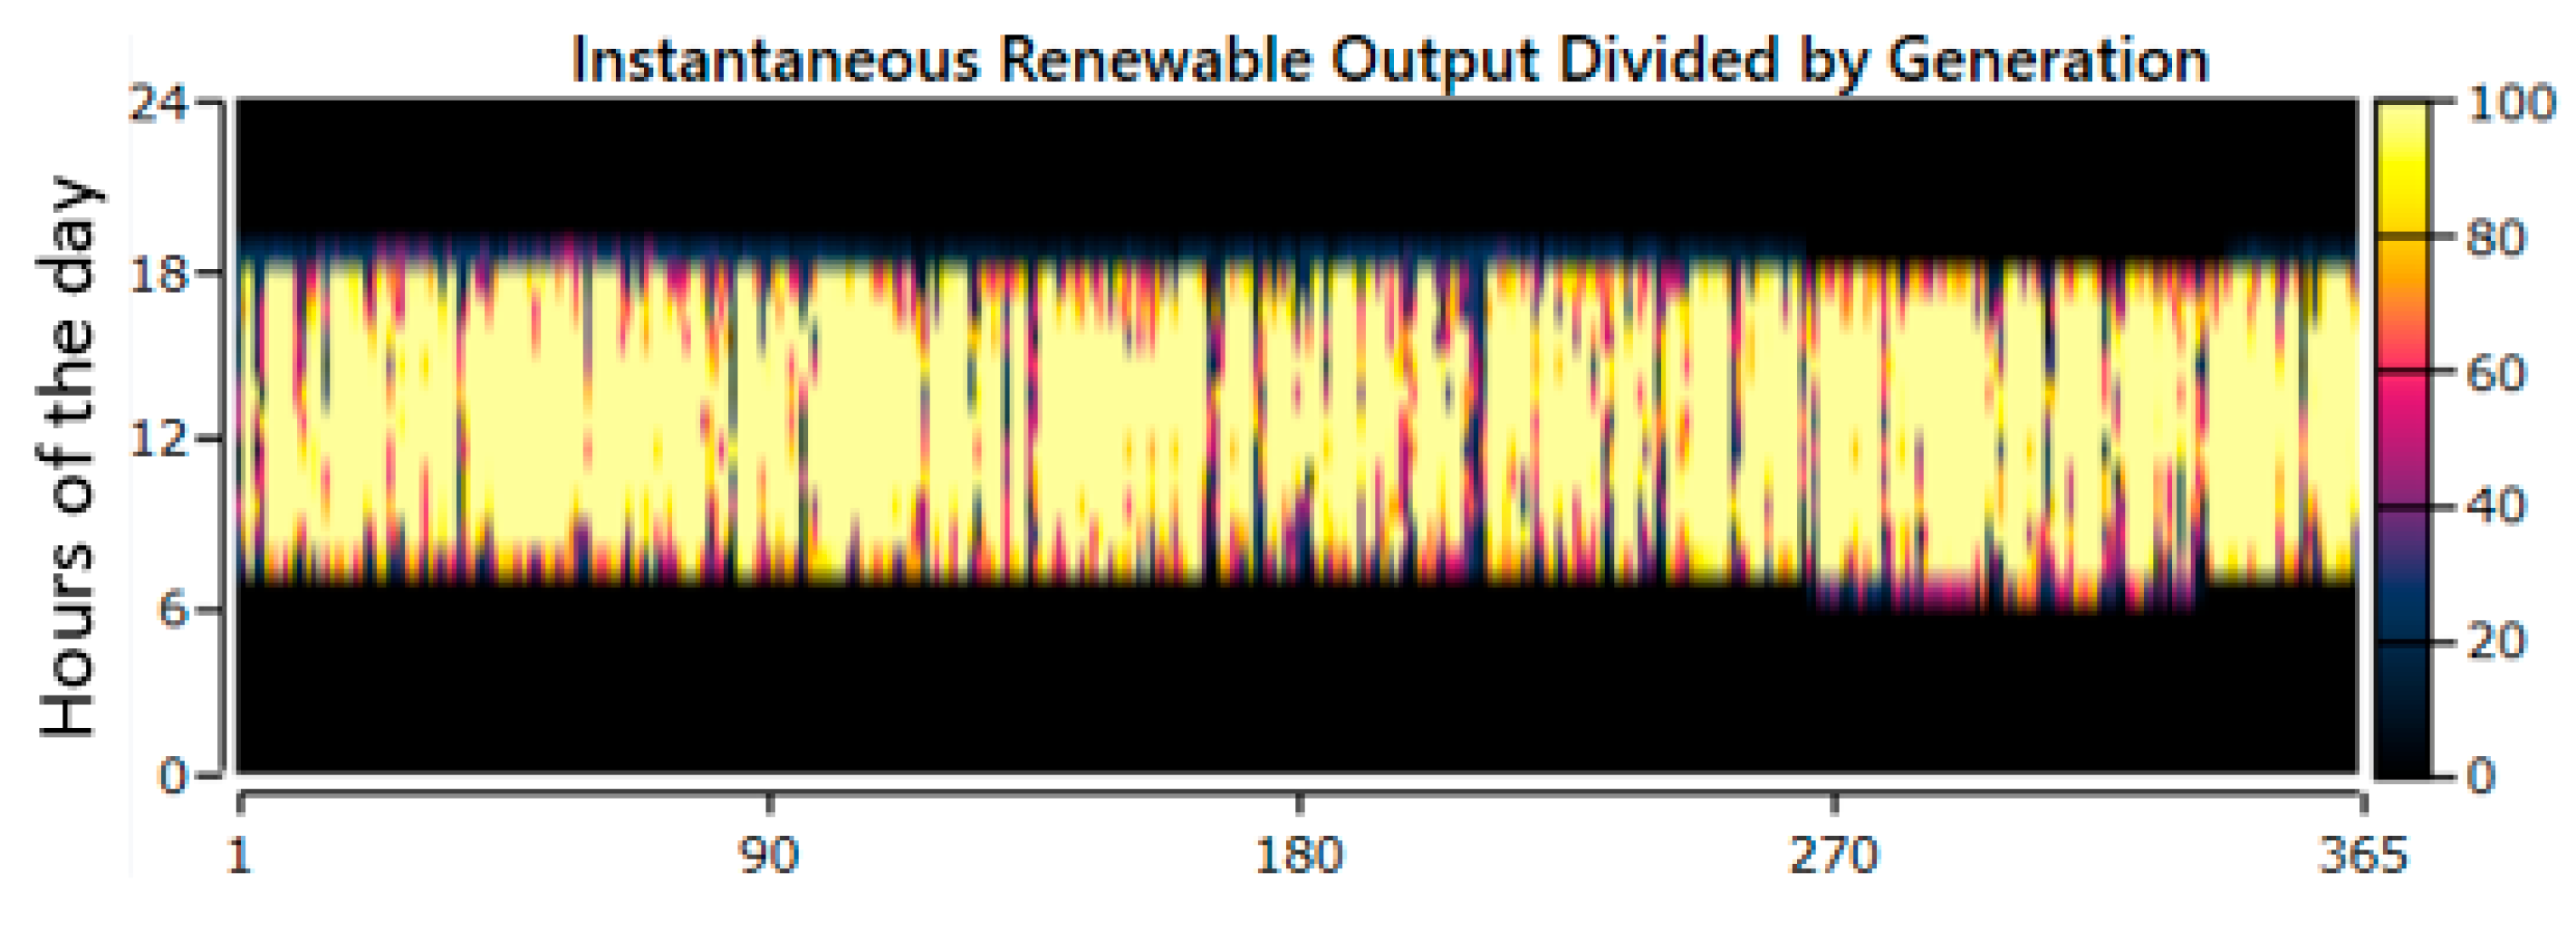
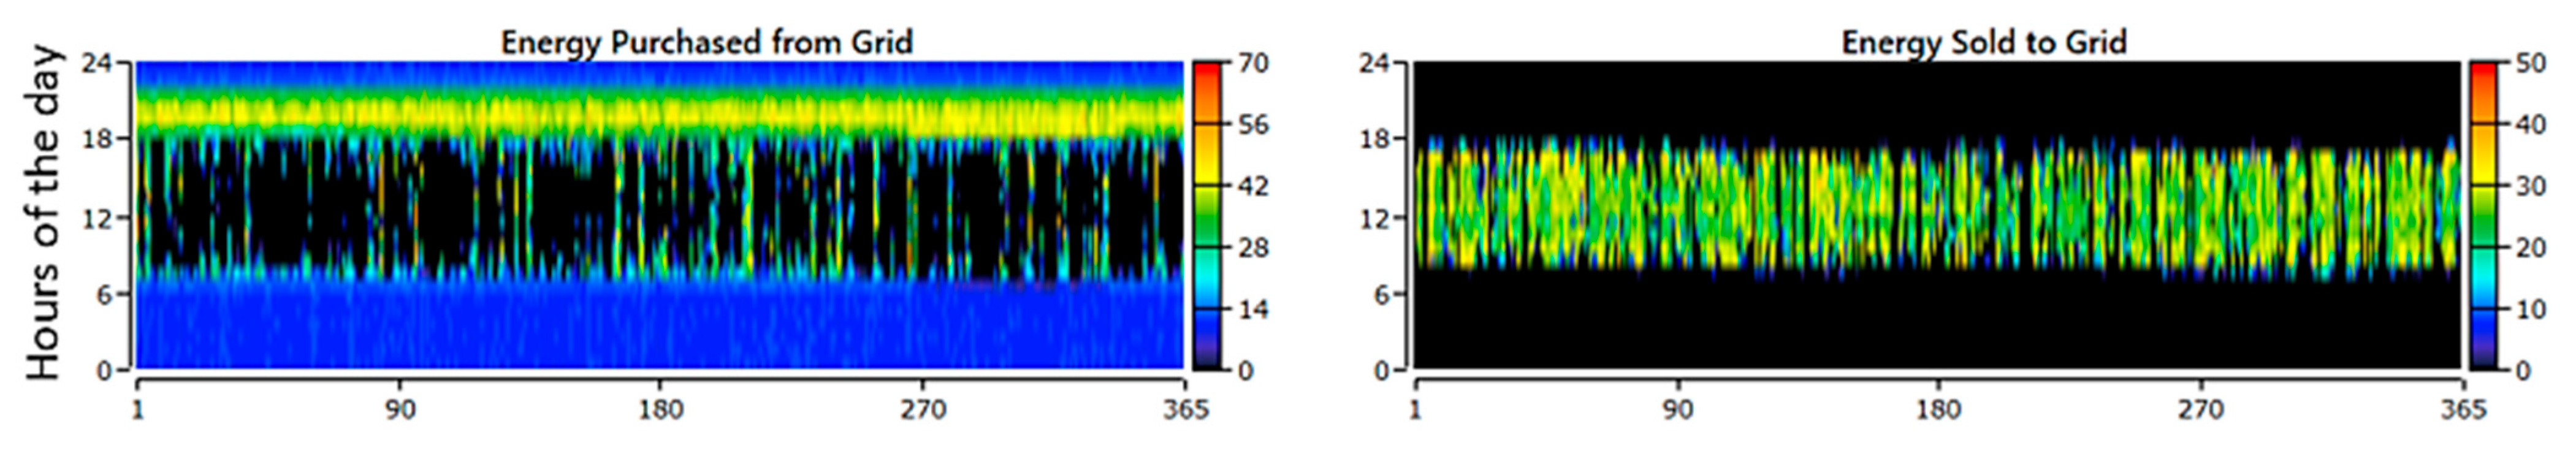
4.4. Technical Results from Simulations
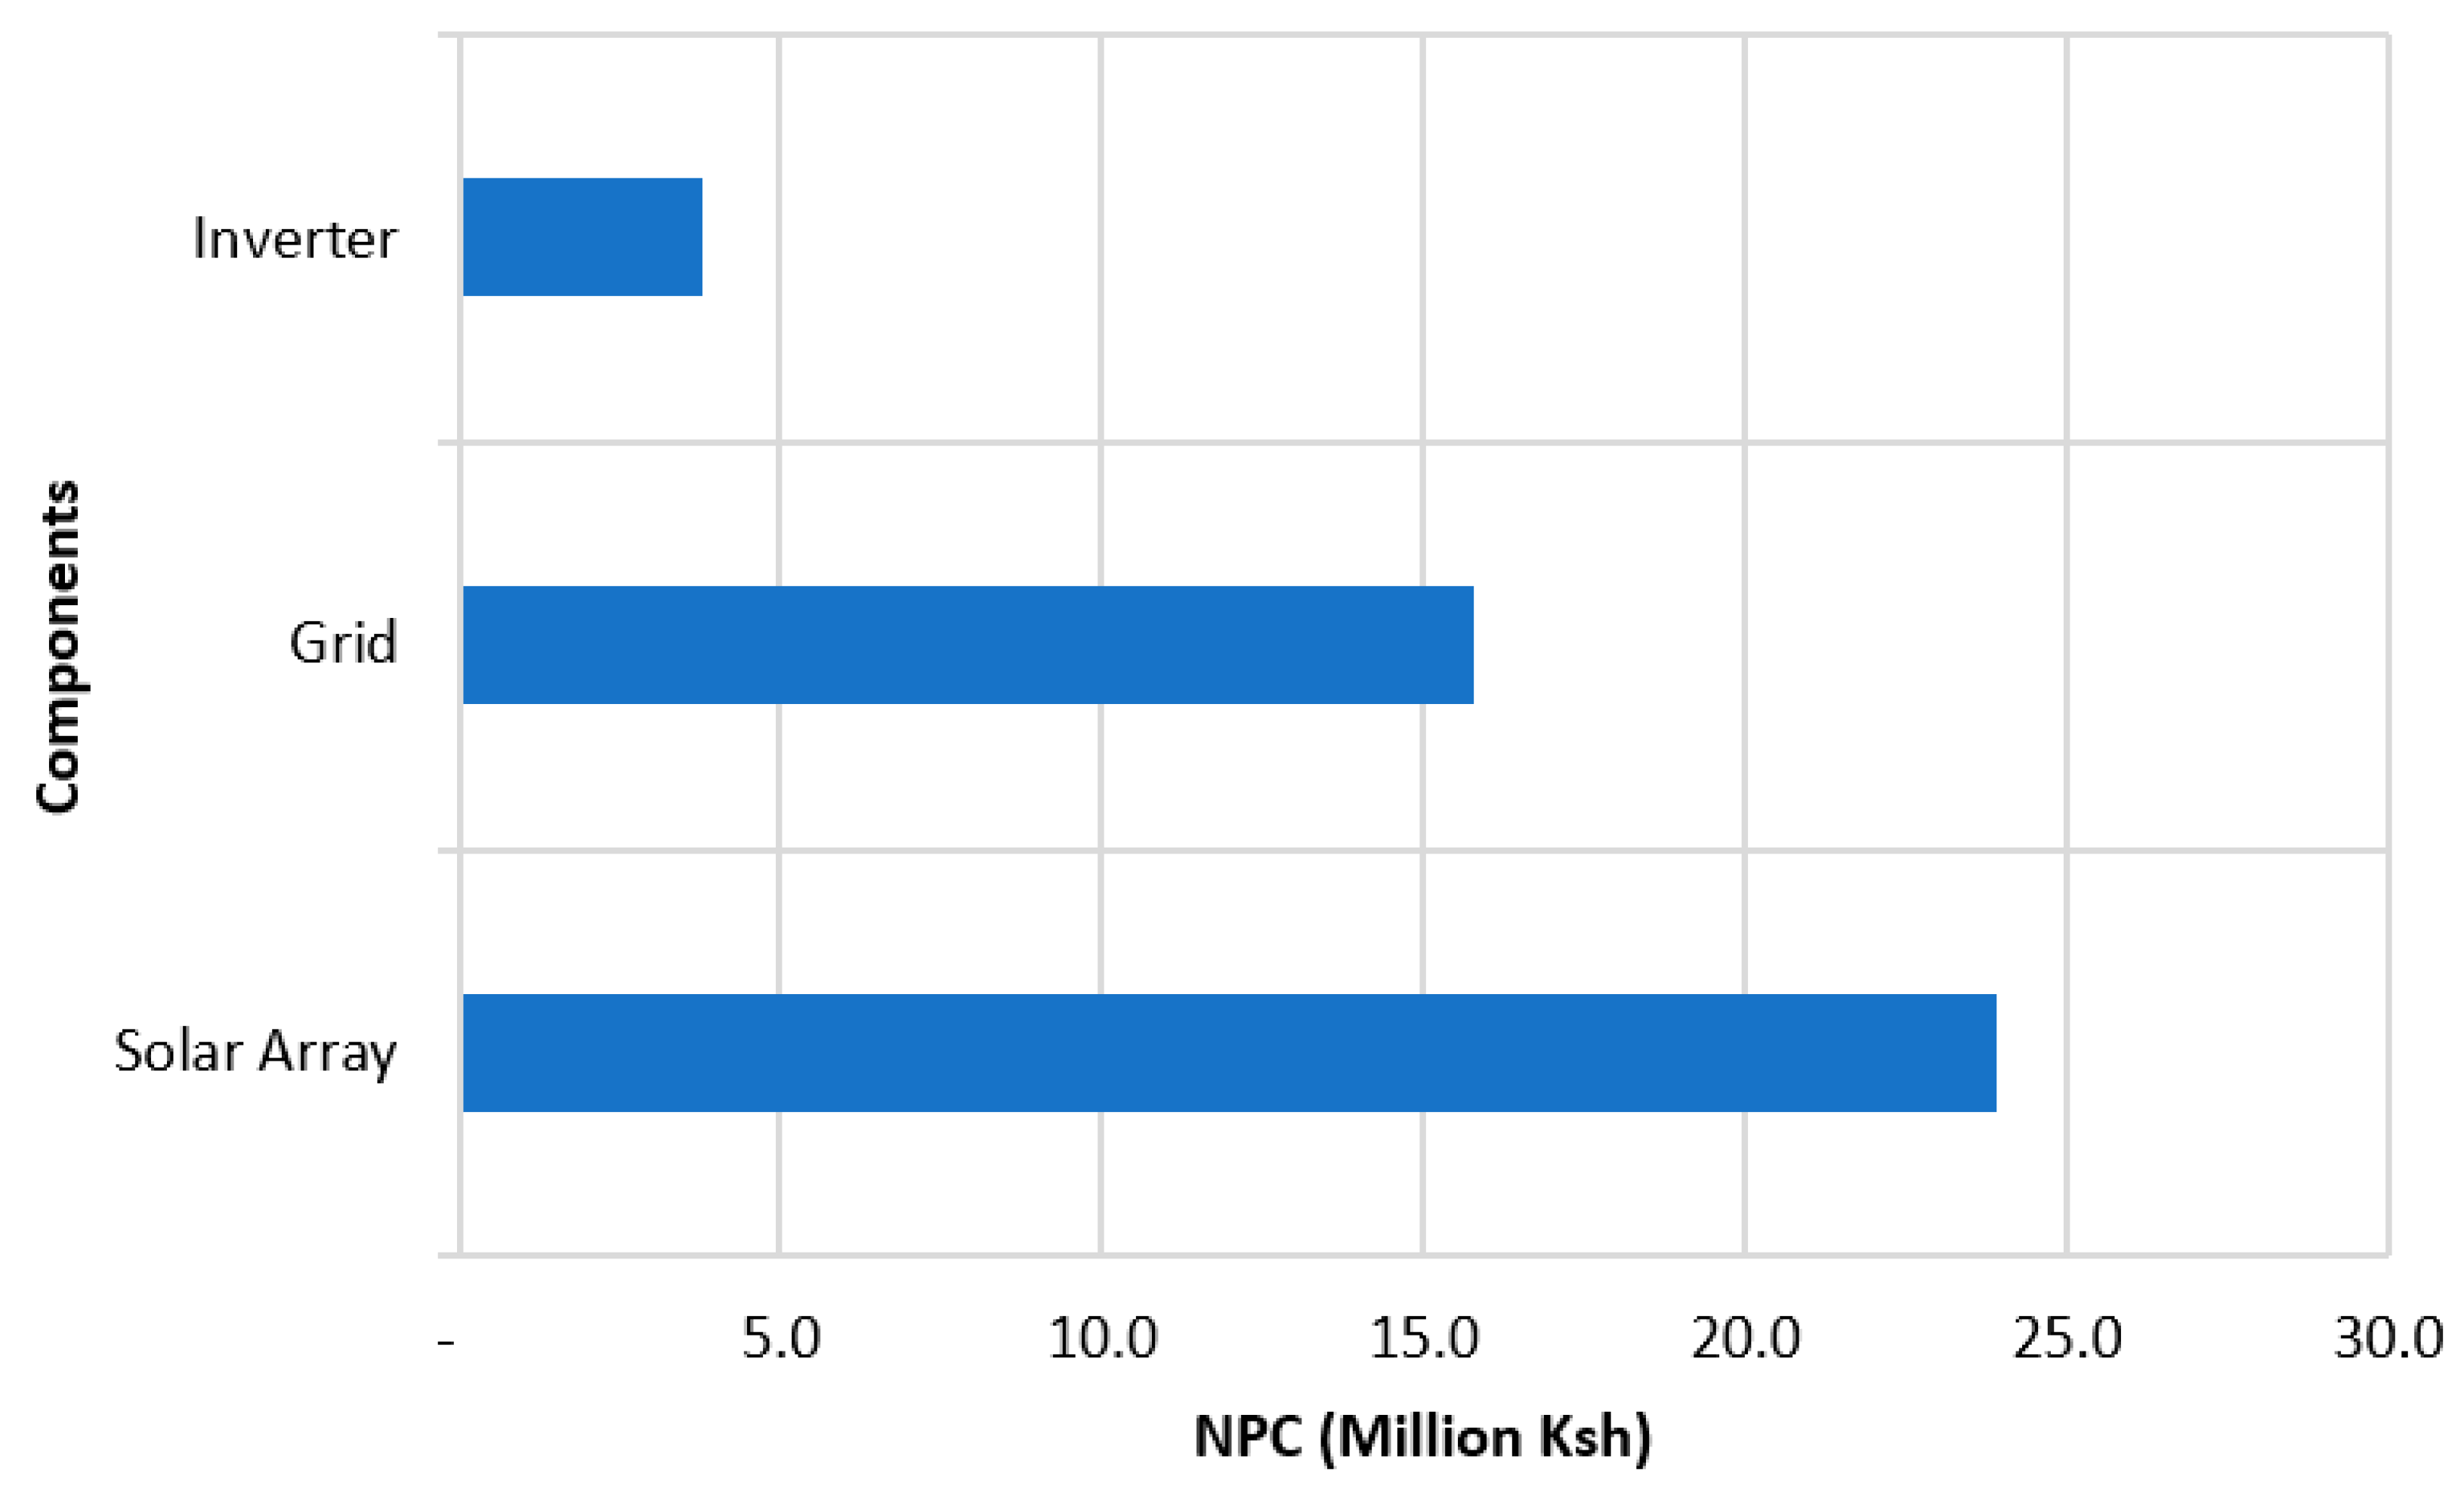
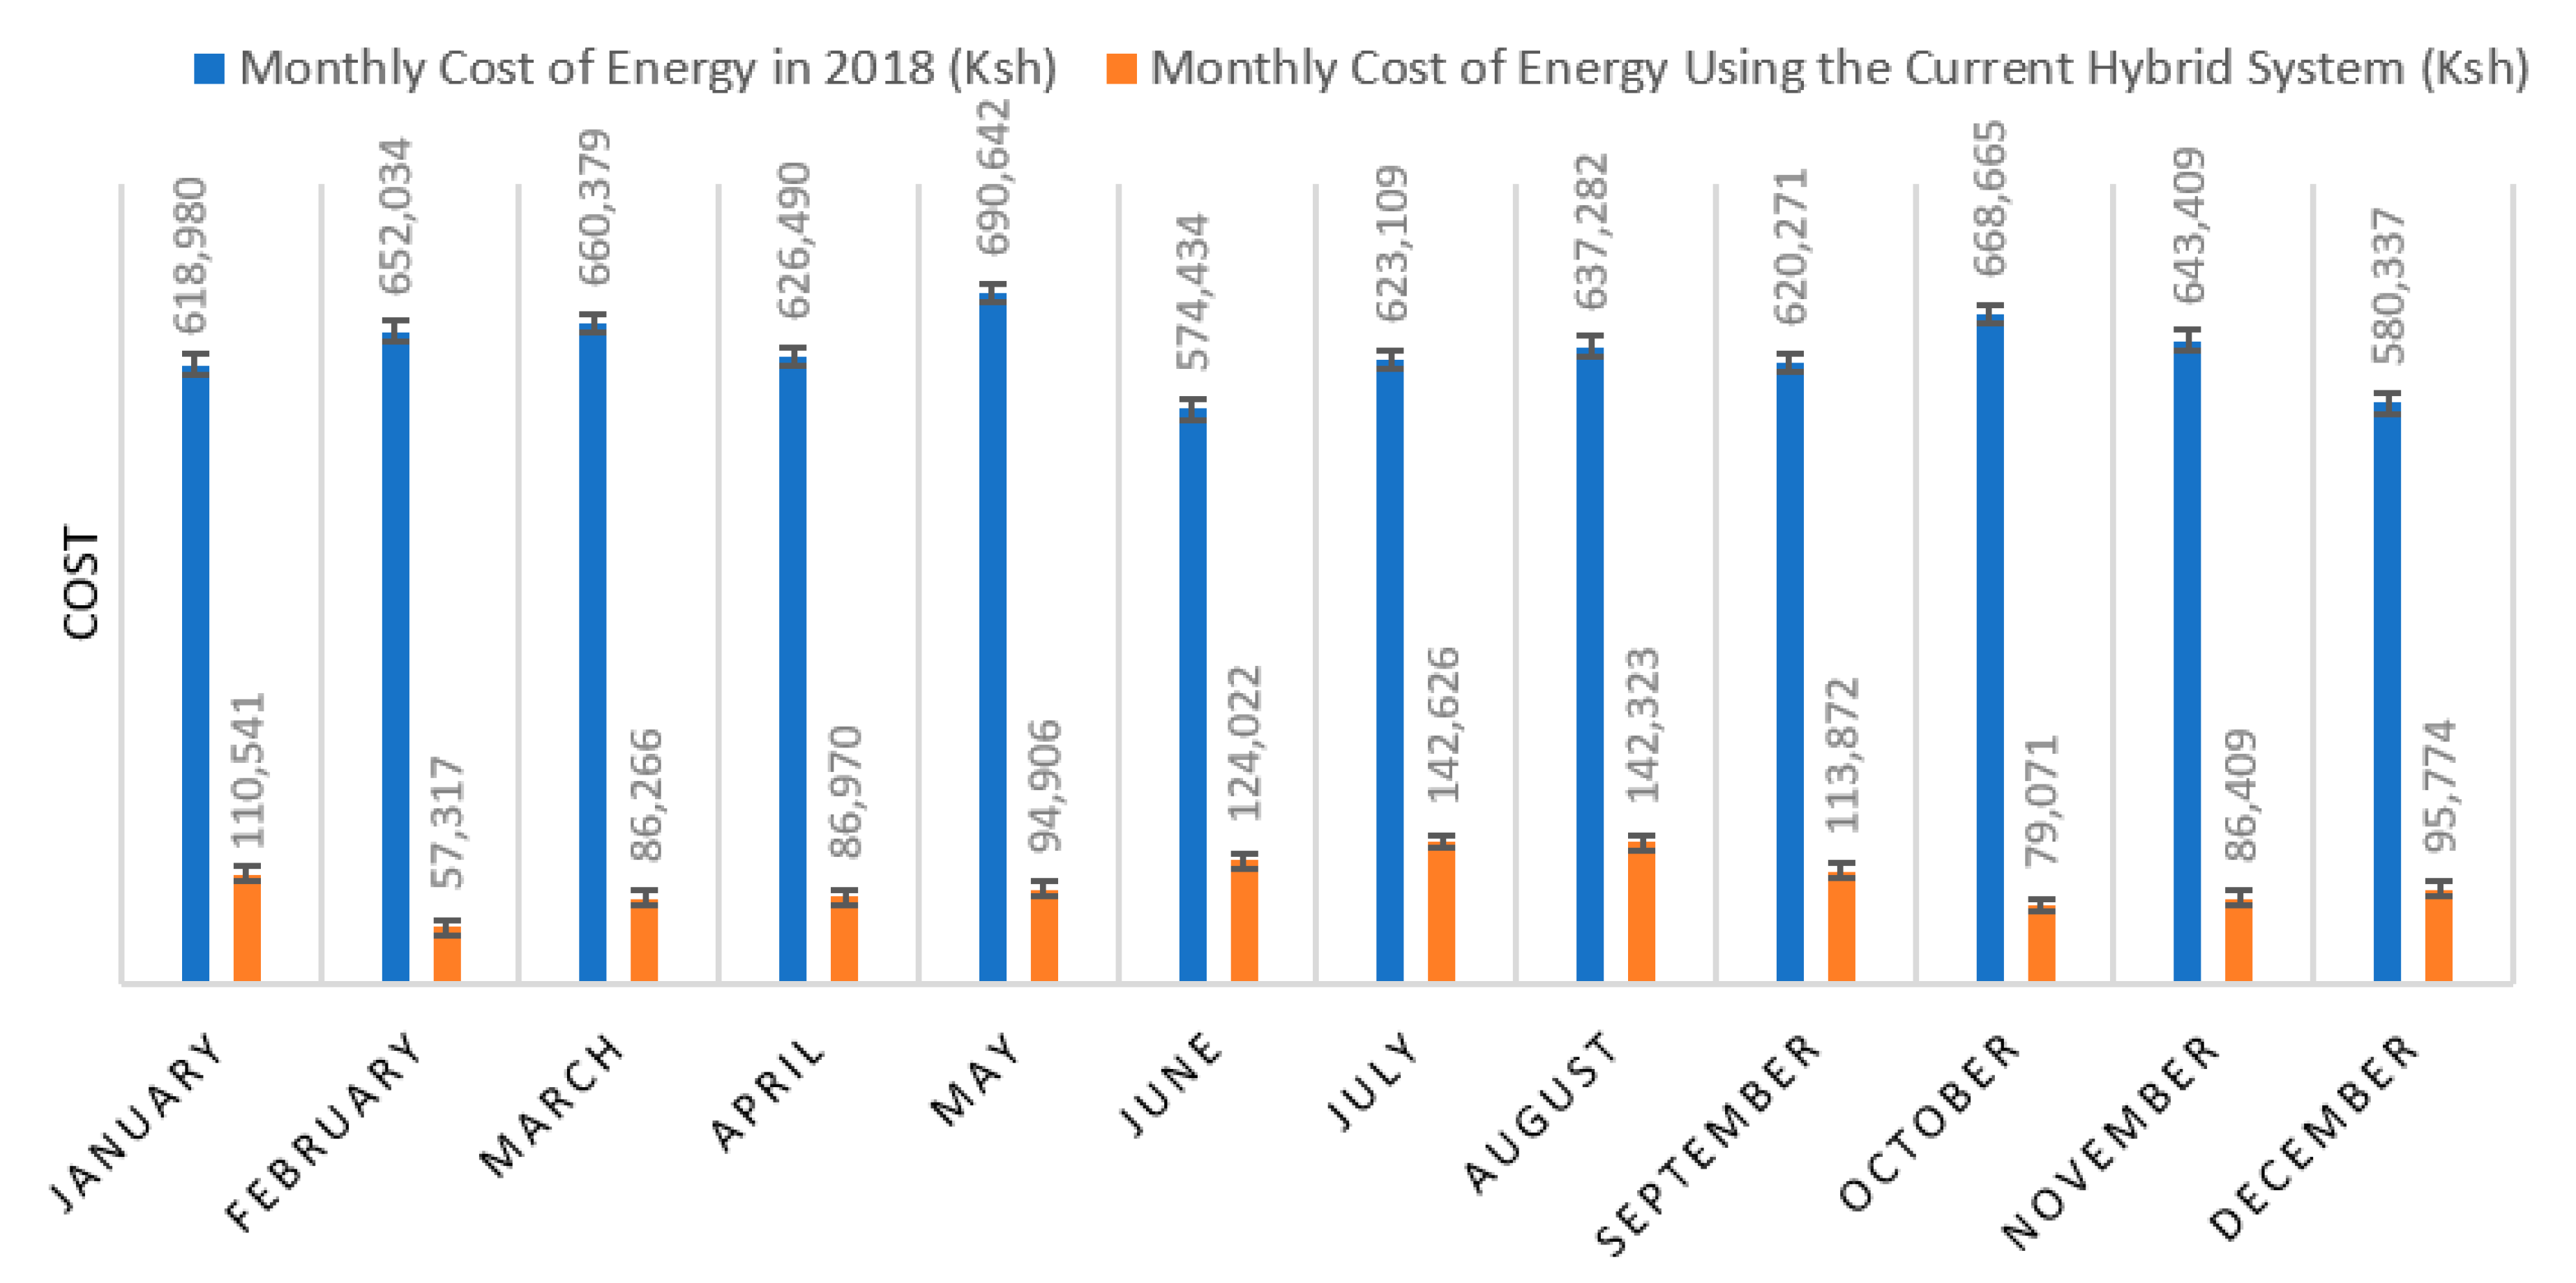
4.5. Economic Results from Simulations
5. Conclusions
Author Contributions
Funding
Institutional Review Board Statement
Informed Consent Statement
Data Availability Statement
Acknowledgments
Conflicts of Interest
References
- Huerdo, C.S.-R.Y.; Allende-Arandía, M.E.; Figueroa-Espinoza, B.; García-Caballero, E.; Esparza, A.C.-R.; Appendini, C.M. Hybrid Renewable Energy System for Terminos Lagoon, Campeche, Mexico. Energies 2023, 16, 3972. [Google Scholar] [CrossRef]
- Nazari-Heris, M.; Tamaskani Esfehankalateh, A.; Ifaei, P. Hybrid Energy Systems for Buildings: A Techno-Economic-Enviro Systematic Review. Energies 2023, 16, 4725. [Google Scholar] [CrossRef]
- Osama abed el-Raouf, M.A.; Mageed, S.A.; Salama, M.M.; Mosaad, M.I.; AbdelHadi, H.A. Performance Enhancement of Grid-Connected Renewable Energy Systems Using UPFC. Energies 2023, 16, 4362. [Google Scholar] [CrossRef]
- Arévalo, P.; Tostado-Véliz, M.; Jurado, F. Repowering Feasibility Study of a Current Hybrid Renewable System. Case Study, Galapagos Islands. Electricity 2021, 2, 487–502. [Google Scholar] [CrossRef]
- Serem, N.; Letting, L.K.; Munda, J. Voltage Profile and Sensitivity Analysis for a Grid Connected Solar, Wind and Small Hydro Hybrid System. Energies 2021, 14, 3555. [Google Scholar] [CrossRef]
- Rönkkö, J.; Khosravi, A.; Syri, S. Techno-Economic Assessment of a Hybrid Offshore Wind–Wave Farm: Case Study in Norway. Energies 2023, 16, 4316. [Google Scholar] [CrossRef]
- Papazis, S.A. Integrated Economic Optimization of Hybrid Thermosolar Concentrating System Based on Exact Mathematical Method. Energies 2022, 15, 7019. [Google Scholar] [CrossRef]
- International Energy Agency; United Nations; International Renewable Energy Agency; World Bank; World Health Organization. Tracking SDG7: The Energy Progress Report 2022. Available online: https://iea.blob.core.windows.net/assets/37fb9f89-71de-407f-8ff4-12f46ec20a16/TrackingSDG7TheEnergyProgressReport2022.pdf (accessed on 2 January 2024).
- Wamalwa, F.; Williams, N.J. Integration of an Off-Grid Solar-PV-Battery System after Grid Connection Using Model Predictive Control: A Case Study in Kenya. In Proceedings of the 2021 IEEE PES/IAS PowerAfrica, Nairobi, Kenya, 23–27 August 2021; IEEE: Piscataway, NJ, USA, 2021; pp. 1–5. [Google Scholar]
- Yimen, N.; Tchotang, T.; Kanmogne, A.; Idriss, I.A.; Musa, B.; Aliyu, A.; Okonkwo, E.C.; Abba, S.I.; Tata, D.; Meva’a, L.; et al. Optimal Sizing and Techno-Economic Analysis of Hybrid Renewable Energy Systems—A Case Study of a Photovoltaic/Wind/Battery/Diesel System in Fanisau, Northern Nigeria. Processes 2020, 8, 1381. [Google Scholar] [CrossRef]
- Bashir, N.; Modu, B. Techno-Economic Analysis of off-Grid Renewable Energy Systems for Rural Electrification in Northeastern Nigeria. Int. J. Renew. Energy Res. 2018, 8, 1217–1228. [Google Scholar]
- Trotter, P.A.; Mcmanus, M.C.; Maconachie, R. Electricity Planning and Implementation in Sub-Saharan Africa: A Systematic Review. Renew. Sustain. Energy Rev. 2017, 74, 1189–1209. [Google Scholar] [CrossRef]
- Yimen, N.; Hamandjoda, O.; Meva’a, L.; Ndzana, B.; Nganhou, J. Analyzing of a Photovoltaic/Wind/Biogas/Pumped-Hydro off-Grid Hybrid System for Rural Electrification in Sub-Saharan Africa–Case Study of Djoundé in Northern Cameroon. Energies 2018, 11, 2644. [Google Scholar] [CrossRef]
- Da Silva, I.; Ronoh, G.; Ouma, C.; Jerono, C. Reducing Carbon Emissions in a Third Level Educational Institution in Sub-Sahara Africa. In Transformative Approaches to Sustainable Development at Universities; Springer: Berlin/Heidelberg, Germany, 2015; pp. 513–524. [Google Scholar]
- Eze, F.; Ogola, J.; Kivindu, R.; Egbo, M.; Obi, C. Technical and Economic Feasibility Assessment of Hybrid Renewable Energy System at Kenyan Institutional Building: A Case Study. Sustain. Energy Technol. Assess. 2022, 51, 101939. [Google Scholar] [CrossRef]
- Makokha, A.B. Report of Proposed Grid-Tied Solar PV System for Moi University’s Administration Block and Margaret Thatcher Library; Moi University: Eldoret, Kenya, 2018. [Google Scholar]
- Alharthi, Y.Z.; Siddiki, M.K.; Chaudhry, G.M. Resource Assessment and Techno-Economic Analysis of a Grid-Connected Solar PV-Wind Hybrid System for Different Locations in Saudi Arabia. Sustainability 2018, 10, 3690. [Google Scholar] [CrossRef]
- Khisa, S.; Ebihara, R.; Dei, T. Dynamics of a Grid Connected Hybrid Wind-Solar and Battery System: Case Study in Naivasha-Kenya. Energy Procedia 2017, 138, 680–685. [Google Scholar] [CrossRef]
- Barakat, S.; Samy, M.M.; Eteiba, M.B.; Wahba, W.I. Viability Study of Grid Connected PV/Wind/Biomass Hybrid Energy System for a Small Village in Egypt. In Proceedings of the 2016 Eighteenth International Middle East Power Systems Conference (MEPCON), Cairo, Egypt, 27–29 December 2016; IEEE: Piscataway, NJ, USA, 2016; pp. 46–51. [Google Scholar]
- Gebrehiwot, K.; Mondal, M.A.H.; Ringler, C.; Gebremeskel, A.G. Optimization and Cost-Benefit Assessment of Hybrid Power Systems for off-Grid Rural Electrification in Ethiopia. Energy 2019, 177, 234–246. [Google Scholar] [CrossRef]
- Ahmad, J.; Imran, M.; Khalid, A.; Iqbal, W.; Ashraf, S.R.; Adnan, M.; Ali, S.F.; Khokhar, K.S. Techno Economic Analysis of a Wind-Photovoltaic-Biomass Hybrid Renewable Energy System for Rural Electrification: A Case Study of Kallar Kahar. Energy 2018, 148, 208–234. [Google Scholar] [CrossRef]
- Aziz, A.S.; Tajuddin, M.F.N.; Adzman, M.R.; Ramli, M.A.M. Feasibility Analysis of PV/Diesel/Battery Hybrid Energy System Using Multi-Year Module. Int. J. Renew. Energy Res. 2018, 8, 1980–1993. [Google Scholar]
- Adaramola, M.S.; Quansah, D.A.; Agelin-Chaab, M.; Paul, S.S. Multipurpose Renewable Energy Resources Based Hybrid Energy System for Remote Community in Northern Ghana. Sustain. Energy Technol. Assess. 2017, 22, 161–170. [Google Scholar] [CrossRef]
- Taghavifar, H.; Zomorodian, Z.S. Techno-Economic Viability of on Grid Micro-Hybrid PV/Wind/Gen System for an Educational Building in Iran. Renew. Sustain. Energy Rev. 2021, 143, 110877. [Google Scholar] [CrossRef]
- Oueslati, H.; Mabrouk, S.B. Techno-Economic Analysis of an on-Grid PV/Wind/Battery Hybrid Power System Used for Electrifying Building. Energy Sources Part A Recovery Util. Environ. Eff. 2023, 45, 9880–9893. [Google Scholar] [CrossRef]
- Alharthi, Y.Z.; Siddiki, M.K.; Chaudhry, G.M. Techno-Economic Analysis of Hybrid PV/Wind System Connected to Utility Grid. In Proceedings of the 2019 IEEE Texas Power and Energy Conference (TPEC), College Station, TX, USA, 7–8 February 2019; IEEE: Piscataway, NJ, USA, 2019; pp. 1–6. [Google Scholar]
- Khavari, A.H.; Abdul-Malek, Z.; Moradi, M.; Tavalaei, J.; Abdolahzadeh Anbaran, S.; Wooi, C.L. An Economic Assessment of Hybrid Renewable Energy for a Remote Area Electrification in Iran. Appl. Mech. Mater. 2016, 818, 151–155. [Google Scholar] [CrossRef]
- Elegeonye, H.I.; Owolabi, A.B.; Ohunakin, O.S.; Yakub, A.O.; Yahaya, A.; Same, N.N.; Suh, D.; Huh, J.-S. Techno-Economic Optimization of Mini-Grid Systems in Nigeria: A Case Study of a PV–Battery–Diesel Hybrid System. Energies 2023, 16, 4645. [Google Scholar] [CrossRef]
- Micangeli, A.; Del Citto, R.; Kiva, I.N.; Santori, S.G.; Gambino, V.; Kiplagat, J.; Viganò, D.; Fioriti, D.; Poli, D. Energy Production Analysis and Optimization of Mini-Grid in Remote Areas: The Case Study of Habaswein, Kenya. Energies 2017, 10, 2041. [Google Scholar] [CrossRef]
- Habib, H.U.R.; Wang, S.; Elkadeem, M.R.; Elmorshedy, M.F. Design Optimization and Model Predictive Control of a Standalone Hybrid Renewable Energy System: A Case Study on a Small Residential Load in Pakistan. IEEE Access 2019, 7, 117369–117390. [Google Scholar] [CrossRef]
- Jagjeevanram, K.; Ramesh, M. Control of PV-Wind-Diesel Hybrid System with BESS for Optimal Operation. Int. J. Progress. Res. Sci. Eng. 2020, 1, 199–203. [Google Scholar]
- Ramesh, M.; Saini, R.P. Effect of Different Batteries and Diesel Generator on the Performance of a Stand-Alone Hybrid Renewable Energy System. Energy Sources Part A Recovery Util. Environ. Eff. 2020, 1–23. [Google Scholar] [CrossRef]
- The Energy Act. 2019. Available online: https://www.epra.go.ke/download/the-energy-act-2019/ (accessed on 2 January 2024).
- Adaramola, M.S.; Agelin-Chaab, M.; Paul, S.S. Analysis of Hybrid Energy Systems for Application in Southern Ghana. Energy Convers. Manag. 2014, 88, 284–295. [Google Scholar] [CrossRef]
- Murugaperumal, K.; Raj, P.A.D.V. Feasibility Design and Techno-Economic Analysis of Hybrid Renewable Energy System for Rural Electrification. Sol. Energy 2019, 188, 1068–1083. [Google Scholar] [CrossRef]
- Anuphappharadorn, S.; Sukchai, S.; Sirisamphanwong, C.; Ketjoy, N. Comparison the Economic Analysis of the Battery between Lithium-Ion and Lead-Acid in PV Stand-Alone Application. Energy Procedia 2014, 56, 352–358. [Google Scholar] [CrossRef]
- Central Bank of Kenya. Available online: https://www.centralbank.go.ke/ (accessed on 21 July 2022).
- Rohani, G.; Nour, M. Techno-Economical Analysis of Stand-Alone Hybrid Renewable Power System for Ras Musherib in United Arab Emirates. Energy 2014, 64, 828–841. [Google Scholar] [CrossRef]
- Iweh, C.D.; Akupan, E.R. Control and Optimization of a Hybrid Solar PV–Hydro Power System for off-Grid Applications Using Particle Swarm Optimization (PSO) and Differential Evolution (DE). Energy Rep. 2023, 10, 4253–4270. [Google Scholar] [CrossRef]
- Koko, S.P. Optimal Battery Sizing for a Grid-Tied Solar Photovoltaic System Supplying a Residential Load: A Case Study under South African Solar Irradiance. Energy Rep. 2022, 8, 410–418. [Google Scholar] [CrossRef]

| Component | Type | Parameters | Values and Units |
|---|---|---|---|
| Solar module | SunPower E20-327 | Rated power | 327 Wp |
| Rated voltage (Vmpp) | 54.7 V | ||
| Rated current (Impp) | 5.98 A | ||
| Short-circuit current (Isc) | 6.46 A | ||
| Open-circuit voltage (Voc) | 64.9 V | ||
| Dimension | 1.558 × 1.046 m | ||
| Efficiency | 20.4% | ||
| Battery | Lead acid Trojan SAGM 12 205 | Nominal voltage | 12 V |
| Capacity | 219 Ah | ||
| Round-trip efficiency | 85% | ||
| Maximum charging current | 41 A | ||
| Maximum discharge current | 300 A | ||
| Inverter | MTP-4110F, 3-phase hybrid | Rated power | 120 kW |
| AC input frequency | 50/60 ± 3 Hz | ||
| AC output frequency | 50/60 Hz ± 0.01% | ||
| AC output voltage | 380/400/415 V(L-L), 220/230/240 V(L-N) | ||
| Efficiency | 96% | ||
| Charge controller | SOLARCON SCM-360400 | Maximum PV power | 124 kWp |
| Maximum current | 400 A | ||
| Vmp of PV | 255–330 Vdc | ||
| Output DC voltage | 360 V | ||
| Efficiency | 98% |
| System Configurations | LCOE (KSH) | NPC (Million KSH) |
|---|---|---|
| Grid | 21.39 | 82.6 |
| Grid/battery | 22 | 84 |
| Grid/solar PV | 8.78 | 43.7 |
| Grid/solar PV/battery | 10.49 | 49.4 |
| Parameter Considered | Base Year System | Current System |
|---|---|---|
| Annual energy consumed | 356,333 kWh | 61,005 kWh |
| Annual cost of energy | KSH 7,596,032 | KSH 1,220,098 |
| Annual cost to be saved | - | KSH 6,375,934 |
| Percentage saved on energy cost | - | 83.94% |
Disclaimer/Publisher’s Note: The statements, opinions and data contained in all publications are solely those of the individual author(s) and contributor(s) and not of MDPI and/or the editor(s). MDPI and/or the editor(s) disclaim responsibility for any injury to people or property resulting from any ideas, methods, instructions or products referred to in the content. |
© 2024 by the authors. Licensee MDPI, Basel, Switzerland. This article is an open access article distributed under the terms and conditions of the Creative Commons Attribution (CC BY) license (https://creativecommons.org/licenses/by/4.0/).
Share and Cite
Katche, M.L.; Makokha, A.B.; Zachary, S.O.; Adaramola, M.S. Techno-Economic Assessment of Solar–Grid–Battery Hybrid Energy Systems for Grid-Connected University Campuses in Kenya. Electricity 2024, 5, 61-74. https://doi.org/10.3390/electricity5010004
Katche ML, Makokha AB, Zachary SO, Adaramola MS. Techno-Economic Assessment of Solar–Grid–Battery Hybrid Energy Systems for Grid-Connected University Campuses in Kenya. Electricity. 2024; 5(1):61-74. https://doi.org/10.3390/electricity5010004
Chicago/Turabian StyleKatche, Musong L., Augustine B. Makokha, Siagi O. Zachary, and Muyiwa S. Adaramola. 2024. "Techno-Economic Assessment of Solar–Grid–Battery Hybrid Energy Systems for Grid-Connected University Campuses in Kenya" Electricity 5, no. 1: 61-74. https://doi.org/10.3390/electricity5010004
APA StyleKatche, M. L., Makokha, A. B., Zachary, S. O., & Adaramola, M. S. (2024). Techno-Economic Assessment of Solar–Grid–Battery Hybrid Energy Systems for Grid-Connected University Campuses in Kenya. Electricity, 5(1), 61-74. https://doi.org/10.3390/electricity5010004