Abstract
This paper explores how investments in research and development (R&D) and government policies impact the growth of renewable energy in Brazil, Chile, and Colombia up to 2040. The study presents four scenarios to understand how different levels of R&D investment and the presence or absence of supportive policies affect the spread of renewable technologies such as solar and wind energy. The scenarios range from an optimistic one with high R&D funding and strong policy support to a worst-case scenario with low R&D efforts and weak policies. The findings emphasize the importance of solid government backing and strategic R&D investments in promoting renewable energy and increasing the number of green patents. On the other hand, scenarios with limited policy support and R&D funding show much slower growth, highlighting the challenges posed by economic constraints and tough market conditions. The study shows that strong renewable energy policies could boost renewable energy adoption by 100% to 200%. Overall, this research adds to the discussion on sustainable energy policies and provides useful insights for policymakers and stakeholders to develop strategies that maximize the potential of renewable energy in the region.
1. Introduction
In order to reduce greenhouse gas emissions, which have negatively affected the environment and sparked concerns about the global climate catastrophe, renewable energy adoption is essential [1]. Although it has been stated that economic, regulatory, and technical constraints influence renewable deployment, the same article also demonstrates that renewables have been widely and successfully deployed. Continuing on this path, economic barriers are being lowered in most countries around the world since renewables have become nearly universally competitive [2]. Technical constraints include a lack of skills for operating and maintaining renewable systems, as well as a lack of infrastructure to bring renewable energy into the grid [3]. Those barriers can be reduced with research and development (R&D) investment in order to reduce the lack of skills [4].
Renewable energy R&D is a popular issue among investors and researchers. Unlike typical R&D, renewable energy R&D funds green and low-carbon investments and products that benefit the environment and reduce climate change [5]. The R&D sector has also evolved in response to economic, technological, and government policy changes [6].
A substantial amount of research and development (R&D) funding is necessary to tackle the complex problem of electricity markets making the switch to renewable energy. Even though earlier research has yielded insightful information, a number of important issues remain unanswered. In particular, a deeper comprehension of the R&D expenditures necessary for the effective integration of renewable energy in diverse contexts is crucial. Gaining this understanding is essential to creating strategies that effectively increase the uptake of renewable technologies.
For example, while analyzing three separate case studies, a number of concerns surface: Is it possible to extrapolate these case studies’ experiences to other situations? How will research and development be funded and organized to meet the particular difficulties presented by each scenario? What specific responsibilities do research and development initiatives and policies related to renewable energy play in promoting the wide-scale adoption of renewable technologies? What legal obligations also need to be fulfilled in order to guarantee a seamless transition?
The main objective of this research is to use a model-based assessment approach to understand the effect of R&D investments, current policies, and renewable energy diffusion in achieving a smoother transition, given the aforementioned and the plethora of potential solutions to ease the transition to higher shares of renewable energy in electricity markets. This study considers a variety of important variables, such as the overall quantity of patent applications, the installed capacity of wind and solar power, the different policies de-signed to meet targets for renewable energy, the price of carbon dioxide, and the correlation between installed capacity and patent numbers.
This study looks at these variables in an attempt to identify the qualities that are essential for R&D investments to be successful and for the spread of renewable energy technology. The idea of absorptive capacity, which describes a nation’s or organization’s capability to absorb and use new knowledge, is one topic of particular interest. This study addresses a gap in the literature by examining the effects of absorptive capacity and renewable energy policy on the returns on research and development investments.
In conclusion, the goal of this research is to present a thorough knowledge of the interactions that occur between regulatory frameworks, R&D investments, and the uptake of renewable energy. The ultimate goal of the research is to contribute to the larger objective of attaining a sustainable and effective transition to renewable energy in electricity markets by providing insightful analysis and recommendations for stakeholders and policymakers.
The paper is organized as follows: The following section outlines the research topics and contributions of this work. The model-based method to tackle these challenges is then detailed, along with the dynamic hypothesis, the primary variables incorporated into the stocks and flows diagram, and the application instances. Section 4 gives the simulation findings, followed by the conclusions in Section 5.
2. Research on the R&D in Renewables
In recent years, incentives have considerably increased investments in renewables globally [7]. Following this trend, Radpour et al. [8] have discussed the impact of various policies on renewable energy adoption, and GHG emissions reductions. Moallemi et al. [9] found that energy transition pathways under deep uncertainty should be evaluated utilizing a narrative-informed exploratory analytical approach in order to achieve the transition and assure greater efficacy. Ozcan et al. [10] explored and identified the effectiveness of the incentives; also, the difficulties by investors are explored. In this paper, it is concluded that investment profitability and environmental awareness are primary motivations for their RE investments. In addition, this paper also concludes that the majority of investors benefited from the investment incentive certificate (94.4%), which offers value-added tax exemption, customs duty exemption, etc. None of the investors benefited from R&D-related tax incentives A study conducted by Vasseur et al. [11] highlighted the importance of a supportive and stable renewable policy, robust industry-research collaborations, and international engagements for the successful development and diffusion of PV technology. It also highlights the necessity for countries to adapt their strategies according to their unique circumstances and capacities to foster innovation and sustainability in the PV sector. Karmellos et al. [12] studied the main factors of carbon dioxide (CO2) emissions from electricity generation in the EU-27 and the UK from 2000 to 2018. In this paper, it is concluded that the effectiveness of European energy policies in reducing CO2 emissions from electricity generation. The importance of continued investments in renewable energy and energy efficiency to maintain and enhance decoupling of economic growth from carbon emissions, thus supporting a sustainable transition to a low-carbon economy. Regarding barriers to incorporating renewables into the market [13], in this paper economic, environmental, infrastructural, technical, technological, and policy barriers were studied. In this research it is concluded that the need for coordinated efforts, technological innovation, and supportive policies to promote green energy production and achieve sustainability goals in the EU.
Innovation increases productivity and economic growth while also encouraging the transition to low-carbon energy. It improves the productivity of capital and/or labor and accelerates technical innovation, allowing for increased economic output with the same level of input [14].
Furthermore, through innovations, energy transition influences market efficiency. It has an impact on market-wide flaw chains. Innovation in renewable energy, backed by policy implementation, has an impact on economies, taxes, subsidies, and regulations. Government policies often promote the use of clean energy in industry, leading to improved market efficiency [15].
Some researchers have observed the absence of an integrative model-based framework—one that is generic, modular, adaptable, and transportable—to support the process of system analysis, notably using the System Dynamics (SD) technique [16]. For example, an SD model was built to investigate the replacement of traditional household appliances with more efficient ones and to examine energy efficiency measures; however, this tool was not generalizable. For instance, ref. [17] built an SD model to evaluate the rate and impact of solar PV dissemination in the United Kingdom, Brazil, and Colombia (however, this tool was not generalizable).
Regarding the importance of R&D in renewables investments, several studies have been conducted: ref. [18] explored how investments in renewable energy R&D—a critical component of green finance—alongside GDP, human capital, and economic risk influence GHG emissions; key findings from this research indicate that green finance and economic risk are inversely related to GHG emission intensity, with green finance having a more pronounced effect in countries with higher emissions. Contrarily, human capital and GDP are found to exacerbate GHG emissions. The study’s results underscore the importance of green financing as a pivotal measure in the reduction of emissions, highlighting its stronger impact on nations with higher levels of emissions and advocating for policies that bolster green financing during periods of heightened energy demand. Mensah et al. [19] examine the influence of innovation on CO2 emissions in 28 OECD nations from 1990 to 2014. The key findings indicate that innovation plays a crucial role in mitigating GHG emissions. R&D in renewables improves environmental quality due to reduced GHG emissions. Lin and Xie [20] have explored the relationship among R&D subsidies and green technology innovation in China’s renewable energy sector. Utilizing data from 160 listed renewable energy companies in China from 2011 to 2020, this study concluded that R&D subsidies play an important role in the renewable energy industry. The main finding suggests the need for carefully crafted public policies to maximize positive impact in renewable diffusion. Li et al. [21] investigated the primary drivers of China’s renewable energy transition, with an emphasis on the effects of human development, financialization, and R&D investment. The findings show that financial expansion and R&D investments have a substantial impact on the energy transition. The study concludes with robust policy recommendations aimed at promoting financial development resources and R&D spending to spur the energy transition in China. Hayat et al. [22] studied the influence of renewable energy R&D and natural resource rent on consumption-based carbon emissions in OECD economies from 1990 to 2020. The key findings show that renewable energy R&D makes a considerable contribution to carbon emission reduction, especially at higher quantiles of the carbon emissions distribution. Ref. [23] examines the impact of R&D investments in Pakistan, existing policies, and renewable energy diffusion on this transition. These studies are interested in the role of technological innovation through patent analysis, emphasizing the importance of R&D investments in driving new technologies for renewable energy.
Regarding modeling, several authors have investigated how innovation systems, R&D expenditures, and diffusion policies lead to cost reductions and investments in new renewable capacity [24]. Xin-gang et al. [25] developed a SD model to assess the influence of R&D investments and other incentive policies, such as Feed-in Tariff (FIT), on the technological innovation, cost reduction, and installed capacity of China’s photovoltaic power generation industry, in the study is concluded that with policy recommendations emphasizing the need to promote financial development and R&D investment as key strategies for supporting the photovoltaic industry’s growth and technological innovation, thereby contributing to China’s renewable energy transition and its environmental sustainability goals. Azad and Ghodsypour [26] used a SD model to understand the intricate relationships between various components of innovation systems and the market to showcase how “innovation functions” behave throughout the technology life cycle in the petrochemical industry. Rad et al. [27]: The study presents using SD modeling a novel approach to understanding the complex dynamics between imitation, innovation, market forces, and policy interventions. The study it is concluded the critical role of policy interventions in aiding the transition from imitation to innovation in emerging sectors, specifically within the national PV industry, and implementing a mixed policy approach that combines enhancing collaboration between research institutions and the industry with strategic market development initiatives could significantly expedite the innovation process and market share growth of domestic PV firms. Xin-gang et al. [28] using a SD approach explore the dynamic diffusion process of wind power, presenting a detailed analysis of how de-mand-pull policies (like feed-in tariffs or FITs) and technology-push policies (such as R&D policies) influence the growth and technological advancement of wind power. Through R&D efforts, they also significantly contribute to the diffusion of wind power, primarily through cost reduction. Higher levels of R&D intensity are deemed more efficient for technological innovation and cost reduction.
3. Methodology and Model Description
This section outlines the methodology and the simulation model used to tackle the research questions highlighted in this document. The study employs the SD method, a technique previously proven effective in evaluating the growth of renewable energy sources within electric markets [29]. SD shines at mapping out the intricacies of systems and their feedback loops, such as investments in power generation capabilities and research and development efforts aimed at lowering investment costs. Overall, this method provides a compelling lens through which to view potential market developments [30,31,32,33,34].
The SD technique offers a strong framework for simulating and evaluating complex systems over time; it greatly aids in our understanding of the dynamics of R&D investments and renewable legislation in increasing the market share of renewable energy. This is a more detailed description of how it contributes to this comprehension:
- Creating Detailed Models to Capture Complex Interactions: SD enables the creation of complicated models that depict the complex interrelationships between different variables, including R&D expenditures, legislative measures, market reactions, technology breakthroughs, and environmental effects [35,36]. The feedback loops, time delays, and non-linear connections typical of the renewable energy industry can be included in these models [37].
- Simulating Policy Scenarios: Researchers can use SD to develop and test various policy scenarios to determine how shifts in R&D funding, tax credits, subsidies, or mandates from regulations impact the share of renewable energy in the market. This lessens the possibility of unforeseen repercussions by helping to forecast the results of policy interventions before they are put into action [38].
- Recognizing Positive and Negative Feedback Loops: SD draws attention to feedback loops that can either increase or decrease the impact of R&D expenditures and laws. For example, more R&D may result in technological innovations that lower costs and boost efficiency, which may encourage more people to use renewable energy technology. Accelerating the switch to renewable energy may depend on this positive feedback loop [16].
- Developing Adaptive Strategies: Based on real-time data and shifting circumstances, adaptive strategies that are developed can be informed by the insights obtained by SD models. These models allow policymakers to dynamically modify policies in response to changes in the market and advancements in technology [39].
According to the dynamic hypothesis in Figure 1, R&D investments in renewable patents boost an organization’s capacity for innovation and propel the development of renewable energy technology. Increased innovation leads to more economical and efficient renewable energy solutions being developed, which in turn generates innovation revenues and, eventually, lowers R&D costs as technologies mature and become more commercially viable (see feedback loop B1).
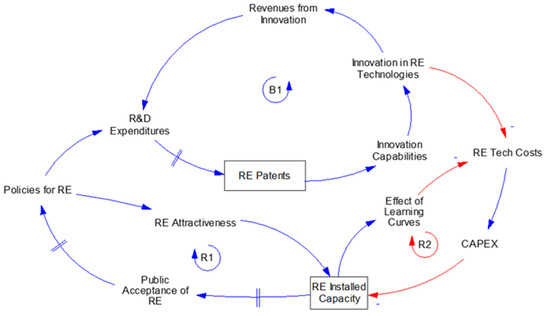
Figure 1.
Main dynamic hypothesis.
Furthermore, a rise in renewable energy-friendly regulations, such as tax breaks, government grants, and renewable energy standards, makes renewables more appealing to consumers, companies, and investors. In addition to lowering the financial risks involved, these regulations increase the competitiveness of renewable energy projects relative to conventional energy sources. Because of its greater appeal, there is a rise in installed renewable capacity, which raises public support for renewable energy sources. Increased public acceptability fuels additional legislative support and more advantageous regulatory frameworks for renewables, which in turn forms a reinforcing circle (see feedback loop R1).
Here, the idea of absorption capacity is crucial. The system’s absorption capacity includes its ability to incorporate and use renewable energy technology efficiently. High absorption capacity guarantees that developments in R&D and policy-friendly measures result in real growth in the use of renewable energy. This entails establishing the market conditions, infrastructure, and technical know-how required to facilitate the broad use of renewable energy sources.
Increases in installed renewable capacity have a number of positive consequences. Lower capital expenditures (CAPEX) and costs for renewable energy are the result of the learning curve effects, a phenomenon that describes how more experience with a technology leads to cost reductions. Because of the lower prices, renewable energy projects are now more financially viable, which attracts additional investment and raises installed capacity even further (see feedback loop R2). The more renewable energy sources are built, the more affordable and effective they become, which accelerates the adoption of these sources. This positive feedback loop perpetuates itself.
Furthermore, self-generated energy production rises with increased renewable capacity. By doing this, the grid’s overall energy consumption is decreased, which causes the energy demand curve to move to the left. The generating charge, which is based on how supply and demand for energy interact, decreases when grid energy use decreases. Customers’ energy costs may be stabilized or even decreased as a result, increasing the allure of renewable energy.
The dynamic hypothesis, in summary, shows how R&D investments, encouraging laws, and the ensuing developments in renewable technology provide a feedback loop that propels the expansion of renewable energy capacity. This process relies heavily on the idea of absorption capacity, which establishes how well these innovations and regulations translate into real increases in installed renewable capacity and lower energy costs. The shift to a sustainable and renewable energy future can be sped up by improving absorption capacity across technological, economic, policy, market, and social dimensions.
3.1. Application Cases
Three distinct regions are examined to validate the theory and discover variances in the amount and pace of renewable diffusion based on R&D expenditure. The application cases cover countries with various levels of industrialization, access to natural resources, and policy formation and execution (see Table 1).

Table 1.
Country characteristics used in this paper [40,41,42].
The model-based methodology used in this study considers the unique characteristics of each of the three cases. For each case study, the supply, demand, number of patents, and investment and development expenditures follow similar structures that are tailored to the research issues given. This is achievable due to the framework’s general and extensible architecture. Model structure is shown in Appendix A.
Chile has been a regional leader in the deployment and integration of renewable energy within its electricity market. This is because, as a result of its vast renewable resources and government policies, Chile has an important resource of solar and wind. To leverage these resources, the Chilean government has implemented a series of policies aimed at encouraging the development of renewable energy technologies and investments in R&D [40], Chile has abundant solar and wind resources, particularly in the Atacama Desert, which is one of the sunniest and driest places on earth, and the coastal regions, which are ideal for wind power generation [43]. Chile’s success in integrating renewable energy serves as a model for other Latin American countries. Its experience demonstrates the potential for renewable energy to enhance energy security, reduce greenhouse gas emissions, and foster economic development [40]. The Brazilian electricity market is predominantly dominated by hydro and renewable sources. Brazil uses auction systems to contract new energy generation, which has been successful in attracting investments in wind and solar energy projects at competitive prices [44]. Brazil’s regulatory framework is designed to diversify its energy sources and has made significant strides in integrating renewable energy into its national grid. With the country’s vast potential for solar and wind energy still largely untapped, Brazil’s policies are likely to continue evolving to harness these resources more effectively [45]. Brazil’s regulatory framework is designed to diversify its energy mix. The country has made significant strides in integrating wind and solar energy into its national grid, ensuring a balanced and resilient energy system [46]. Colombia’s electricity is predominantly sourced from hydroelectric power [47]. To promote other renewable energy sources on both large and small scales, Colombia recently fully implemented Law 1715 [48]. The selection of Chile, Brazil, and Colombia highlights the diverse approaches and successes in integrating renewable energy within their respective electricity markets. Each country’s unique combination of natural resources, government policies, and strategic initiatives offers valuable insights and lessons for the broader Latin American region and beyond. These examples underscore the importance of tailored policy frameworks, competitive market mechanisms, and investment in R&D to drive the transition to a sustainable energy future.
3.2. Model Asumpsionts
In this model, renewable growth is based on the bass and logit model, in order to generalize the model in three different countries. Installed capacity is divided into conventional technologies such as gas, coal, and hydro; and solar and wind capacity in one level each. Capacity growth is driven by electricity demand and the levelized cost of each technology. Each technology has its own installation cost, electricity generation factors, and lifetime in order to build a levelized cost.
- The electricity demand is estimated using both price and GDP elasticity of demand.
- In order to incentivize renewables, CO2 emissions costs are added to conventional technologies.
- The model implicitly associates the maximum possible capacity of resources regarding wind and solar in each country. Thus, it might act as a growth limit in renewables.
- Patents absorption capacity leads to lower installed capacity cost and more knowledge of renewables in order to reduce cost and increase new installed capacity.
- The model is developed using Vensim software (https://vensim.com/, accessed on 28 January 2018), which allows you to solve the system using the fourth-order Runge-Kutta method.
- The simulation time horizon is 15 years, between 2024 and 2050, and the simulation time step is monthly.
- The simulation time horizon of 15 years, from 2024 to 2040, with a monthly time step, is designed to capture the main logic behind scenario analysis, which includes understanding long-term market trends, assessing the impact of different policies and technologies, and making informed decisions. A 15-year horizon is sufficient to observe significant shifts in market dynamics, including the adoption rates of new technologies, changes in energy consumption patterns, and the overall evolution of the electricity market. This period allows analysts to identify and understand long-term trends rather than short-term fluctuations.
It is important to remember that the model has several limitations. Small-scale renewables were not examined, nor did the model include batteries for studying specific circuits that play a role in intraday exchanges. Most importantly, while small-scale renewables will be used throughout the system in the near future, they are not modeled because the purpose of this paper is to (a) understand how R&D affects renewable capacity; and (b) assess and compare different policies to increase renewable capacity in three electricity markets.
Although household PV panels from small-scale systems can have an impact on renewable energy adoption, this article concentrates on large-scale renewables due to the significant investment required by operators and the availability of data. Furthermore, the model does not incorporate small-scale generators like commercial systems, as the paper has a broad long-term perspective rather than a particular focus.
3.3. Model Validation
The validation of the model was rigorously conducted through a series of structural and behavioral tests to ensure its accuracy and applicability. The first phase of the validation involved an in-depth review of the model’s structure and its underlying mathematical equations. This review was carried out in collaboration with a panel of experts in the field, including system engineers, mathematicians, and industry specialists. Each expert provided critical insights, which were instrumental in refining the model’s framework and ensuring that it adequately represented the complexities of the real system.
During the discussions, each mathematical equation incorporated into the model was meticulously examined for dimensional consistency. This process involved verifying that all terms in the equations were dimensionally homogeneous, ensuring that the equations would behave correctly under various operational scenarios. This step was critical, as dimensional inconsistencies can lead to erroneous results and misinterpretations of the system’s behavior.
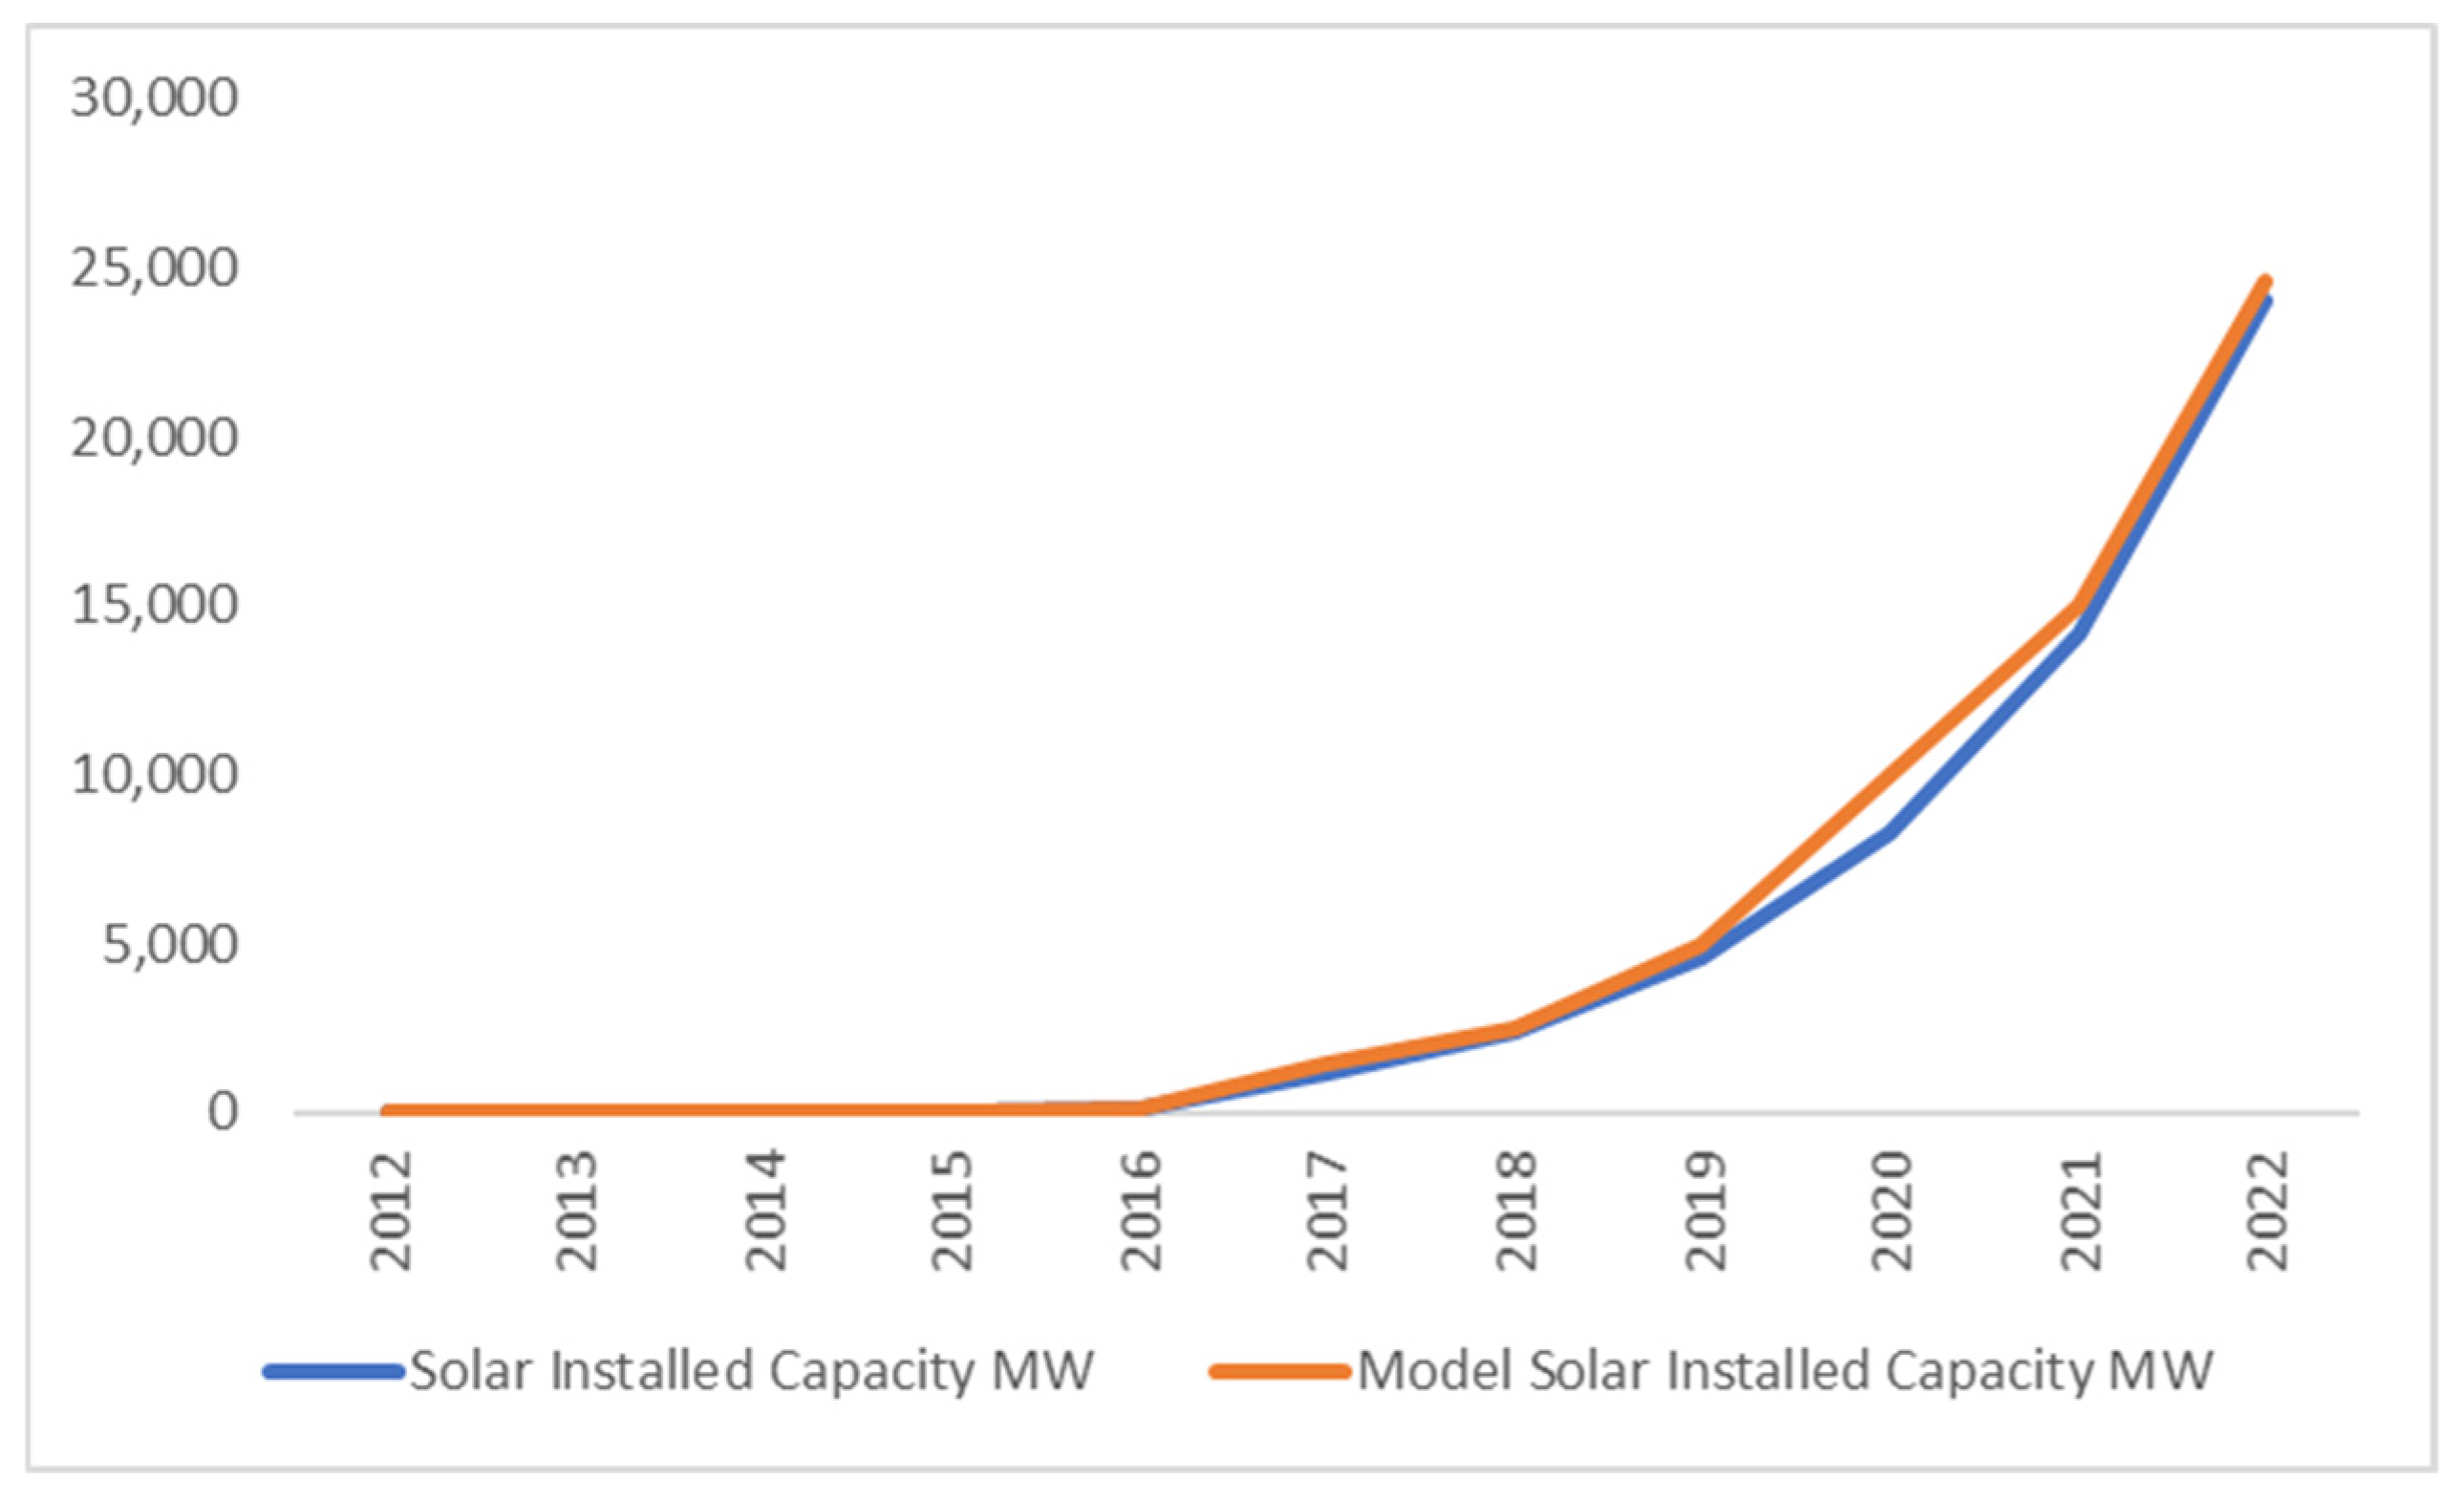
In Figure 2, a comparison of the behavior of solar real installed capacity in Brazil and model installed capacity is shown, and it is possible to see that model follows the same trend as real installed capacity.
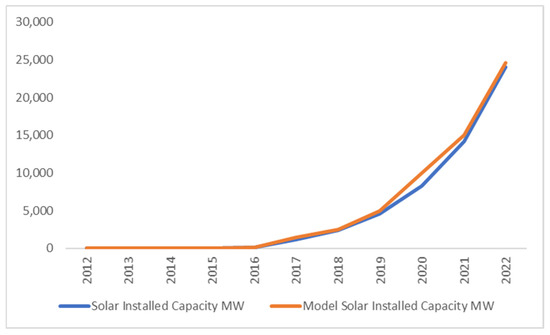
Figure 2.
Solar installed capacity in Brazil: real vs. model simulation.
Furthermore, the parameters used in the model were carefully selected to mirror those of the actual system as closely as possible. Data for these parameters was gathered from reliable sources, including operational data from existing systems, published research, and industry reports. This alignment was crucial for the model to produce results that are not only theoretically sound but also practically viable.
Behavioral tests were also conducted to validate the model further. These tests involved simulating the model under expected operational conditions to observe how it behaves and reacts to changes in input variables. The results of these simulations were then compared against empirical data from the real system to check for accuracy and consistency. Discrepancies were analyzed and addressed by making necessary adjustments to the model, ensuring that it delivers reliable and realistic outputs.
The combined approach of structural reviews, mathematical checks, parameter alignment, and behavioral simulations provided a comprehensive validation framework. This rigorous validation process ensures that the model is robust, dependable, and capable of replicating the real-world dynamics it aims to simulate, thus making it a valuable tool for both theoretical analyses and practical decision-making in the system’s domain (see in Table 2 the major parameters, values, and sources).
Table 2.
Input data of the model.
In the recent analysis, comprehensive structure-oriented behavior tests were conducted to evaluate the system’s robustness and response to variations in key parameters. The methodology was initiated by inputting extreme values into selected parameters to ascertain their influence on the overall pattern behavior of the system. This step was crucial in identifying any potential anomalies or unexpected responses that could compromise the system’s reliability under stress.
The parameters chosen for these extreme value tests were systematically varied, both at their upper and lower bounds. This approach ensured a thorough exploration of the system’s operational limits and helped map the response curve across a wide range of inputs.
3.4. Simulation Scenarios
This paper employs scenario analysis as a methodological tool to examine potential future developments in the electricity systems of Colombia, Brazil, and Chile. The scenarios constructed in this analysis consider the presence or absence of renewable energy policies that could incentivize the growth of renewables. Additionally, the scenarios are modeled to reflect variations in renewable energy costs, which are categorized as either low or high, as indicated in reference [49]. This categorization is pivotal as it allows for a nuanced exploration of how cost factors, coupled with varying degrees of Research and Development (R&D) investment (classified as either low or high), could impact the evolution of these national electricity systems.
Table 3 lists the several scenarios that have been implemented in the simulation model. These scenarios capture plausible long-term sustainability impacts under various policy and economic settings, as well as realistic transitions. These hypothetical situations are intended to investigate the ways in which different R&D spending levels and renewable energy regulations may impact the advancement and uptake of renewable energy technology.
Table 3.
Summary of scenarios.
Scenario 1: Best-Case Scenario (BCS):
The model makes a large investment in R&D in Scenario 1, which is referred to as the best-case scenario (BCS). Because of this significant investment, the cost of renewable energy technology decreases, increasing their competitiveness with conventional energy sources. Persistent and strong renewable energy policies that aim to increase the installed capacity of renewables further support the situation. These regulations could include significant financial aid, tax breaks, and requirements for the use of renewable energy. A suitable climate for the renewable energy sector’s rapid expansion is created by supporting legislation and strong R&D investment, which might have significant positive effects on the environment and the economy. This scenario exemplifies the perfect course for accelerating the shift to a sustainable energy future by combining legislative assistance with technological breakthroughs.
Scenario 2: High R&D, Low Policy Support
Scenario 2 calls for a reduction in renewable energy goals and investment support, but it also calls for a sizable investment in R&D that lowers technological costs. The lack of robust policies promoting renewable energy implies that there is less motivation for the widespread adoption of these technologies, even in spite of the technological breakthroughs brought about by substantial R&D expenditure. The market expansion for renewables may be hampered in the absence of regulations requiring a specific proportion of energy to come from renewable sources, feed-in tariffs, and renewable energy certificates. This hypothetical situation demonstrates how important policies are in enhancing technological breakthroughs. The growth of renewable energy can be severely hampered by the lack of supportive policies, even in cases where the finest technology is available at reduced costs.
Scenario 3: Worst-Case Scenario (WCS):
The worst-case scenario (WCS), or scenario 3, is typified by poor R&D investment and low incentives for renewable energy. There are not any major goals or initiatives in this scenario to expand the renewable energy industry. The absence of research and development funding prevents renewable energy sources from achieving the required cost savings and efficiency gains to rival conventional energy sources. Furthermore, there is no incentive for consumers and businesses to switch to renewable energy in the absence of supportive regulations. In this scenario, renewable energy adoption is neither driven by policy nor technology, which means that there is minimal progress towards sustainability goals and a persistent reliance on non-renewable energy sources.
Scenario 4: Low R&D, High Policy Support:
In Scenario 4, the industry is still supported by legislation pertaining to renewable energy, but research and development expenditures are still minimal. In this case, laws requiring the use of renewable energy sources, along with tax breaks and other regulations, promote the uptake of current renewable technology. However, there are fewer technological advancements and cost savings due to the low level of R&D expenditure. Because of this, there is little chance of major technological advancements and considerable cost reductions, even though the industry benefits from extensive regulatory support. This case emphasizes how crucial it is to strike a balance between funding for R&D and policy assistance. Policies may encourage early adoption, but the renewable energy sector’s long-term growth and competitiveness may be limited in the absence of ongoing technological advancement.
These scenarios offer a thorough understanding of the potential effects on the renewable energy sector of various combinations of policy assistance and R&D investment. Policymakers and other interested parties can create strategies that successfully encourage the development of renewable energy technology by studying these scenarios in order to have a better understanding of the possible implications of their decisions.
In the next section, results are provided and explained for 4 scenarios and each country.
4. Simulation Results
In order to analyze the extent and speed of solar and wind diffusion in different countries, this section presents the simulation model results of solar and wind installed capacity and number of panels for Brazil, Chile, and Colombia.
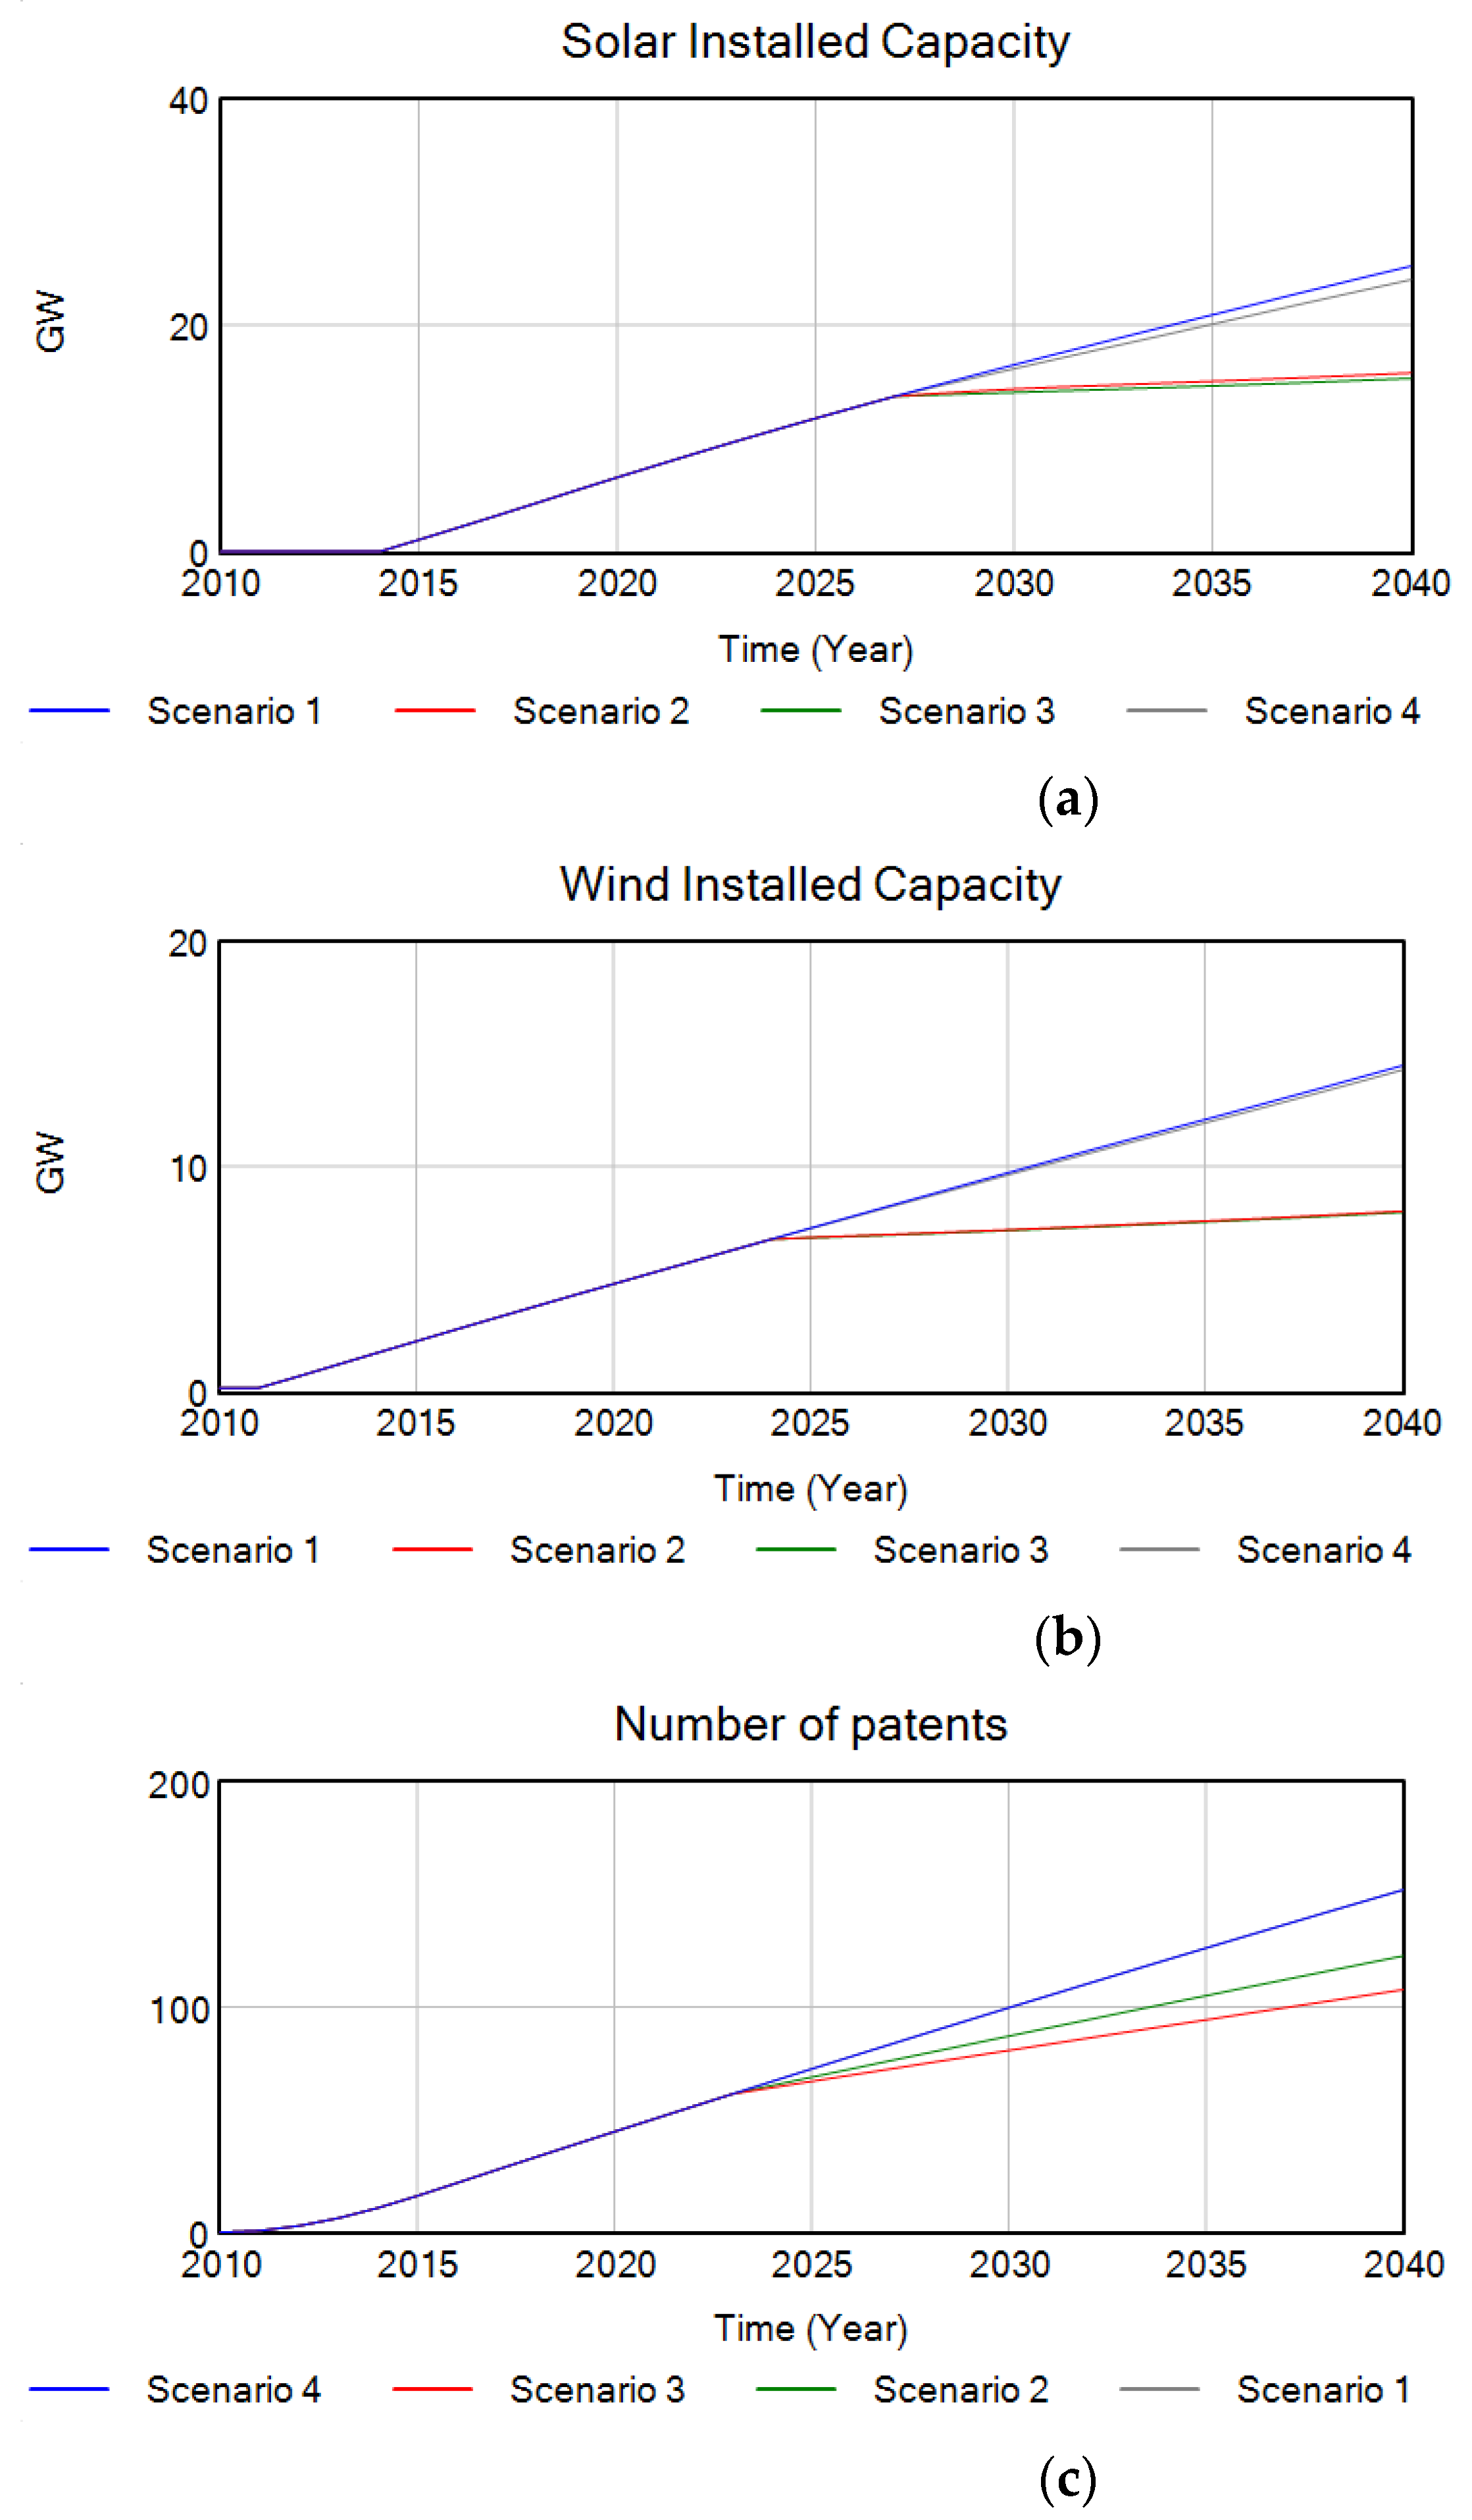
Regarding solar installed capacity in Figure 3, different trajectories are shown that diverge significantly, revealing distinct paths solar and wind installed capacity could take. Let us delve deeper and explore the potential narratives behind each scenario:
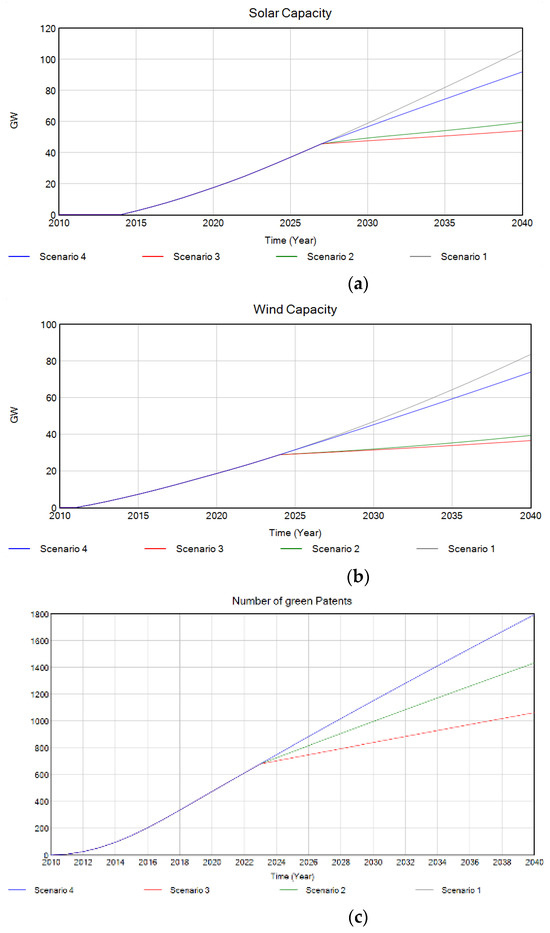
Figure 3.
(a) Solar installed capacity in Brazil. (b) Wind installed capacity in Brazil. (c) Number of green patents in Brazil.
Scenario 1: Blazing a Bright Trail
This scenario depicts a future where solar and wind installed capacity have explosive growth. The rapid rise in capacity suggests a confluence of factors. Important policy support and high investment in R&D investments, such as substantial tax breaks or feed-in tariffs for solar energy producers, have spurred widespread adoption. Technological advancements will also play a role. This scenario could represent a future where solar becomes a dominant force in the energy landscape.
Scenario 2 & 4: The Measured Climbers
Scenarios 2 and 4 present a more moderate growth trajectory. Their similar paths suggest they share some underlying factors. Policy changes presented a low growth. Reduction in R&D investments that lead to low technological advancement, but at a steadier pace. These scenarios paint a picture where solar energy steadily increases its market share but faces some hurdles or limitations that prevent exponential growth.
However, Scenario 3 shows a subtle difference. Its slightly steeper slope hints at a potential tipping point beyond the timeframe of the graph. Perhaps technological breakthroughs or policy changes kick in later in this scenario, leading to a more significant acceleration in solar adoption in the long term.
Scenario 3: A Steeper Climb Needed
Scenario 3 depicts a future with the slowest growth in solar capacity. This could signify a lack of supportive policies or significant economic barriers. Technological advancements might also be lagging in this scenario. Perhaps the cost of solar panels remains high. This scenario represents a future where solar energy struggles to gain a significant foothold in the energy market.
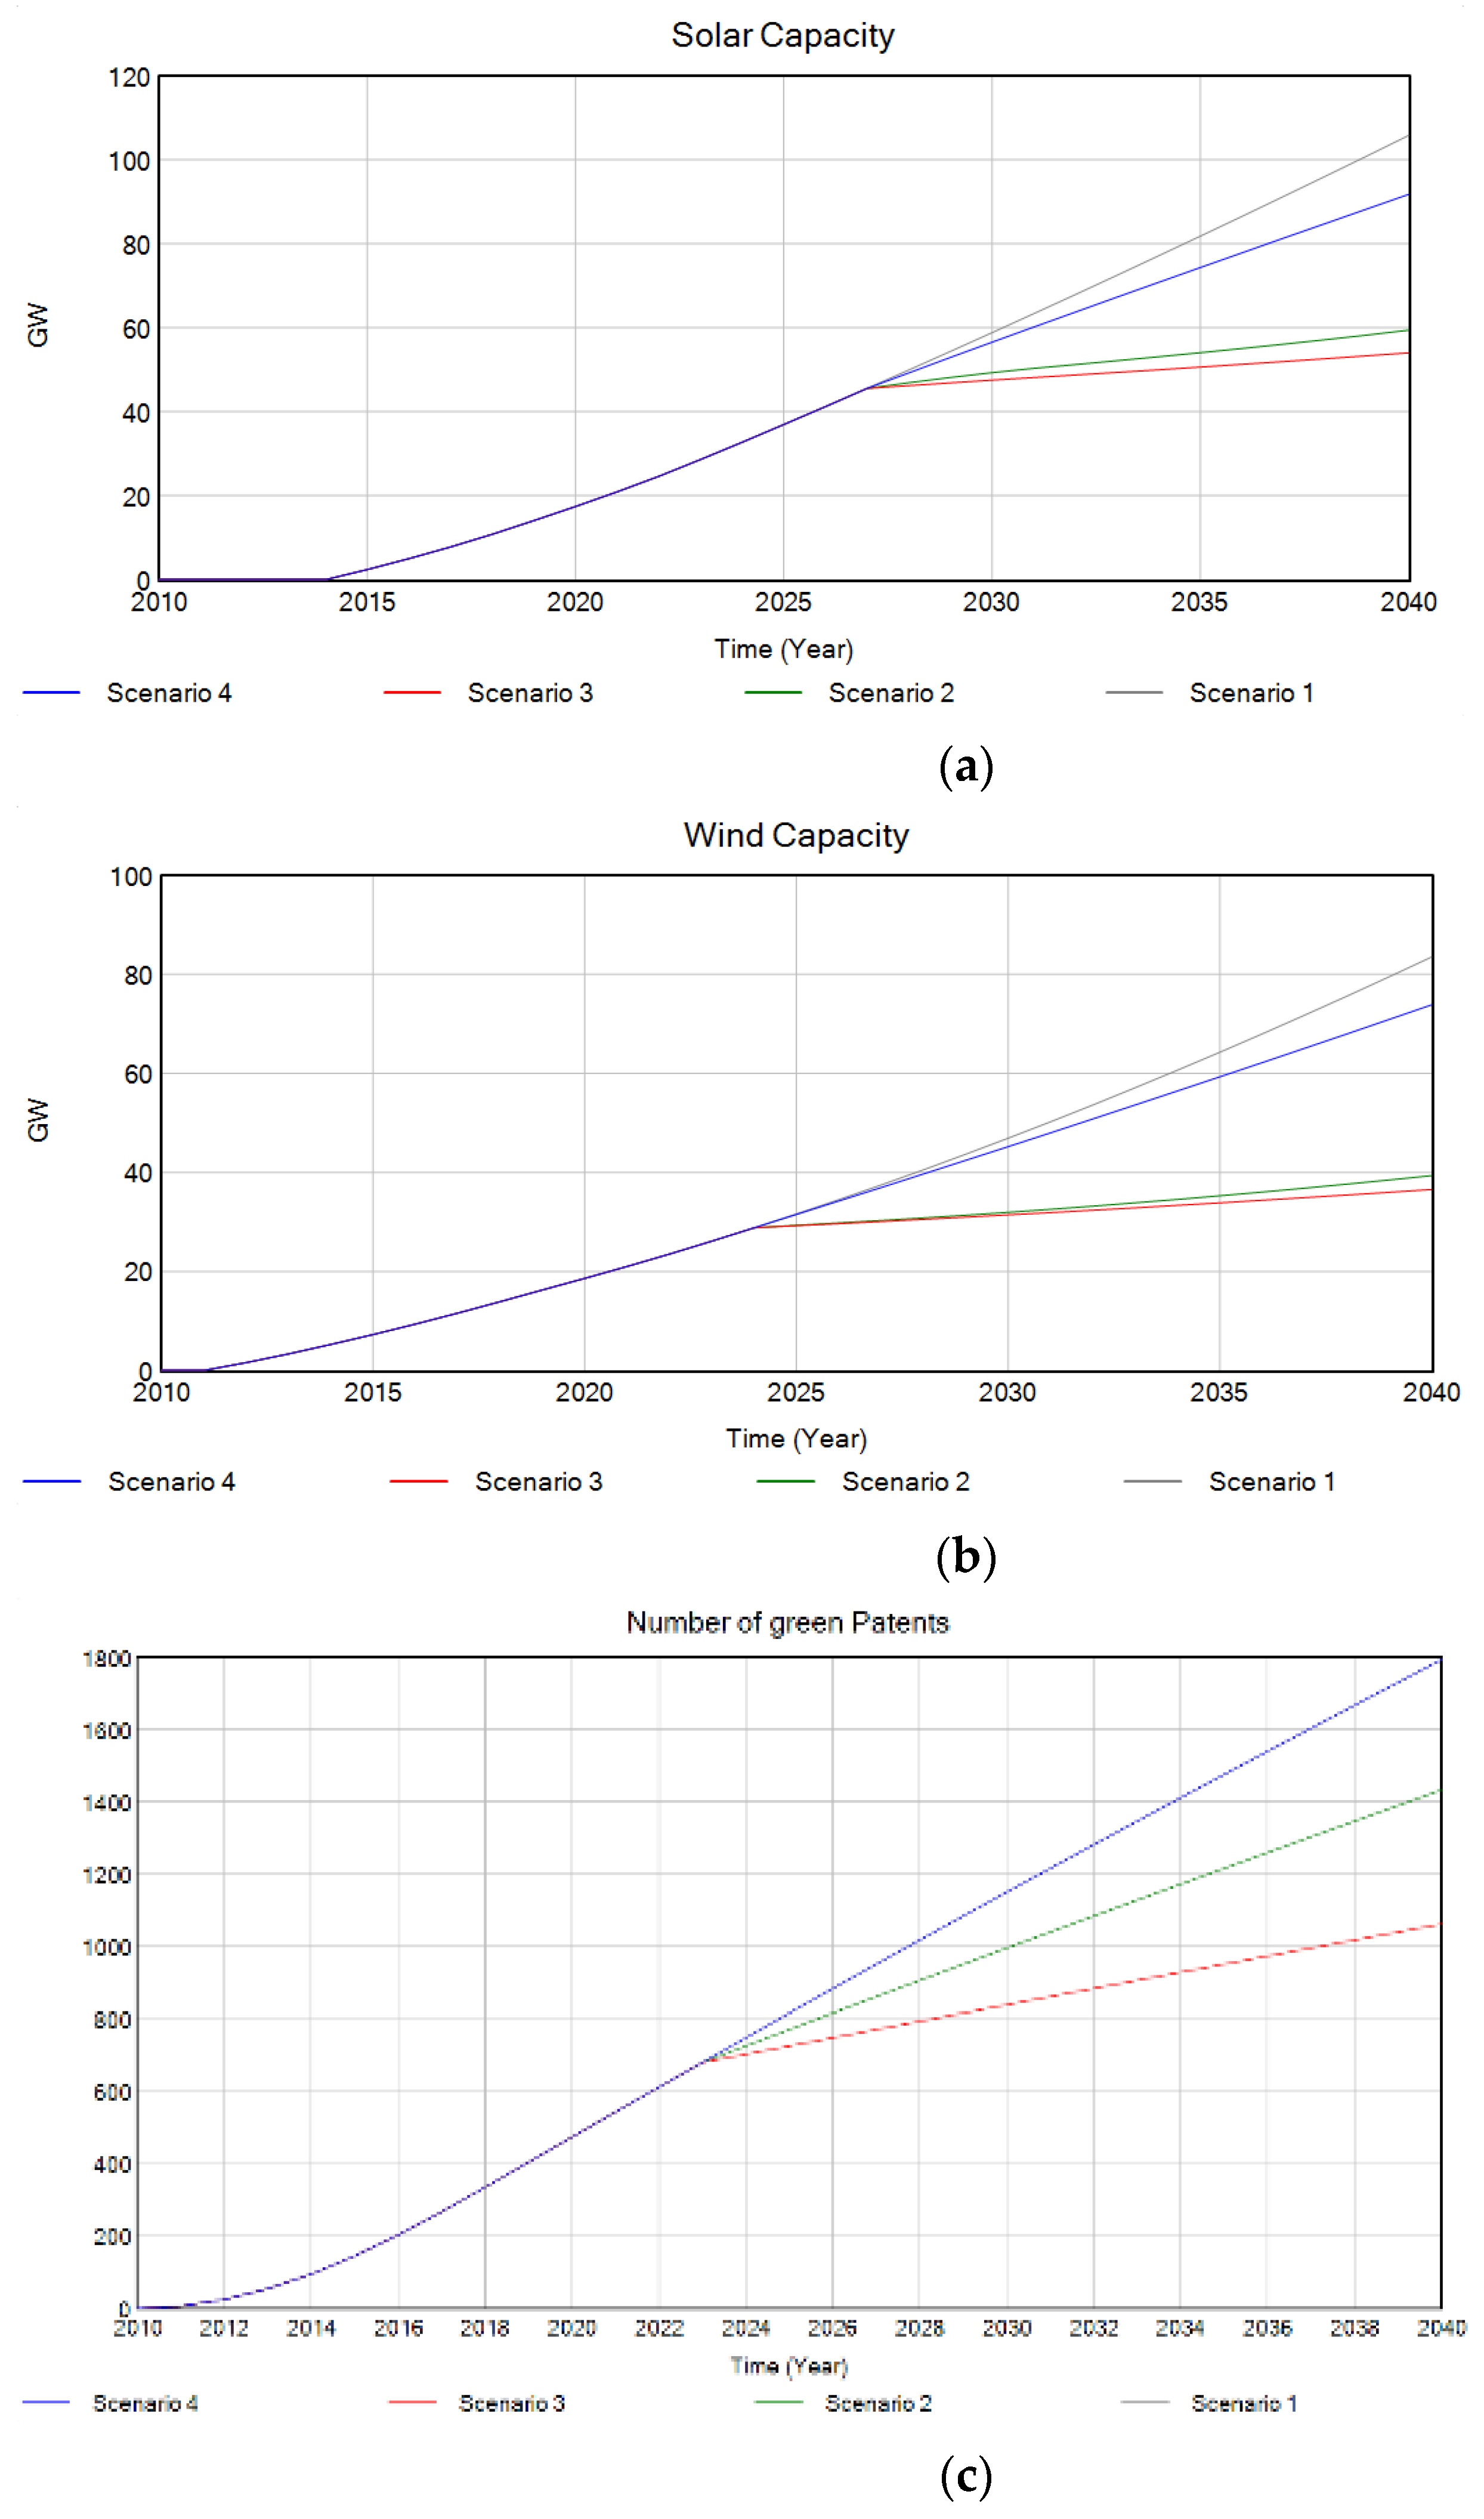
Regarding solar and wind installed capacity, Figure 4a,b, respectively. Scenario 1 predicts an exponential growth in solar and wind installed capacity, indicating a very optimistic view of solar energy adoption. This could reflect anticipated technological advancements, decreasing costs, and strong governmental incentives promoting green power. Scenarios 2 and 3 both suggest very moderate increases in installed capacity. These trajectories might reflect scenarios where market conditions, such as lower-than-expected demand or higher installation costs, prevent rapid expansion. Scenario 4 aligns closely with Scenarios 2 and 3, reinforcing the notion of a more cautious growth expectation. This alignment suggests a consensus around the challenges or steady state of growth without major policy or market changes.
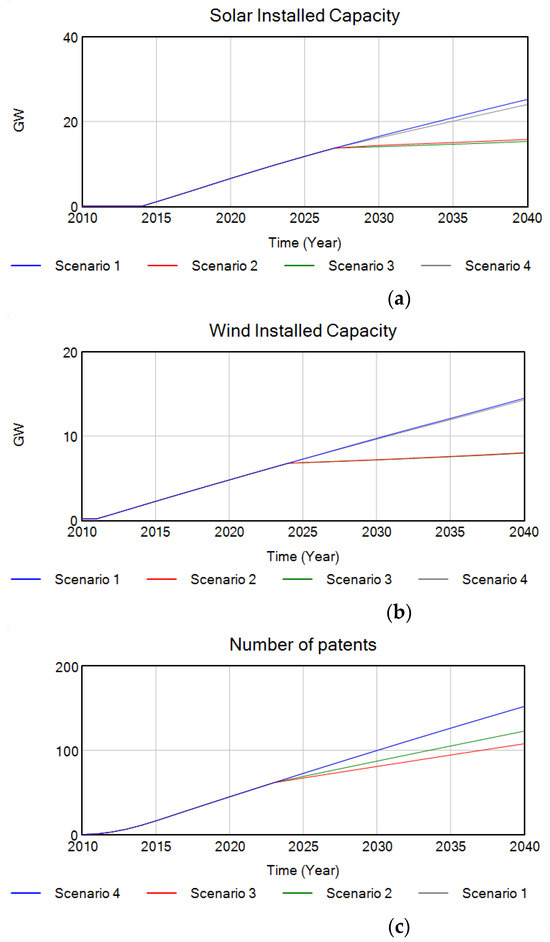
Figure 4.
(a) Solar installed capacity in Chile; (b) Wind installed capacity in Chile; (c) Number of green patents in Chile.
Concerning the number of green patches, see Figure 4, ion and intellectual property in renewable technologies are highly prioritized. This scenario might reflect aggressive policy support, significant R&D investments, or a booming renewable sector. Scenario 2 exhibits a steady but less steep increase compared to Scenario 4, implying a consistent but more measured approach to innovation. This could be indicative of steady market growth and ongoing but stable investments in new technologies. Scenario 3 presents a modest growth curve, potentially reflecting a conservative but positive outlook towards renewable energy technologies, possibly due to limited funding or slower market penetration.
Scenario 1 shows minimal growth in patent numbers, possibly indicating challenges such as lack of funding, policy support, or external economic factors that hinder significant innovation in the renewable sector.
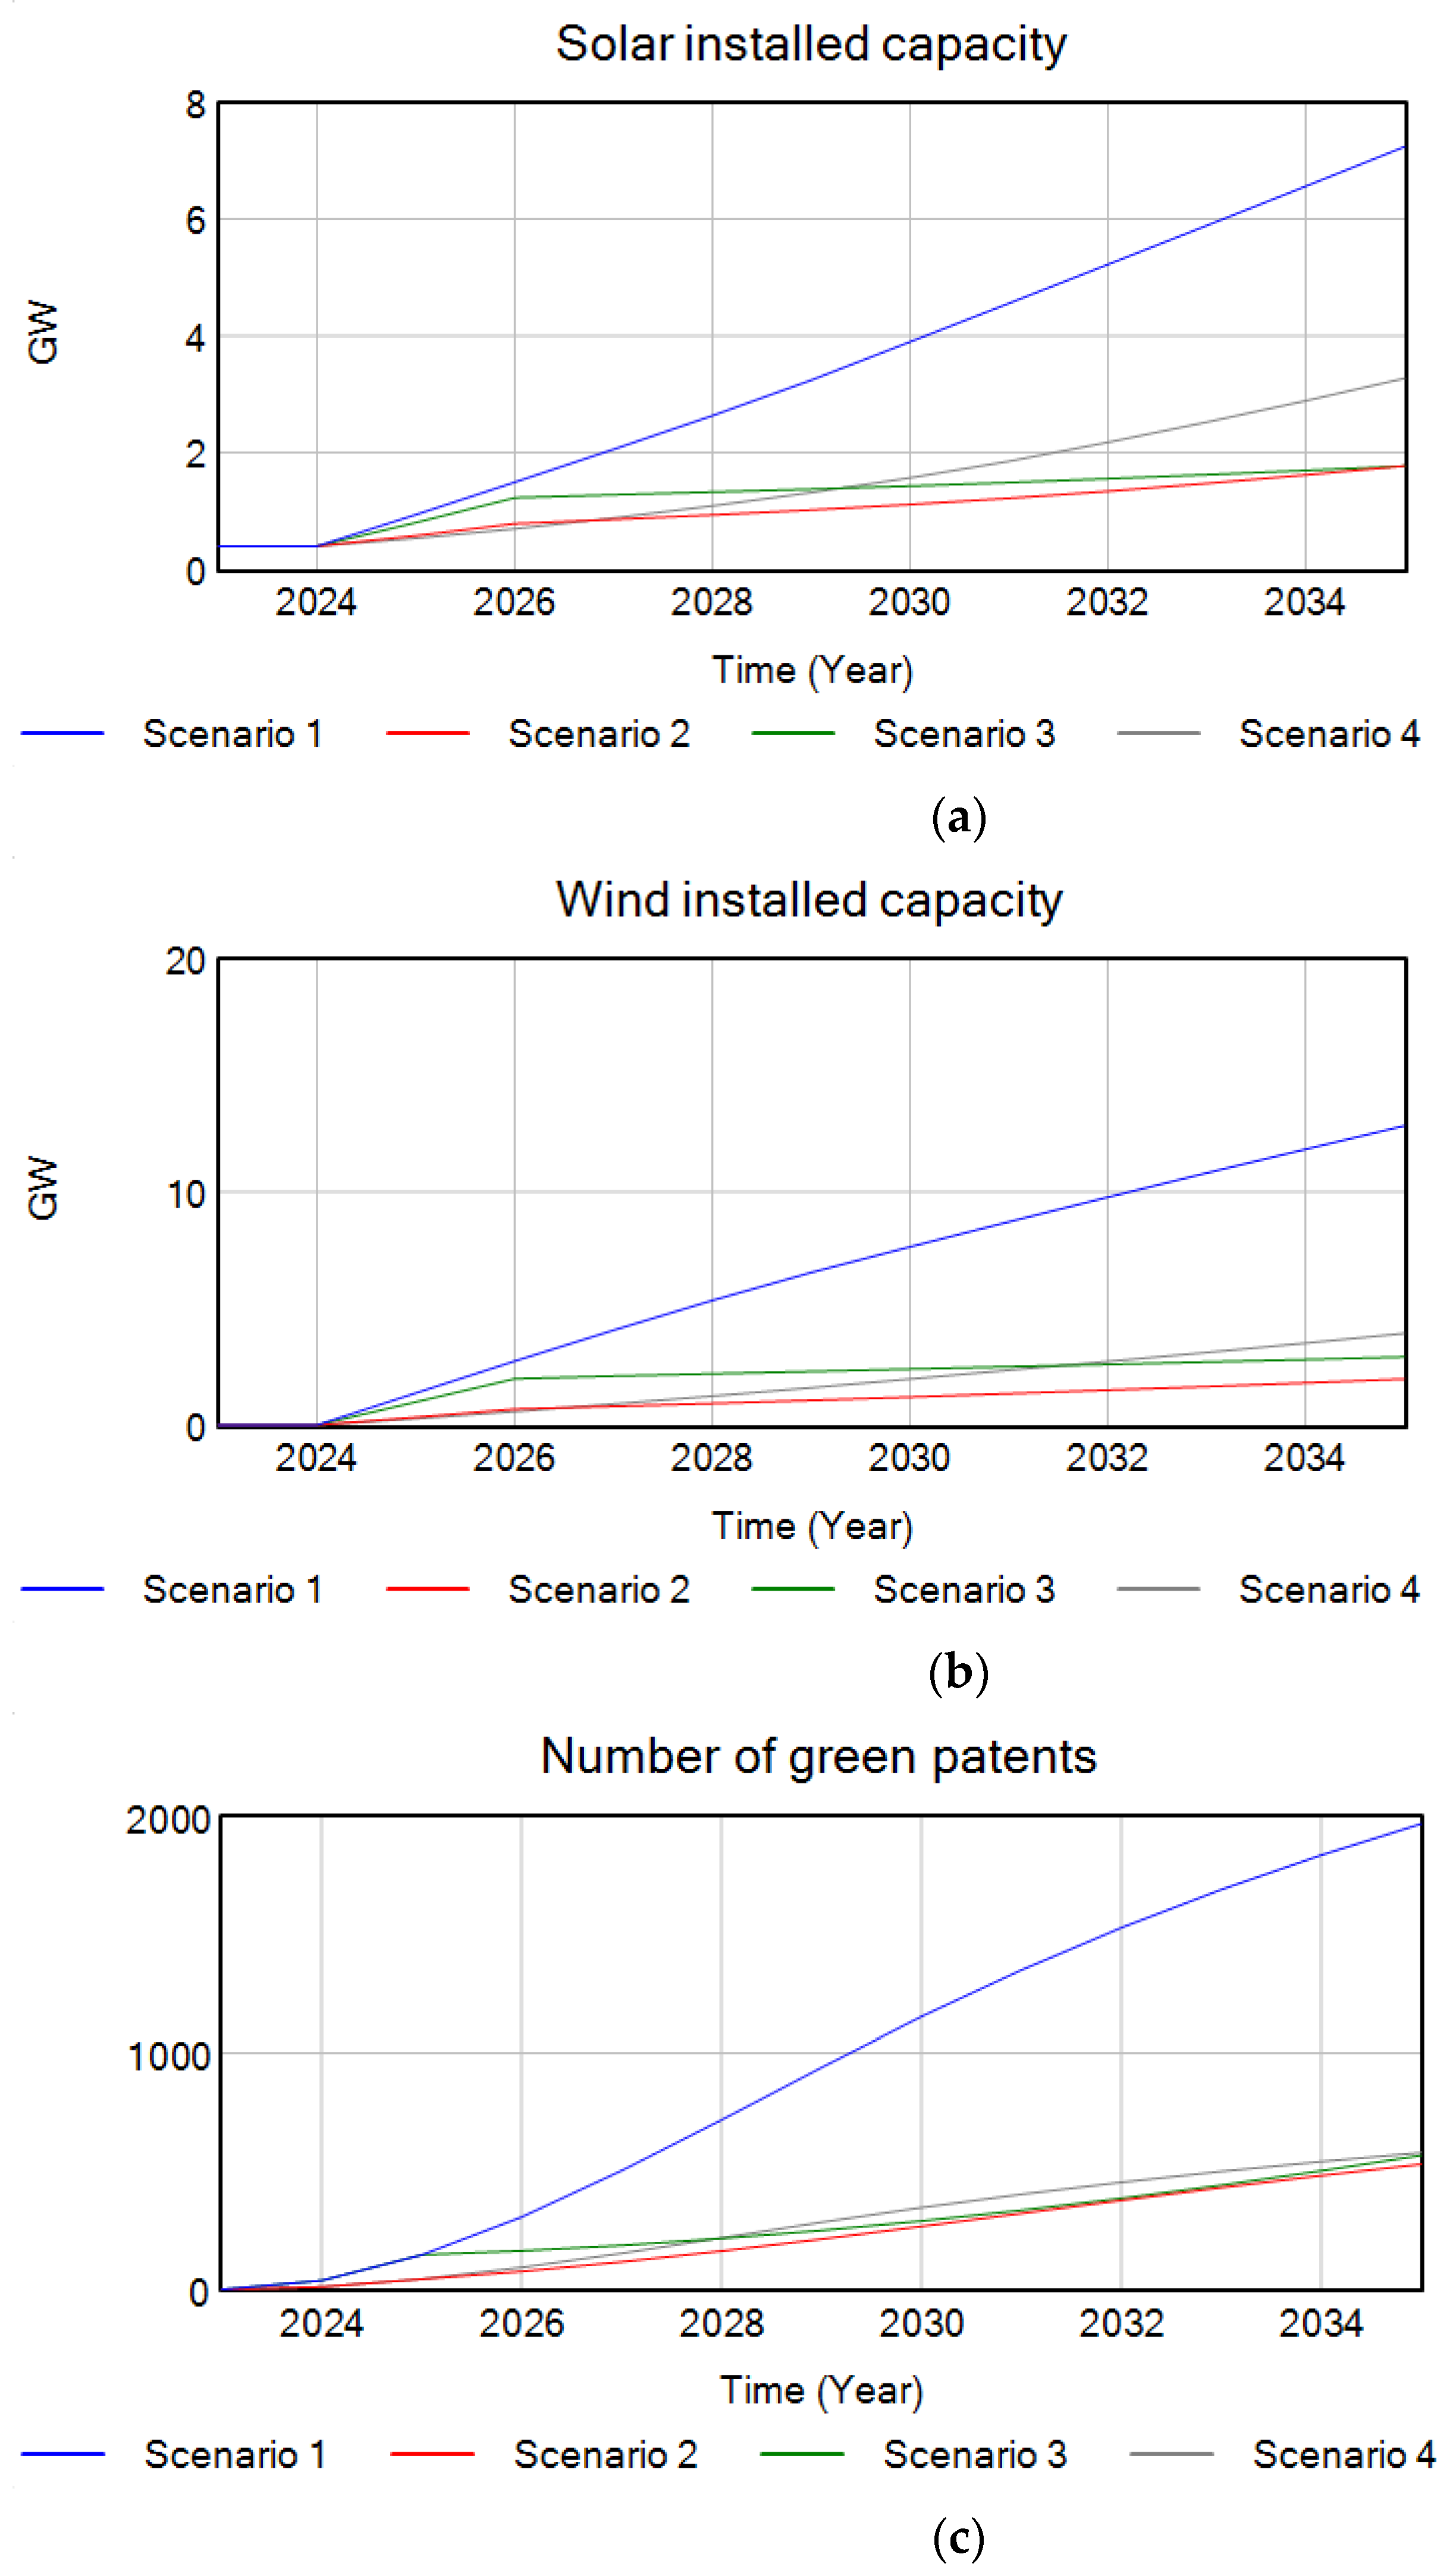
Figure 5a,b show solar and wind installed capacity, scenario 1: This scenario shows a very optimistic projection, with solar capacity rising sharply to approximately 8 GW and wind installed capacity approximately 20 GW by 2034. This could represent conditions under which there is heavy investment in solar and wind technologies, significant technological advancements, or strong policy support driving the rapid expansion. Scenario 2: Exhibits minimal growth, leveling off just above 2 GW in solar and 10 GW for wind. This might reflect a scenario with limited policy support, economic constraints, or less favorable market conditions for solar power. Scenario 3: Mirrors Scenario 2 closely, suggesting a similarly cautious approach to solar expansion or potential challenges that prevent any significant increase in installed capacity. Scenario 4: This curve is slightly more optimistic than Scenarios 2 and 3 but remains far below Scenario 1, indicating moderate growth that could be due to some improvements in technology or policy but not enough to create a boom.
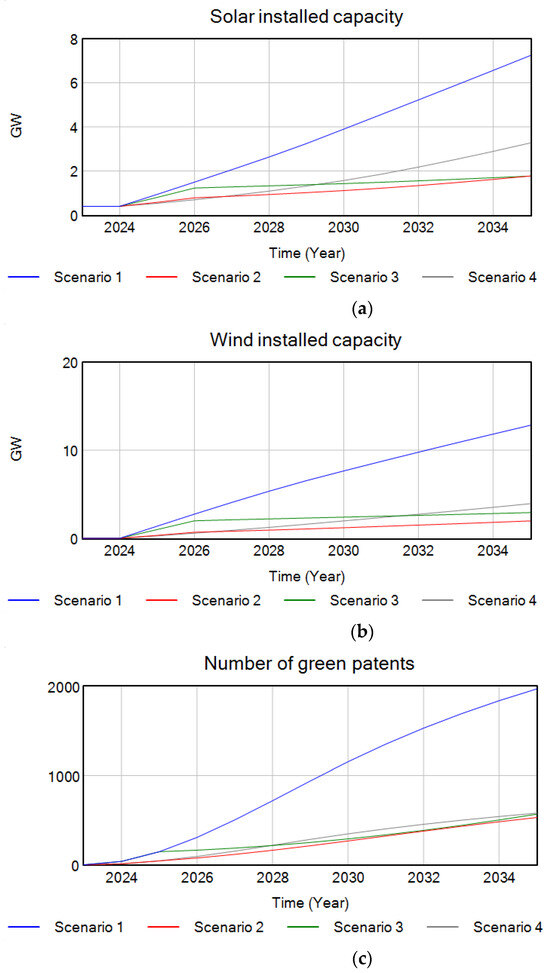
Figure 5.
(a) Solar installed capacity in Colombia; (b) Wind installed capacity in Colombia; (c) Number of green patents in Colombia.
Concerning Figure 5c, that shows the number of patents, Scenario 1: This scenario exhibits a very optimistic trajectory, with the number of green patents expected to rise sharply, reaching close to 2000 patents by 2034. This could represent a future where there is significant investment in green technology, robust governmental support, and strong market demand for sustainable innovations. Scenario 2: displays a modest increase in the number of green patents, peaking slightly above 200 patents by 2034. This trajectory suggests a moderate pace of growth in green technology innovation, possibly constrained by limited funding, less aggressive policy support, or slower adoption of green technologies in the market. Scenario 3: Similar to Scenario 2, this scenario shows a steady but slow growth in green patent registrations, suggesting only a slight increase over the decade. This could be indicative of a market that faces significant challenges in scaling up green technologies or where incentives for innovation are weak. Scenario 4: Reflects the highest optimism among all scenarios, with a steep curve indicating a rapid increase in green patent filings. Reaching nearly 1500 patents by 2034, this scenario could depict a highly favorable environment for green innovation, characterized by strong governmental incentives, substantial R&D investments, and a high level of industry engagement in developing sustainable solutions.
The study identifies a number of significant obstacles and financial limitations in situations with little financing for R&D and governmental support:
- Slow Technological Advancements: Innovation in technology and advances in renewable technologies are hampered by a lack of financing for R&D. Renewables find it challenging to compete with conventional energy sources since fewer breakthroughs that could result in cost savings and efficiency gains would occur from a lack of ongoing investment in research and development.
- Inadequate Policy Incentives: The lack of robust policy support, such as tax breaks, mandates for renewable energy, and subsidies, makes it difficult to encourage the use of renewable energy. Policies that lower financial obstacles and offer economic incentives are essential in fostering an environment that is friendly to renewable energy sources.
- Economic Constraints: It might be difficult to get the required investments in renewable energy projects due to factors such as restricted finance availability and conflicting financial priorities. This could lead to a lack of funding for infrastructure development and large-scale deployment, which would further impede the expansion of the renewable energy industry.
- Obstacle to Green Patents: The study observes a slight rise in green patents in situations where R&D funding and policy assistance are scarce. This suggests that the quantity of new and better technologies that reach the market, which is essential for long-term sustainability and competitiveness, is limited due to stalled innovation in renewable technology.
5. Policy Implications
The following section provides policy recommendations and suggested actions for decision-makers based on the model’s findings. To successfully implement financial incentives, improve infrastructure, and enact legislative changes, a holistic approach is essential.
In order to promote the uptake of sustainable energy solutions, a comprehensive plan with detailed instructions is essential. This comprises:
Easy Access to Low-Interest Loans and Grants: Make it more accessible for utilities to access affordable financing options for solar and wind energy systems. This will help reduce financial barriers and encourage more widespread use.
Provide tax benefits for businesses installing solar and wind technologies and streamline access to affordable loans or grants for acquiring renewable energies.
Business Incentives: By providing tax exemptions and financial incentives, businesses can be motivated to invest in renewable energy and electric vehicle infrastructure. Embracing sustainability not only benefits the environment but also offers financial advantages to organizations. For instance, organizations can take advantage of accelerated depreciation on solar and electric vehicle investments, leading to potential cost savings.
R&D investment policy: R&D for renewables offers substantial long-term advantages. By focusing on R&D, we can achieve innovative solutions and improvements in efficiency, ultimately lowering the production and implementation costs of renewable energy systems. This approach not only makes renewable energy more accessible and affordable but also encourages widespread adoption. As more capacity is installed and economies of scale are realized over time, the overall cost of renewable energy continues to decrease, creating a positive feedback loop that further accelerates the transition to sustainable energy sources.
Renewables target: Let us set ambitious targets to increase the use of renewable energy in the electrical industry, focusing particularly on solar and other sustainable sources. By defining realistic goals, we can encourage investment in renewable energy projects and establish a clear path toward adopting a cleaner energy mix. We can also put policies such as feed-in tariffs, renewable energy certificates, and mandates that require utility companies to obtain a specific percentage of their energy from renewable sources to help us achieve these targets.
Emissions Standards: To encourage the switch to greener alternatives like solar and wind, more strict emissions regulations should be applied to coal and gas technologies. This can involve introducing penalties for non-compliance, encouraging companies to invest in R&D, and increasing renewables installed capacity.
If Colombia adopts a comprehensive and cohesive policy approach, it can make the transition to sustainable and renewable energy sources effective. With this strategy, the nation will be able to capitalize on the synergies between renewable energy sources, which will have significant positive effects on the environment and the economy. Colombia may reduce its reliance on non-renewable energy sources and take major steps toward developing a more sustainable and environmentally friendly energy landscape by incorporating these technologies.
6. Conclusions
This paper provides an understanding of the effect between renewables growth, R&D investments, and policies to support renewables, such as auctions and tax reductions. In this research, R&D investments lead to reduced cost and increased installed capacity. Furthermore, this research validates the growth of renewable capacity not only for R&D investments but also necessary governmental policies.
The study shows that spending on R&D lowers costs and increases the installed capacity of renewable energy technology. The study demonstrates that strong government policies, such as tax breaks and auctions, are also necessary for the expansion of renewable energy capacity. R&D investments are not the only factor that contributes to this increase. The way these variables interact is essential to the growth of renewable energy.
The huge differences between the various scenarios point to the necessity of significant R&D spending and strong legislative backing in order to achieve rapid increases in renewable energy capacity and green patent registrations. On the one hand, the scenario with the highest growth across all indicators, Scenario 1, highlights the potential impact of a supportive environment marked by significant investments, strong government support, and advanced technical progress. On the other hand, scenario 2’s low growth, which is a result of significant R&D investment and little regulatory support, emphasizes the significance of advantageous market conditions and all-encompassing policies. The necessity for consistent and focused initiatives to remove obstacles and promote growth in renewable technologies is highlighted by the possibility of stagnation in both installed capacity and technological advancements in the absence of sufficient support and suitable conditions.
Several useful lessons gleaned from this analysis may aid conversations between regulators and the solar and wind industries about their reactions to the power transformation toward a high market share of renewable energy. The goal of this study has been accomplished: System Dynamics (SD) was utilized to explain the dynamic complexity of R&D investments and renewable regulations in boosting renewable energy market share.
Investment and policy support are critical for growth in renewable energy and innovation: The stark contrasts between the scenarios suggest that significant investment in R&D, coupled with strong policy support, is pivotal for achieving high growth in both renewable energy capacity and the registration of green patents. Scenario 1, which shows the highest growth across all metrics—solar and wind capacity, as well as patent registrations—illustrates the potential impact of a favorable environment that includes robust government support, substantial investments, and advanced technological developments. This scenario underscores the importance of a comprehensive approach that integrates policy, investment, and innovation to drive substantial progress in renewable energy sectors.
Challenges and market conditions play a significant role in shaping renewable growth. The minimal growth observed in Scenario 2 across solar and wind capacities and a modest increase in green patents highlight the effects of less favorable market conditions, limited policy support, and economic constraints. This scenario reflects a more cautious approach to renewable energy expansion and innovation, suggesting that without adequate support and favorable conditions, both installed capacities and technological advancements could stagnate. It emphasizes the need for consistent and targeted strategies to overcome barriers and foster growth in the adoption of renewable technologies and the development of green patents.
Colombia and Brazil are countries with a clean energy matrix; however, to increase non-conventional renewables such as solar and wind and continue this trend in the near future, a high level of R&D and policies are needed to support renewable. On the one hand, the scenarios that include high investment in renewable energies and high levels of number of patents for renewable capacity growth are higher. On the other hand, it is possible to see in scenario 4 in the countries studied that R&D represents the key to increasing renewables diffusion.
The paper achieves its goal on at least two fronts by employing a model-based framework: (a) it demonstrates the likely effects of R&D investments in three different countries, and (b) it establishes the conditions required to understand renewable energy diffusion and effectively manage policies and R&D investments to increase renewable capacity and reduce CO2 emissions in electricity systems. Finally, future research should look into the impact of battery storage and technical advancements on electricity market operations.
The research recommends that additional research be performed in the future to examine how battery storage and technological developments affect the way the electricity market functions. This is important because battery storage technology helps to mitigate the intermittent nature of renewable energy sources like wind and solar power. Battery storage helps stabilize the grid, improve energy security, and guarantee a more consistent supply of power by storing surplus energy generated during high generation periods and releasing it during low generating periods. Investigating the operational and financial effects of incorporating large-scale battery storage into the energy grid may offer important new perspectives on how to maximize grid efficiency, cut expenses, and improve renewable energy systems all around. The study also highlights the necessity of broadening the research’s focus to encompass additional renewable energy sources, such as biomass, geothermal, and offshore wind.
Reengineering current projects and the entire power system would be necessary to incorporate these various renewable energy sources. This entails modernizing the architecture of the grid, establishing new guidelines and standards, and building integrated systems capable of handling the distinct properties and outputs of various renewable energy sources. Subsequent investigations ought to endeavor to tackle these obstacles by investigating inventive remedies and formulating sturdy structures that facilitate the smooth assimilation of a diverse range of sustainable energy sources into the current energy infrastructure.
It is important to remember that the model has some restrictions. First of all, it ignores the function of energy storage batteries, including how they are installed and how they could affect the effectiveness and integration of renewable energy sources. The absence of energy storage from the model marks a major gap in its accuracy and applicability, as energy storage is essential to regulating the intermittent nature of renewable energy sources like solar and wind.
Furthermore, this model does not investigate the possibilities of other prospective renewable technologies; instead, its scope is exclusively focused on onshore renewable energy sources. Subsequent research endeavors may involve broadening the scope of the analysis to encompass offshore wind, geothermal energy, or biomass. These energy sources all provide different advantages and difficulties. For example, compared to onshore wind, offshore wind has far more potential because of its higher and more steady wind speeds. Though it has limited use in certain areas, geothermal energy provides a steady and dependable power source. In addition to being a green energy source, biomass can aid with trash management.
In conclusion, even though the current model offers insightful information, its shortcomings emphasize the necessity for additional study that considers a wider variety of renewable energy sources and incorporates crucial elements like energy storage systems. This broader focus would improve our comprehension of the ways in which we may achieve a more sustainable and resilient energy system.
Author Contributions
Conceptualization, M.U.-M. and M.M.H.; methodology, S.Z.; software, S.Z.; validation, M.U.-M. and S.Z.; formal analysis, M.M.H.; investigation, M.M.H.; resources, M.M.H.; data curation, M.U.-M.; writing—original draft preparation, S.Z.; writing—review and editing, M.U.-M.; visualization, M.M.H.; supervision, M.M.H.; project administration, M.M.H.; funding acquisition, M.M.H. All authors have read and agreed to the published version of the manuscript.
Funding
This work received funding from the Universidad Militar Nueva Granada under grant agreement No. IMP-ECO-3402.
Data Availability Statement
The datasets generated and/or analyzed during the current study are not publicly available but are available from the corresponding author on reasonable request.
Conflicts of Interest
The authors declare that they have no conflicts of interest related to this work.
Appendix A. Model Description
Installed capacity for solar and wind is modeled using a bass model and a logit model, using the following equations:
Regarding patents, the equations depend on patent price, renewable goal policy, and increase I&D investment. The equations are presented as follows:
In addition, Figure A1 shows the simulation model that was built. In Figure A1, it is shown that a growth in renewable energy can lead to reduced cost and increased capacity.
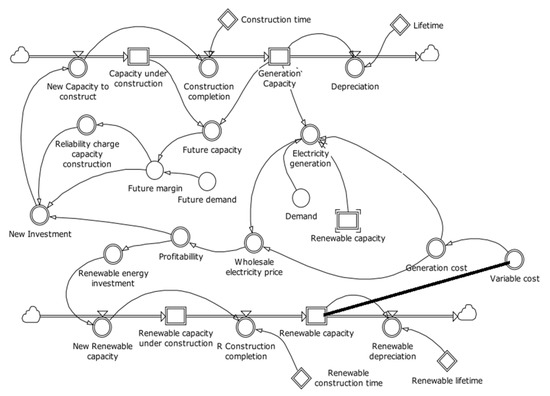
Figure A1.
Simulation model.
Figure A1.
Simulation model.

References
- Griffiths, S. Renewable Energy Policy Trends and Recommendations for GCC Countries. Energy Transit. 2017, 1, 3. [Google Scholar] [CrossRef]
- Faruqui, A. The Coming Transformation of the Electricity Sector: A Conversation with Amory Lovins. Electr. J. 2020, 33, 106827. [Google Scholar] [CrossRef]
- Painuly, J.P.; Wohlgemuth, N. Renewable Energy Technologies: Barriers and Policy Implications. In Renewable-Energy-Driven Future; Elsevier Inc.: Amsterdam, The Netherlands, 2021; ISBN 9780128205396. [Google Scholar]
- Hayat, S.; Safi, A.; Wahab, S.; Shahzad, K.; Chen, Y. Renewable Energy R&D and Natural Resources: A Success Story of Environmentally Friendly Financing in OECD Economies. Resour. Policy 2023, 83, 103655. [Google Scholar] [CrossRef]
- Chen, Z.; Mirza, N.; Huang, L.; Umar, M. Green Banking—Can Financial Institutions Support Green Recovery? Econ. Anal. Policy 2022, 75, 389–395. [Google Scholar] [CrossRef] [PubMed]
- Umar, M.; Safi, A. Do Green Finance and Innovation Matter for Environmental Protection? A Case of OECD Economies. Energy Econ. 2023, 119, 106560. [Google Scholar] [CrossRef]
- Washburn, C.; Pablo-Romero, M. Measures to Promote Renewable Energies for Electricity Generation in Latin American Countries. Energy Policy 2019, 128, 212–222. [Google Scholar] [CrossRef]
- Radpour, S.; Gemechu, E.; Ahiduzzaman, M.; Kumar, A. Developing a Framework to Assess the Long-Term Adoption of Renewable Energy Technologies in the Electric Power Sector: The Effects of Carbon Price and Economic Incentives. Renew. Sustain. Energy Rev. 2021, 152, 111663. [Google Scholar] [CrossRef]
- Moallemi, E.A.; de Haan, F.; Kwakkel, J.; Aye, L. Narrative-Informed Exploratory Analysis of Energy Transition Pathways: A Case Study of India’s Electricity Sector. Energy Policy 2017, 110, 271–287. [Google Scholar] [CrossRef]
- Ozcan, M. Assessment of Renewable Energy Incentive System from Investors’ Perspective. Renew. Energy 2014, 71, 425–432. [Google Scholar] [CrossRef]
- Vasseur, V.; Kamp, L.M.; Negro, S.O. A Comparative Analysis of Photovoltaic Technological Innovation Systems Including International Dimensions: The Cases of Japan and the Netherlands. J. Clean. Prod. 2013, 48, 200–210. [Google Scholar] [CrossRef]
- Karmellos, M.; Kosmadakis, V.; Dimas, P.; Tsakanikas, A.; Fylaktos, N.; Taliotis, C.; Zachariadis, T. A Decomposition and Decoupling Analysis of Carbon Dioxide Emissions from Electricity Generation: Evidence from the EU-27 and the UK. Energy 2021, 231, 120861. [Google Scholar] [CrossRef]
- Wardal, W.J.; Mazur, K.; Barwicki, J.; Tseyko, M. Fundamental Barriers to Green Energy Production in Selected EU Countries. Energies 2024, 17, 3664. [Google Scholar] [CrossRef]
- Long, X.; Chen, Y.; Du, J.; Oh, K.; Han, I. Environmental Innovation and Its Impact on Economic and Environmental Performance: Evidence from Korean-Owned Firms in China. Energy Policy 2017, 107, 131–137. [Google Scholar] [CrossRef]
- Mensah, C.N.; Long, X.; Boamah, K.B.; Bediako, I.A.; Dauda, L.; Salman, M. The Effect of Innovation on CO2 Emissions of OCED Countries from 1990 to 2014. Environ. Sci. Pollut. Res. 2018, 25, 29678–29698. [Google Scholar] [CrossRef] [PubMed]
- Dyner, I. Energy Modelling Platforms for Policy and Strategy Support. J. Oper. Res. Soc. 2000, 51, 136–144. [Google Scholar] [CrossRef]
- Morcillo, J.; Castaneda, M.; Jímenez, M.; Zapata, S.; Dyner, I.; Aristizabal, A.J. Assessing the Speed, Extent, and Impact of the Diffusion of Solar PV. Energy Rep. 2022, 8, 269–281. [Google Scholar] [CrossRef]
- Wang, Z.; Teng, Y.P.; Xie, L. Innovation for Renewable Energy and Energy Related Greenhouse Gases: Evaluating the Role of Green Finance. Sustain. Energy Technol. Assess. 2023, 57, 103279. [Google Scholar] [CrossRef]
- Lin, B.; Xie, Y. Positive or Negative? R&D Subsidies and Green Technology Innovation: Evidence from China’s Renewable Energy Industry. Renew. Energy 2023, 213, 148–156. [Google Scholar] [CrossRef]
- Li, W.; Cao, N.; Xiang, Z. Drivers of Renewable Energy Transition: The Role of ICT, Human Development, Financialization, and R&D Investment in China. Renew. Energy 2023, 206, 441–450. [Google Scholar] [CrossRef]
- Raza, M.Y.; Lin, B. Analysis of Pakistan’s Electricity Generation and CO2 Emissions: Based on Decomposition and Decoupling Approach. J. Clean. Prod. 2022, 359, 132074. [Google Scholar] [CrossRef]
- Uriona, M.; Grobbelaar, S.S. Innovation System Policy Analysis through System Dynamics Modelling: A Systematic Review. Sci. Public Policy 2019, 46, 28–44. [Google Scholar] [CrossRef]
- Xin-gang, Z.; Wei, W.; Ling, W. A Dynamic Analysis of Research and Development Incentive on China’s Photovoltaic Industry Based on System Dynamics Model. Energy 2021, 233, 121141. [Google Scholar] [CrossRef]
- Azad, S.M.; Ghodsypour, S.H. Modeling the Dynamics of Technological Innovation System in the Oil and Gas Sector. Kybernetes 2018, 47, 771–800. [Google Scholar] [CrossRef]
- Zahedi Rad, V.; Seifi, A.; Fadai, D. Policy Design for Transition from Imitation to Innovation in Emerging Photovoltaic Sectors Using a System Dynamics Model. Energy Policy 2023, 183, 113831. [Google Scholar] [CrossRef]
- Xin-gang, Z.; Wei, W.; Jieying, W. The Policy Effects of Demand-Pull and Technology-Push on the Diffusion of Wind Power: A Scenario Analysis Based on System Dynamics Approach. Energy 2022, 261, 125224. [Google Scholar] [CrossRef]
- Aboelmaged, M.; Hashem, G. Absorptive Capacity and Green Innovation Adoption in SMEs: The Mediating Effects of Sustainable Organisational Capabilities. J. Clean. Prod. 2019, 220, 853–863. [Google Scholar] [CrossRef]
- Guimón, J.; Chaminade, C.; Maggi, C.; Salazar-Elena, J.C. Policies to Attract R&D-Related FDI in Small Emerging Countries: Aligning Incentives with Local Linkages and Absorptive Capacities in Chile. J. Int. Manag. 2018, 24, 165–178. [Google Scholar] [CrossRef]
- Xu, M.; Xie, P.; Xie, B.C. Study of China’s Optimal Solar Photovoltaic Power Development Path to 2050. Resour. Policy 2020, 65, 101541. [Google Scholar] [CrossRef]
- Castrejon-Campos, O.; Aye, L.; Hui, F.K.P. Effects of Learning Curve Models on Onshore Wind and Solar PV Cost Developments in the USA. Renew. Sustain. Energy Rev. 2022, 160, 112278. [Google Scholar] [CrossRef]
- Qi, G.; Jia, Y.; Zou, H. Is Institutional Pressure the Mother of Green Innovation? Examining the Moderating Effect of Absorptive Capacity. J. Clean. Prod. 2021, 278, 123957. [Google Scholar] [CrossRef]
- Hille, E.; Oelker, T.J. International Expansion of Renewable Energy Capacities: The Role of Innovation and Choice of Policy Instruments. Ecol. Econ. 2023, 204, 107658. [Google Scholar] [CrossRef]
- Zapata, S.; Castaneda, M.; Herrera, M.M.; Dyner, I. Investigating the Concurrence of Transmission Grid Expansion and the Dissemination of Renewables. Energy 2023, 276, 127571. [Google Scholar] [CrossRef]
- Dyner, I.; Larsen, E.R. From Planning to Strategy in the Electricity Industry. Energy Policy 2001, 29, 1145–1154. [Google Scholar] [CrossRef]
- Gary, S.; Larsen, E.R. Improving Firm Performance in Out-of-Equilibrium, Deregulated Markets Using Feedback Simulation Models. Energy Policy 2000, 28, 845–855. [Google Scholar] [CrossRef]
- Ponzo, R.; Dyner, I.; Arango, S.; Larsen, E.R. Regulation and Development of the Argentinean Gas Market. Energy Policy 2011, 39, 1070–1079. [Google Scholar] [CrossRef]
- Bunn, D.W.; Larsen, E.R. Sensitivity of Reserve Margin to Factors Influencing Investment Behaviour in the Electricity Market of England and Wales. Energy Policy 1992, 20, 420–429. [Google Scholar] [CrossRef]
- Serra, P. Chile’s Electricity Markets: Four Decades on from Their Original Design. Energy Strategy Rev. 2022, 39, 100798. [Google Scholar] [CrossRef]
- XM Descripción Del Sistema Eléctrico Colombiano. Available online: http://informacioninteligente10.xm.com.co/Pages/ayuda.aspx (accessed on 28 January 2018).
- Aneel Capacidad Instala Brasil. Available online: https://www.gov.br/aneel/pt-br (accessed on 28 January 2018).
- Gobierno-de-Chile Chile, Fuente Energética Para Un Planeta Cero Emisiones HIDRÓGENO VERDE; 2020. Available online: https://energia.gob.cl/sites/default/files/estrategia_nacional_de_hidrogeno_verde_-_chile.pdf (accessed on 28 January 2018).
- Tolmasquim, M.T.; de Barros Correia, T.; Addas Porto, N.; Kruger, W. Electricity Market Design and Renewable Energy Auctions: The Case of Brazil. Energy Policy 2021, 158, 112558. [Google Scholar] [CrossRef]
- Melo dos Santos, M.E.; Castro, R.; Costa, H. Contradictory Electric Energy Policies and Its Impacts on the Renewability of the Electric Matrix: Brazil as a Case Study. Heliyon 2023, 9, e19309. [Google Scholar] [CrossRef] [PubMed]
- Ávila, L.; Mine, M.R.M.; Kaviski, E.; Detzel, D.H.M. Evaluation of Hydro-Wind Complementarity in the Medium-Term Planning of Electrical Power Systems by Joint Simulation of Periodic Streamflow and Wind Speed Time Series: A Brazilian Case Study. Renew. Energy 2021, 167, 685–699. [Google Scholar] [CrossRef]
- XM Capacidad Instalda Mercado Electrico Colombiano. Available online: http://informacioninteligente10.xm.com.co/oferta/Paginas/default.aspx (accessed on 9 April 2017).
- Congreso Colombia Ley 1715. 2014. Available online: https://www.funcionpublica.gov.co/eva/gestornormativo/norma.php?i=57353 (accessed on 28 January 2018).
- International Energy Agency. Energy Efficiency Policy Toolkit 2024—From Versailles to Nairobi; International Energy Agency: Paris, France, 2024. [Google Scholar]
- REN21 REN21 2022; 2023. Available online: https://www.ren21.net/gsr-2022/ (accessed on 28 January 2018).
- Eia Annual Energy Outlook 2023; 2024. Available online: https://www.eia.gov/outlooks/aeo/ (accessed on 28 January 2018).

Disclaimer/Publisher’s Note: The statements, opinions and data contained in all publications are solely those of the individual author(s) and contributor(s) and not of MDPI and/or the editor(s). MDPI and/or the editor(s) disclaim responsibility for any injury to people or property resulting from any ideas, methods, instructions or products referred to in the content. |
© 2024 by the authors. Licensee MDPI, Basel, Switzerland. This article is an open access article distributed under the terms and conditions of the Creative Commons Attribution (CC BY) license (https://creativecommons.org/licenses/by/4.0/).