Article

Optimal Placement and Sizing of Battery Energy Storage Systems for Improvement of System Frequency Stability †

by
Amrit Parajuli
,
Samundra Gurung
* and
Kamal Chapagain
*
Department of Electrical and Electronics Engineering, Kathmandu University, Dhulikhel 6250, Nepal
*
Authors to whom correspondence should be addressed.
This paper is the extended version of the conference paper, Optimal Sizing and Placement of Battery Energy Storage Systems for Enhancement of Grid Frequency Stability, in 2023 10th IEEE International Conference on Power Systems (ICPS), 13–15 December 2023, Cox’s Bazar, Bangladesh.
Electricity 2024, 5(3), 662-683; https://doi.org/10.3390/electricity5030033
Submission received: 24 June 2024 / Revised: 3 September 2024 / Accepted: 12 September 2024 / Published: 13 September 2024

Abstract

:
Modern power systems are growing in complexity due to the installation of large generators, long transmission lines, the addition of inertialess renewable energy resources (RESs) with zero inertia, etc., which can all severely degrade the system frequency stability. This can lead to under-/over-frequency load shedding, damage to turbine blades, and affect frequency-sensitive loads. In this study, we propose a methodology to improve the two critical frequency stability indices, i.e., the frequency nadir and the rate of change of frequency (RoCoF), by formulating an optimization problem. The size and placement location of battery energy storage systems (BESSs) are considered to be the constraints for the proposed optimization problem. Thereafter, the optimization problem is solved using the three metaheuristic optimization algorithms: the particle swarm optimization, firefly, and bat algorithm. The best performing algorithm is then selected to find the optimal sizing and placement location of the BESSs. The analyses are all performed on the IEEE 9-bus and IEEE 39-bus test systems. Several scenarios which consider multiple generator outages, increased/decreased loading conditions, and the addition of RESs are also considered for both test systems in this study. The obtained results show that under all scenarios, the proposed method can enhance system frequency compared to the existing method and without BESSs. The proposed method can be easily upscaled for a larger electrical network for obtaining the optimized BESS size and location for the improvement of the system frequency stability.

1. Introduction

1.1. Motivation

The system frequency is an important system health parameter, and the lack of maintaining it within its limits may damage turbine blades, cause load shedding, affect frequency-sensitive loads, cause time errors in measurement systems, and even cause major blackouts [1]. Moreover, recently, the proliferation of renewable energy sources (RESs) can reduce the system inertia (owing to the displacement of conventional power plants) and may not provide primary and secondary frequency support, which may result in the frequency degradation of the system. Frequency stability refers to the ability of a power system to maintain a steady frequency following a severe system upset, which results in a significant imbalance between generation and load [2]. Recently, in many countries, there has been a growing focus on enhancing frequency stability through the installation of energy storage systems (ESSs) [3,4]. ESSs can provide inertial support and help in the primary frequency response of the system, which helps to limit load shedding and other frequency-related issues [5].

1.2. Related Works

Frequency stability is highly impacted by the share of RESs in the electricity grid. Recent research has identified a growing emphasis on power generation from intermittent RESs. In the global context, the interconnection of wind power plants in the energy grid is significantly elevated, according to the authors of [6]. To assess the volatile adequacy of wind power plants, Facchini employed a hybrid model to simulate the cross-correlated components of wind velocity [7]. In a similar way, the need to consider the voltage and frequency dependence of complex loads for a transient analysis were highlighted in [8]. In recent years, numerous studies have emphasized the importance of ESSs for maintaining power system frequency stability. A comparative analysis between a bulk ESS and a distributed ESS across various levels of RES penetration within an IEEE 16-machine large-scale network is discussed in [9]. Their study revealed that the bulk ESS provides superior frequency support when the RES penetration is high, while there is no noticeable distinction between the bulk and distributed ESSs at lower penetration levels. Furthermore, the study found that the frequency nadir was reduced when using the distributed ESS compared to the bulk ESS. This reduction was attributed to the fact that the distributed ESS supplied less active power for the same ESS storage capacity. In a similar manner, a 50 MW flywheel energy storage (FES) system underwent testing within the Northern Chile Interconnected System (NCIS) while connected to the Argentinian Interconnected System (AIS). The primary objective was to assess its efficacy in providing support for primary frequency regulation and to analyze its impact on system stability. This assessment involved the utilization of a small-signal analysis and time domain simulations. The study included an examination of the eigenvalues and sensitivity pertaining to the inter-area mode to pinpoint the optimal installation site for the FES plant. The findings were corroborated across various operational scenarios involving wind and solar power. By siting the FES plant in the most suitable location within the NCIS, the damping ratio of the inter-area mode saw a significant improvement, increasing from 0.53% to 13.1% [10]. The researchers of [11] conducted an optimization study by employing a linear network-reduced power system model within a 12-bus three-region power grid. They concluded that frequency stability was not solely contingent on the total system inertia; it was also influenced by the location of faults and the strategic allocation of additional inertia within the power grid. Their research also unearthed another crucial insight, i.e., to alleviate the impact of disturbances on the system, it was essential to position the ESS in a manner that ensured the uniform distribution of inertia across all buses. For the best sizing and positioning of an ESS, a case study was performed at an isolated section of the Mexican power grid [12] that explored optimization techniques for determining the optimal size of a BESS for grid stability. A study by [13] utilized the DIgSILENT PowerFactory software to investigate the impact of load models on the frequency stability of a power grid. Their research involved a modified version of a reduced-order equivalent model of the New England Test System (NETS) and the New York Power System (NYPS). To achieve this, they adopted a composite load model approach that incorporated a combination of static–dynamic characteristics (30–70%) within the system. The static load modeling aspect was further segmented into constant power and constant impedance load models, leading to an examination of the following five distinct case study scenarios: f n a d i r values of 49.82 Hz for the composite load (static + induction machine) (CMP), 49.83 Hz for the ZIP model, 49.8 Hz for constant power with frequency dependence, 49.78 Hz for constant power (PL), and 49.86 Hz for constant impedance (ZL). The researchers of [14] introduced simplified linear models for evaluating frequency stability. The primary goal in their study was to develop a simplified linear model that accurately represented the dynamic relationship between power and frequency within the system, encompassing both conventional and converter-based power generation units. To verify the model’s accuracy, it underwent validation using an IEEE 39-bus system. In the context of the Indonesian grid, a technique reliant on discrete Fourier transform (DFT) was utilized to determine the optimal battery energy storage system (BESS) capacity for varying power generation levels [15]. A sensitivity study for decreasing transmission line loading using an ESS was presented in [16]. The size and position of the ESS in the transmission network was determined to minimize the frequency deviation and the RoCoF following a power disturbance. A recent case study on an Australian island proposed a methodology for the optimal sizing of a BESS to improve the frequency response of isolated microgrids [17]. This method can be extended and replicated to grid size BESS optimization. The researchers of [18] conducted an evaluation of the Israeli power grid, characterized by the significant presence of renewable energy sources and energy storage systems. Their study delved into the influence of the placement and scale of renewable energy sources and energy storage systems on the power grid. Additionally, their research demonstrated that the stability of the grid’s frequency was contingent upon the degree of RES penetration. Moreover, their findings indicated that the impact of these factors is projected to diminish by 2025 compared to the conditions in 2019. This reduction is attributed to the more uniform distribution of inertia in scenarios where storage systems are located in close proximity to the renewable energy sources. In the same way, the authors of [19] proposed a methodology for improving the frequency nadir using the optimal size of hybrid energy storage systems (HESSs). In addition, the study discussed in [20] conducted an examination of the positioning of a BESS within the power grid. A thorough comparison between placing the BESS close to the generation side and placing it near the load side revealed that the grid’s frequency stability improved when the BESS was connected closer to the load or consumer’s side. The researchers in [21] conducted a study that presented a two-step approach that utilized the frequency dynamic signature (FDS) and the step reduction iterative algorithm (SRIA) for identifying the optimal placement locations for an ESS. Collectively, these investigations underscore the essential role of ESSs in preserving frequency stability. In the same vein, a pioneering binary grey wolf multi-objective optimization algorithm was introduced to address the placement location and sizing of BESSs within power systems. This algorithm employs binary decision variables to identify the optimal placement locations at specific buses, as detailed in [22]. The objective function is defined with respect to the voltage deviation and frequency response, and the outcome shows that the test system’s frequency nadir increases and the RoCoF decreases. The authors of [23] proposed a method to find the optimal location and size of BESSs and used it with a demand response program to improve power system frequency control. However, they only solved the proposed method with a genetic algorithm that did not guarantee the optimal solution. Moreover, the work was conducted in a two-area system. A recent examination given in [24] evaluated the utilization of metaheuristic optimization algorithms for addressing power system issues. The review identified that, over the past few years, a broad range of algorithms has been utilized for resolving such problems. Nevertheless, the authors did not include any studies on the application of metaheuristics in the context of frequency stability. All the reviewed literature has discussed the applications of BESSs for the enhancement of frequency stability. However, none of the work has discussed a method to optimally size the BESSs, as well as their placement location in a large power system network. Furthermore, in this study, we do not find the BESS placement by approximating using a linearization approach, as discussed in [21], as the power system is nonlinear and the obtained location may not be optimal. Similarly, in this study, we utilize multiple metaheuristic optimization algorithms to solve the proposed method, since solving using a single algorithm, as depicted in [22,23], does not provide the information to confirm that the obtained solution is truly optimal. A brief comparison of the proposed work with the related works is given in Table 1.

1.3. Contributions of This Paper

The major contributions of this paper are as follows:
  • The proposal of a methodology based on optimization to locate (considering all power system buses) and size BESSs for the enhancement of the system frequency stability indices, i.e., the frequency nadir and RoCoF.
  • The application of three metaheuristic optimization algorithms to solve the proposed optimization problem and selection of the best performing algorithm for the proposed method. The optimization is solved using the approach of co-simulation between DIgSILENT and MATLAB.
  • The detailed analysis of the frequency stability indices under different scenarios, such as different large generator outages, RES penetrations, and load variations, in two test systems, i.e., the IEEE 9-bus system and the 39-bus system.

1.4. Paper Organization

This paper is organized as follows: Section 1 describes the introduction and contribution of this study. Section 2 provides the theoretical background to understand this study, followed by Section 3, which describes the proposed methodology, the optimization formulation and solution adoption. Section 4 provides the results, followed by the conclusions of this study in Section 5.

2. Theoretical Background

2.1. Frequency Stability Indices

The dynamics of a power system can be understood from the swing equation as:
2 H e q d Δ ω d t = Δ P m Δ P L = Δ P m Δ P G D . Δ ω
where H e q signifies the equivalent inertia constant of the entire system, Δ P m gives the per unit change in mechanical power, and Δ P L is the change in electrical power. The power due to the frequency-dependent characteristics of loads is indicated by the term D . Δ ω ; so, Δ P G represents the rest of the non-frequency-sensitive loads.
The system’s frequency following a change in load is given by the governor and load damping characteristics, as shown in Figure 1.
The frequency nadir and RoCoF are generic indicator terms that are used to define a system’s frequency strength. The frequency nadir is the minimum point in the frequency deviation during the disturbance period. The frequency nadir can be calculated from the frequency deviation (difference between the nominal frequency and minimum attained frequency) during generator outages, and it plays a significant role in power systems. A larger frequency deviation leads to more stages of under-frequency load shedding, resulting in the loss of a large number of consumers, and thus negatively impacting the power system’s reliability. The frequency nadir depends on the primary frequency response and equivalent system inertia ( H e q ) [25]. The R o C o F represents the robustness of the electrical grid. Generally, it is the time derivative of the electrical frequency of a power system given by [26]:
R o C o F = Δ P d . f 0 2 H e q
where Δ P d gives the size of power disturbance in p.u. and f 0 is the nominal system frequency in Hz. The equivalent inertia, H e q , is generally expressed in seconds. Therefore, in the transient frequency stability analysis, the R o C o F signifies df/dt measured in Hz/s.
The power system’s steady-state frequency is almost constant. However, after an event, the frequency of each generator changes from the nominal frequency ( f 0 ) to a new local frequency ( f k ). Therefore, the behavior of the system during the transient period can be understood with the center of inertia frequency ( f C O I ). In general, the f C O I of an interconnected system is computed using the weighted-average method as in [20]:
f C O I = k = 1 N S k . H k . f k k = 1 N S k . H k
where N represents the total number of generators connected in the power system network, f k is the frequency of each of the individual generators, S k denotes the apparent power rating of the synchronous machines, and H k is the inertia time constant of these generators in seconds. The term f C O I can be used interchangeably with f 0 for systems operating at a steady condition.

2.2. Battery Energy Storage Systems

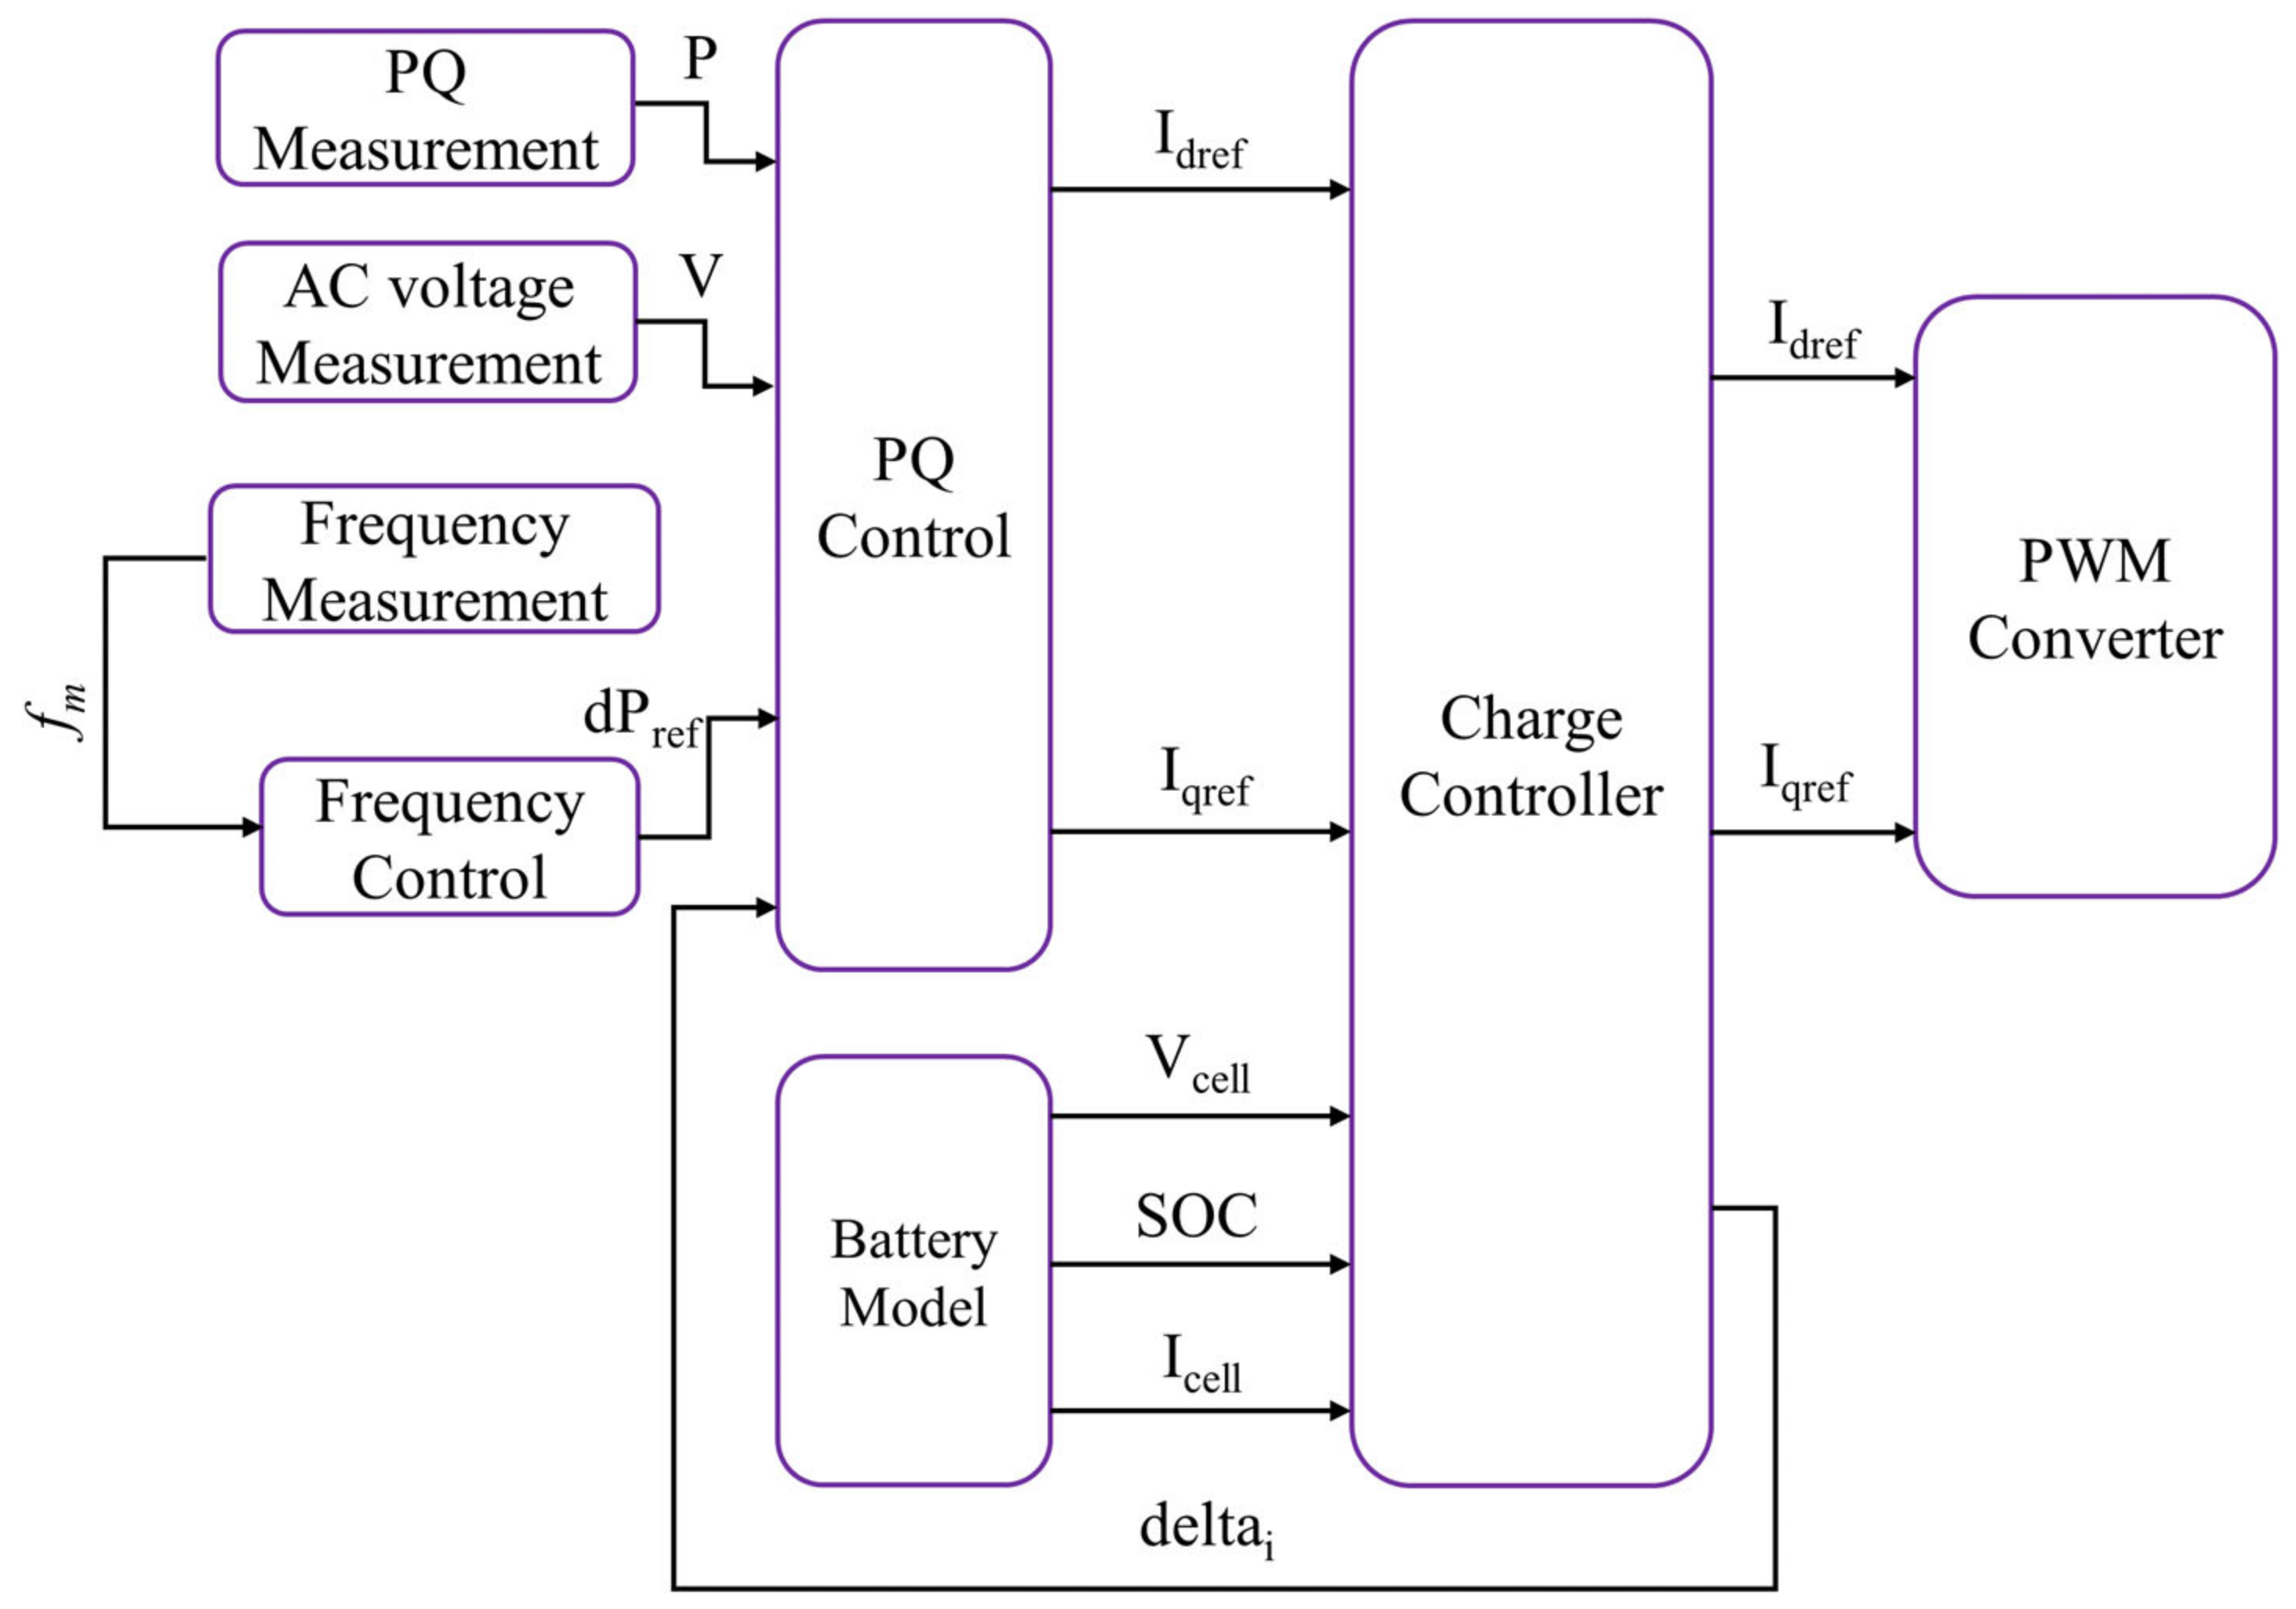
A model of the BESS used in this study is shown in Figure 2. The BESS consists of a battery, charge controller to keep the battery charging and discharging within the limits, measurement blocks (voltage, active-reactive power, and frequency), etc. The central controller is a PQ controller which controls the active and reactive power exchange from the BESS [27]. The active power is controlled using Idref and the reactive power is controlled using Iqref. These values are given to the PWM converter via the charge controller which basically exchanges the required active and reactive power set by the PQ controller.
The BESS controller also consists of a frequency controller which changes the active power reference given to the PQ controller based on the system frequency deviation and the droop setting [28]. The structure of the frequency controller is shown in Figure 3.
In this study, the battery model assumes the terminal voltage of the battery as a function of the state of charge ( S o C ), internal resistance ( R i n t ) , and the battery capacity ( C b a t ) . Assuming the battery capacity to be constant, the model used in this work can be understood using the general relationship between the terminal voltage, state of charge, and battery current as:
V t = [ S o C .   V M a x + 1 S o C . V M i n ] I . R i
where V t is the terminal voltage; S o C is the state of charge; I is the battery current; R i is the internal resistance; and V M a x and V M i n correspond to the voltages during fully charged and discharged conditions, respectively.
While the battery supplies the power to the grid, the value of S o C decreases, the S o C for the discharging condition can be estimated by the following relation:
S o C t = S o C t 1 0 t I C b a t .   d t
where S o C t is the battery state of charge at time t , S o C t 1 is the initial state of charge expressed in %, I is the charge/discharge current measured in A, t is time measured in s, and C b a t is the battery capacity in Ah. A detailed table showing the values of parameters used for BESS modeling is presented in Table A1.

3. Proposed Methodology

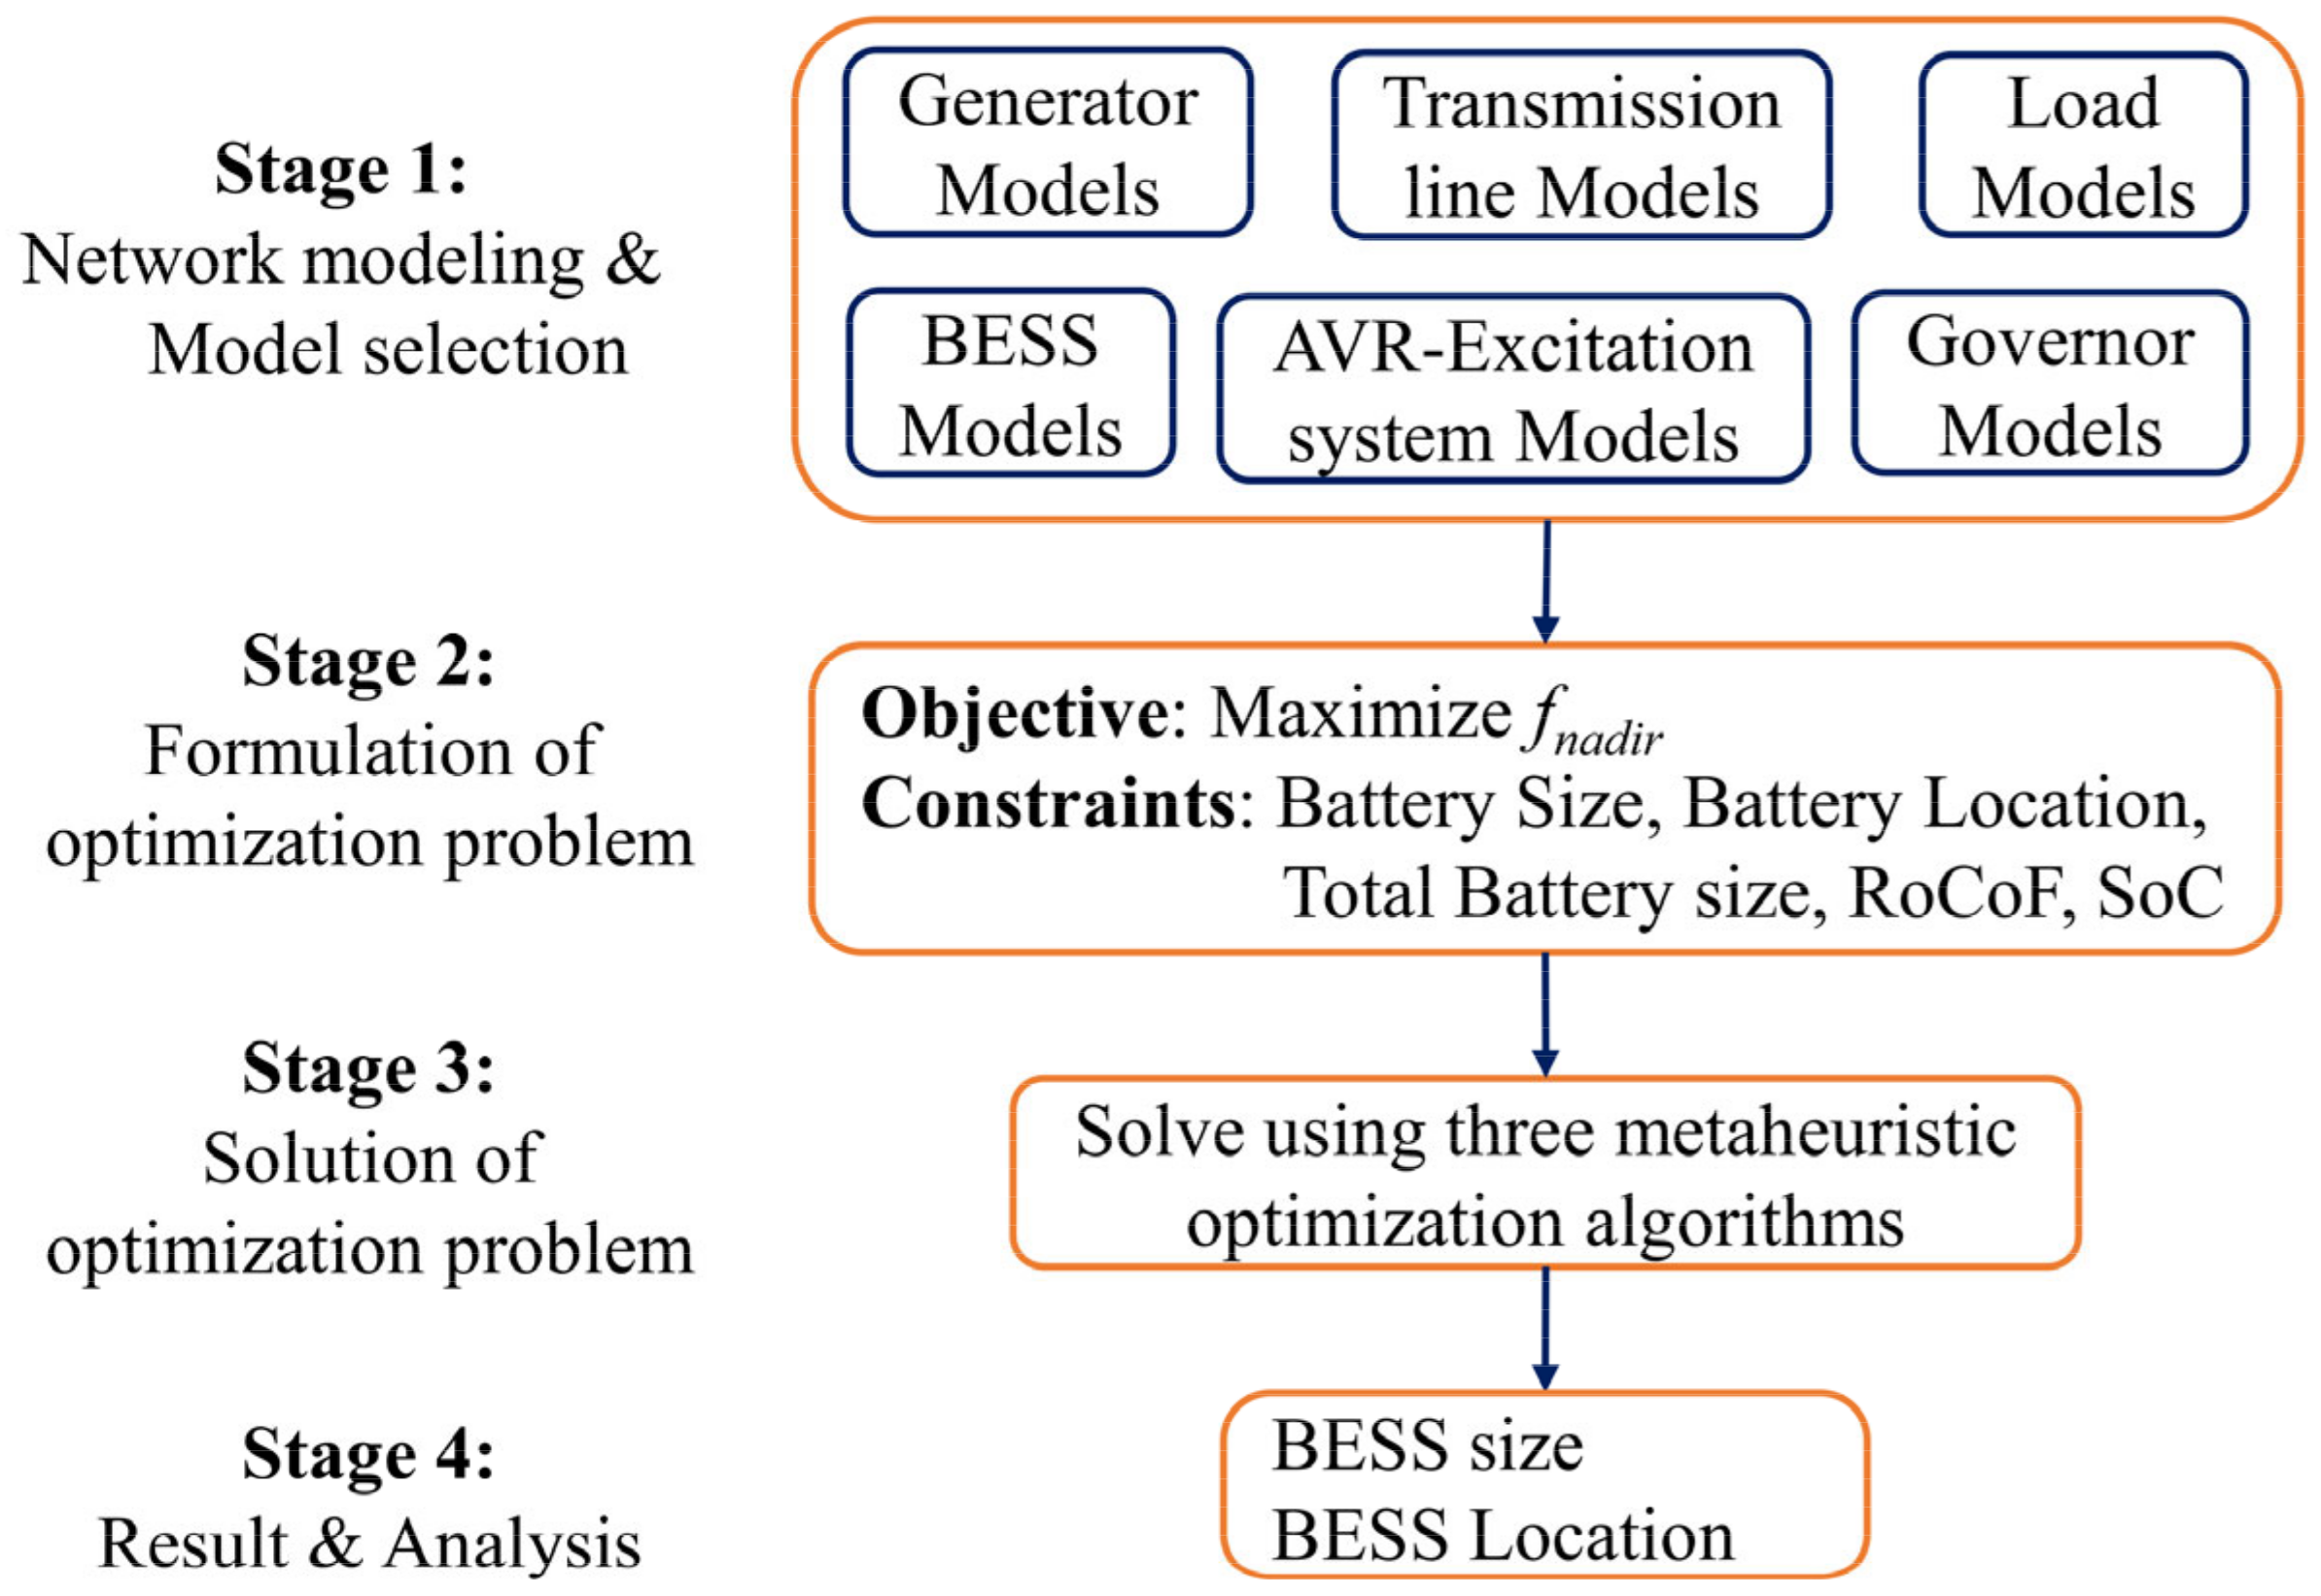
The proposed methodology, for this study, is shown in Figure 4. In the first stage, the components of the power systems (IEEE 9-bus system and IEEE 39-bus system) are modeled, i.e., excitation system, governor, machine dynamics, BESSs, line and load parameters, etc. Then, an optimization problem is formulated in which the major objective is to maximize the system’s frequency nadir with the location and size of the BESSs, SoC limits of the BESSs, and the RoCoF limits being the constraints. Then, this optimization problem, which is nonlinear and non-convex, is solved using metaheuristic optimization algorithms. This study uses three established swarm-based optimization algorithms, namely, particle swarm optimization (PSO), bat algorithm (BA), and firefly algorithm (FA), because there is no single algorithm that provides the best solution as it is problem-dependent. Since the optimization problem involves both continuous (battery size) and discrete (battery location: yes or no) constraints, all the utilized optimization algorithms are modified to incorporate them. More details regarding this can be found in Section 3.2. All of the algorithms are coded and solved in MATLAB for this study. Then, the result from the best-performing algorithm is used to obtain the final size of the BESS and the locations that can enhance the system’s frequency stability.

3.1. Formulation of the Optimization Problem

As this study is related to improving the frequency stability of a grid with the integration of a BESS, the two stability indices f n a d i r and R o C o F play a key role. Therefore, the overall optimization problem can be represented as an objective function:
M a x i m i z e :   f n a d i r
Subjected to:
B E S S M i n   B E S S i B E S S M a x
B u s 1     L o c i { 0 ,   1 } B u s N
i = 1 N   B E S S i . L o c i B E S S l i m i t
R o C o F M i n R o C o F R o C o F M a x
S o C M i n S o C i S o C M a x
where B E S S i is the size of the BESS to be installed at the ith bus (expressed in MW). Equation (7) limits the maximum power of the BESS that can be integrated into any power system bus. The total number of system buses selected as the potential locations for the placement of the BESS is designated as L o c i , which should range between B u s 1 and B u s N , as in (8). The product of B E S S i and L o c i is utilized to calculate the size of the BESS required for every ith bus. As a result, the total sum of the BESS integrated into the grid should not exceed B E S S l i m i t , i.e., the maximum allowable BESS penetration limit. The R o C o F is determined using f C O I according to (3). The limits for R o C o F are demonstrated in (10), which should lie within the range ±1.5 Hz/s (for 60 Hz system), i.e., 0.0025 p.u./s [29]. The constraint for the battery’s state of charge is listed in (11). To extend the battery life, the SoC should have a value between S o C M i n and S o C M a x (particularly in the range from 0% to 100%).

3.2. Metaheuristic Optimization Algorithms

As discussed above, the formulated optimization problem is nonlinear and non-convex, and hence metaheuristic optimization algorithms were used in this study; metaheuristic algorithms are able to find good final solutions for such complex optimization problems [30]. This paper utilizes three popular swarm-based optimization algorithms, which are briefly described below.

3.2.1. Particle Swarm Optimization

PSO, originally invented by Kennedy and Eberhart in 1995, is a widely used population-based search algorithm that mimics the social behavior of flocking birds to solve an optimization problem [31]. The particles move in such a way that it converges to an optimal solution.
The position ( p i ) and velocity of each particle is:
s k + 1 i = ω . s k i + α . r 1 p b e s t k i p k i + β . r 2 g b e s t k i p k i
p k + 1 i = p k i + s k + 1 i . t
where r 1 and r 2 are random numbers between 0 and 1, ω is the inertia weight, α and β are the learning factors that adjust the step length of each iteration.
The particle which provides the best fitness value is selected as the final solution. As the proposed optimization problem also requires a discrete evaluation (BESS location), the method proposed in [32] is used for this purpose. The position p is given by:
B E S S 11 B E S S 12 B E S S 13 B E S S 1 m : L o c 11 L o c 12 L o c 13 L o c 1 m B E S S 21 B E S S 22 B E S S 23 B E S S 2 m : L o c 21 L o c 22 L o c 23 L o c 2 m B E S S 31 B E S S 32 B E S S 33 B E S S 3 m : L o c 31 L o c 32 L o c 33 L o c 3 m : B E S S n 1 B E S S n 2 B E S S n 3 B E S S n m : L o c n 1 L o c n 2 L o c n 3 L o c n m
Each row of the composite matrix denotes a candidate solution. The dimension of the matrix is 2 m , where m is equivalent to the number of power system buses in which BESSs are to be placed. B E S S n 1 corresponds to the battery size at location 1 for the nth population and L o c n 1 corresponds to the location of B E S S 1 (either 0 or 1) for the nth population.

3.2.2. Firefly Algorithm

The FA was developed by Yang in 2008 is a nature-inspired algorithm that mimics the flashing characteristics of tropical firefly species. The fireflies are attracted towards the ones with the highest brightness, i.e., the highest fitness value, and this movement is given by:
p k + 1 i = p k i + β e γ r 2 p a p b + α ε i
In this paper, the method proposed in [33] is used for discrete optimization with the FA.

3.2.3. Bat Algorithm

The BA, developed by Xin-She Yang in 2010 [34], is a bio-inspired metaheuristic algorithm that finds the solution based on the echolocation behavior of microbats. The bats’ echolocation frequency is given by (16) and the movement of the bats is given by (17) and (18), as follows:
E i = E m i n + E m a x E m i n β
s k + 1 i = s k i + p k + 1 i p b e s t   E i
p k + 1 i = p k i + s k + 1 i
where β ∈ [0, 1] is the random number obtained from the uniform distribution and x b e s t is the current global best location of the bats. The method proposed in [35] is used in this study to solve the discrete BA optimization.

3.3. Solving the Optimization Problem

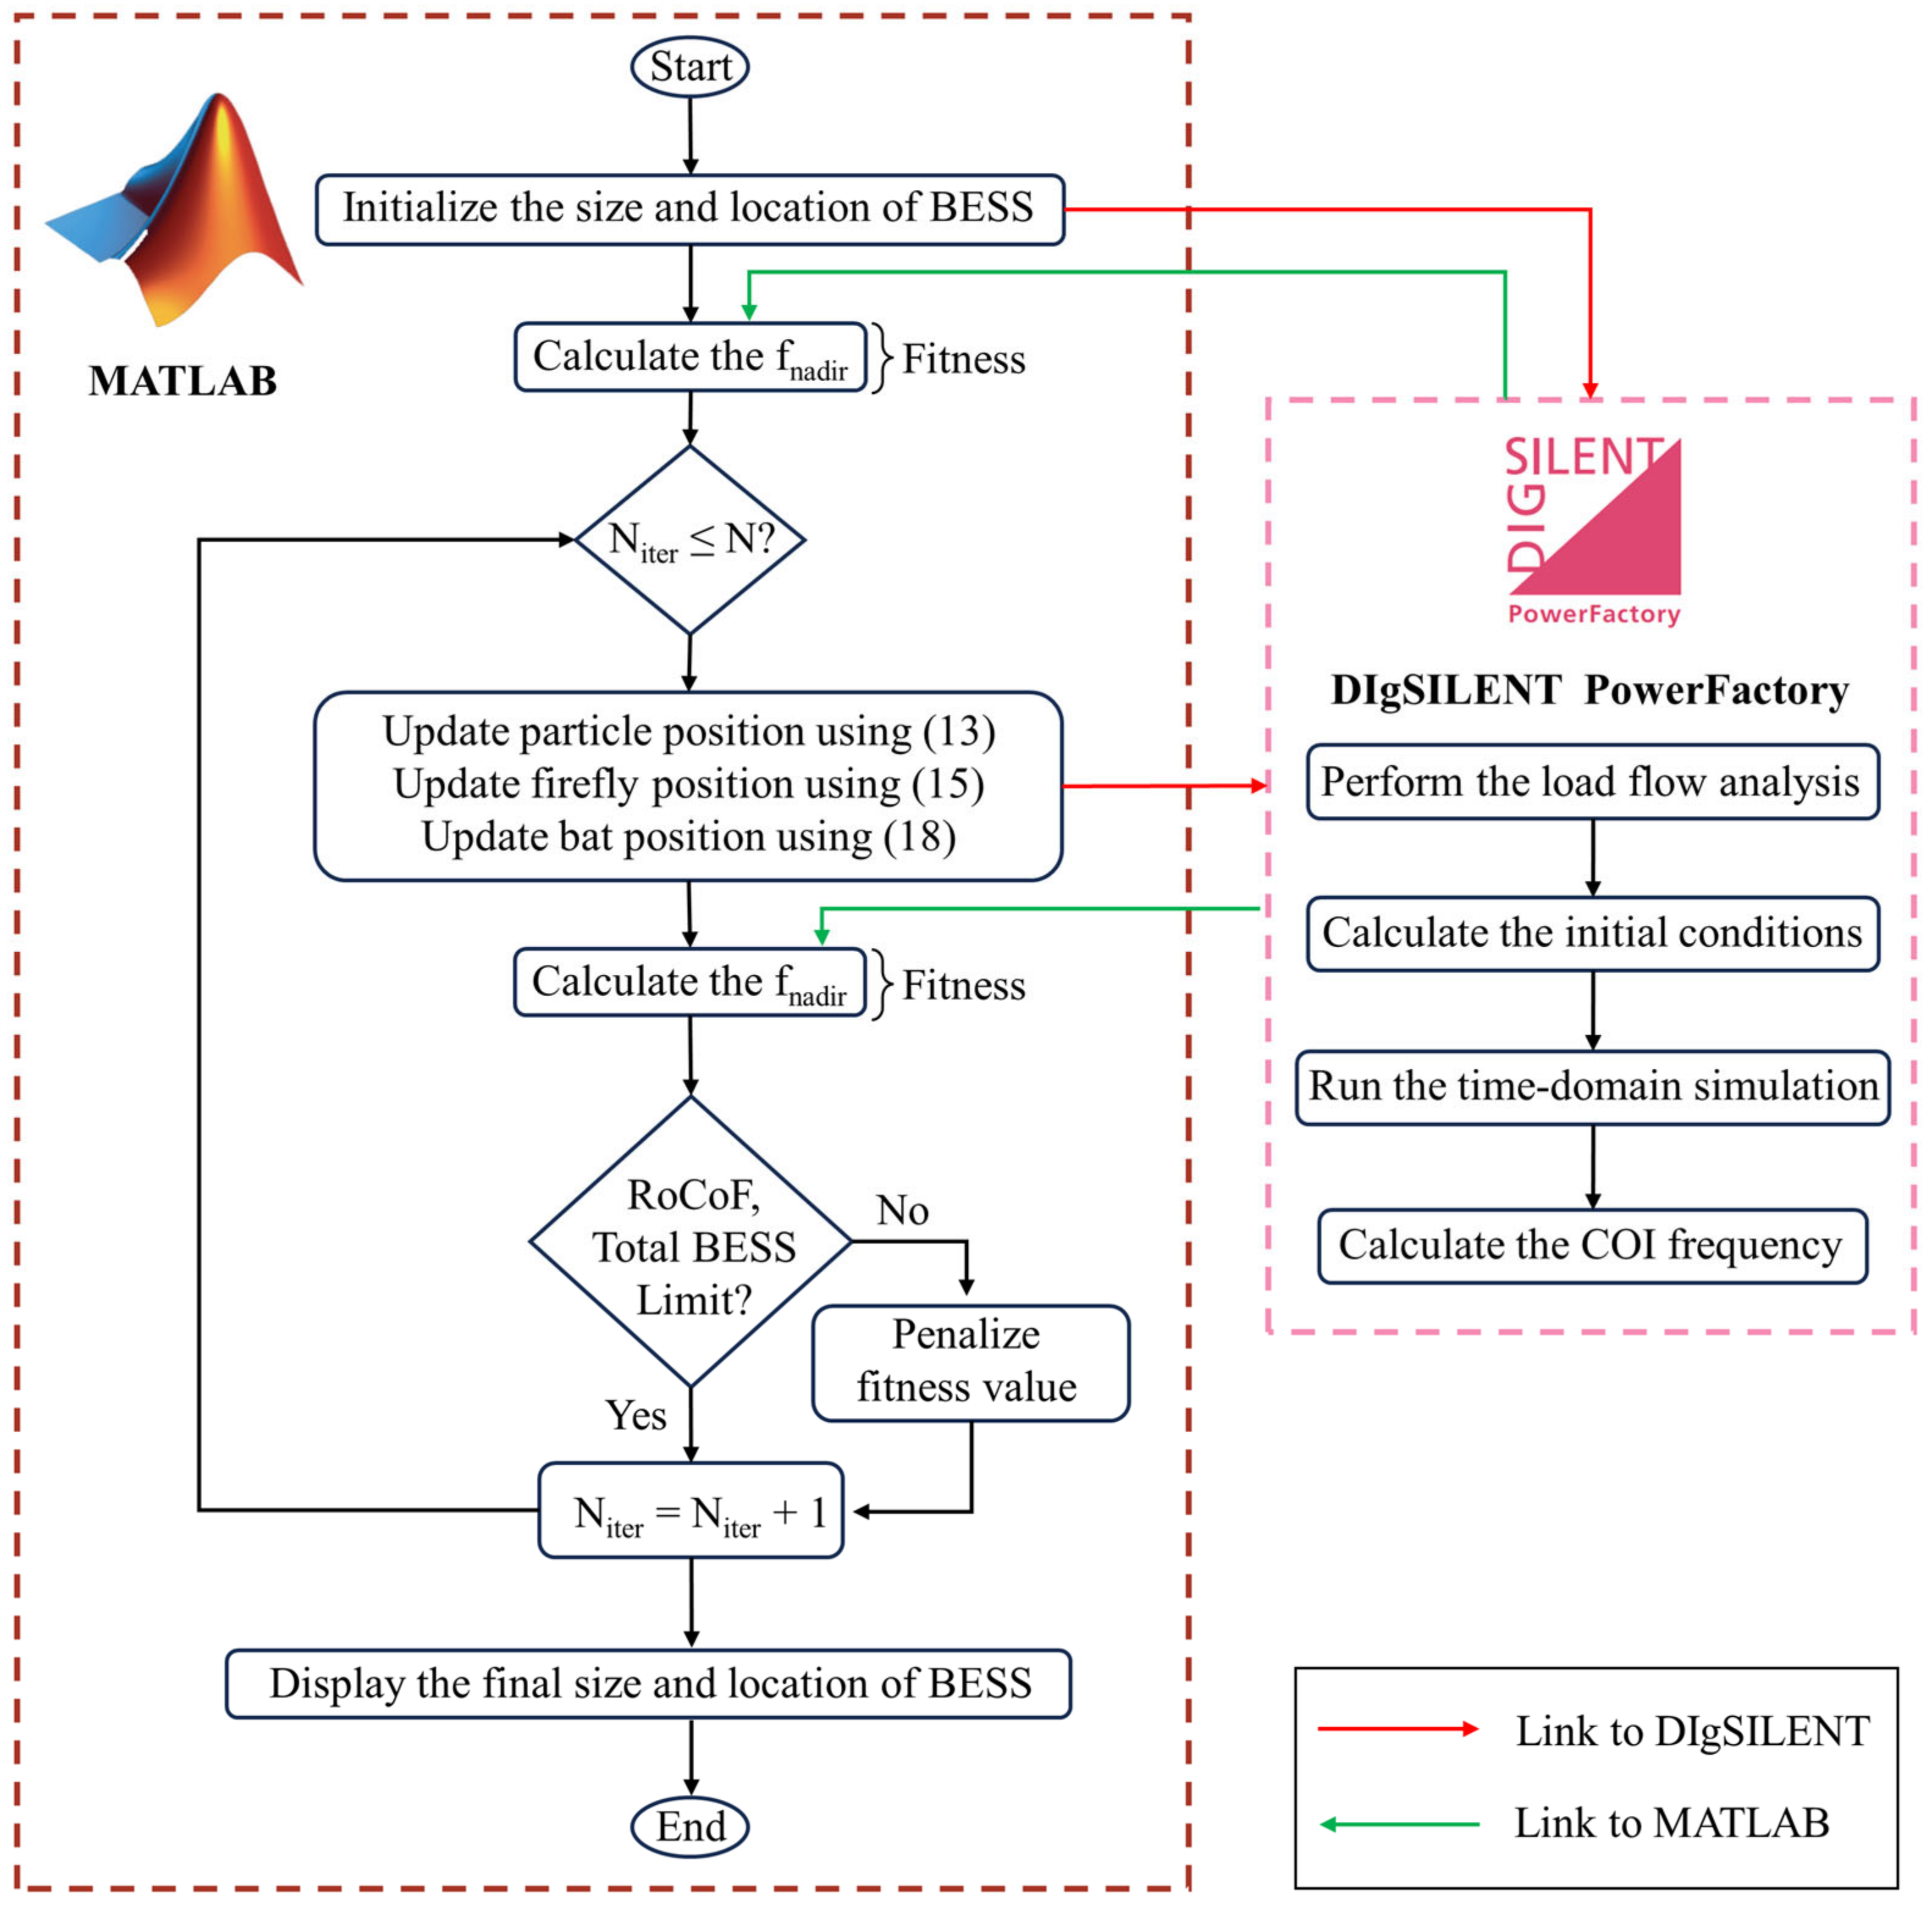
The optimization problem was solved by performing a co-simulation between the MATLAB and DIgSILENT PowerFactory software. The operations related to power system modeling, time domain simulation, and result variable extraction are performed using DIgSILENT, while MATLAB automates the operations and integrates the optimization. Figure 5 illustrates the step-by-step methodology of the process.
MATLAB is operated first to initiate the optimization problem, where the swarm sizes are initialized based on the population size (40 in this study). These initial swarms represent the battery location and sizes and are sent to DIgSILENT to conduct the electrical analysis. The electrical analysis commences with the execution of load flow and time domain simulations, after which the system’s COI frequency and R o C o F are calculated. Then, this information is transmitted to MATLAB via a text file, where it is utilized to determine the initial fitness values. Next, the optimization algorithm enters the main iteration loop, which continues until the maximum iteration count is reached (50 in this study). The swarm locations are subsequently moved based on the equations for PSO, FA, and BA, i.e., (13), (15), and (18), respectively. A new fitness value is calculated using DIgSILENT PowerFactory 15.1, and the values of the constraints (RoCoF and BESS penetration limit) are checked. If any violation is detected, a negative value is assigned to the fitness of that particular swarm. This negative value ensures that the swarm is not used for further updates, as it represents a bad solution for the proposed optimization problem, which is of a maximization nature. Then, the iteration proceeds to the next iteration and stops when the maximum iteration count is reached. Additionally, in this paper, we employ another stopping criterion, i.e., if the same value of the fitness function persists for a continuous period of ten iterations, the loop breaks. This is performed to decrease the computational time. This study utilizes MATLAB 2021 to solve the proposed method. All metaheuristic optimization algorithms used in this study are modified from the original and simple algorithm provided in [30]. The values of parameters used in the optimization process are given in Table A2.

4. Results

This section provides the test results on two standard network models, i.e., the IEEE 9-bus system and the IEEE 39-bus system.

4.1. Analysis of the IEEE 9-Bus System

For the initial study, the proposed methodology was applied on a small test system network, i.e., the IEEE 9-bus system [36]. The test network comprises three generators and three loads; the reference generator G1 is connected to bus 1, and buses 2 and 3 are connected to generators G2 and G3, respectively. The system has four voltage levels: 13.8 kV, 16.5 kV, 18 kV, and 230 kV. Every HV bus is considered to be a load bus, since every load is connected to the HV network. The governor and AVR parameters are set to standard values for the IEEE 9-bus system. A standard BESS template with a battery model, charge controlling unit, and frequency controller, as available in DIgSILENT PowerFactory, is used for the BESS-based study [27].

4.1.1. Analysis under Contingency Condition

In order to calculate the optimal size of the BESS at the optimal location, the proposed method considers three metaheuristic optimization algorithms; each of these algorithms is initialized with 40 populations and 50 iterations and is independently run five times. All the computations were performed on an ASUS Windows 11 PC with a 2.38 GHz AMD Ryzen-5 4500U processor and 7.42 GB RAM.
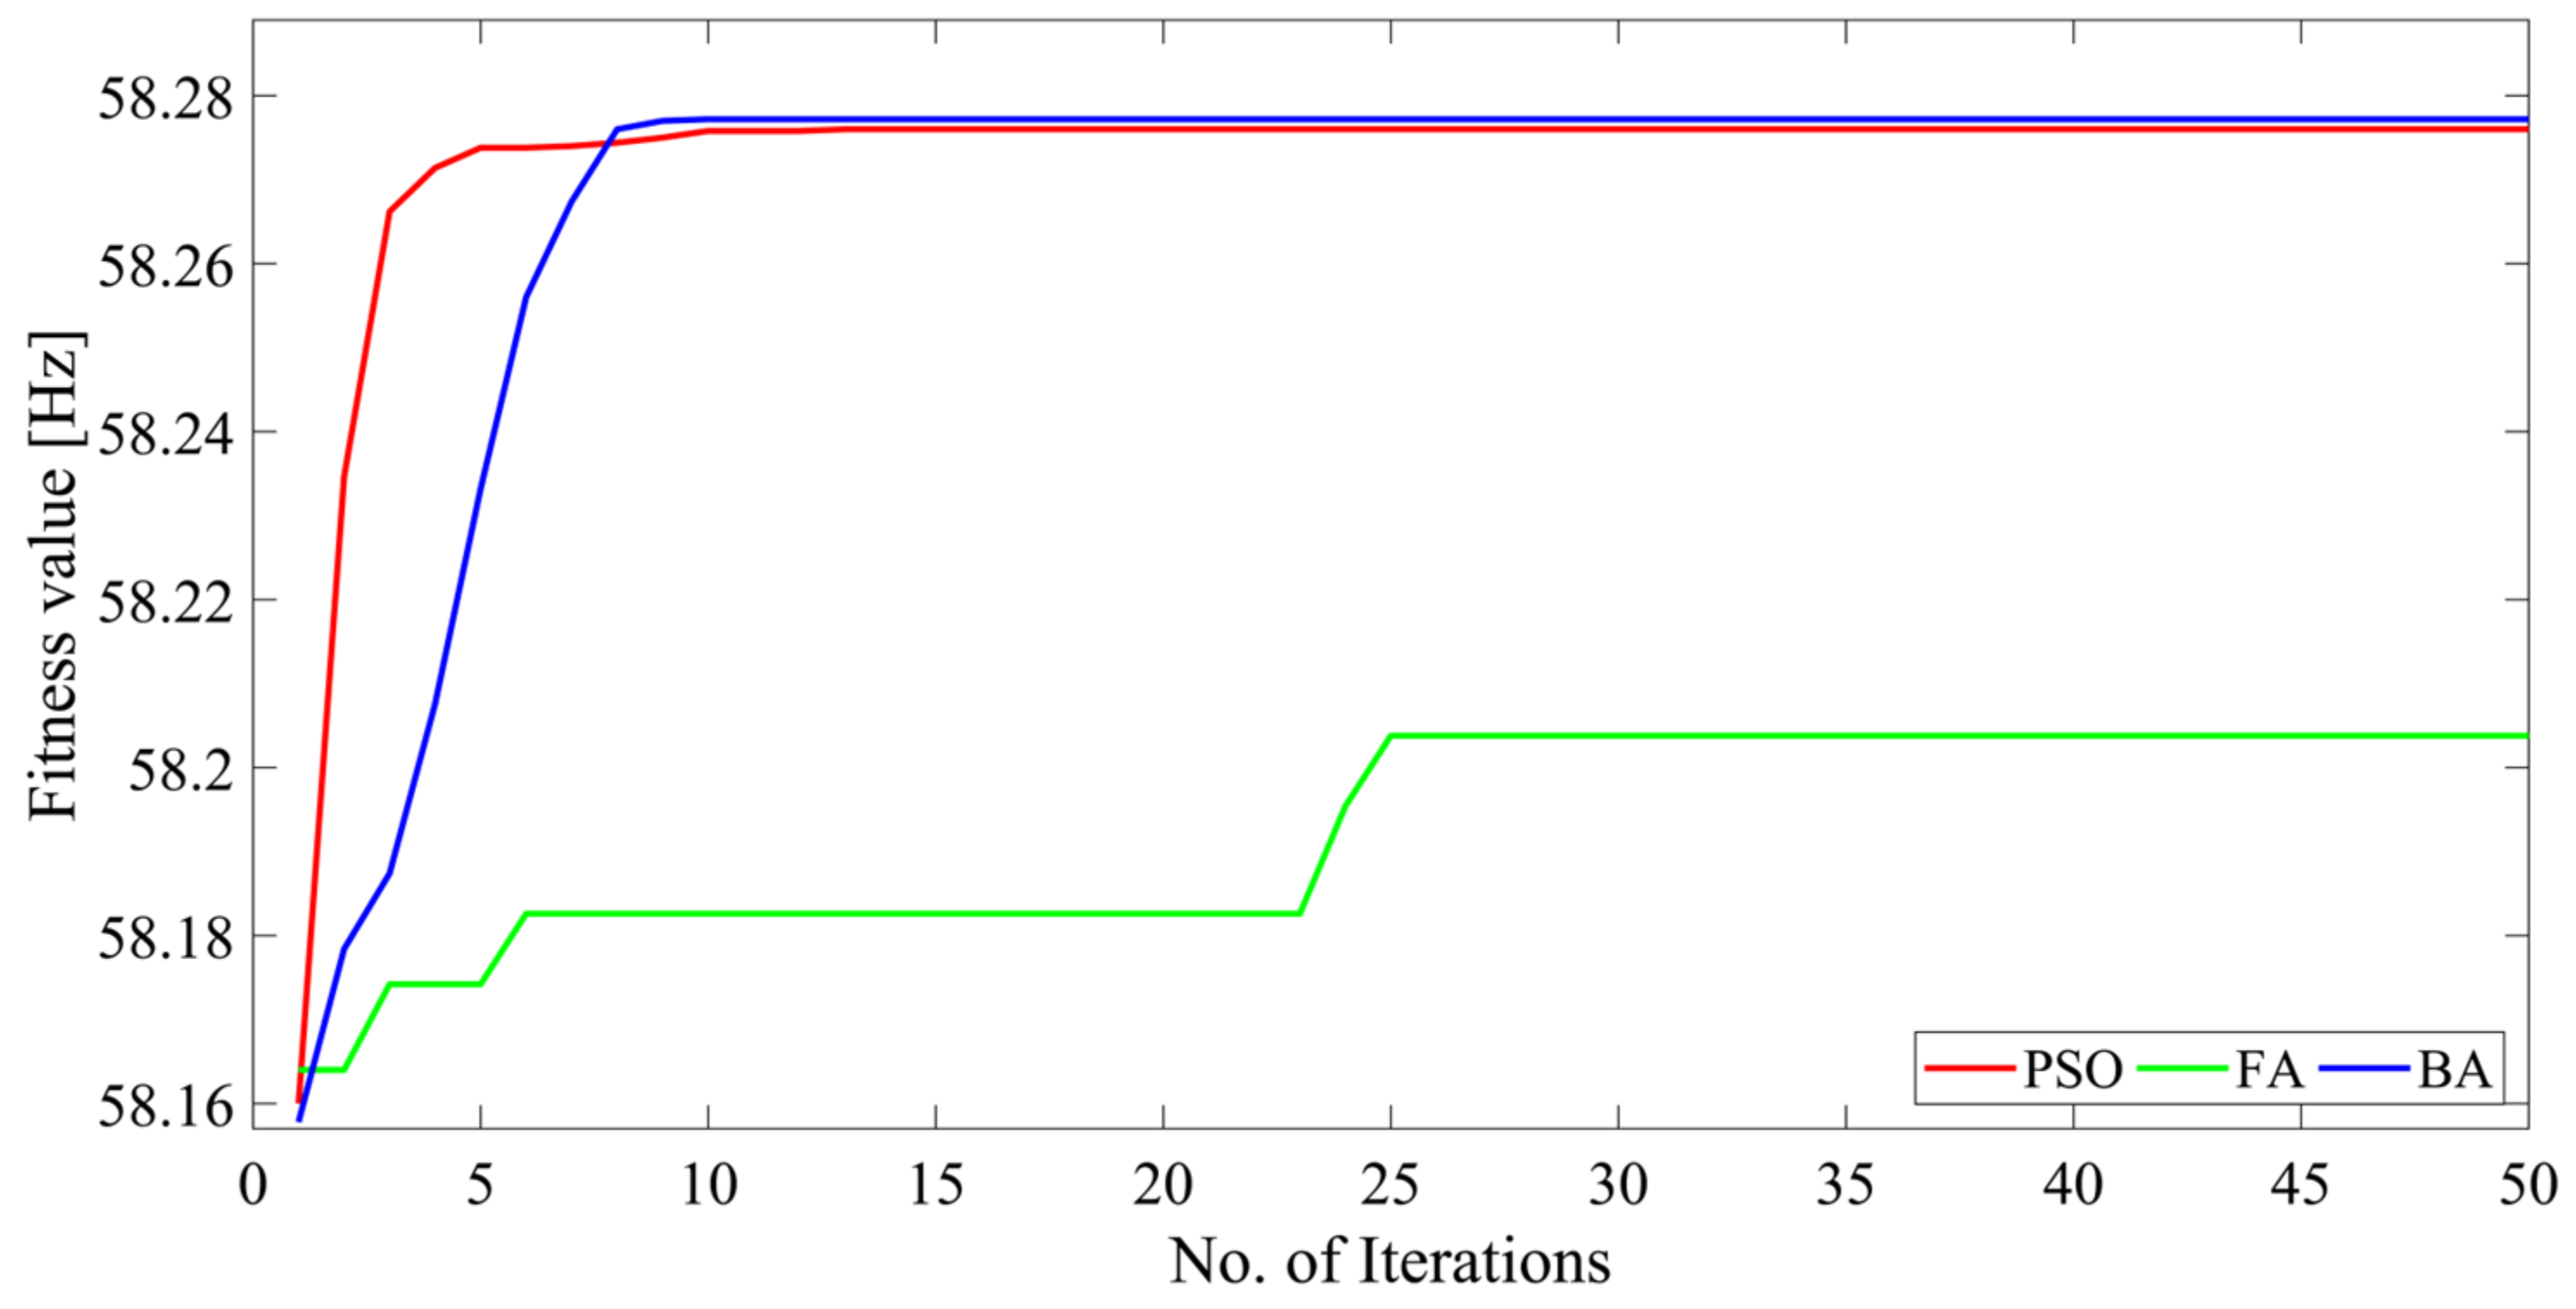
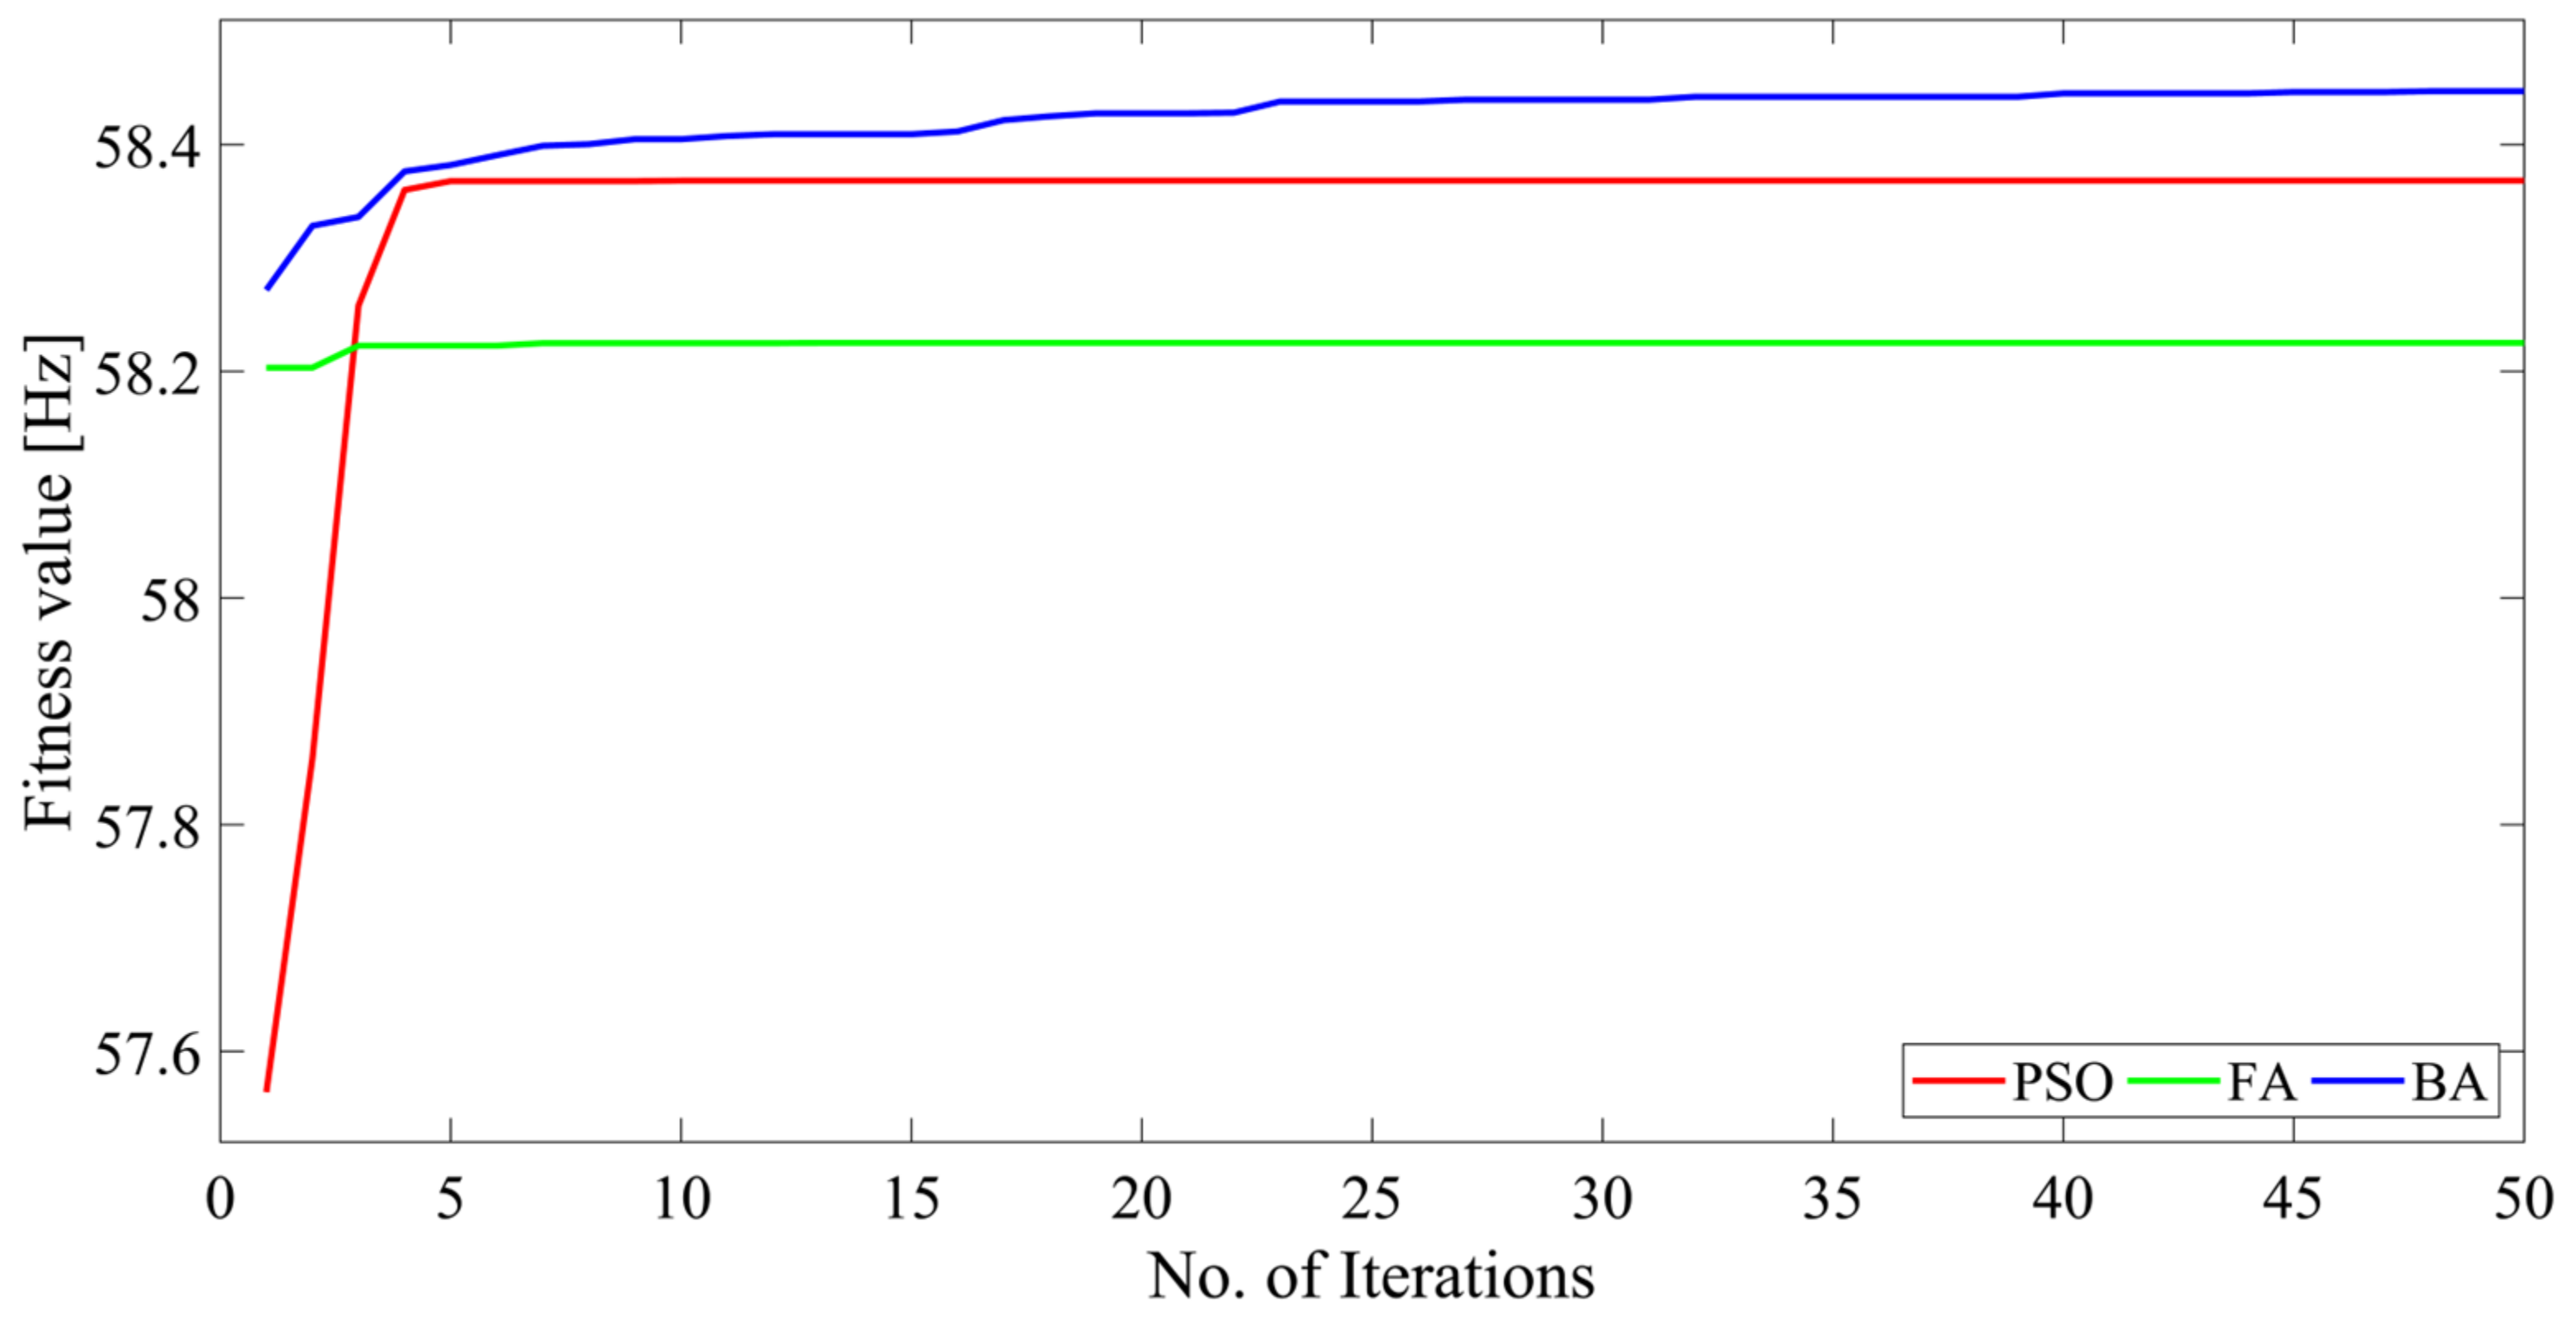
The results obtained after the optimization are presented in Table 2. From these results, we can see that the mean frequency nadir for the BA is 58.2723 Hz, which signifies a higher frequency nadir value compared to that of the other two methods. The convergence characteristics are demonstrated in Figure 6. The details of the optimal location and sizing of the BESSs are given in Table A3. The independent run where the fitness function (objective function) value is found to be maximum with the BA is used for the final selection of the BESS location and sizes for the proposed method. The results obtained using other algorithms are shown in Tables S1 and S2 in the Supplementary File. In addition, in this study, we also used the method proposed by the authors of [22] for comparison purposes. The method is based on locating BESSs at the three most-weak buses (according to the short circuit ratio (SCR)) and performing optimization on these fixed locations to find the sizes using metaheuristic optimization algorithms.
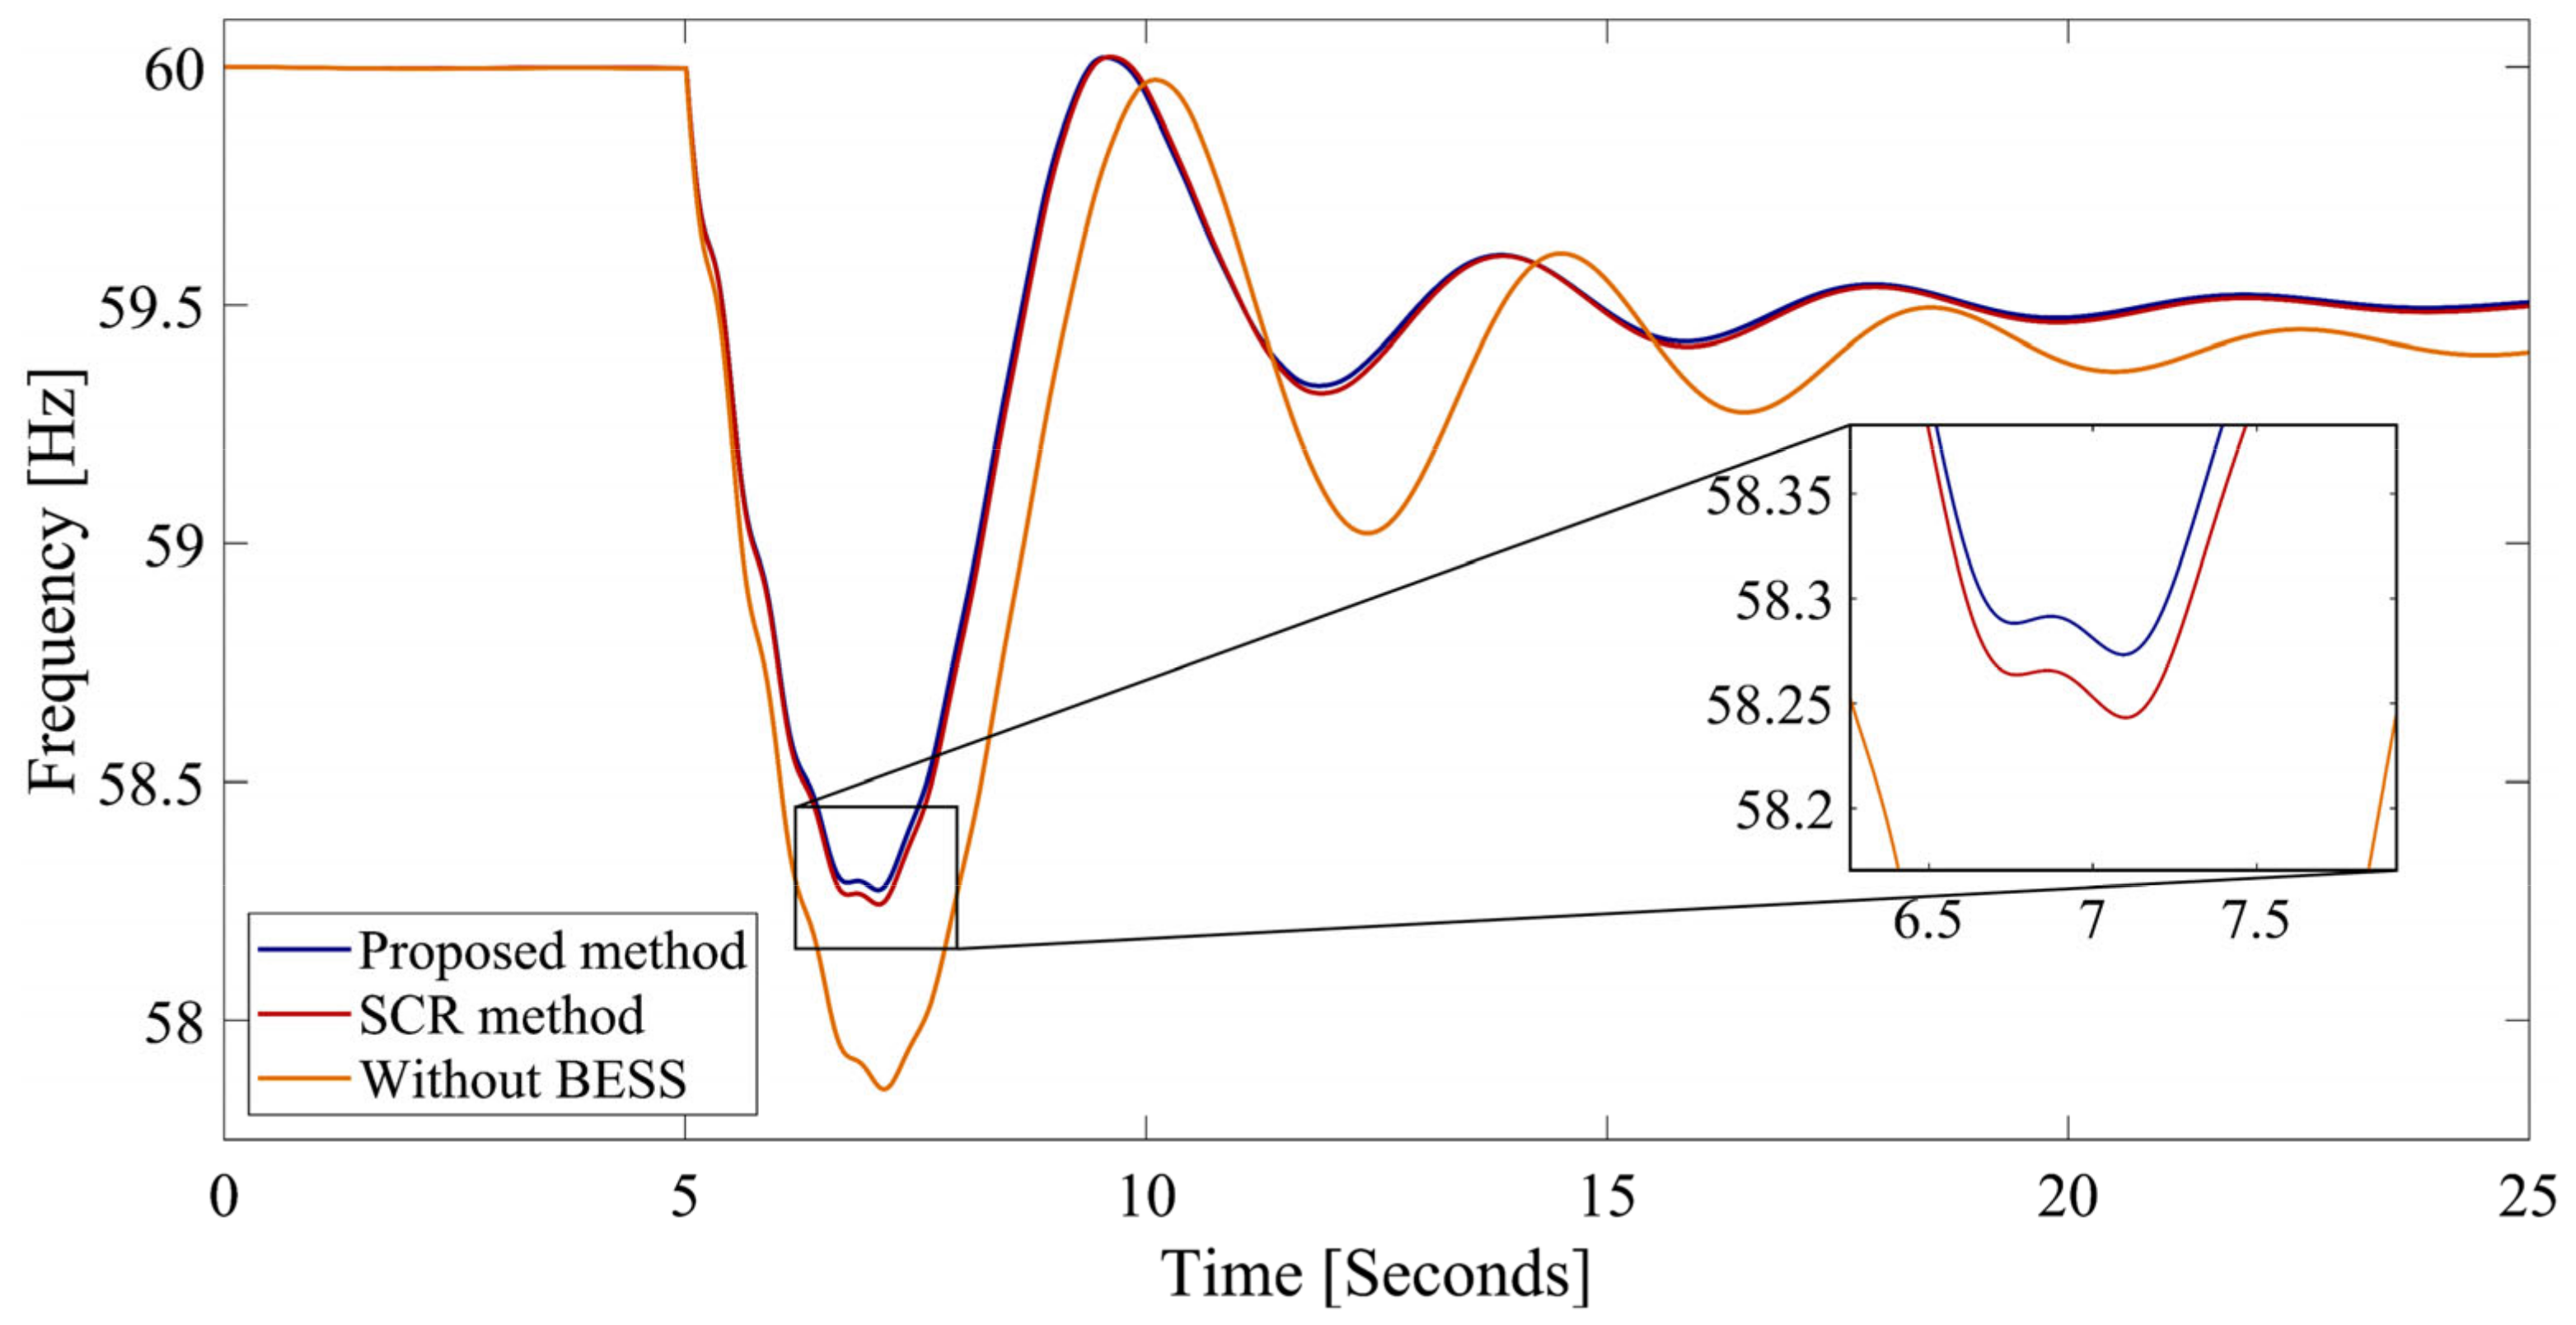
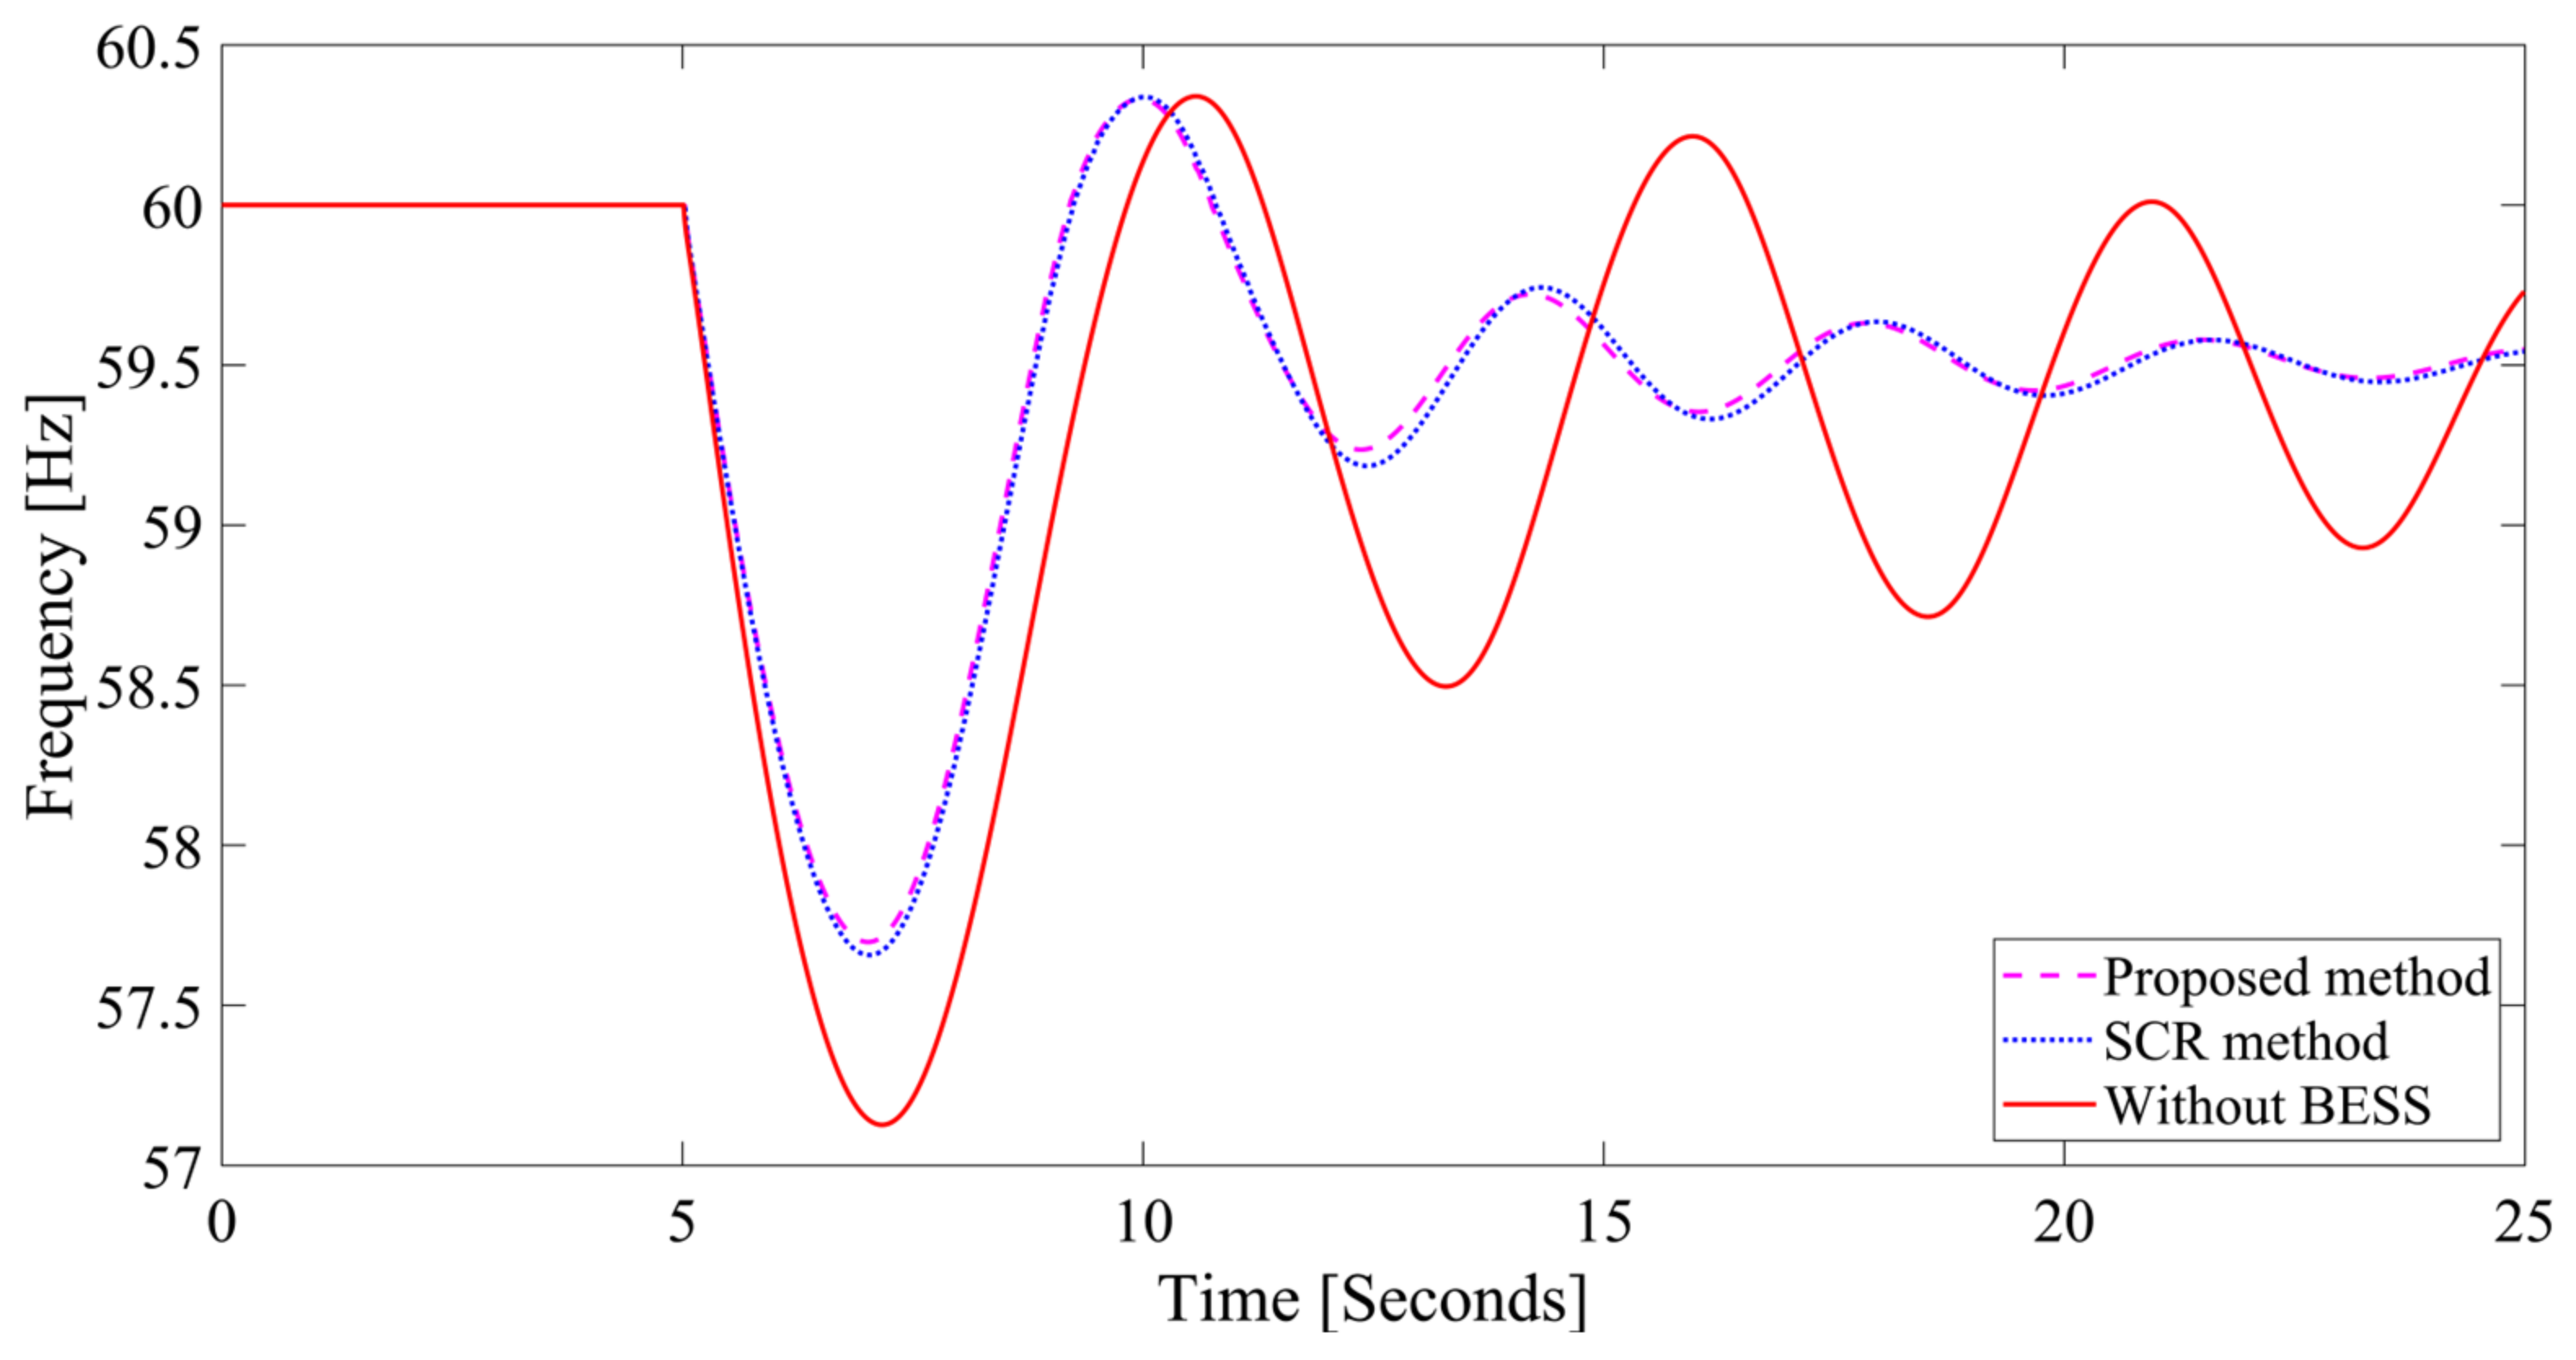
To analyze the COI frequency response for the contingency condition, an under-frequency event (outage of generator “G3”) was created at 5 s, and the simulation was run for a time span of 25 s, as shown in Figure 7. According to the analysis of the frequency response of the system for the base case (no BESSs), the values of f n a d i r and R o C o F were found to be 57.8612 Hz and 1.0022 Hz/s, respectively.
The system’s frequency nadir was 58.2732 Hz with the proposed method and implies a frequency excursion of only 1.7268 Hz, which was previously 2.1453 Hz (base case). In addition, the R o C o F was decreased to 0.8244 Hz/s from 0.9909 Hz/s (base case). The system appeared to be stable even after the application of BESS. The simulation for a longer time is presented in Figure S1 in the Supplementary File.
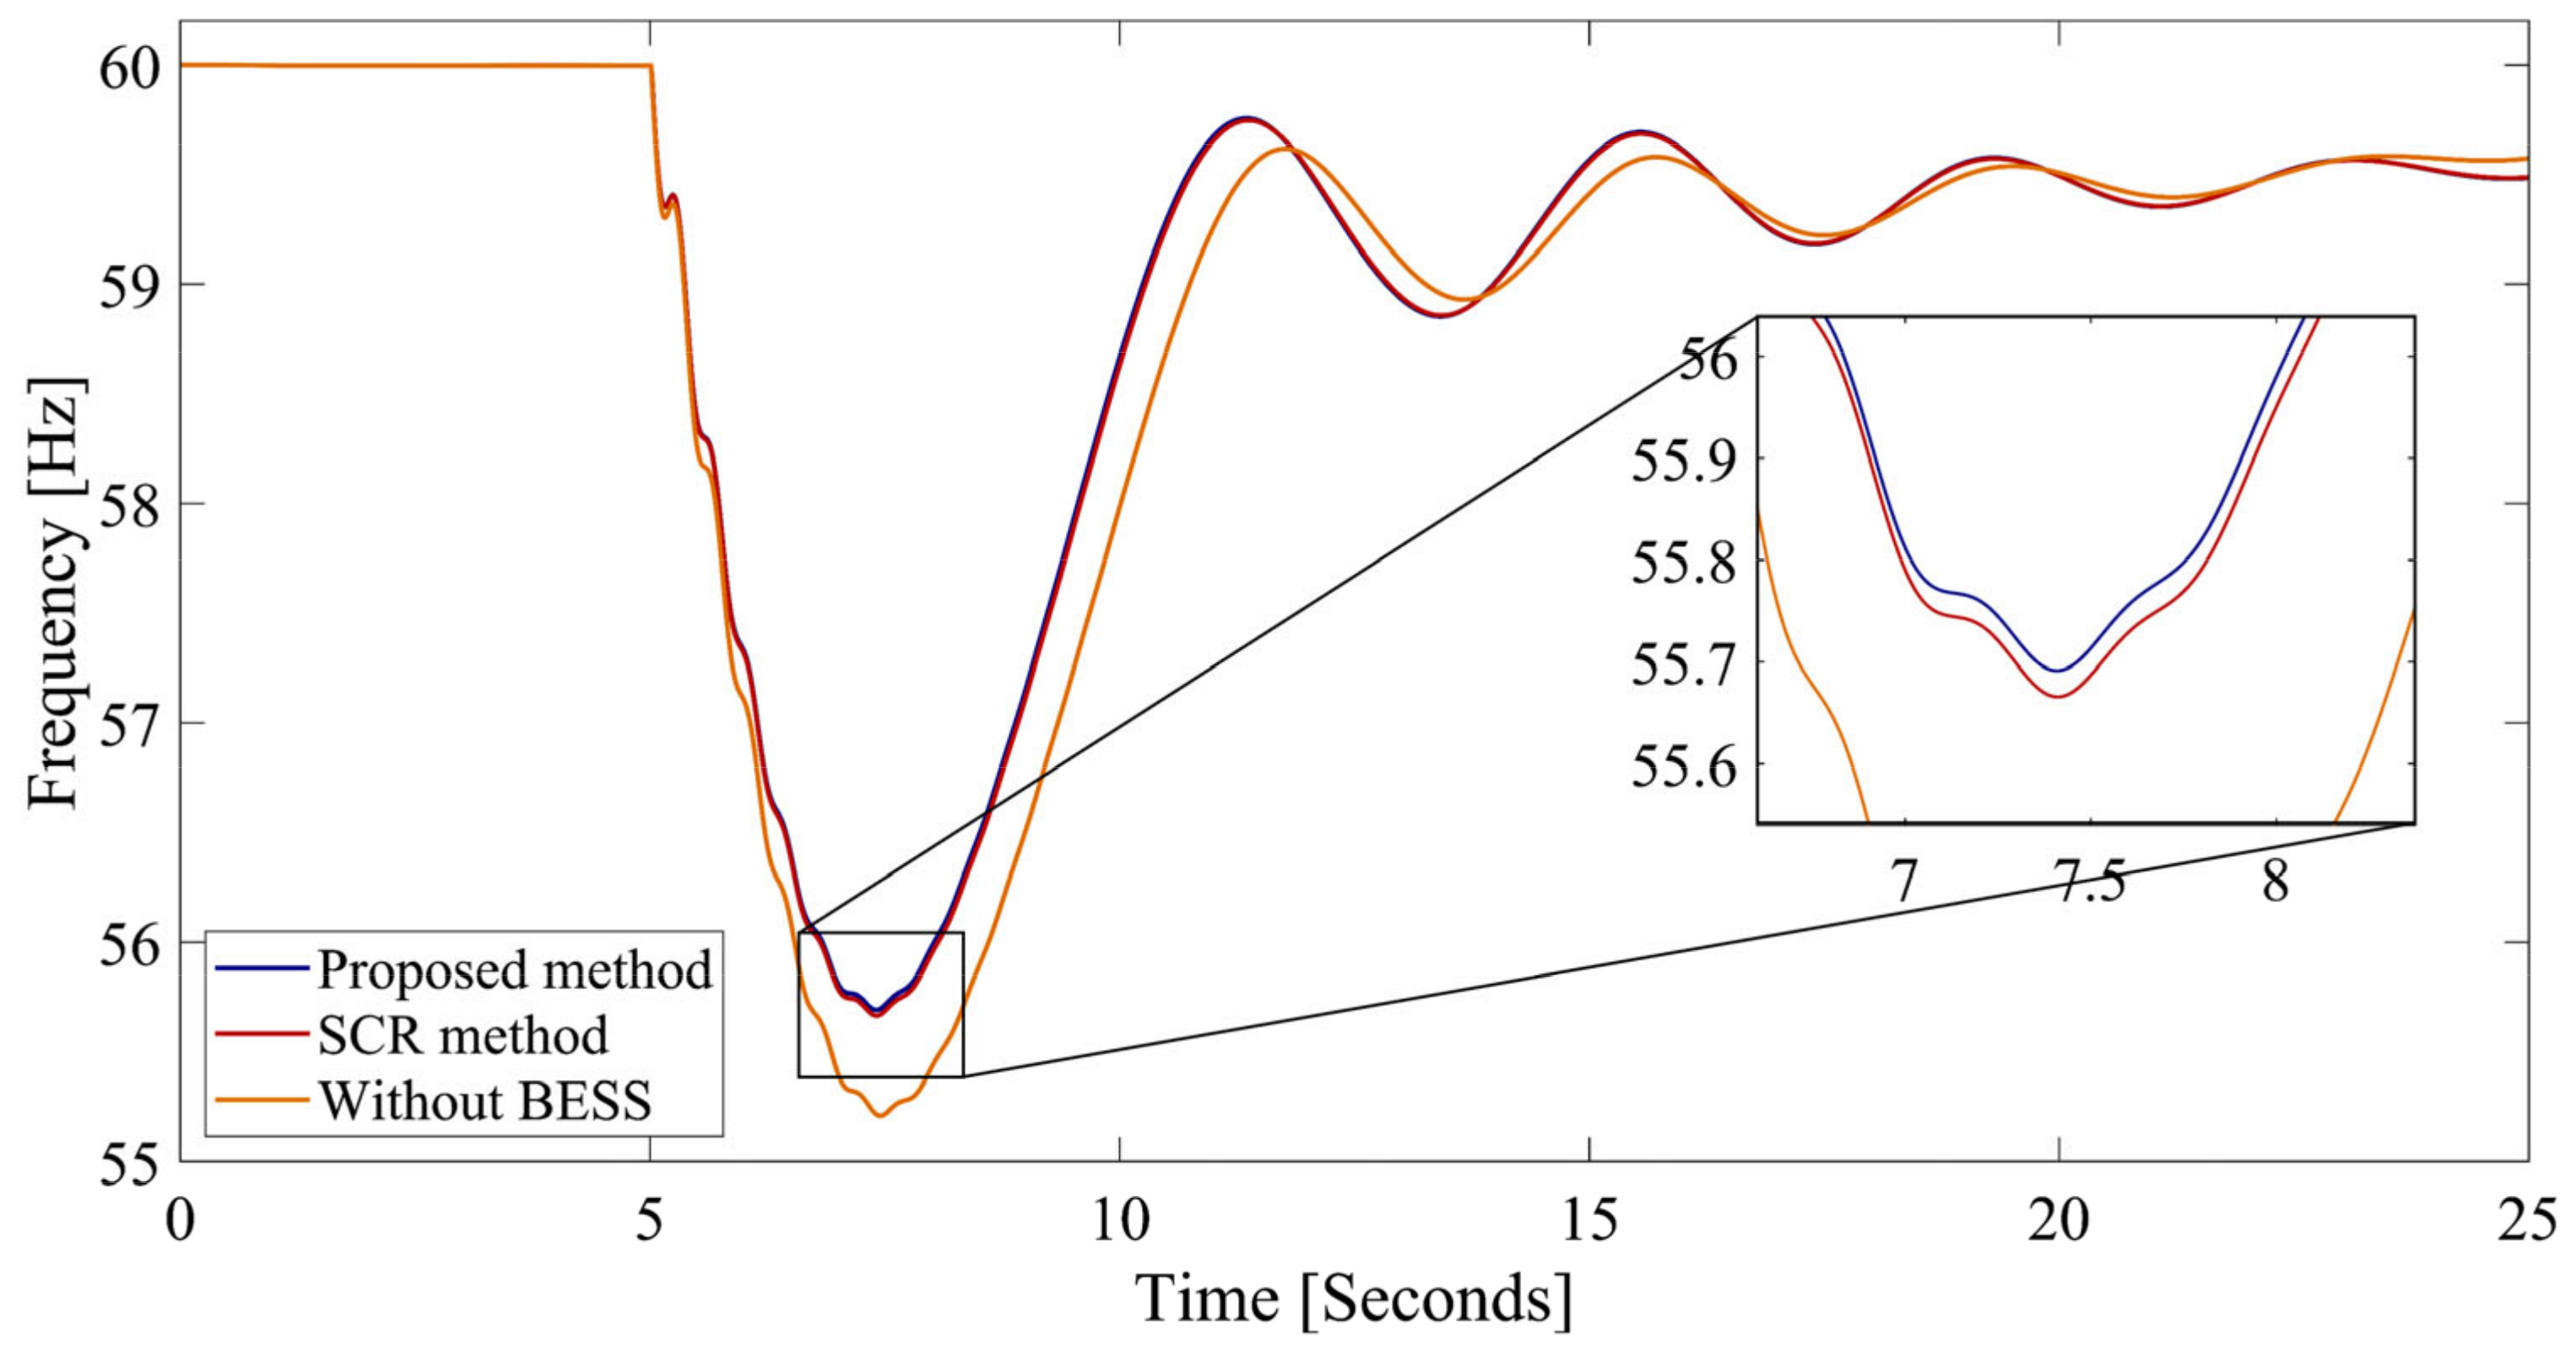
For further validation of the obtained results, this study applied another active power disturbance, i.e., the outage of generator “G2”, and the obtained result is plotted in Figure 8. The proposed method also provides better frequency support under this scenario, with the f n a d i r value of 55.6914 Hz. The value of f n a d i r is determined by first calculating the COI frequency given by Equation (3) considering all generators taking the 25 s period window. This is better than the compared method and without any BESS support. In addition, the initial R o C o F of 1.9526 Hz/s is reduced to 1.7855 Hz/s with the proposed method and is slightly better than 1.7962 Hz/s which is obtained using the SCR method.
In this paper, we propose a methodology to improve system frequency stability by optimizing the size and location of battery energy storage systems (BESSs) using metaheuristic optimization algorithms. This study focuses on enhancing two critical frequency stability indices, i.e., the frequency nadir and rate of change of frequency (RoCoF).
The proposed method is tested on the IEEE 9-bus system and the IEEE 39-bus system, considering various scenarios such as multiple generator outages, increased/decreased loading conditions, and the addition of renewable energy resources (RESs). The results show that the proposed method consistently enhances system frequency compared to an existing method and without BESSs, under all the tested scenarios.
A summary of the values of the stability indices for the different contingencies is given in Table 3.

4.1.2. Analysis under Increased/Decreased Load Conditions

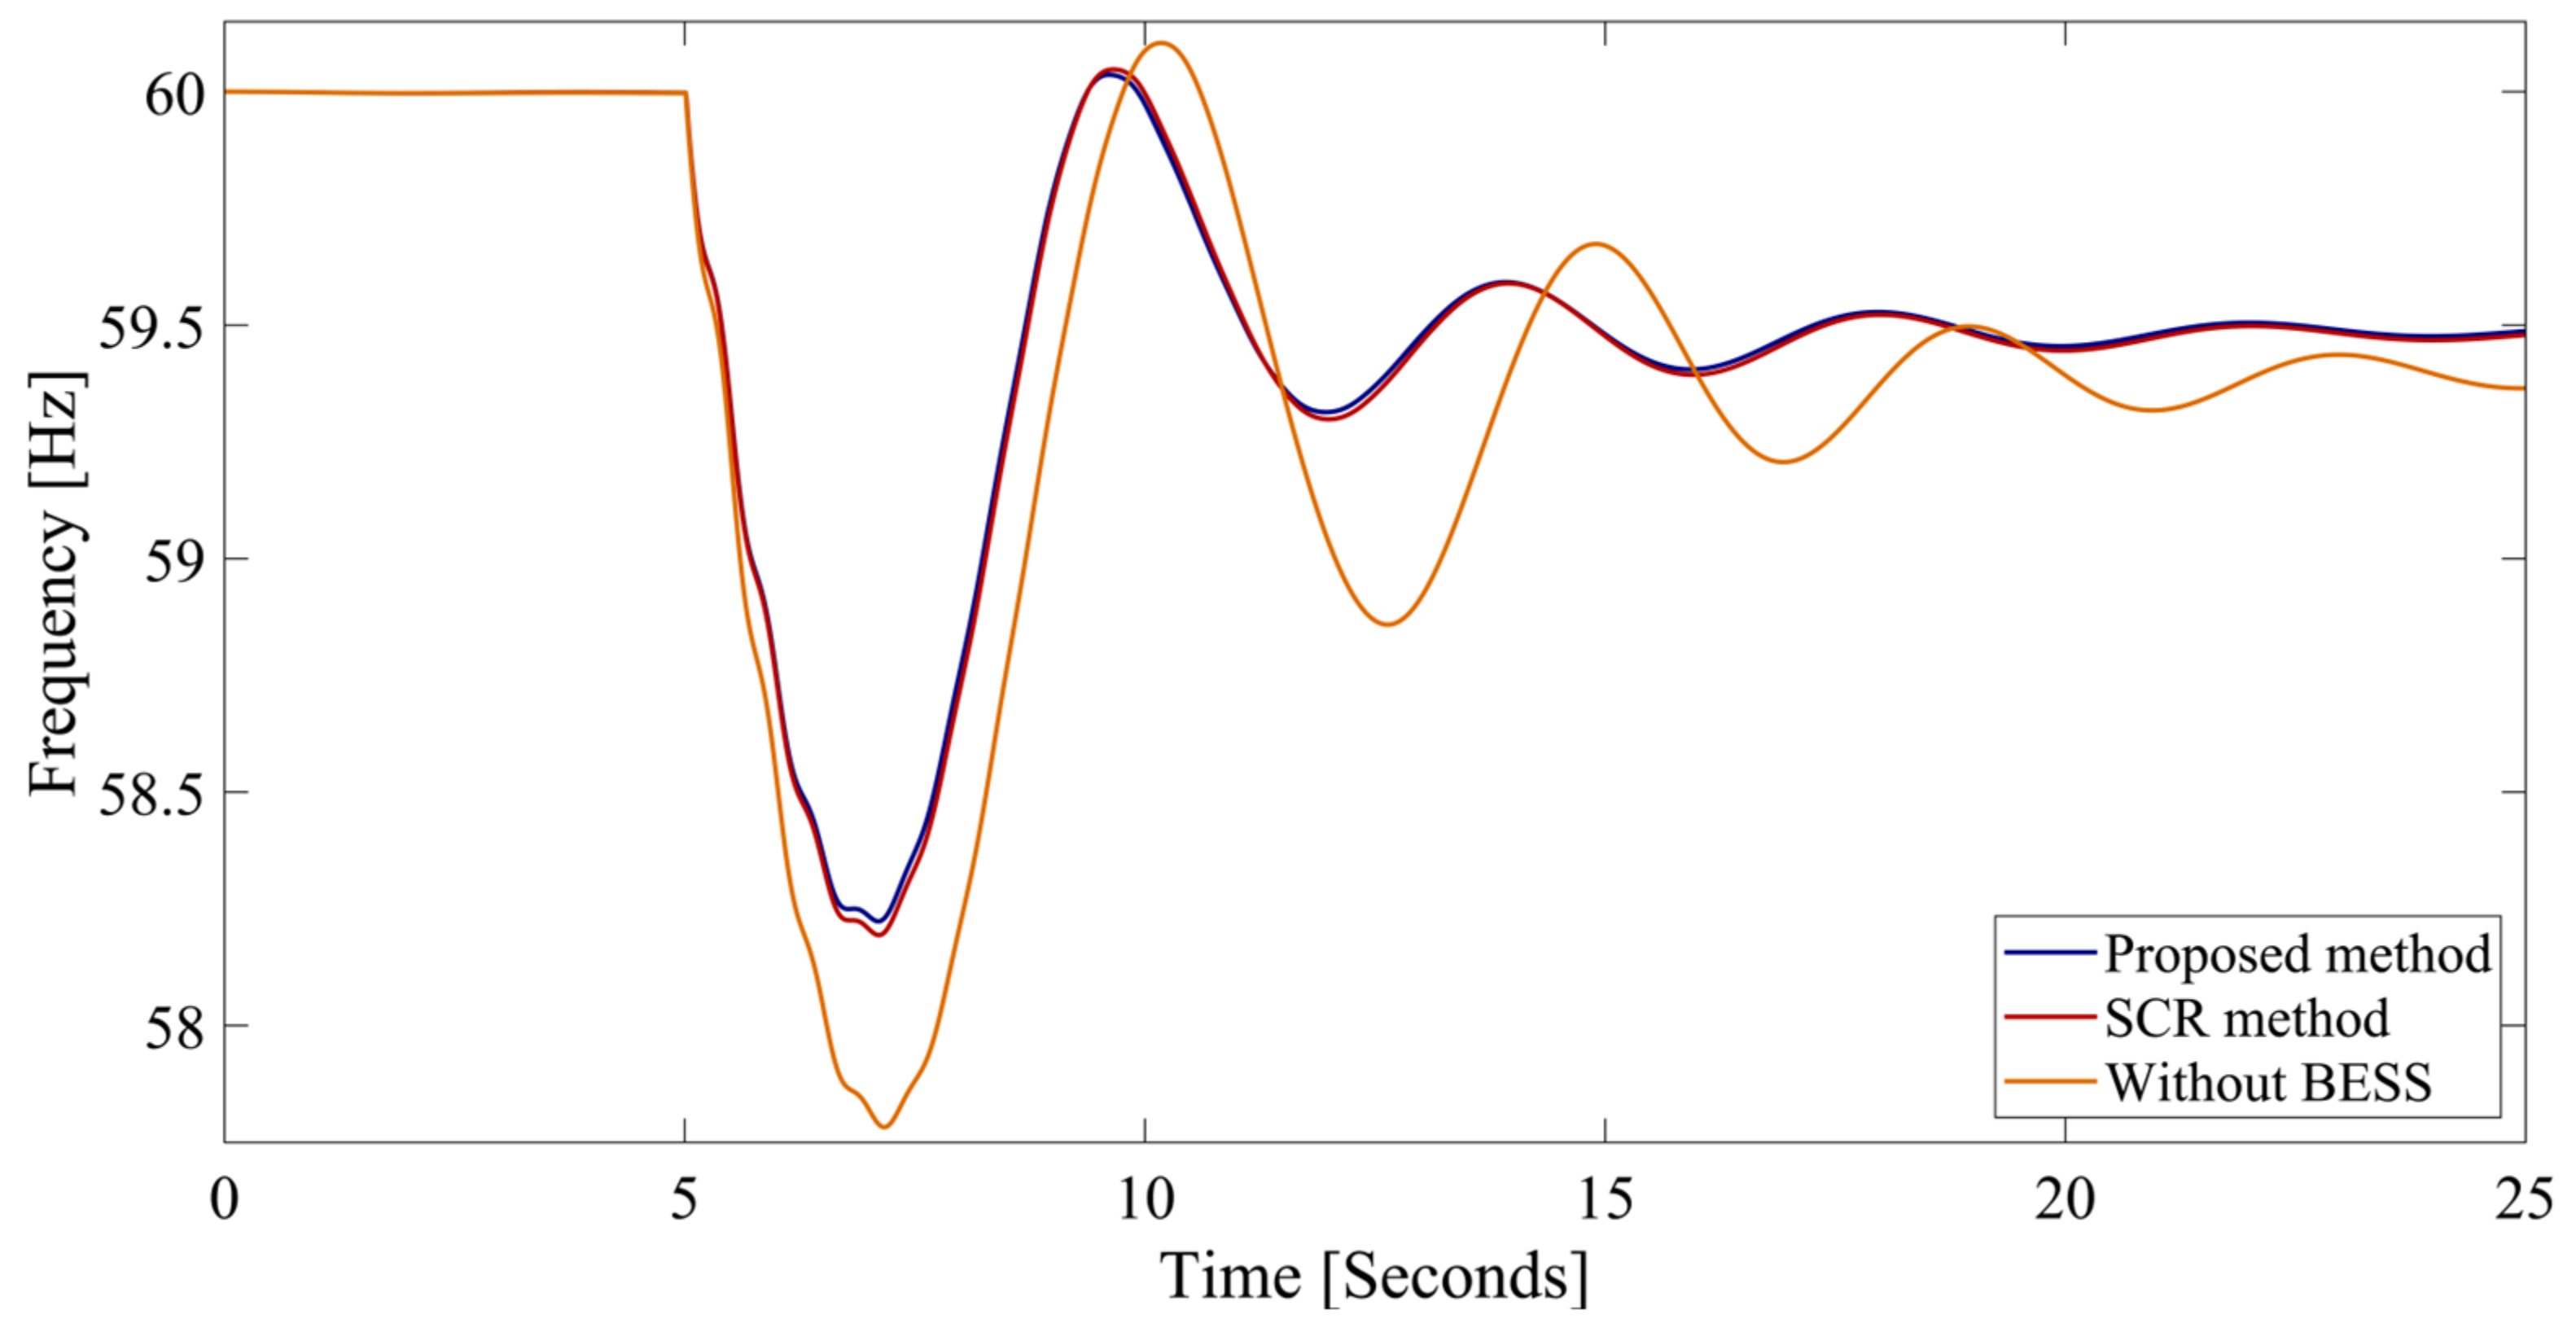
To evaluate the frequency stability under light-/heavy-load conditions, a consistent −5%/5% change in power was imposed on all loads with the outage of G3. Figure 9 and Figure 10 provide the time domain simulation results under this scenario. The results from the SCR method and the proposed method both provide similar frequency stability enhancements under these conditions compared to no installation of BESSs.

4.1.3. Analysis under Renewable Energy Resource Penetration

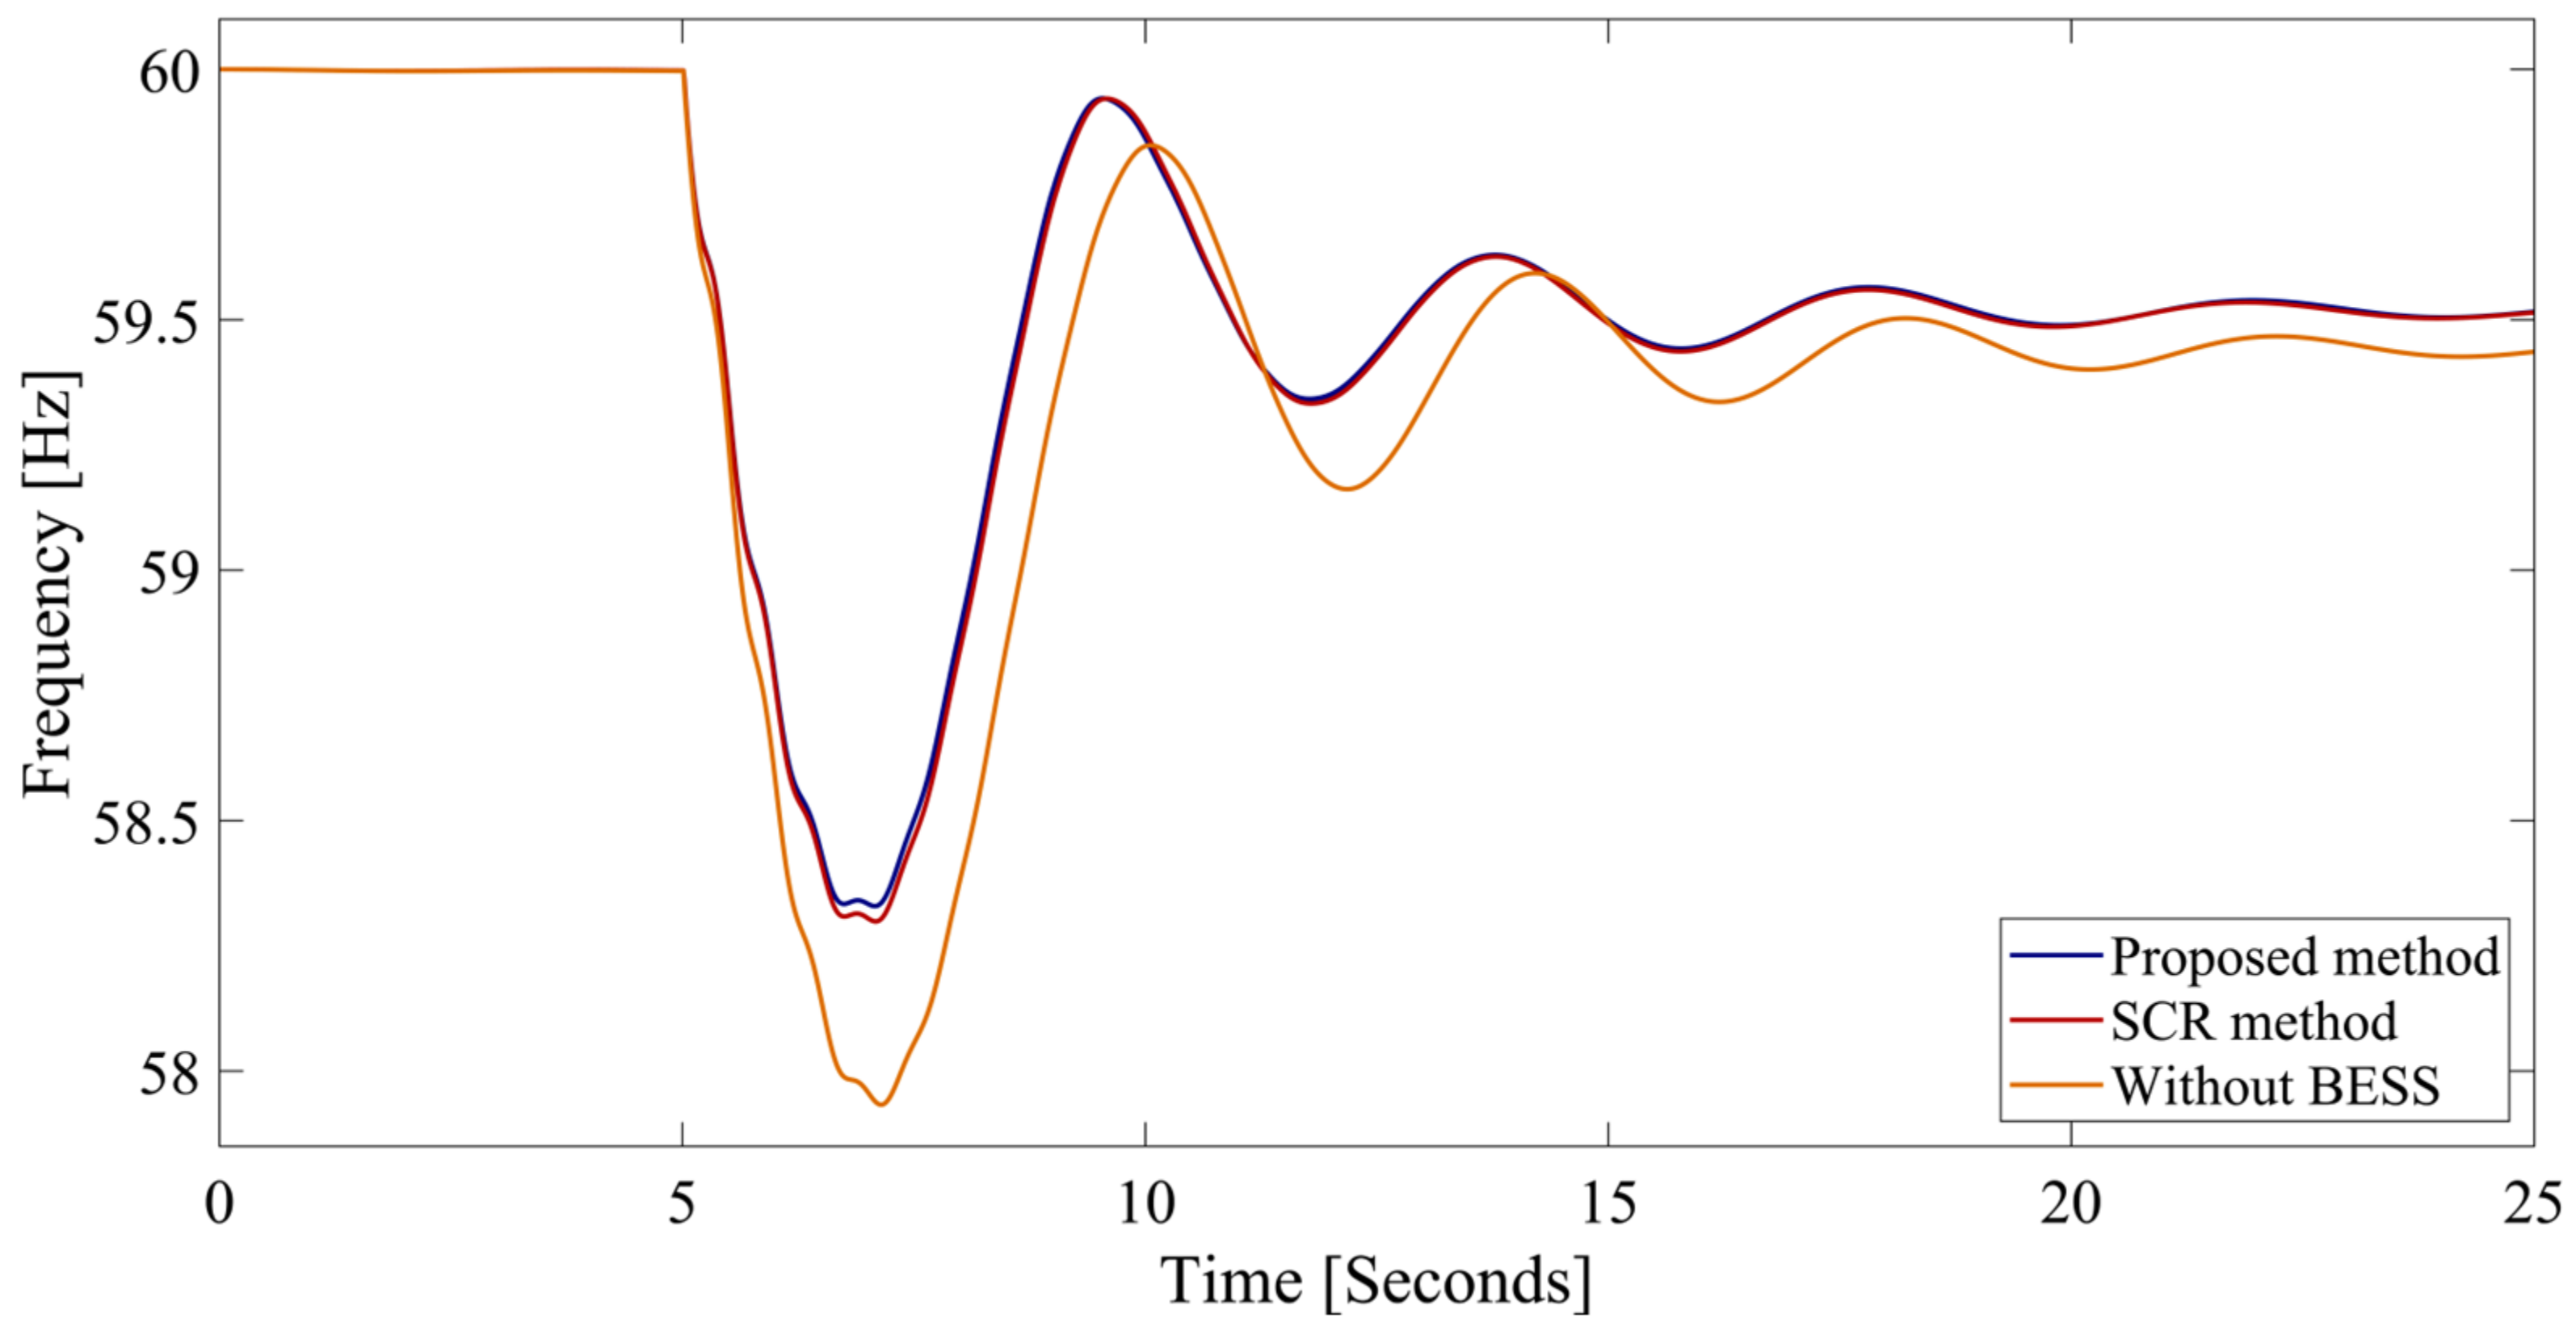
To evaluate the impact of an RES on frequency stability, the generating plant G2 of 163.2 MW connected to bus 2 was replaced with a doubly fed induction generator (DFIG)-based wind generator of equal capacity. The standard template of the DFIG available in DIgSILENT is used for this purpose. The frequency response for the outage of generator G3 is shown in Figure 11. The result shows that the proposed method also provides a satisfactory enhancement of the frequency under this scenario.
Table 4 presents the f n a d i r and R o C o F values for various operating scenarios for the failure of G3.
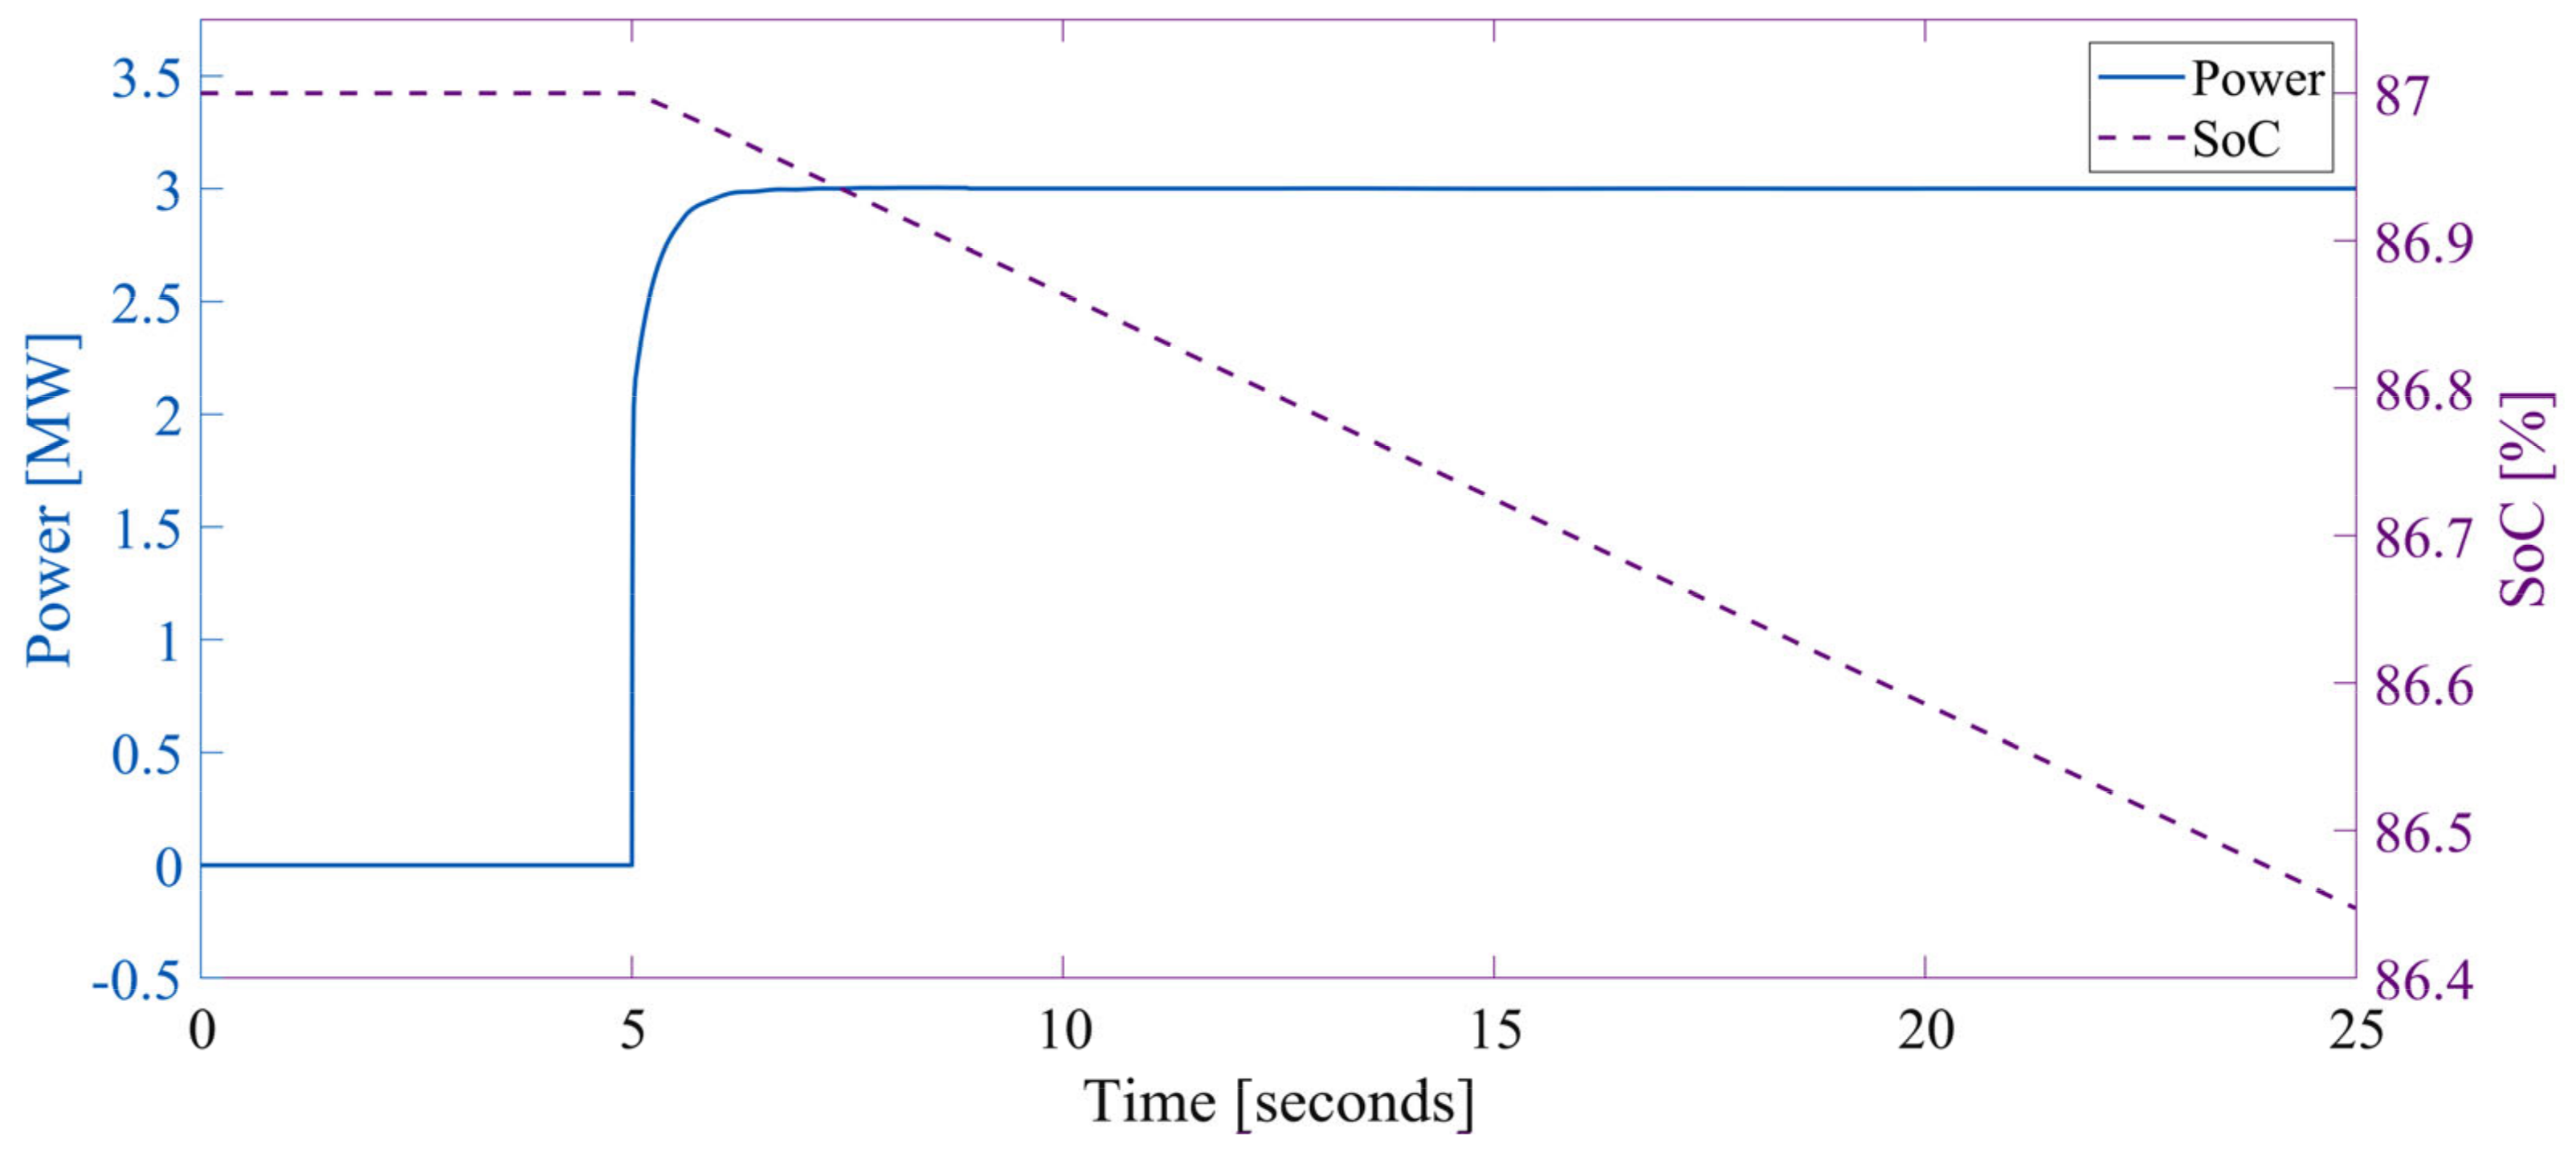
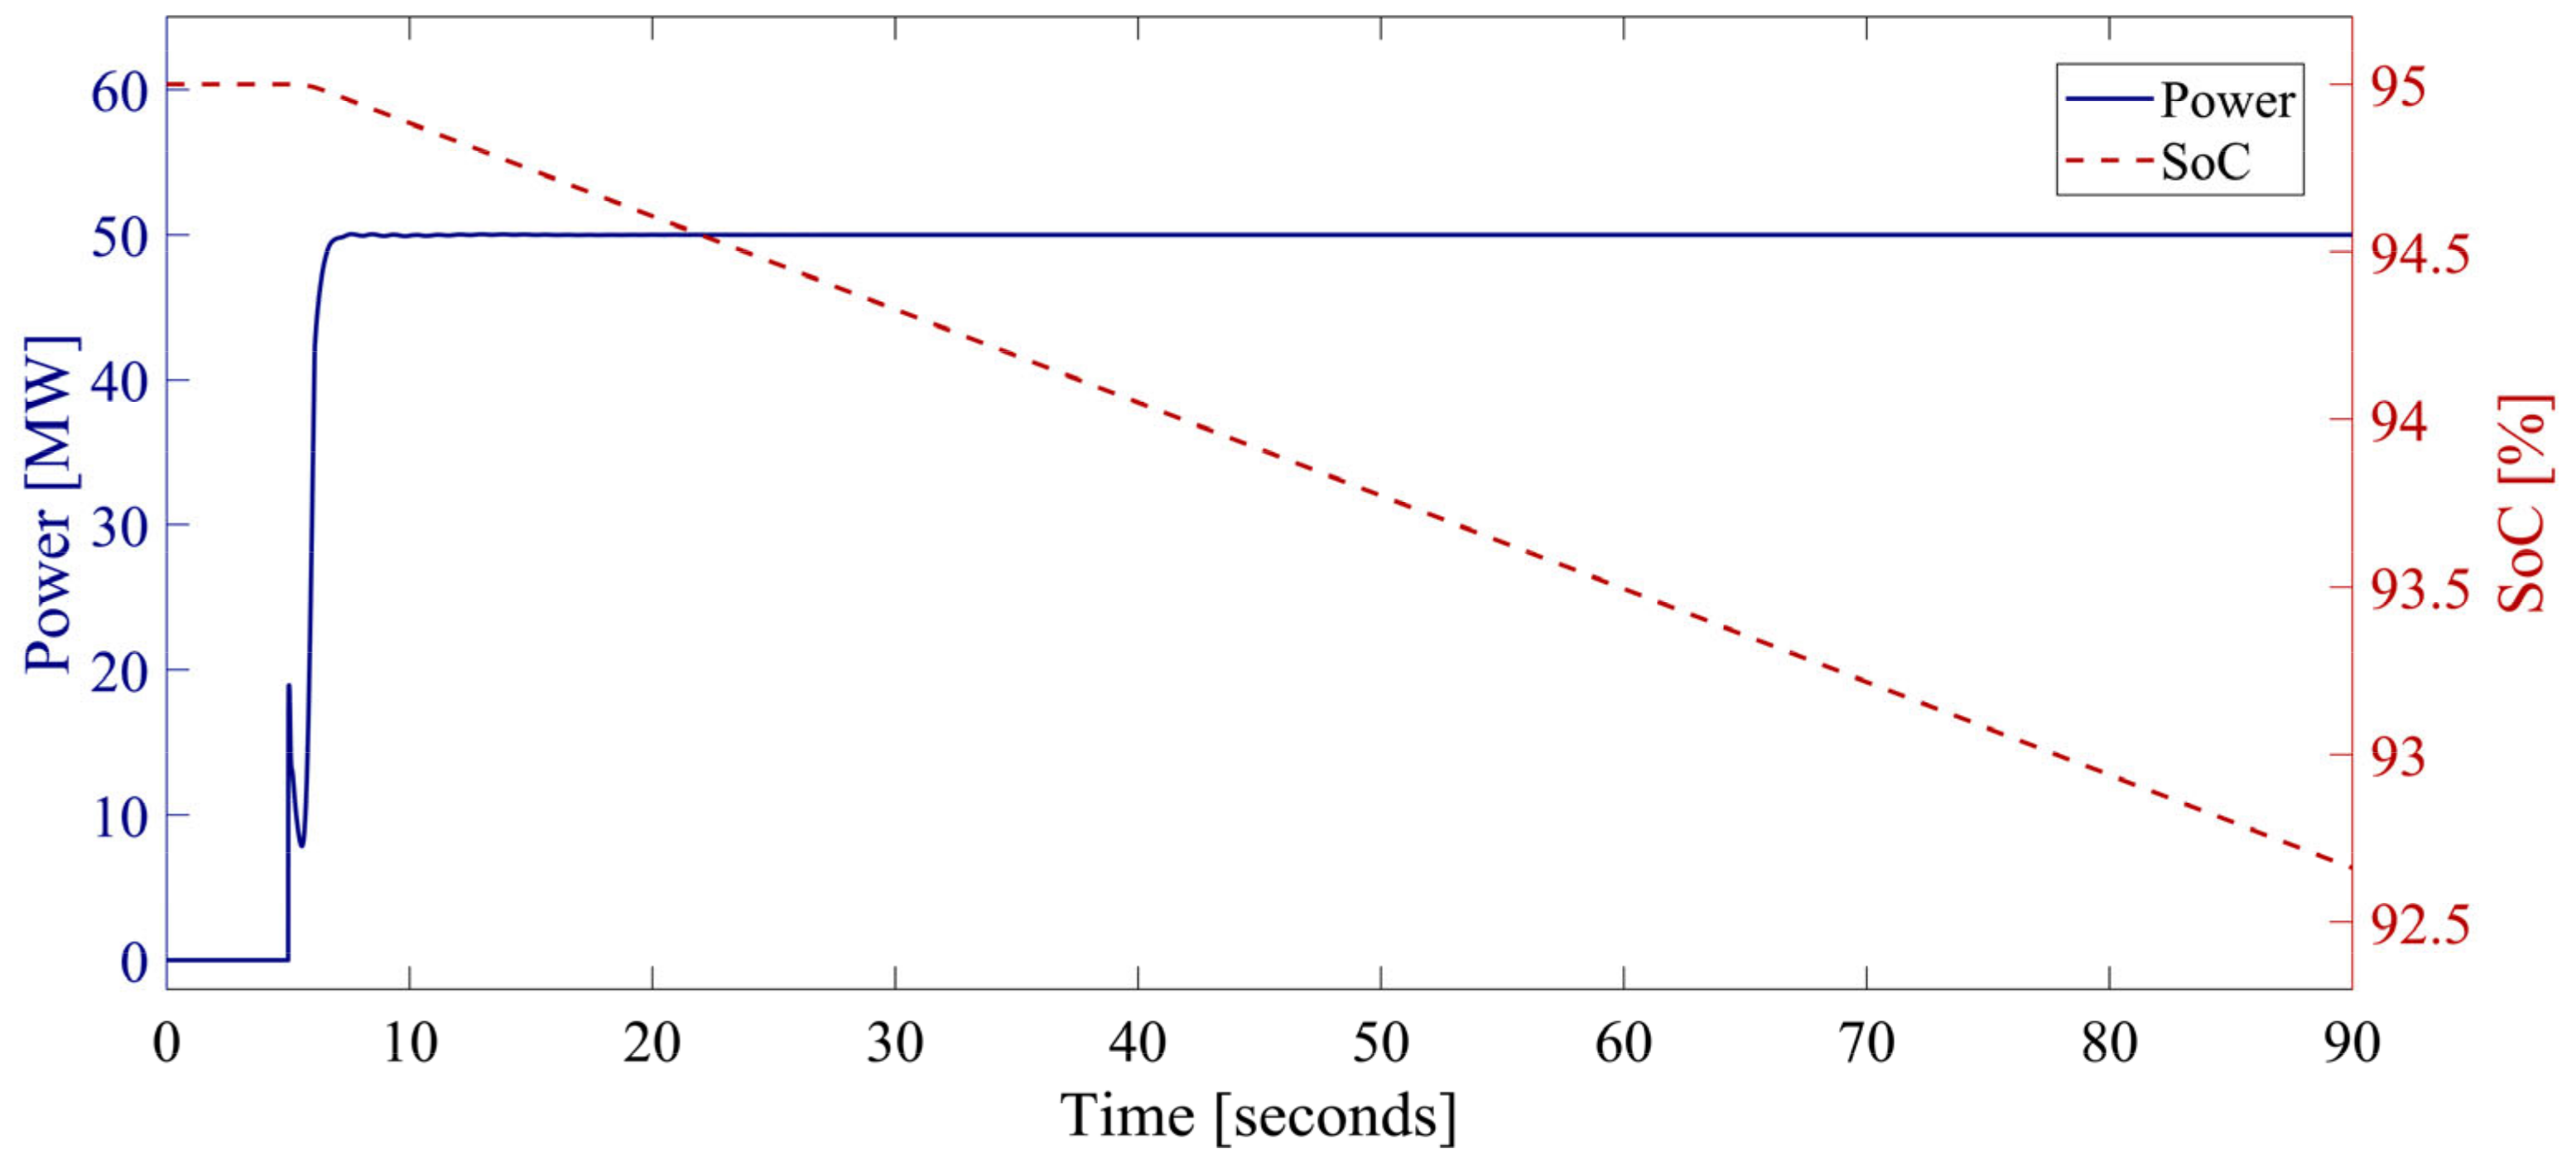
To analyze the performance of the BESS, its parameters such as S o C and injected active power (MW) were also analyzed. Figure 12 shows the active power output and S o C of a BESS connected at bus 9. The plot shows that the S o C of this BESS lies within the limits.

4.2. Analysis of the IEEE 39-Bus System

As part of the second phase of our study, the New England Test System, i.e., the IEEE 39-bus system, was considered [36]. This test network consists of 10 generators (from G 01 to G 10) and 19 loads connected by 34 branches of transmission lines. Generator G 01 is the largest generator of the system, which is equivalent to the U.S.A. interconnection tie line power exchange, and G 02 is the reference bus. The parameters of AVR and the governors are taken from the data sheet of the IEEE 39-bus system. The limits for (7) were chosen such that the BESS at each individual bus did not exceed 50 MW [3].

4.2.1. Analysis under Contingency Condition

First, the proposed method was tested using three metaheuristic optimization techniques with 40 populations and 50 iterations. Five rounds of optimization were performed. Figure 13 illustrates the convergence characteristics for the three algorithms.
Table 5 demonstrates the performance of the optimization algorithms in terms of various statistical indicators. As observed from the convergence plots and tabular comparison of algorithms, the bat algorithm provides the highest mean with a low standard deviation. Consequently, the bat algorithm was chosen to be applied with the proposed method. The optimal BESS location and size for this test system is given in Table A4. The independent run, where the fitness function (objective function) value is found to be maximum with the BA, is used for the final selection of BESS locations and sizes for the proposed method. The results obtained using other algorithms are listed in Tables S3 and S4 in the Supplementary File.
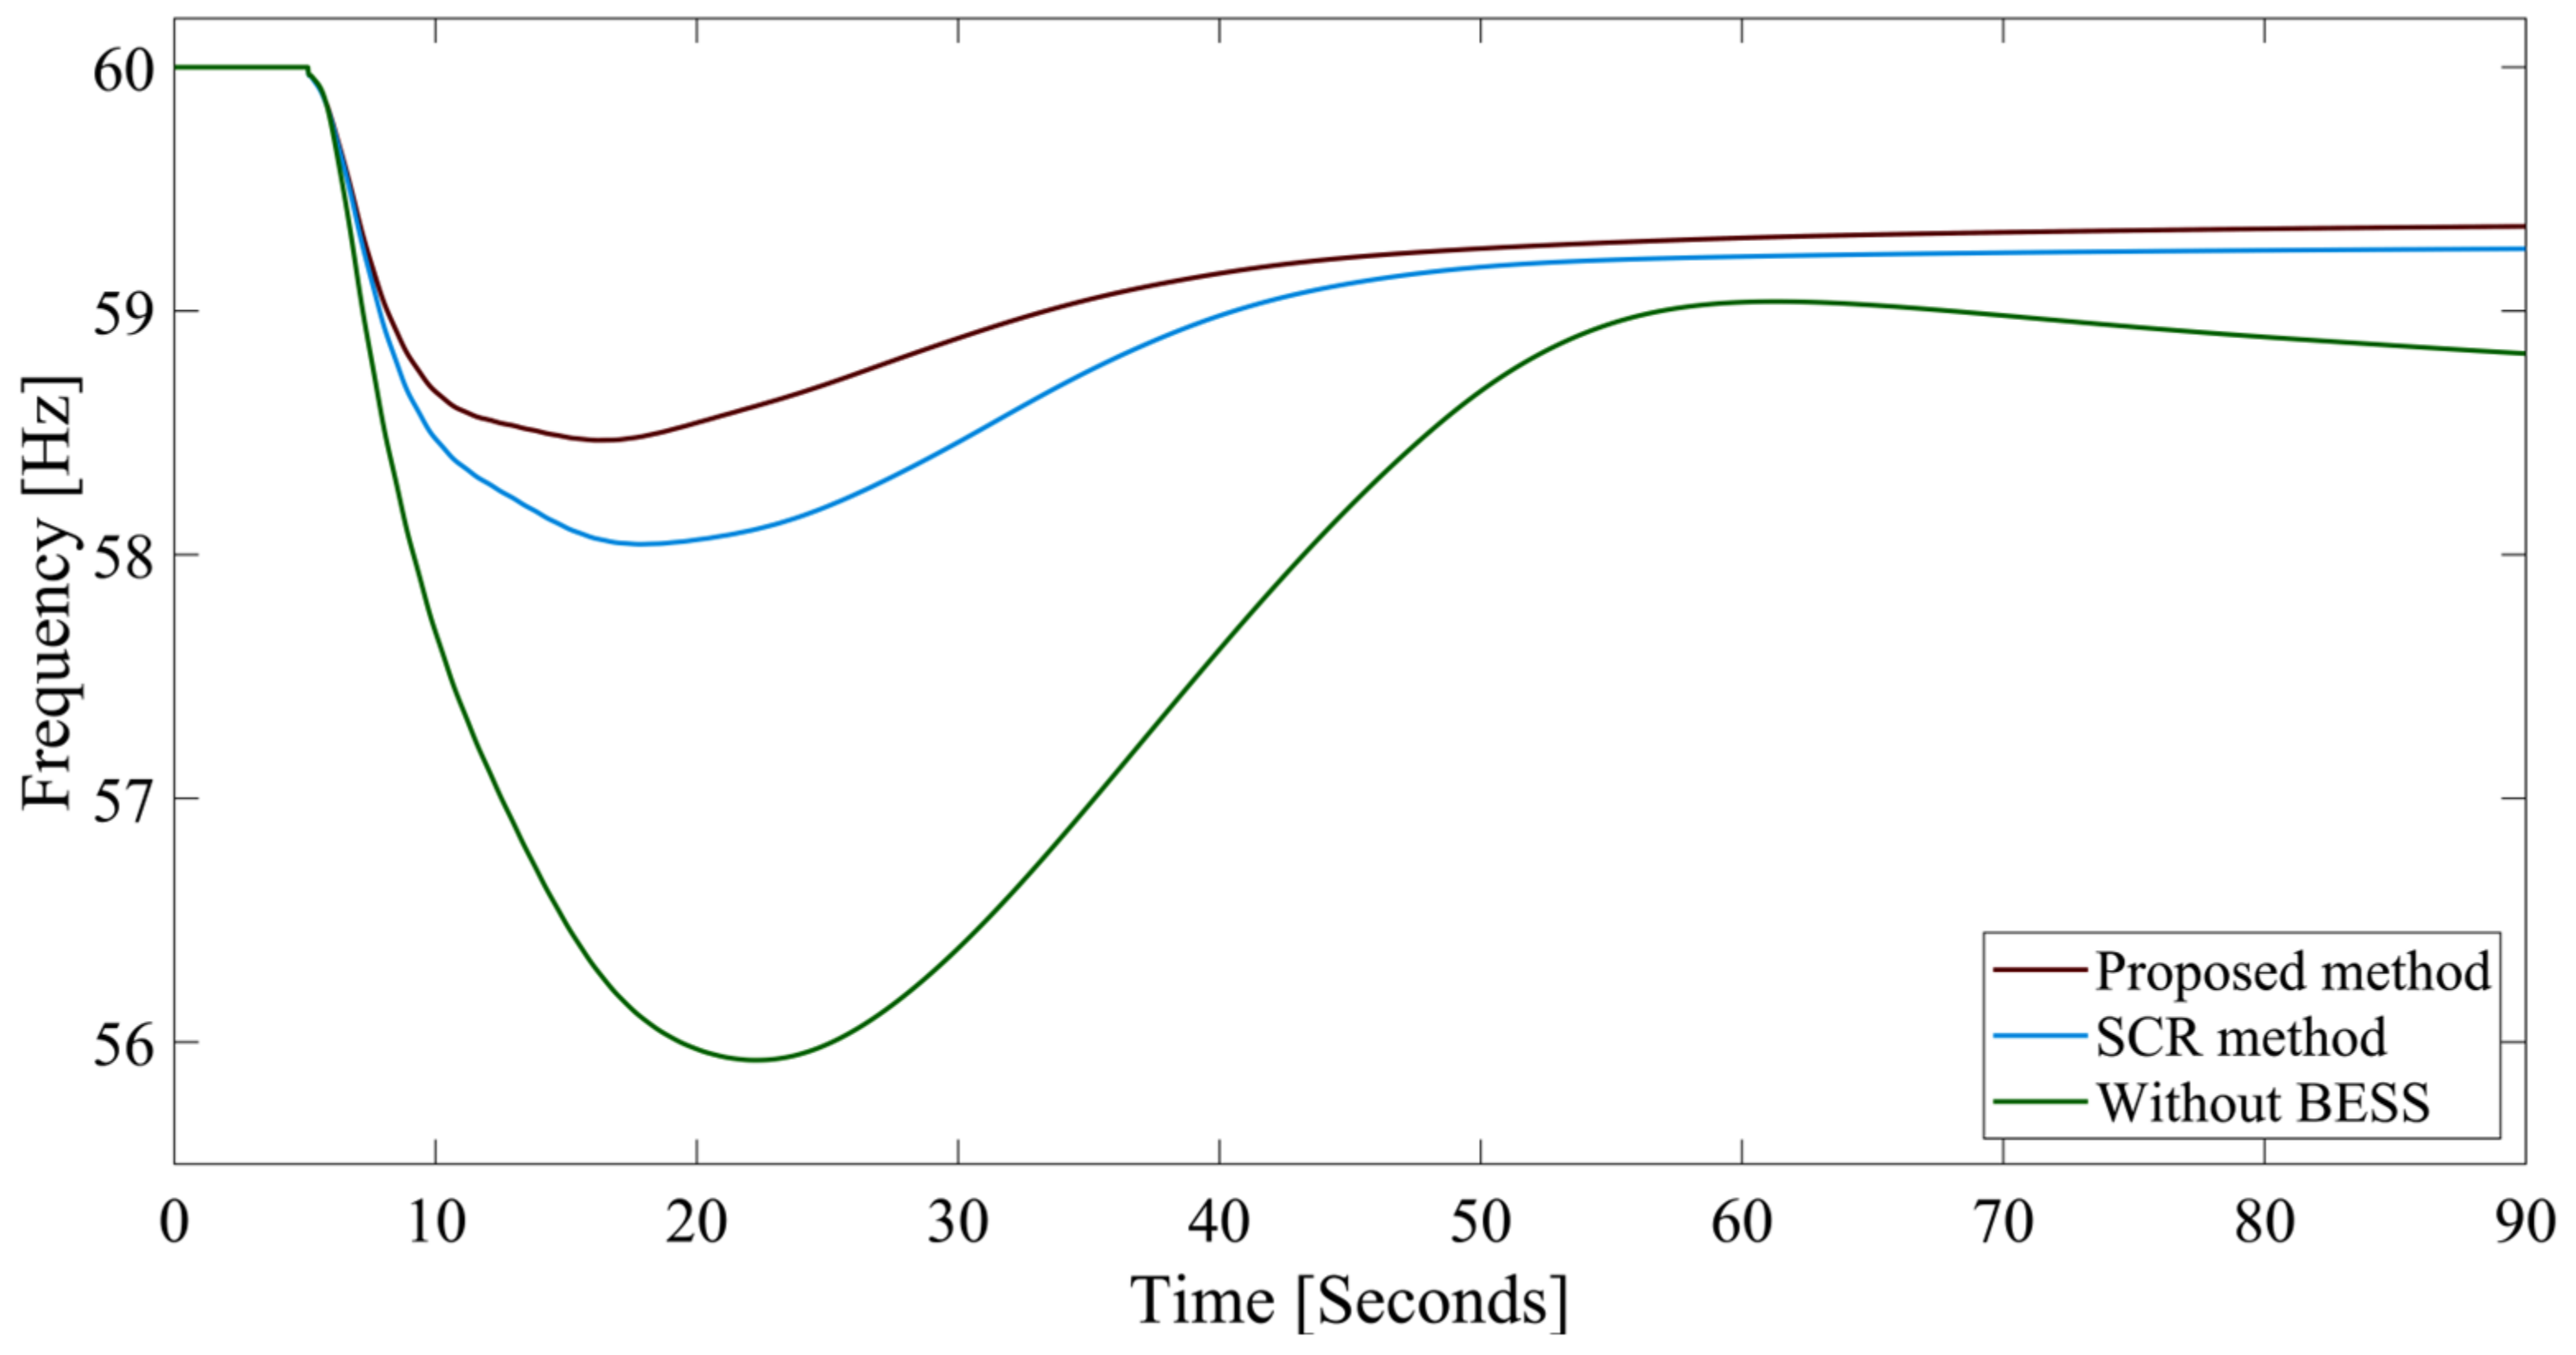
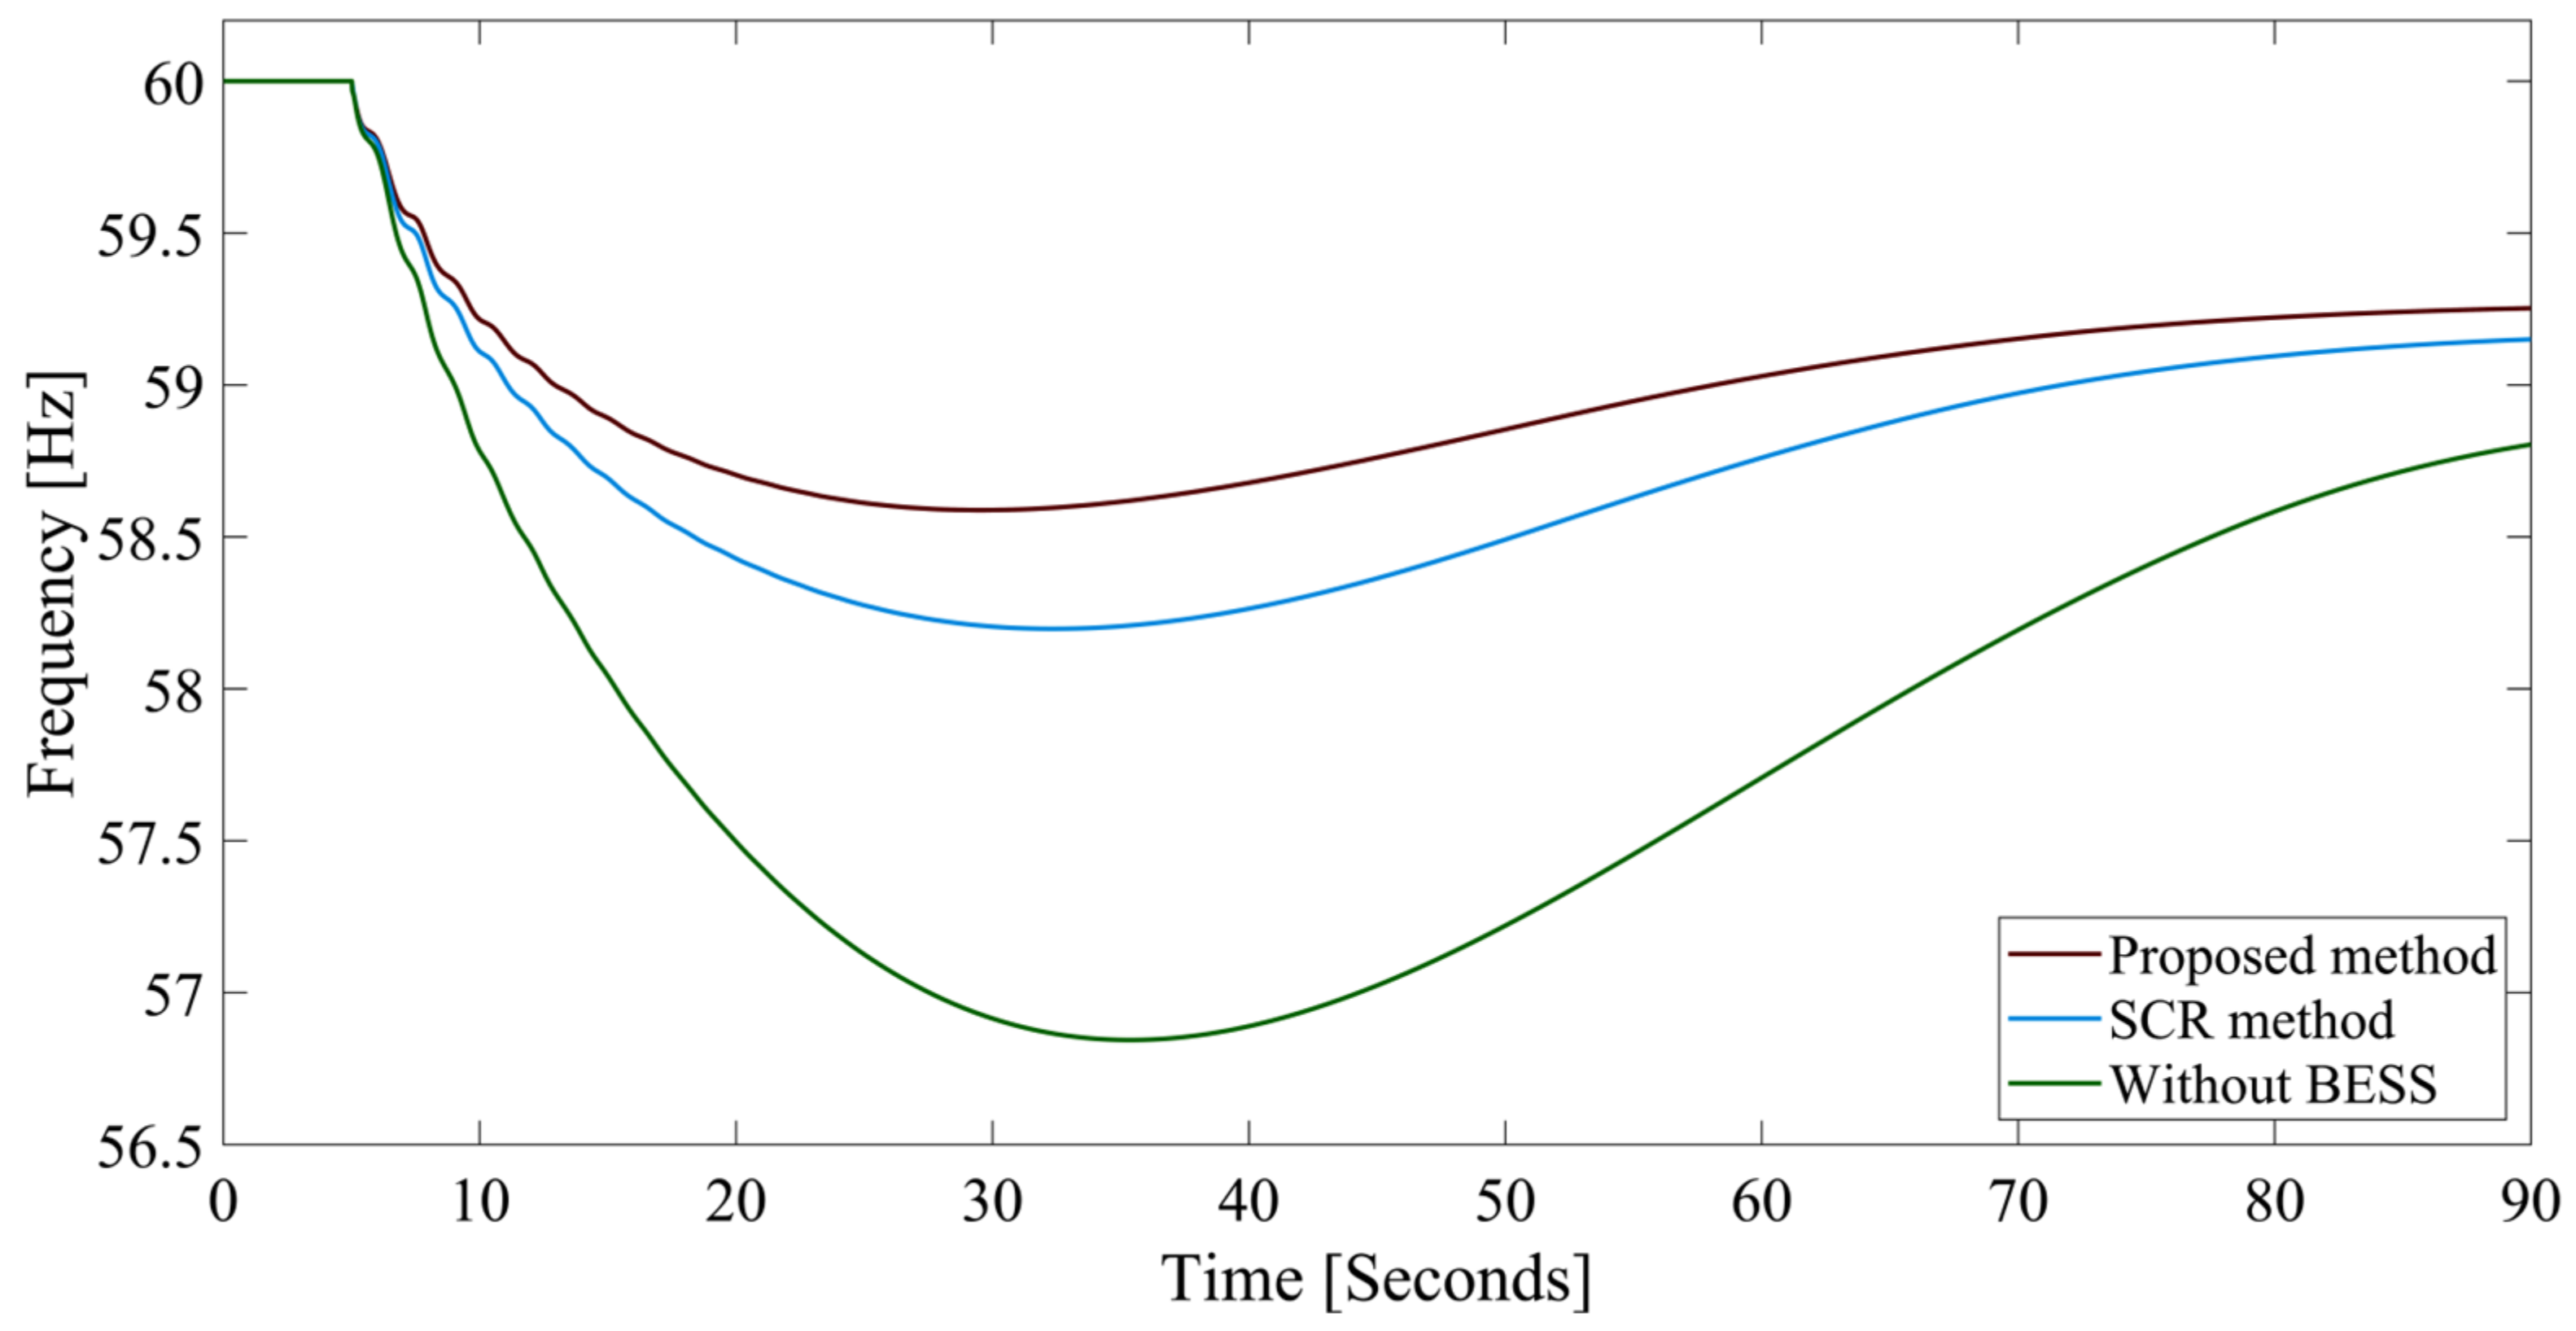
The outage of the system’s largest generator of 1000 MW was introduced at 5 s to obtain the frequency response of the system. Figure 14 shows the obtained results; it can be seen that the value of f n a d i r is 55.9257 Hz and the R o C o F value is 0.2365 Hz/s without any BESSs. This situation is improved with the SCR method and is much better with the proposed method.
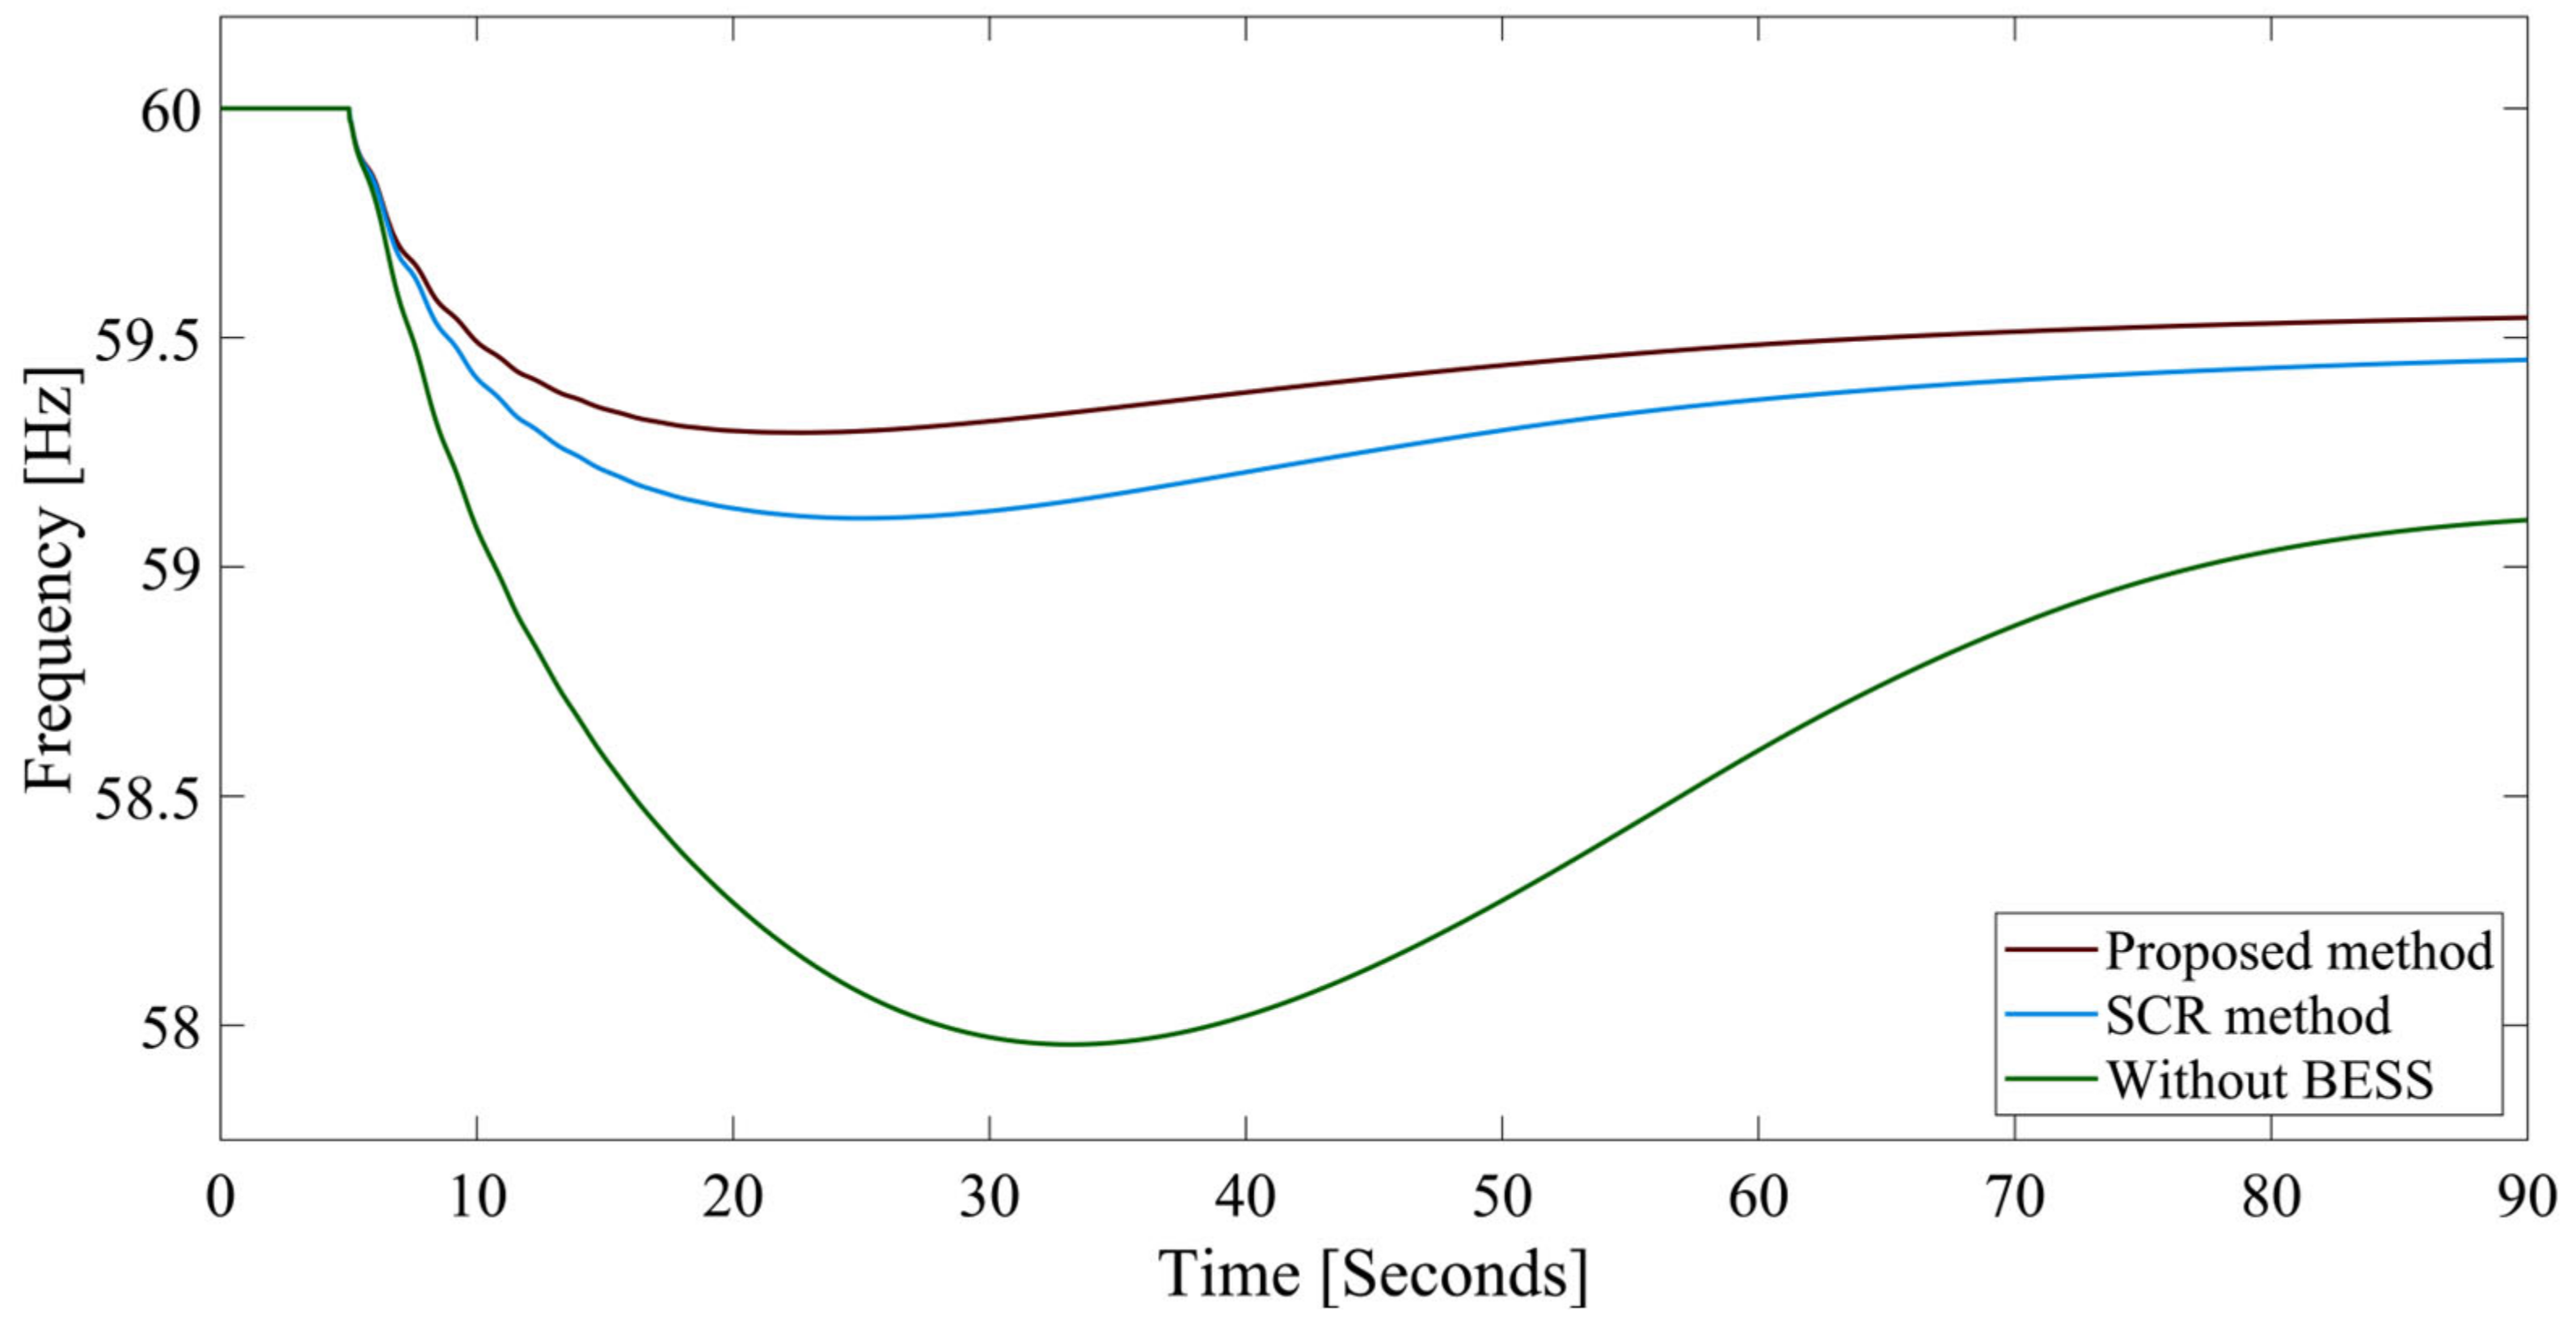
In order to perform further validation, outages of generator G 09 (830 MW) and a 650 MW generator (G 03), which represent the second and third largest generators, were also performed separately, and the obtained results are summarized in Table 6. The results show that the proposed method provides the best frequency stability enhancement under all these different outages. The value of f n a d i r is calculated by first calculating the COI frequency given by Equation (3) considering all generators (except the outage generator) taking the 90 s period window. The RoCoF value is also calculated using the COI frequency.
Figure 15 and Figure 16 show the system frequency responses under the outage of generator G 09 and 03, respectively, at 5 s and the results show that the proposed method is able to enhance the frequency stability indices much better than the other methods.

4.2.2. Analysis under Increased/Decreased Load Conditions

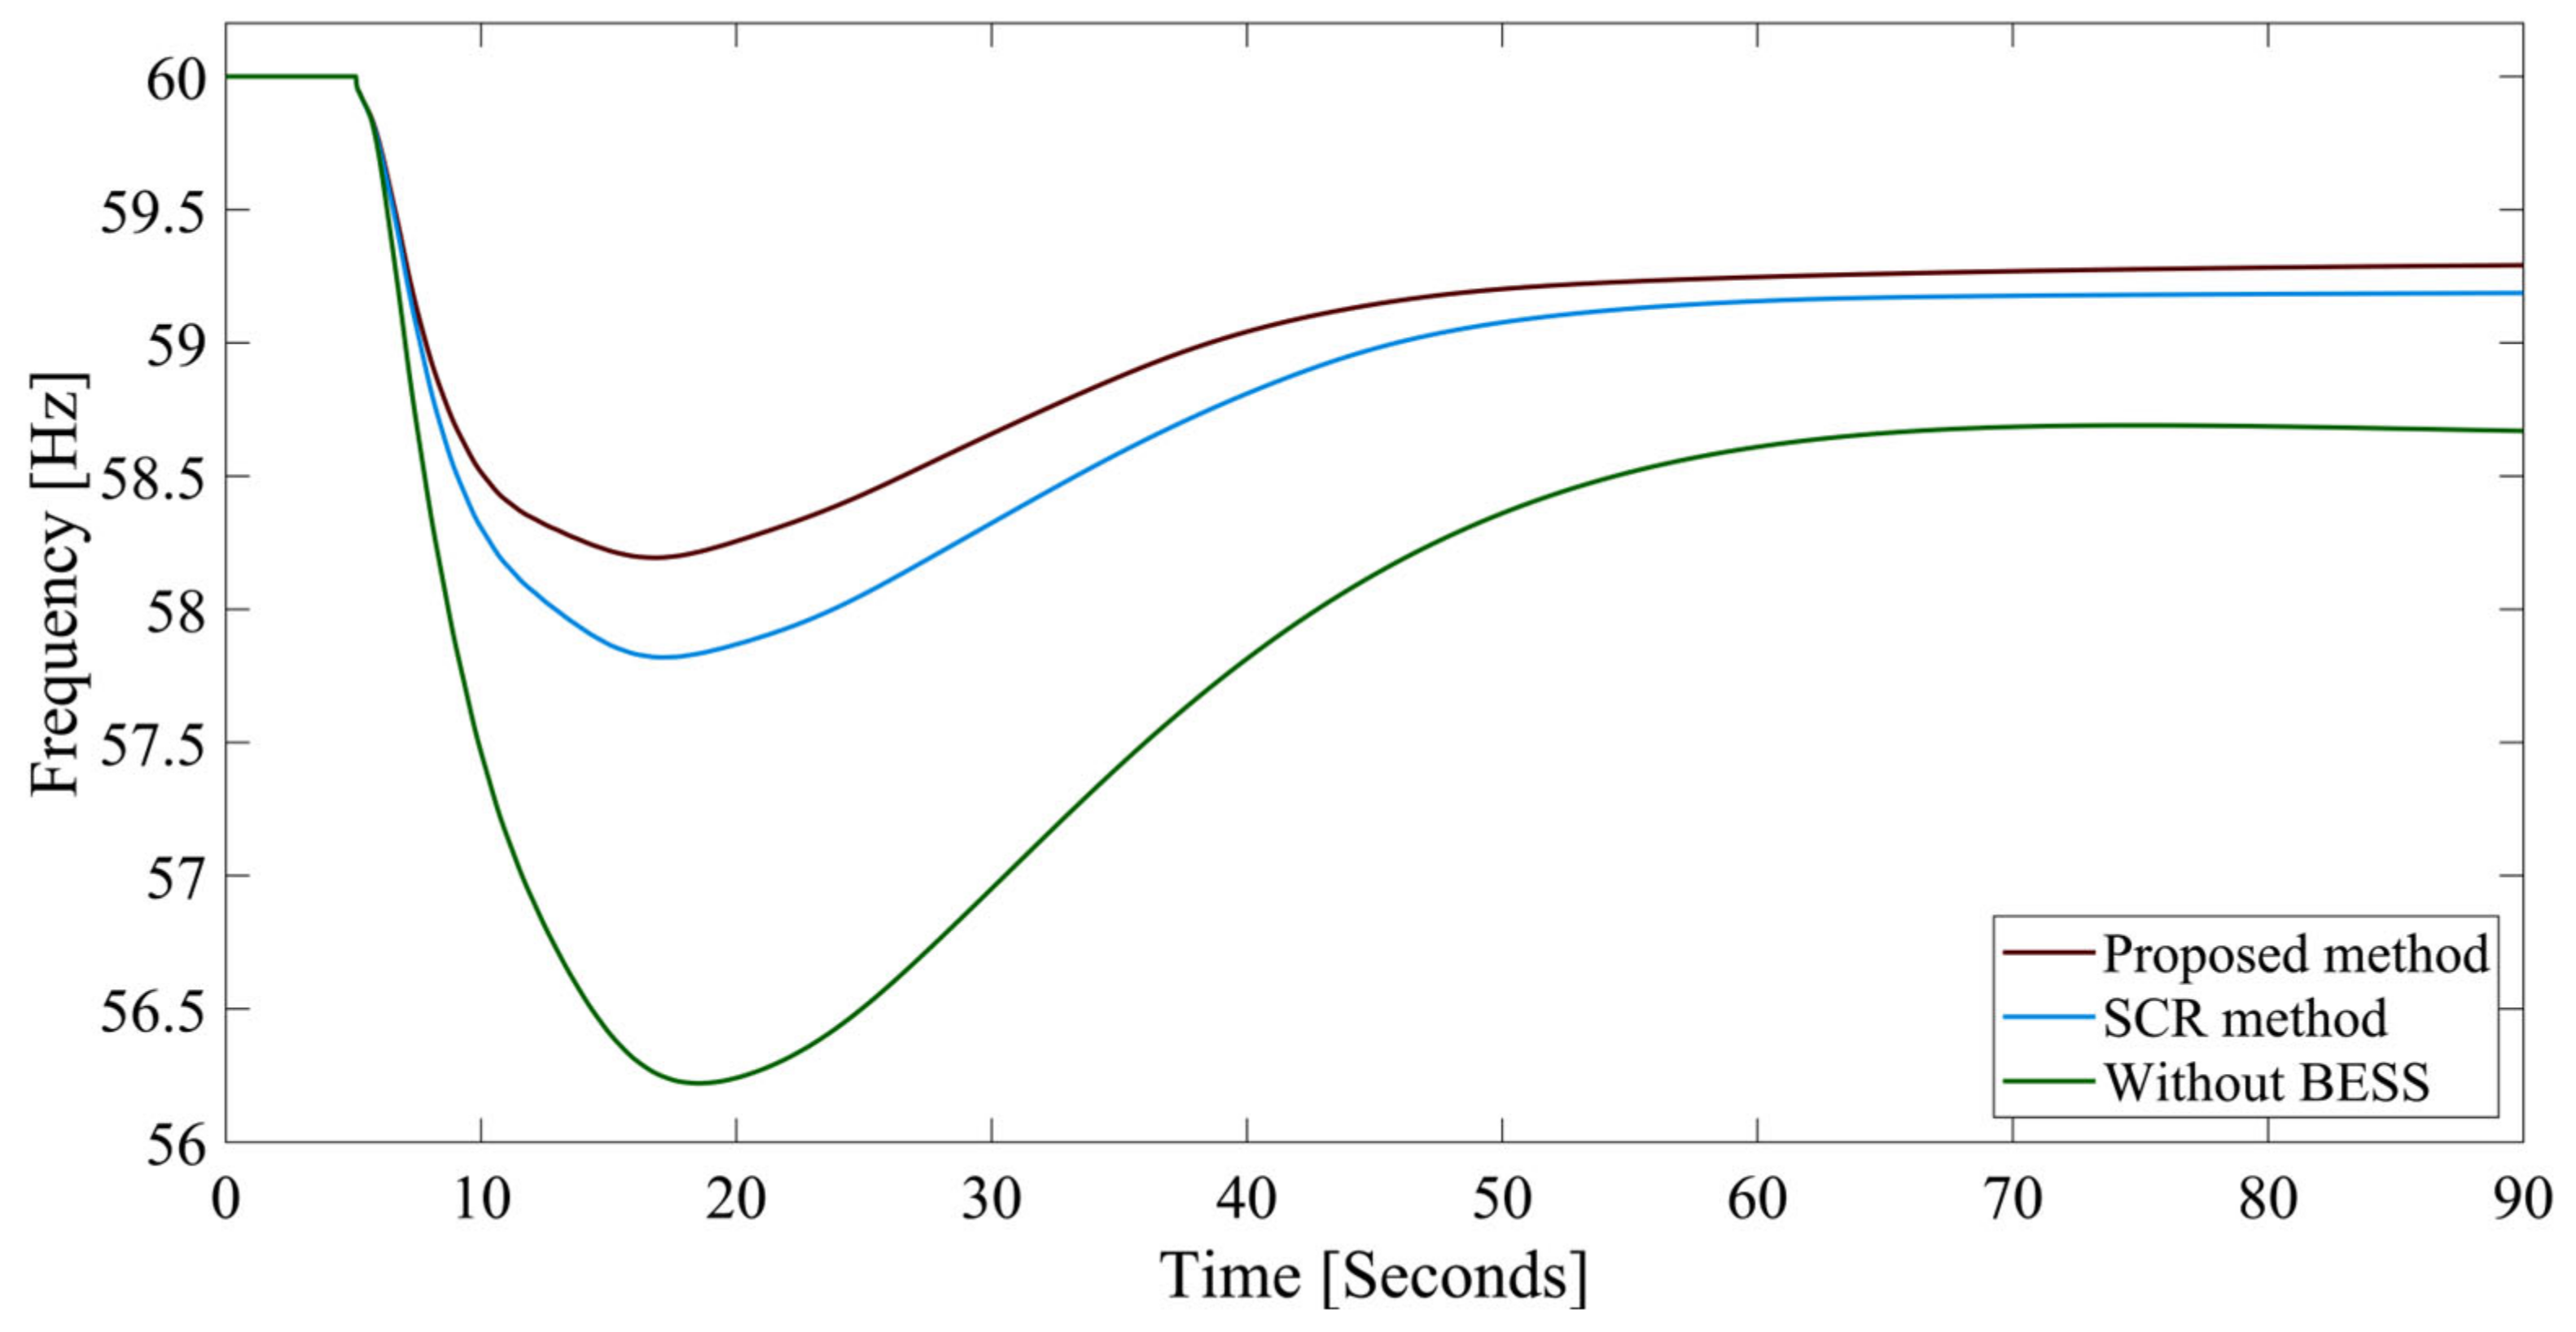
This scenario analyzes the application of the proposed method under increased and decreased load conditions. The loads are changed by ±5% (+ for increased and − for decreased) with the outage of G 01.
The frequency responses in this particular scenario are shown in Figure 17 and Figure 18 and a similar inference, as mentioned above, can also be made under this scenario. The frequency response is unstable under the increased load condition (Figure 18) in the absence of BESSs, and with the application of the SCR method, the system steady-state frequency depends on the governor and load characteristics. The plot clearly shows that the governor is unable to arrest the frequency decline when a large contingency occurs under the increased load condition.

4.2.3. Analysis under Renewable Energy Resource Penetration

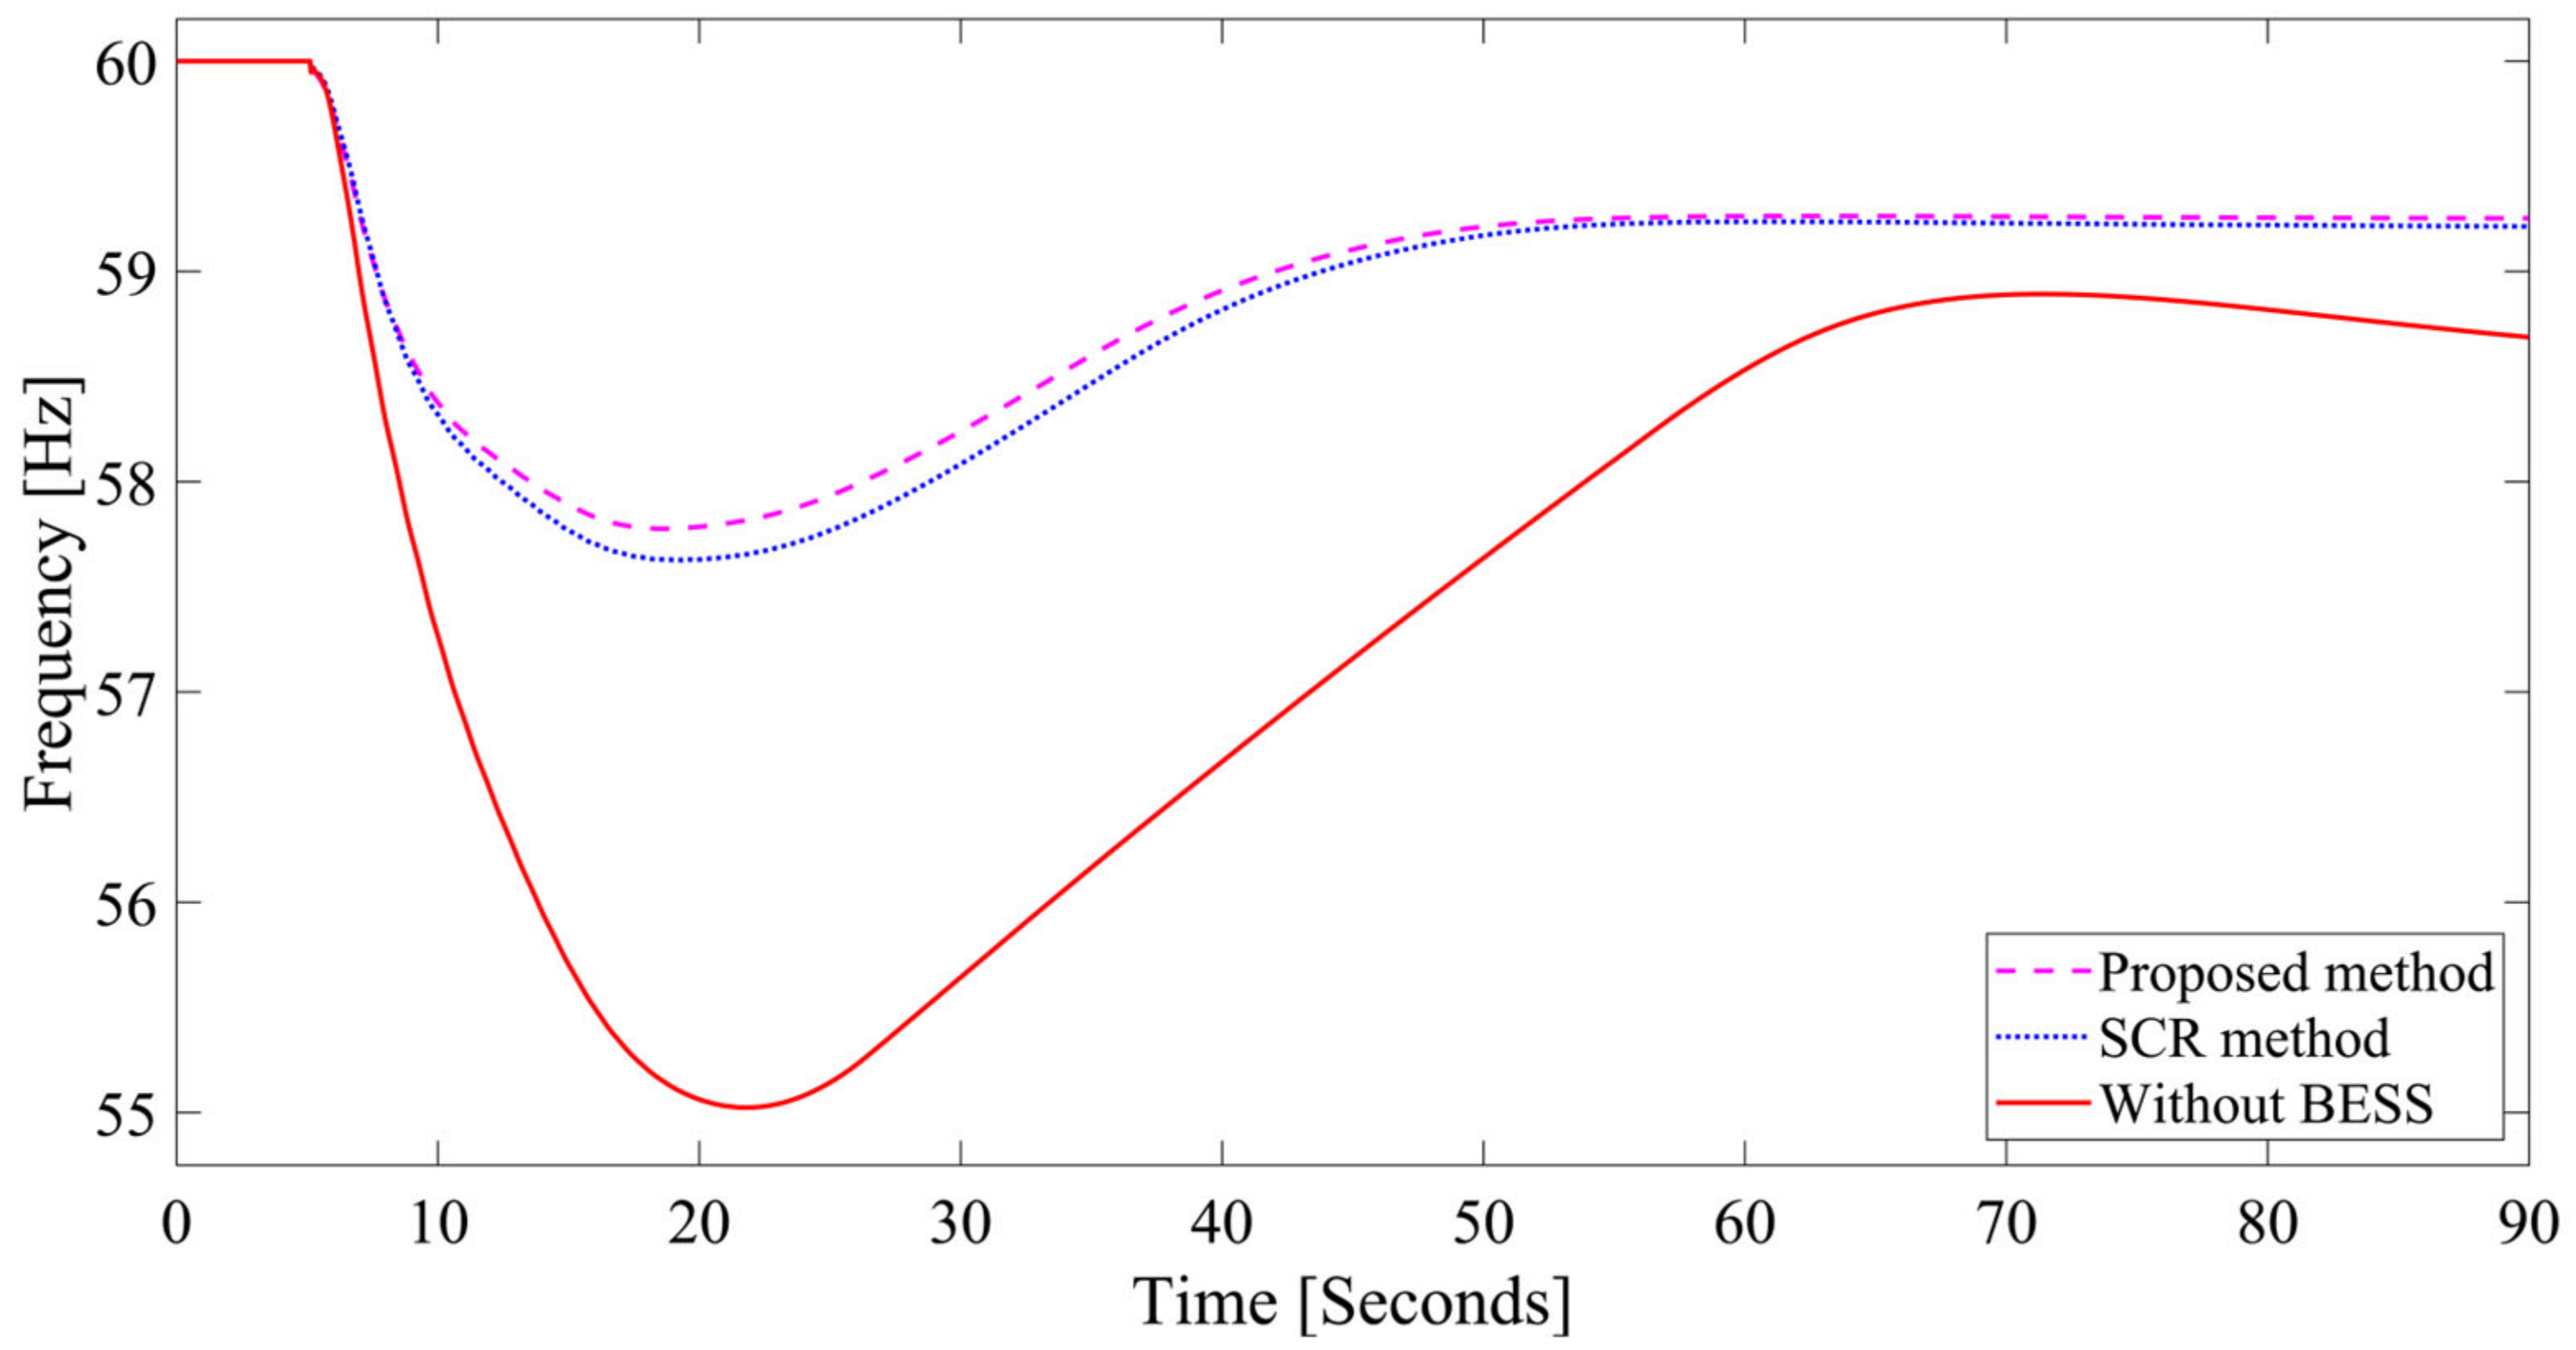
The final scenario evaluates the application of the proposed method under RES penetration. The nuclear power station G 08 connected to bus 37 was replaced with a non-synchronous, DFIG-based wind generator of equal capacity. The standard model available in DIgSILENT is used for this purpose [37]. Figure 19 depicts the frequency response under the outage of generator G 01. Both the proposed method and the compared method provide satisfactory results under this frequency excursion.
Table 7 displays the values of f n a d i r and R o C o F corresponding to various operating scenarios.
To better understand the behavior of the BESS controller, random checks on the SoC and the active power dissipation of a BESS were performed. Figure 20 illustrates the power and SoC levels for the BESS located at bus 02 during the disturbance. It can be seen that the battery SoC lies within the limits under this scenario. Moreover, the results for the voltage and angle were observed after the integration of BESS, the results are available in Figures S2–S5 of the Supplementary File.
The proposed method can be easily adapted for application to any scale of power systems. A larger test system simply means a greater number of bus locations, which can be easily adapted by increasing the constraint limit for the BESS location in the proposed method, and vice versa.

5. Conclusions

This paper proposes a method based on optimization to find the placement location and sizing of BESSs for the enhancement of the system’s frequency stability indices f n a d i r and R o C o F . The proposed method is tested using three metaheuristic optimization algorithms with the BA providing the best result for both test systems (the IEEE 9-bus system and the IEEE 39-bus system). The proposed method performs well compared to the conventional method for the improvement of the frequency stability.
The following are the key conclusions of this paper:
  • The BA consistently exhibits the best performance compared to PSO and the FA, as demonstrated by its attainment of a mean fitness value of 58.2723 Hz in the IEEE 9-bus system, which is higher than 58.2681 Hz obtained with PSO, and 58.1926 Hz obtained with the FA in the IEEE 9-bus system. Similarly, the mean fitness value with the BA is 58.4220 Hz, 58.3395 Hz with PSO, and 58.2239 Hz with the FA, when tested with the proposed method in the IEEE 39-bus system.
  • The proposed method results in the f n a d i r value of 55.6914 Hz and the RoCoF value of 1.7855 Hz/s, which is better than the values of f n a d i r (55.6657 Hz) and RoCoF (1.7962 Hz) obtained using the compared method under outage of the largest generator in the IEEE 9-bus system.
  • The f n a d i r value of 55.9257 Hz and the R o C o F value of 0.2365 Hz/s are observed when the largest generator, G 01, experiences an outage in the IEEE 39-bus system. Using the compared method, the f n a d i r and R o C o F values are 58.0426 Hz and 0.1526 Hz/s, respectively. However, when the proposed method is applied, a better f n a d i r value of 58.4690 Hz and a better R o C o F value of 0.1365 Hz/s are obtained.
  • The proposed method demonstrated improved frequency stability indices under various scenarios, including variations in load conditions and the integration of wind turbine generation, as compared to other methods, when tested on both the IEEE 9-bus system and the IEEE 39-bus system.
The proposed method is based on conventional meta-heuristic optimization algorithms and new algorithms may exist which may provide even better solutions. Our future work will consider the sizing and location of BESSs under power system uncertainties, as well as tests using new meta-heuristic optimization algorithms.

Supplementary Materials

The following supporting information can be downloaded at: https://www.mdpi.com/article/10.3390/electricity5030033/s1, Table S1: Optimal size and location of BESS using FA (IEEE 9-bus system); Table S2: Optimal size and location of BESS using PSO (IEEE 9-bus system); Table S3: Optimal size and location of BESS using FA (IEEE 39-bus system); Table S4: Optimal size and location of BESS using PSO (IEEE 39-bus system); Table S5: Overshoot time for different generator contingencies in the IEEE 9-bus system; Figure S1: Frequency response following loss of generator G3 for the IEEE 9-bus system; Figure S2: Rotor angle (in degrees)—under disturbance condition [IEEE 9-bus system]; Figure S3: Bus voltage (in p.u.)—under disturbance condition [IEEE 9-bus system]; Figure S4: Rotor angle (in degrees)—after BESS integration [IEEE 9-bus system]; Figure S5: Bus voltage (in p.u.)—after BESS integration [IEEE 9-bus system].

Author Contributions

Conceptualization, A.P. and S.G.; methodology, S.G.; software, A.P. and S.G.; validation, S.G. and K.C.; formal analysis, S.G. and K.C.; investigation, A.P.; writing—original draft preparation, A.P.; writing—review and editing, A.P., S.G. and K.C.; visualization, A.P. and K.C.; supervision, S.G. and K.C. All authors have read and agreed to the published version of the manuscript.

Funding

This research received no external funding.

Data Availability Statement

The data can be provided upon request.

Conflicts of Interest

The authors declare no conflicts of interest.

Appendix A

Table A1. Parameters used for modeling the BESS.
PV Controller
ParametersDescriptionUnitsValue
TrFilter time constant, active power(s)0.01
TrqFilter time constant, reactive power(s)0.1
KpProportional gain-id-PI control(p.u.)2
TipIntegrator time constant—ip control(s)0.2
AC DeadbandDeadband for proportional gain(p.u.)0
KqProportional gain-iq-PI control(p.u.)1
TiqIntegrator time constant—iq control(s)0.002
id_minMinimum discharging current(p.u.)−1
iq_minMinimum reactive current(p.u.)−1
id_maxMaximum charging current(p.u.)1
iq_maxMaximum reactive current(p.u.)1
Battery Bank
ParametersDescriptionUnitsValue
CbatBattery capacityMWh3 a, 50 b
SoCMinMinimum state of charge(%)0
SoCMaxMaximum state of charge(%)1
SoCt−1Initial SoC(%)87 a, 95 b
Frequency Controller
ParametersDescriptionUnitsValue
droopFull active power within 1 Hz/2 Hz 0.004
dbDeadband for frequency control(p.u.)0.0004
a—IEEE 9-bus system; b—IEEE 39-bus system.
Table A2. Parameters used in optimization algorithms.
Particle Swarm Optimization Algorithm
ParametersDescriptionValueRange
nNumber of particles40
N_genNumber of generations50
αLearning factor0.20 ≤ α ≤ 2
βLearning factor0.50 < β < 2
ωInertia weight0.5
Firefly Algorithm
ParametersDescriptionValueRange
nNumber of fireflies40
MaxGenerationNumber of pseudo time steps50
αRandomness0.030 ≤ α ≤ 1
γAbsorption coefficient10
Bat Algorithm
ParametersDescriptionValueRange
nPopulation size4010 ≤ n ≤ 40
N_genNumber of generations50
ALoudness0.1
rPulse rate0.9
E m i n Minimum emission frequency0
E m a x Minimum emission frequency1

Appendix B

Table A3. Optimal size and location of BESSs for IEEE 9-bus system using proposed method.
Bus IDVoltage Level (kV)BESS Size (MW)
Bus 313.8 kV3.0 MW
Bus 4230 kV3.0 MW
Bus 6230 kV0.5 MW
Bus 7230 kV3.0 MW
Bus 8230 kV3.0 MW
Bus 9230 kV3.0 MW
Table A4. Optimal size and location of BESSs for IEEE 39-bus system using proposed method.
Bus IDVoltage Level (kV)BESS Size (MW)
Bus 02345 kV50.0 MW
Bus 03345 kV6.0 MW
Bus 19345 kV47.0 MW
Bus 21345 kV50.0 MW
Bus 24345 kV50.0 MW
Bus 3516.5 kV50.0 MW
Bus 3716.5 kV50.0 MW

References

  1. Kundur, P. Power System Stability and Control; McGraw-Hill, Inc.: New York, NY, USA, 2010. [Google Scholar]
  2. Hatziargyriou, N.; Milanovic, J.; Rahmann, C.; Ajjarapu, V.; Canizares, C.; Erlich, I.; Hill, D.; Hiskens, I.; Kamwa, I.; Pal, B.; et al. Definition and Classification of Power System Stability—Revisited & Extended. IEEE Trans. Power Syst. 2021, 36, 3271–3281. [Google Scholar] [CrossRef]
  3. Kebede, A.A.; Kalogiannis, T.; Van Mierlo, J.; Berecibar, M. A Comprehensive Review of Stationary Energy Storage Devices for Large Scale Renewable Energy Sources Grid Integration. Renew. Sustain. Energy Rev. 2022, 159, 112213. [Google Scholar] [CrossRef]
  4. Mitali, J.; Dhinakaran, S.; Mohamad, A.A. Energy Storage Systems: A Review. Energy Storage Sav. 2022, 1, 166–216. [Google Scholar] [CrossRef]
  5. Calero, F.; Cañizares, C.A.; Bhattacharya, K.; Anierobi, C.; Calero, I.; De Souza, M.F.Z.; Farrokhabadi, M.; Guzman, N.S.; Mendieta, W.; Peralta, D.; et al. A Review of Modeling and Applications of Energy Storage Systems in Power Grids. Proc. IEEE 2023, 111, 806–831. [Google Scholar] [CrossRef]
  6. Klyuev, R.; Bosikov, I.; Gavrina, O. Use of Wind Power Stations for Energy Supply to Consumers in Mountain Territories. In Proceedings of the 2019 International Ural Conference on Electrical Power Engineering (UralCon), Chelyabinsk, Russia, 1–3 October 2019; pp. 116–121. [Google Scholar]
  7. Facchini, L. The Numerical Simulation of Gaussian Cross-Correlated Wind Velocity Fluctuations by Means of a Hybrid Model. J. Wind Eng. Ind. Aerodyn. 1996, 64, 187–202. [Google Scholar] [CrossRef]
  8. Ilyushin, P.V.; Shepovalova, O.V.; Filippov, S.P.; Nekrasov, A.A. The Effect of Complex Load on the Reliable Operation of Solar Photovoltaic and Wind Power Stations Integrated into Energy Systems and into Off-Grid Energy Areas. Energy Rep. 2022, 8, 1515–1529. [Google Scholar] [CrossRef]
  9. Adrees, A.; Milanovic, J.V. Study of Frequency Response in Power System with Renewable Generation and Energy Storage. In Proceedings of the 2016 Power Systems Computation Conference (PSCC), Genoa, Italy, 20–24 June 2016; pp. 1–7. [Google Scholar]
  10. Silva-Saravia, H.; Pulgar-Painemal, H.; Mauricio, J.M. Flywheel Energy Storage Model, Control and Location for Improving Stability: The Chilean Case. IEEE Trans. Power Syst. 2017, 32, 3111–3119. [Google Scholar] [CrossRef]
  11. Poolla, B.K.; Bolognani, S.; Dorfler, F. Optimal Placement of Virtual Inertia in Power Grids. IEEE Trans. Automat. Contr. 2017, 62, 6209–6220. [Google Scholar] [CrossRef]
  12. Ramírez, M.; Castellanos, R.; Calderón, G.; Malik, O. Placement and Sizing of Battery Energy Storage for Primary Frequency Control in an Isolated Section of the Mexican Power System. Electr. Power Syst. Res. 2018, 160, 142–150. [Google Scholar] [CrossRef]
  13. Adrees, A.; Milanović, J. Effect of Load Models on Angular and Frequency Stability of Low Inertia Power Networks. IET Gener. Transm. Distrib. 2019, 13, 1520–1526. [Google Scholar] [CrossRef]
  14. Conte, F.; Massucco, S.; Paolone, M.; Schiapparelli, G.P.; Silvestro, F.; Zuo, Y. Frequency Stability Assessment of Modern Power Systems: Models Definition and Parameters Identification. Sustain. Energy Grids Netw. 2020, 23, 100384. [Google Scholar] [CrossRef]
  15. Tsany, F.N.; Widayat, A.A.; Aryani, D.R.; Jufri, F.H.; Ardita, I.M. Power System Stability Improvement Using Battery Energy Storage System (BESS) in Isolated Grid. IOP Conf. Ser. Earth Environ. Sci. 2020, 599, 012025. [Google Scholar] [CrossRef]
  16. Das, C.K.; Mahmoud, T.S.; Bass, O.; Muyeen, S.M.; Kothapalli, G.; Baniasadi, A.; Mousavi, N. Optimal Sizing of a Utility-Scale Energy Storage System in Transmission Networks to Improve Frequency Response. J. Energy Storage 2020, 29, 101315. [Google Scholar] [CrossRef]
  17. El-Bidairi, K.S.; Nguyen, H.D.; Mahmoud, T.S.; Jayasinghe, S.D.G.; Guerrero, J.M. Optimal Sizing of Battery Energy Storage Systems for Dynamic Frequency Control in an Islanded Microgrid: A Case Study of Flinders Island, Australia. Energy 2020, 195, 117059. [Google Scholar] [CrossRef]
  18. Ben Yosef, G.; Navon, A.; Poliak, O.; Etzion, N.; Gal, N.; Belikov, J.; Levron, Y. Frequency Stability of the Israeli Power Grid with High Penetration of Renewable Sources and Energy Storage Systems. Energy Rep. 2021, 7, 6148–6161. [Google Scholar] [CrossRef]
  19. Cao, Y.; Wu, Q.; Zhang, H.; Li, C. Optimal Sizing of Hybrid Energy Storage System Considering Power Smoothing and Transient Frequency Regulation. Int. J. Electr. Power Energy Syst. 2022, 142, 108227. [Google Scholar] [CrossRef]
  20. Alsharif, H.; Jalili, M.; Hasan, K.N. A Frequency Stability Analysis for BESS Placement Considering the Loads and Wind Farms Locations. In Proceedings of the 2022 IEEE PES 14th Asia-Pacific Power and Energy Engineering Conference (APPEEC), Melbourne, Australia, 20 November 2022; pp. 1–5. [Google Scholar]
  21. Akram, U.; Mithulananthan, N.; Shah, R.; Alzahrani, S. Design of Energy Storage for Frequency Stability in Low-Inertia Power Grid. IEEE Syst. J. 2023, 17, 4763–4774. [Google Scholar] [CrossRef]
  22. Ramos, A.F.; Ahmad, I.; Habibi, D.; Mahmoud, T.S. Placement and Sizing of Utility-Size Battery Energy Storage Systems to Improve the Stability of Weak Grids. Int. J. Electr. Power Energy Syst. 2023, 144, 108427. [Google Scholar] [CrossRef]
  23. Hosseini, S.A.; Toulabi, M.; Ashouri-Zadeh, A.; Ranjbar, A.M. Battery Energy Storage Systems and Demand Response Applied to Power System Frequency Control. Int. J. Electr. Power Energy Syst. 2022, 136, 107680. [Google Scholar] [CrossRef]
  24. Nassef, A.M.; Abdelkareem, M.A.; Maghrabie, H.M.; Baroutaji, A. Review of Metaheuristic Optimization Algorithms for Power Systems Problems. Sustainability 2023, 15, 9434. [Google Scholar] [CrossRef]
  25. Teng, F.; Strbac, G. Assessment of the Role and Value of Frequency Response Support from Wind Plants. IEEE Trans. Sustain. Energy 2016, 7, 586–595. [Google Scholar] [CrossRef]
  26. Adrees, A.; Milanović, J.V.; Mancarella, P. Effect of Inertia Heterogeneity on Frequency Dynamics of Low-inertia Power Systems. IET Gener. Transm. Distrib. 2019, 13, 2951–2958. [Google Scholar] [CrossRef]
  27. DIgSILENT PowerFactory Manual. Battery Energy Storing System Template. Application Guide. 2013. Available online: https://www.digsilent.de/en/ (accessed on 3 August 2023).
  28. Datta, U.; Kalam, A.; Shi, J. Battery Energy Storage System for Transient Frequency Stability Enhancement of a Large-Scale Power System. In Proceedings of the 2017 Australasian Universities Power Engineering Conference (AUPEC), Melbourne, VIC, Australia, 19–22 November 2017; pp. 1–5. [Google Scholar]
  29. Javadi, M.; Gong, Y.; Chung, C.Y. Frequency Stability Constrained BESS Sizing Model for Microgrids. IEEE Trans. Power Syst. 2023, 39, 1–13. [Google Scholar] [CrossRef]
  30. Yang, X. Engineering Optimization: An Introduction with Metaheuristic Applications, 1st ed.; Wiley: Hoboken, NJ, USA, 2010; ISBN 978-0-470-58246-6. [Google Scholar]
  31. Kennedy, J.; Eberhart, R. Particle Swarm Optimization. In Proceedings of the ICNN’95—International Conference on Neural Networks, Perth, Australia, 27 November–1 December 1995; Volume 4, pp. 1942–1948. [Google Scholar]
  32. Kennedy, J.; Eberhart, R.C. A Discrete Binary Version of the Particle Swarm Algorithm. In Proceedings of the 1997 IEEE International Conference on Systems, Man, and Cybernetics. Computational Cybernetics and Simulation, Orlando, FL, USA, 12–15 October 1997; Volume 5, pp. 4104–4108. [Google Scholar]
  33. Zhang, L.; Shan, L.; Wang, J. Optimal Feature Selection Using Distance-Based Discrete Firefly Algorithm with Mutual Information Criterion. Neural Comput. Applic. 2017, 28, 2795–2808. [Google Scholar] [CrossRef]
  34. Yang, X.-S. A New Metaheuristic Bat-Inspired Algorithm. In Nature Inspired Cooperative Strategies for Optimization (NICSO 2010); González, J.R., Pelta, D.A., Cruz, C., Terrazas, G., Krasnogor, N., Eds.; Studies in Computational Intelligence; Springer: Berlin/Heidelberg, Germany, 2010; Volume 284, pp. 65–74. ISBN 978-3-642-12537-9. [Google Scholar]
  35. Mirjalili, S.; Mirjalili, S.M.; Yang, X.-S. Binary Bat Algorithm. Neural Comput. Applic. 2014, 25, 663–681. [Google Scholar] [CrossRef]
  36. Illinois Center for a Smarter Electric Grid (ICSEG). Literature-Based Power Flow Test Cases; Illinois Center for a Smarter Electric Grid (ICSEG): Urbana, IL, USA, 2023. [Google Scholar]
  37. Gonzalez-Longatt, F.M.; Luis Rueda, J. (Eds.) PowerFactory Applications for Power System Analysis; Power Systems; Springer International Publishing: Cham, Switzerland, 2014; ISBN 978-3-319-12957-0. [Google Scholar]
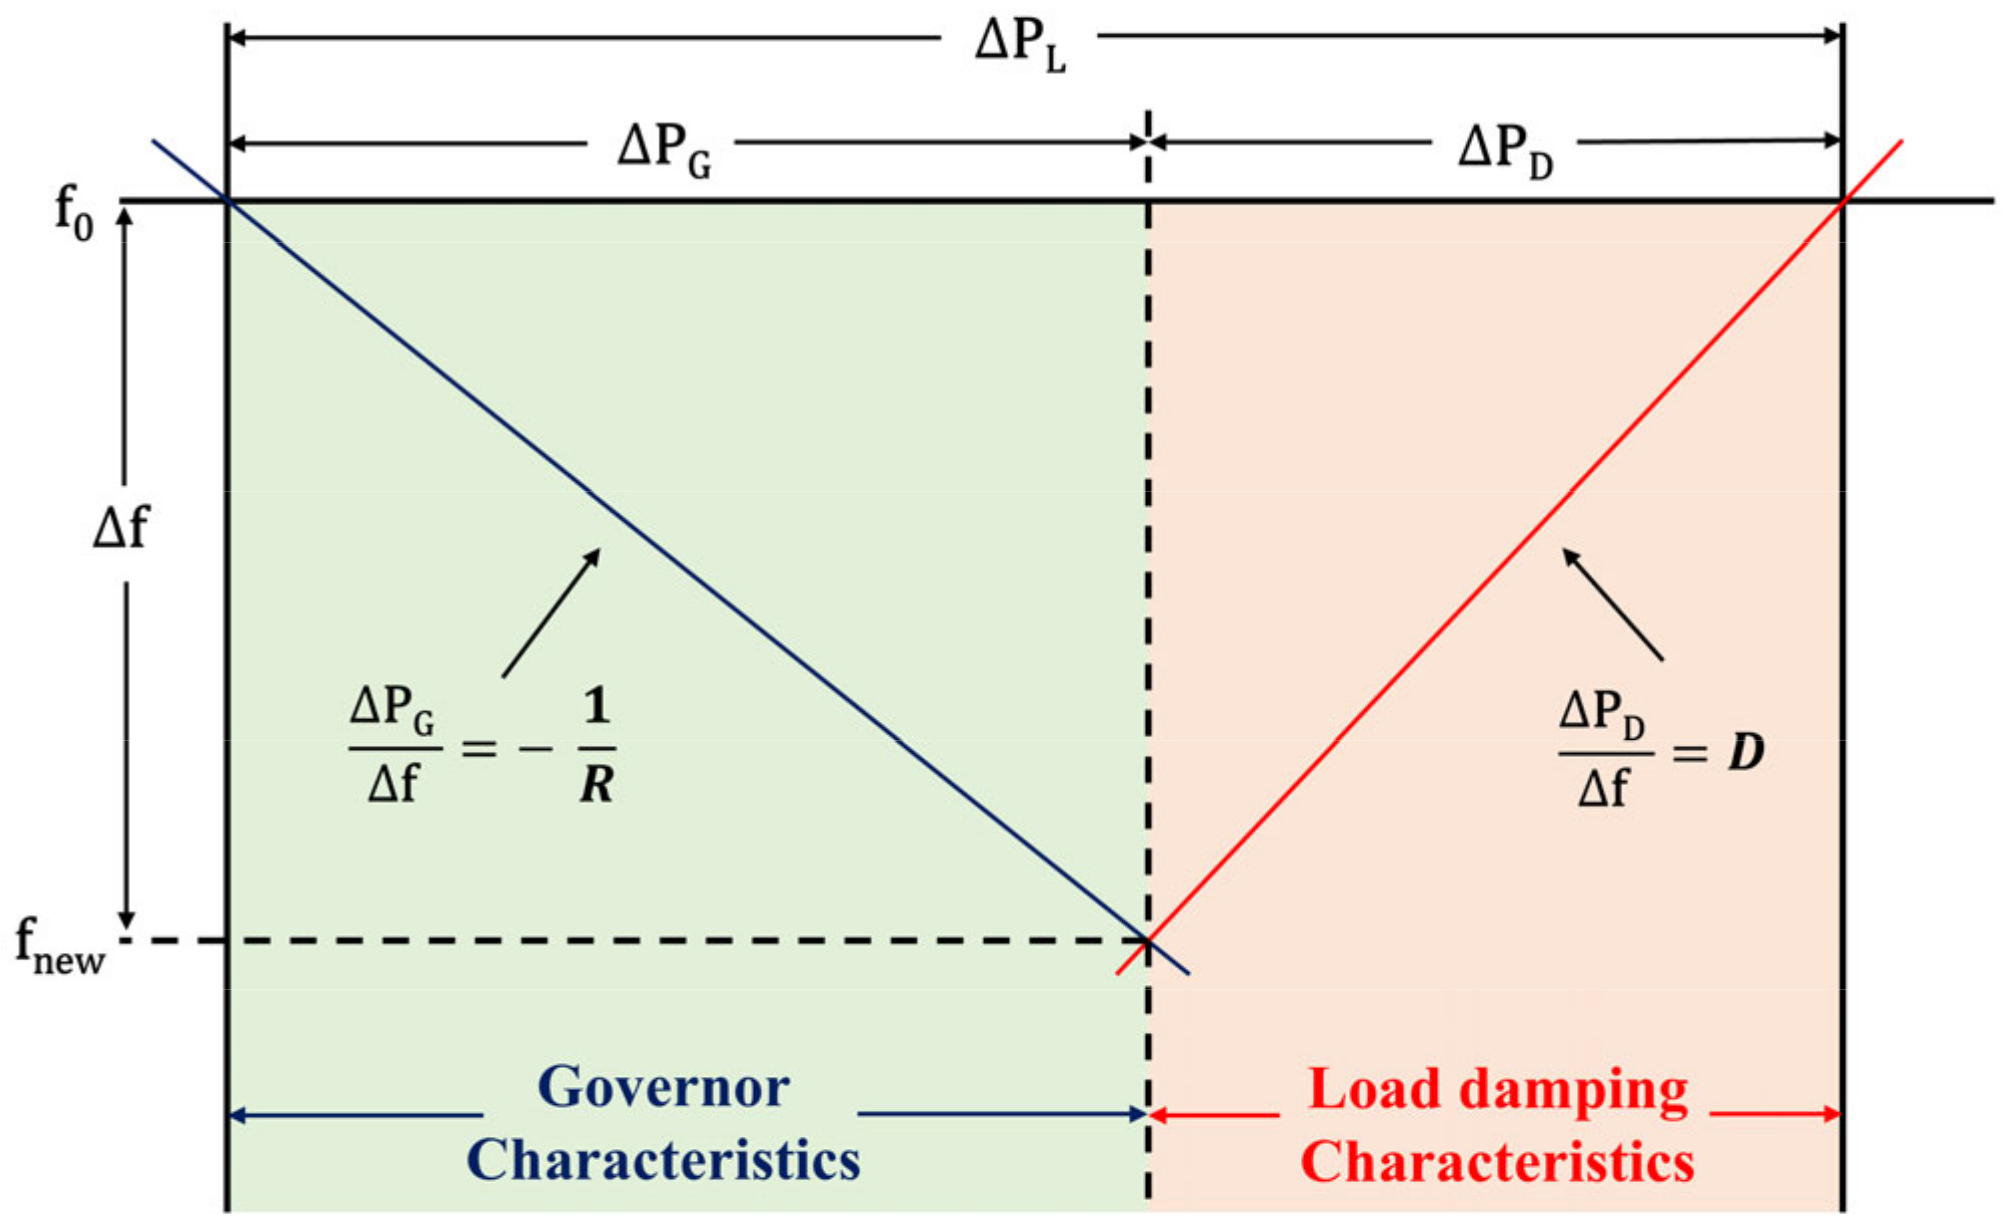
Figure 1. The determination of the system’s frequency.
Electricity 05 00033 g001
Figure 2. BESS model.
Electricity 05 00033 g002
Figure 3. The structure of the BESS frequency controller.
Electricity 05 00033 g003
Figure 4. The proposed methodology to find the optimal location and size of the BESSs.
Electricity 05 00033 g004
Figure 5. Co-simulation of the MATLAB 2021 and DIgSILENT PowerFactory 15.1 software to solve the proposed method.
Electricity 05 00033 g005
Figure 6. The convergence characteristics of the metaheuristic algorithms on the IEEE 9-bus system.
Electricity 05 00033 g006
Figure 7. Frequency response following loss of generator G3.
Electricity 05 00033 g007
Figure 8. Frequency response following loss of generator G2.
Electricity 05 00033 g008
Figure 9. Frequency response following loss of G3—decreased load.
Electricity 05 00033 g009
Figure 10. Frequency response following loss of G3—increased load.
Electricity 05 00033 g010
Figure 11. Frequency response following loss of G3—RES penetration.
Electricity 05 00033 g011
Figure 12. Power and SoC of BESS connected at bus 9.
Electricity 05 00033 g012
Figure 13. The convergence characteristics of the metaheuristic algorithms on the IEEE 39-bus system.
Electricity 05 00033 g013
Figure 14. Frequency response following loss of G 01.
Electricity 05 00033 g014
Figure 15. Frequency response following loss of G 09.
Electricity 05 00033 g015
Figure 16. Frequency response following loss of G 03.
Electricity 05 00033 g016
Figure 17. Frequency response following loss of G 01—decreased load.
Electricity 05 00033 g017
Figure 18. Frequency response following loss of G 01—increased load.
Electricity 05 00033 g018
Figure 19. Frequency response following loss of G 01—RES penetration.
Electricity 05 00033 g019
Figure 20. The power and SoC of the BESS connected at bus 02.
Electricity 05 00033 g020
Table 1. A comparison of the proposed work with related works (√ = considered; × = not considered).
Refs.BESSsMethodRemarks
SizeLocation
[9,18,20]RandomUnoptimized
[10]×Eigenvalue
[12,14]MetaheuristicsIsolated microgrid
[16]×One metaheuristicLocation obtained using sensitivity
[17]×One metaheuristicIsolated microgrid
[19]×Mathematical optimization
[21]Iterative algorithmLocation based on linearization technique
[22]One metaheuristicOnly weak buses are considered for placement
[23]One metaheuristicSimplified model, i.e., two-area model
Proposed methodThree metaheuristicsDetailed model, location, and sizing calculated using no linearization approximation
Table 2. The performance of the metaheuristic algorithms on the IEEE 9-bus system.
Performance MetricsPSOFABA
Mean58.2681 Hz58.1926 Hz58.2723 Hz
Median58.2772 Hz58.2038 Hz58.2760 Hz
Standard deviation0.0268 Hz0.0126 Hz0.0172 Hz
Average computation time40 min 52 s33 min 23 s23 min 24 s
Table 3. Frequency stability indices for different generator contingencies in the IEEE 9-bus system.
ScenarioOutage of G3Outage of G2
fnadir
(Hz)
RoCoF (Hz/s)fnadir
(Hz)
RoCoF (Hz/s)
Proposed method58.27320.824455.69141.7855
SCR method58.24310.834755.66571.7962
Without BESS57.85470.990955.20961.9526
Table 4. Frequency stability indices for various scenarios with the outage of G3.
ScenarioDecreased LoadIncreased LoadRES Penetration
fnadir
(Hz)
RoCoF (Hz/s)fnadir
(Hz)
RoCoF (Hz/s)fnadir
(Hz)
RoCoF (Hz/s)
Proposed method58.22330.844258.32930.805257.69771.1387
SCR method58.19370.854258.29870.812157.65671.1476
Without BESS57.78241.019657.93280.959257.12661.4007
Table 5. The performance of the metaheuristic algorithms on the IEEE 39-bus system.
Performance MetricsPSOFABA
Mean58.3395 Hz58.2239 Hz58.4220 Hz
Median58.3682 Hz58.2250 Hz58.4380 Hz
Standard deviation0.1338 Hz0.0043 Hz0.0345 Hz
Average computation time1 h 14 min2 h 13 min1 h 33 min
Table 6. The frequency stability indices for the different generator contingencies.
ScenarioOutage of G 01Outage of G 09Outage of G 03
fnadir
(Hz)
RoCoF (Hz/s)fnadir
Hz)
RoCoF (Hz/s)fnadir
(Hz)
RoCoF (Hz/s)
Proposed method58.46900.136558.58810.057659.29270.0401
SCR method58.04260.152658.19740.066059.10600.0448
Without BESS55.92570.236556.84400.103457.95800.0724
Table 7. Frequency stability indices for various scenarios on outage of G 01.
ScenarioDecreased LoadIncreased LoadRES Penetration
fnadir
(Hz)
RoCoF (Hz/s)fnadir
(Hz)
RoCoF (Hz/s)fnadir
(Hz)
RoCoF (Hz/s)
Proposed method58.19350.152456.03350.222757.77620.1643
SCR method57.81970.1809--57.62700.1677
Without BESS56.22050.2795--55.02380.2974
Disclaimer/Publisher’s Note: The statements, opinions and data contained in all publications are solely those of the individual author(s) and contributor(s) and not of MDPI and/or the editor(s). MDPI and/or the editor(s) disclaim responsibility for any injury to people or property resulting from any ideas, methods, instructions or products referred to in the content.