1. Introduction
The COVID-19 pandemic reached all countries in 2020, bringing a radical change in the daily routine of millions of people due to the adoption of passive containment measures, like social distancing, mobility restrictions and collective activities closure. Since the pandemic’s start, citizens implementing remote working methods, although some activities (the so-called essential public services) have never been affected by the closures [
1]. In addition, public sectors suffered a lot from the impact of the COVID-19 pandemic, forcing them to adopt remote work systems and remote control of networks and infrastructures, especially during lockdown periods that imposed restrictions on mobility [
2,
3,
4]. Among all public sectors, social distancing and mobility restrictions impacted the drinking water sector with regard to infrastructures [
5], water demand and urban water circle [
6], causing a different temporal distribution of municipal water consumption [
7].
Different studies have demonstrated that lockdown periods that have alternated all over the world resulted in an increase in domestic water demand, a decrease (and a delay) in peak morning, and a reduction in total water consumption due to the closure of commercial and industrial areas and the mobility restrictions imposed [
8,
9], demonstrating that citizen habits have a significant impact on water demand [
10]. Therefore, from the examined technical literature, a clear correlation between the restrictive measures imposed by governments emerges, changes in citizens’ habits and fluctuations in water consumption trends [
11,
12,
13]. This derived from the overall reduction in water consumption and the simultaneous increase in domestic water demand related to lockdown periods in which there was a greater demand for water for personal hygiene, cleaning and sanitation of homes [
14,
15].
Starting from water consumption data, the objective of this work is to identify the most significant consumption variations for five towns characterised by a different socioeconomic structure. Initially, the observed water consumption variations were related exclusively to the pandemic, excluding socio-demographic and climatic factors. Subsequently, consumption trends were analysed in terms of daily volume and reduction of the latter, for the years 2020 and 2021, about the same period as the previous year.
The study shows that the overall reduction in water consumption, highlighted in previous works, is not uniform for all towns but varies according to the socioeconomic structure since centres with a tourist and/or agricultural vocation are less affected by the reduction in water consumption, due to a lower presence of collective activities in the area.
2. Materials and Methods
2.1. Study Area
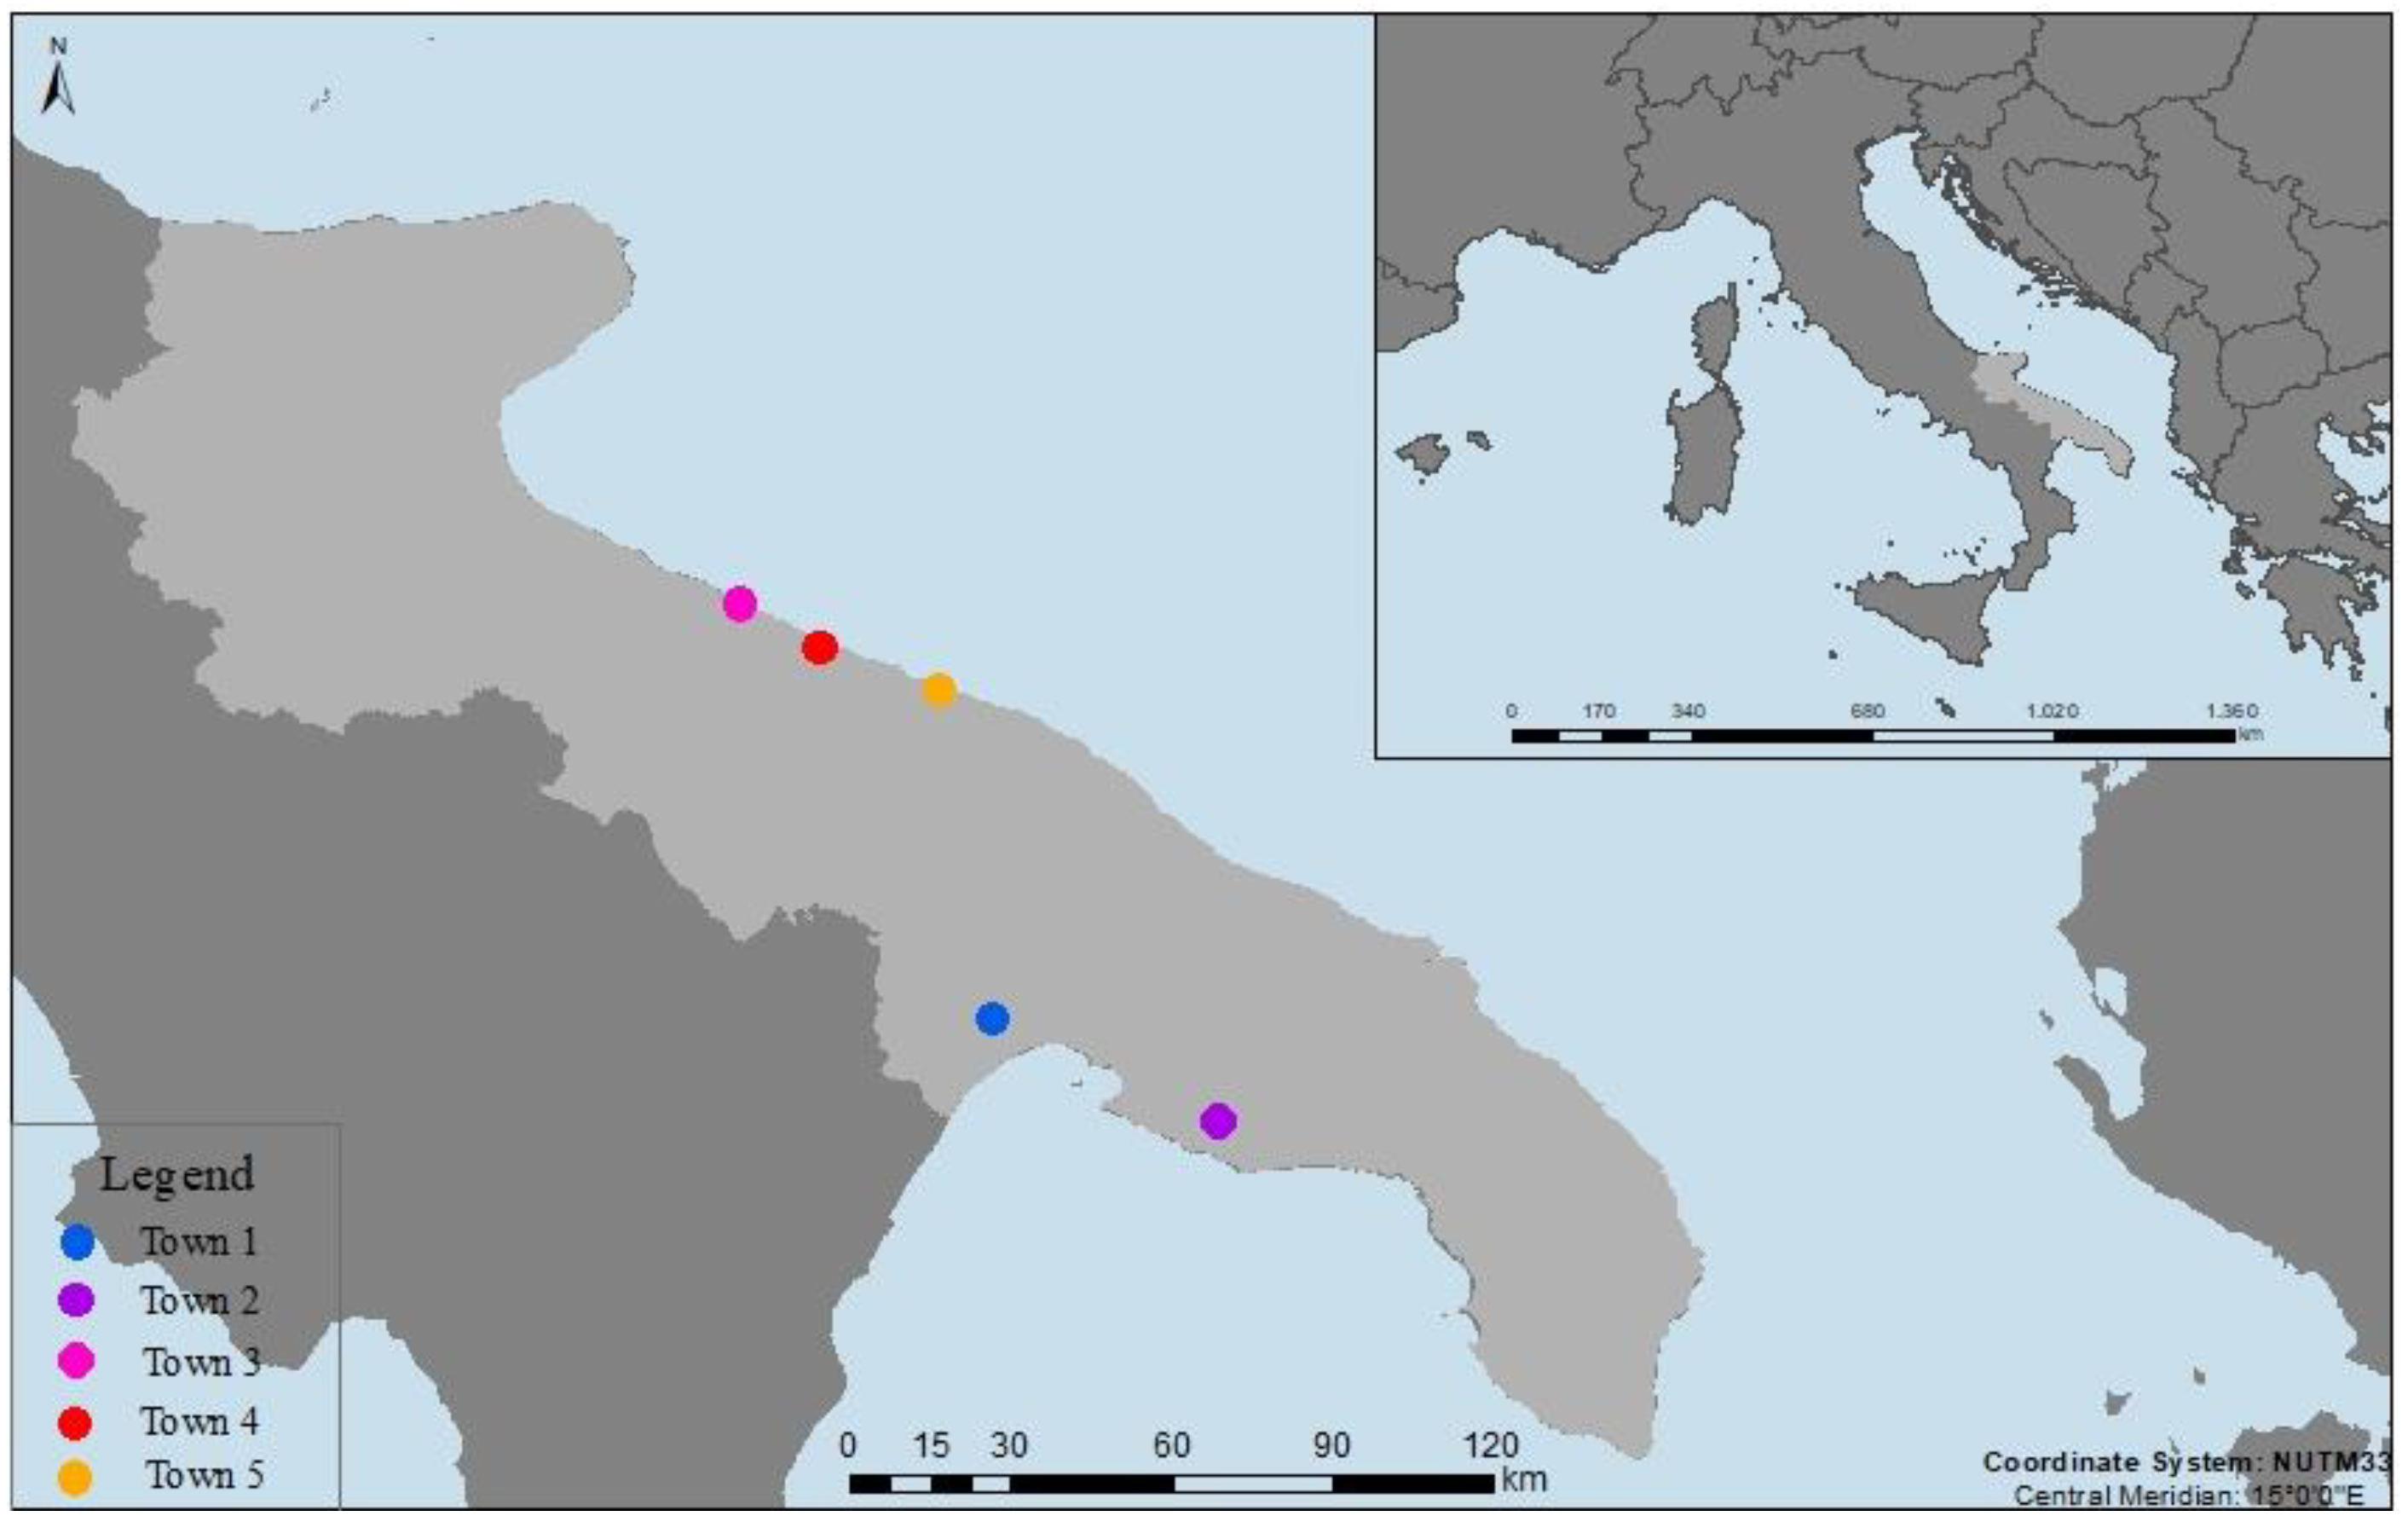
The investigated data refer to five towns in Puglia (Southern Italy): Palagianello, Lizzano, Trani, Molfetta, and Bari (from now on called, respectively, “Town 1”, “Town 2”, “Town 1”, “Town 4”, “Town 5”) characterised by a variable population, from about 7000 inhabitants of Town 1 to about 320.000 inhabitants of Town 5, as shown in the following
Table 1.
The examined towns (
Figure 1) are significantly different from each other, not only in the number of inhabitants but also concerning social and economic factors, which significantly influence the habits and customs of the residents. The choice of such towns was initially linked to the will to analyse cities characterised by a different number of the resident population, but during the examination of data and trends, it was realised that the chosen cities also made it possible to evaluate the impact on water consumption of collective activities, which represent a further discriminating element between them.
Town 5 is the most important city, with a large number of collective activities and the presence of an extensive industrial area; in some cases, both industries and commercial activities are open for 24 h. Town 3 and Town 4 are similar towns, both on the sea with comparable numbers of inhabitants. Concerning social and economic characteristics, contrariwise, Town 4 has two large commercial areas (about 250 shops) on the city’s outskirts, frequented by numerous customers from the entire province. Town 2 and Town 1 are small towns with a predominantly tourist economy that involves peaks in water consumption in the summer months by virtue of an increase in presence. Collective activities, conversely, are limited in number; most of them are closed in the winter months, regardless of the restrictions imposed by COVID-19, and carry out their activity mainly in the period from May to September of each year.
2.2. Dataset
Available data were provided by the integrated water service manager of Puglia, which monitors flows withdrawn from the drinking water network for each inhabited centre served, thanks to remote control systems. Data provided by AQP are recorded every day of the year with a time interval of 10 min; the data used are related to the period from 1 January 2019 to 30 September 2021.
Analysed data are related to the whole water consumption of the investigated towns, including domestic and non-domestic ones.
2.3. Methodology
Collected data were analysed using appropriate modelling, capable of providing water consumption trends and how these are affected by different water uses [
17]. The methodological approach aimed first at excluding any alternative factors to the pandemic that could influence water consumption trends. Specifically, the work was preliminarily oriented to exclude those random factors that could influence trends subsequently shown.
The R programming language has been used to carry out tests involved in the present investigation. R (vers. 4.0.3 for Windows) is a free software environment for statistical computing and graphics. To perform statistical analyses were used rstatix, stats and car libraries in R.
Statistical tests were performed to verify that the null hypothesis (the variations in water consumption are random, and the dataset is not significant for this paper) could be rejected. A conventional
p-value of 0.05 was set; if the calculated
p-value is less than 0.05, the null hypothesis can be rejected. Therefore, the alternative hypothesis is true, i.e., the changes in water consumption are not attributable to random factors but to one or more causes. Statistical analyses were developed by extracting a sample of 288 data from the entire dataset, the first half referring to a day in 2019 (March 25) and the second half referring to a day in 2020 (March 23) for each of the investigated towns. Extracted samples were first subjected to the Shapiro-Wilk W test [
18], which returned
p-values consistently lower than 0.05 so that it is possible to admit that data do not follow a Gaussian distribution. Subsequently, Levene’s test [
19] was carried out to evaluate the possible homogeneity of variances; also, in this case, by
p-values less than 0.05, it was found that the variances are not homogeneous. Thus, a non-parametric test had to be used, opting for the Wilcoxon test of signed ranks [
20]; the latter returned a
p-value lower than 0.05 for all analysed towns, allowing us to state that for each of them, it is possible to reject the null hypothesis and that the variations in water consumption are not due to random factors.
Other factors that could affect water consumption data are socio-demographic and climatic factors. Regarding socio-demographic factors, there have been no significant changes to the water price in the investigated period. In addition, there have been no massive awareness campaigns aimed at rational use of the water resource nor significant variations in the number of inhabitants in the analysed towns; in the latter case, although
Table 1 shows population reductions for all cities, these variations are not significant and not able to influence the obtained results. Concerning climatic factors, we proceeded to analyse the average temperature and precipitation data for the period considered in the study, noting that the values mentioned above show neither anomalies nor significant variations, such as to justify the water consumption values detected.
With a 10 min time interval, available data were aggregated to obtain the average daily volumes. From this, it was possible to elaborate on water consumption trends shown in the following paragraph. The average daily volume was calculated starting from the next relationship:
where
vi,j is the instant volume registered from the remote control system,
i is the number of hours in a day (
i = 1, …, 24),
j is the number of the observations in one hour (
j = 1, …, 6) and
n is the daily number of available data with 10-min interval (
n = 144).
Furthermore, in this paper, the percentage variation of the daily volume (Daily Volume Reduction) has been analysed; this variable was evaluated using the following formula:
where
Vd,k (m
3/d) is the daily volume of the considered
k-day (
k = 1 March; …; 30 April) both in 2020 and in 2021, and
VAJF,2020 is the average daily volume during January and February of 2020 (m
3/d), that represents the pre-pandemic situation. Evaluating this further variable allows us to compare obtained results with previous studies.
3. Results and Discussion
Daily volume data allow us to explore variations in water consumption in 2019 (pre-pandemic period), 2020 and 2021 (pandemic periods), comparing different trends. Analyses were carried out for all towns in
Table 1; nevertheless, only the most significant plots are shown in the following pages, having noted that trends lead to similar and overlapping considerations for some towns.
Trends shown in the next plots (
Figure 2,
Figure 3 and
Figure 4) highlight that, compared with 2019, water consumption is significantly reduced for towns with a more significant inhabitants number (Town 5, Town 4), where the presence of collective activities is the leading cause of water consumption, as opposed to smaller towns (Town 2), in which there are no substantial differences between the pre-pandemic values and the corresponding ones of 2020 and 2021, by an economy with a lower tertiary vocation.
In Town 1, there are no appreciable reductions in water consumption (
Figure 5) by a reduced presence of collective activities and an economy mainly connected to the agricultural and agri-food sectors, never interrupted during the pandemic.
Extending the analysis period to the January-September time interval, trends confirm considerations of previous plots. 2020 and 2021 graphs are almost overlapping due to the persistence of restrictive measures, which, although less tight in 2021, have, in any case, imposed the closure of most of the collective activities.
Figure 6 confirms what has just been asserted.
Figure 7c–e, related to bigger towns, highlight a reduction linked to the restriction measures of 2020 and 2021 compared with water consumption in the pre-pandemic period.
Figure 7b, instead, shows a gradual decrease in 2020 and a general increase in 2021 compared with the same period of the previous year, probably due to fewer restrictions and more collective activities that should be open in 2021. Town 1 (
Figure 7a) is anomolous, a rural town characterised by fluctuation due to work and, above all, school activities; the mobility reduction towards the outside has led to an increase in water consumption.
Therefore, this study shows an overall reversal of water consumption trends compared with the pre-COVID-19 period; the pandemic has led to a reduction in water demand, although not for all uses, and to a more conscious use of the resource, opening de facto a perspective of a more eco-sustainable world [
21].
4. Conclusions
The COVID-19 pandemic in Italy is not over, although the increase in vaccinated people is causing a gradual return to the pre-COVID situation. Nevertheless, some measures introduced during the confinement period (smart working, distance learning, …) have supplanted old customs and habits and determined new life models.
Plots shown in the previous paragraph highlight a general reduction in water demand since the start of the pandemic, stronger where the number of collective activities is higher, unlike what happened in smaller towns. Probably, this means that the cause of water consumption changes is linked to restrictions and socio-psychological conditions created by the pandemic; since the overall observed water consumption decreased while domestic water demand increased, the most significant impact is necessarily linked to collective activities affected by periods of closure and a restart at lower levels than in the pre-pandemic period, by the people mistrust to frequent potential crowded places.
In addition, the analyses of water consumption for three different periods in which Apulia was “red zone”, “orange zone”, and “yellow zone” and the comparison with the same period of 2020 highlight that restrictive measures determine a general reduction in water consumption in lockdown or “red zone” periods, while in the “yellow zone” period when the most of collective activities are allowed, there is a substantial increase, which reaches the maximum values, although not comparable to the pre-pandemic period, to the removal of all citizens mobility restrictions.
Therefore, this study clearly shows that changes in daily habits linked to the COVID-19 pandemic, such as smart working or new users’ lifestyles and hygiene practices, have significantly affected daily water consumption trends; moreover, collective activities are strongly responsible for the water consumption trend, considerably influencing the recorded values through remote control operations.
Author Contributions
All authors contributed equally. All authors have read and agreed to the published version of the manuscript.
Funding
This research received no external funding.
Institutional Review Board Statement
Not applicable.
Informed Consent Statement
Not applicable.
Data Availability Statement
The data are not available for free consultation. They have been made available by the Water Service Manager, AQP, for study and research activities, of which this paper is the result. The dataset can be provided, on request, by the authors.
Acknowledgments
The authors thank AQP for providing technical support and data. In addition, they thank the anonymous reviewers for their valuable comments and suggestions.
Conflicts of Interest
The authors declare no conflict of interest that could have appeared to influence the work reported in this paper.
References
- Haleem, A.; Javaid, M.; Vaishya, R. Effects of COVID-19 pandemic in daily life. Curr. Med. Res. Pract. 2020, 10, 78. [Google Scholar] [CrossRef] [PubMed]
- Bunney, S.; Lawson, E.; Cotterill, S.; Butler, D. Water resource management: Moving from single risk-based management to resilience to multiple stressors. Sustainability 2021, 13, 8609. [Google Scholar] [CrossRef]
- Shrestha, A.; Kazama, S.; Takizawa, S. Influence of Service Levels and COVID-19 on Water Supply Inequalities of Community-Managed Service Providers in Nepal. Water 2021, 13, 1349. [Google Scholar] [CrossRef]
- Falchetta, G.; Noussan, M. The Impact of COVID-19 on Transport Demand, Modal Choices, and Sectoral Energy Consumption in Europe. 2020. Available online: https://www.iaee.org/documents/2020EnergyForumSI.pdf (accessed on 23 February 2022).
- Spearing, L.A.; Thelemaque, N.; Kaminsky, J.A.; Katz, L.E.; Kinney, K.A.; Kirisits, M.J.; Sela, L.; Faust, K.M. Implications of social distancing policies on drinking water infrastructure: An overview of the challenges to and responses of U.S. utilities during the COVID-19 pandemic. ACS EST Water 2020, 1, 888–899. [Google Scholar] [CrossRef]
- Feizizadeh, B.; Omarzadeh, D.; Ronagh, Z.; Sharifi, A.; Blaschke, T.; Lakes, T. A scenario-based approach for urban water management in the context of the COVID-19 pandemic and a case study for the Tabriz metropolitan area, Iran. Sci. Total Environ. 2021, 790, 148272. [Google Scholar] [CrossRef] [PubMed]
- Heidari, H.; Grigg, N.S. Effects of the COVID-19 pandemic on the urban water cycle. Environ. Eng. Res. 2021, 2, 14. [Google Scholar] [CrossRef]
- Alvisi, S.; Franchini, M.; Luciani, C.; Marzola, I. Effects of the COVID-19 lockdown on water consumptions: Northern Italy case study. J. Water Resour. Plan. Manag. 2021, 147, 05021021. [Google Scholar] [CrossRef]
- Balacco, G.; Carbonara, A.; Gioia, A.; Iacobellis, V.; Piccinni, A.F. Evaluation of peak water demand factors in Puglia (Southern Italy). Water 2017, 9, 96. [Google Scholar] [CrossRef] [Green Version]
- Balacco, G.; Totaro, V.; Iacobellis, V.; Manni, A.; Spagnoletta, M.; Piccinni, A.F. Influence of COVID-19 spread on water drinking demand: The case of Puglia Region (Southern Italy). Sustainability 2020, 12, 5919. [Google Scholar] [CrossRef]
- Renukappa, S.; Kamunda, A.; Suresh, S. Impact of COVID-19 on water sector projects and practices. Util. Policy 2021, 70, 101194. [Google Scholar] [CrossRef] [PubMed]
- Lüdtke, D.U.; Luetkemeier, R.; Schneemann, M.; Liehr, S. Increase in daily household water demand during the first wave of the COVID-19 pandemic in Germany. Water 2021, 13, 260. [Google Scholar] [CrossRef]
- Li, D.; Engel, R.A.; Ma, X.; Porse, E.; Kaplan, J.D.; Margulis, S.A.; Lettenmaier, D.P. Stay-at-home orders during the COVID-19 pandemic reduced urban water use. Environ. Sci. Technol. Lett. 2021, 8, 431–436. [Google Scholar] [CrossRef]
- BİRİŞÇİ, E.; Ramazan, Ö.Z. Household water consumption behavior during the COVID-19 pandemic and its relationship with COVID-19 cases. Environ. Sci. Technol. 2021, 4, 391–397. [Google Scholar] [CrossRef]
- Cahill, J.; Hoolohan, C.; Lawson, R.; Browne, A.L. COVID-19 and water demand: A review of literature and research evidence. Wiley Interdiscip. Rev. Water 2022, 9, e1570. [Google Scholar] [CrossRef]
- ISTAT, Istituto Nazionale di Statistica. Available online: https://www.istat.it/it/popolazione-e-famiglie?dati (accessed on 6 December 2021).
- Alvisi, S.; Franchini, M.; Marinelli, A. A stochastic model for representing drinking water demand at residential level. Water Resour. Manag. 2003, 17, 197–222. [Google Scholar] [CrossRef]
- Hanusz, Z.; Tarasinska, J.; Zielinski, W. Shapiro–Wilk test with known mean. Revstat Stat. J. 2016, 14, 89–100. [Google Scholar]
- Anderson, M.J. Distance-Based Tests for Homogeneity of Multivariate Dispersions. Biometrics 2006, 62, 245–253. [Google Scholar] [CrossRef] [PubMed]
- Woolson, R.F. Wilcoxon Signed-Rank Test. Encycl. Biostat. 2008. [Google Scholar] [CrossRef]
- Zambrano-Monserrate, M.A.; Ruano, M.A.; Sanchez-Alcalde, L. Indirect Effects of COVID-19 on the environment. Sci. Total Environ. 2020, 728, 138813. [Google Scholar] [CrossRef]
| Publisher’s Note: MDPI stays neutral with regard to jurisdictional claims in published maps and institutional affiliations. |
© 2022 by the authors. Licensee MDPI, Basel, Switzerland. This article is an open access article distributed under the terms and conditions of the Creative Commons Attribution (CC BY) license (https://creativecommons.org/licenses/by/4.0/).


 ,
, 


