
Long-Term Spatial and Temporal Rainfall Trends over Italy †


Abstract
:1. Introduction
2. Data and Methods
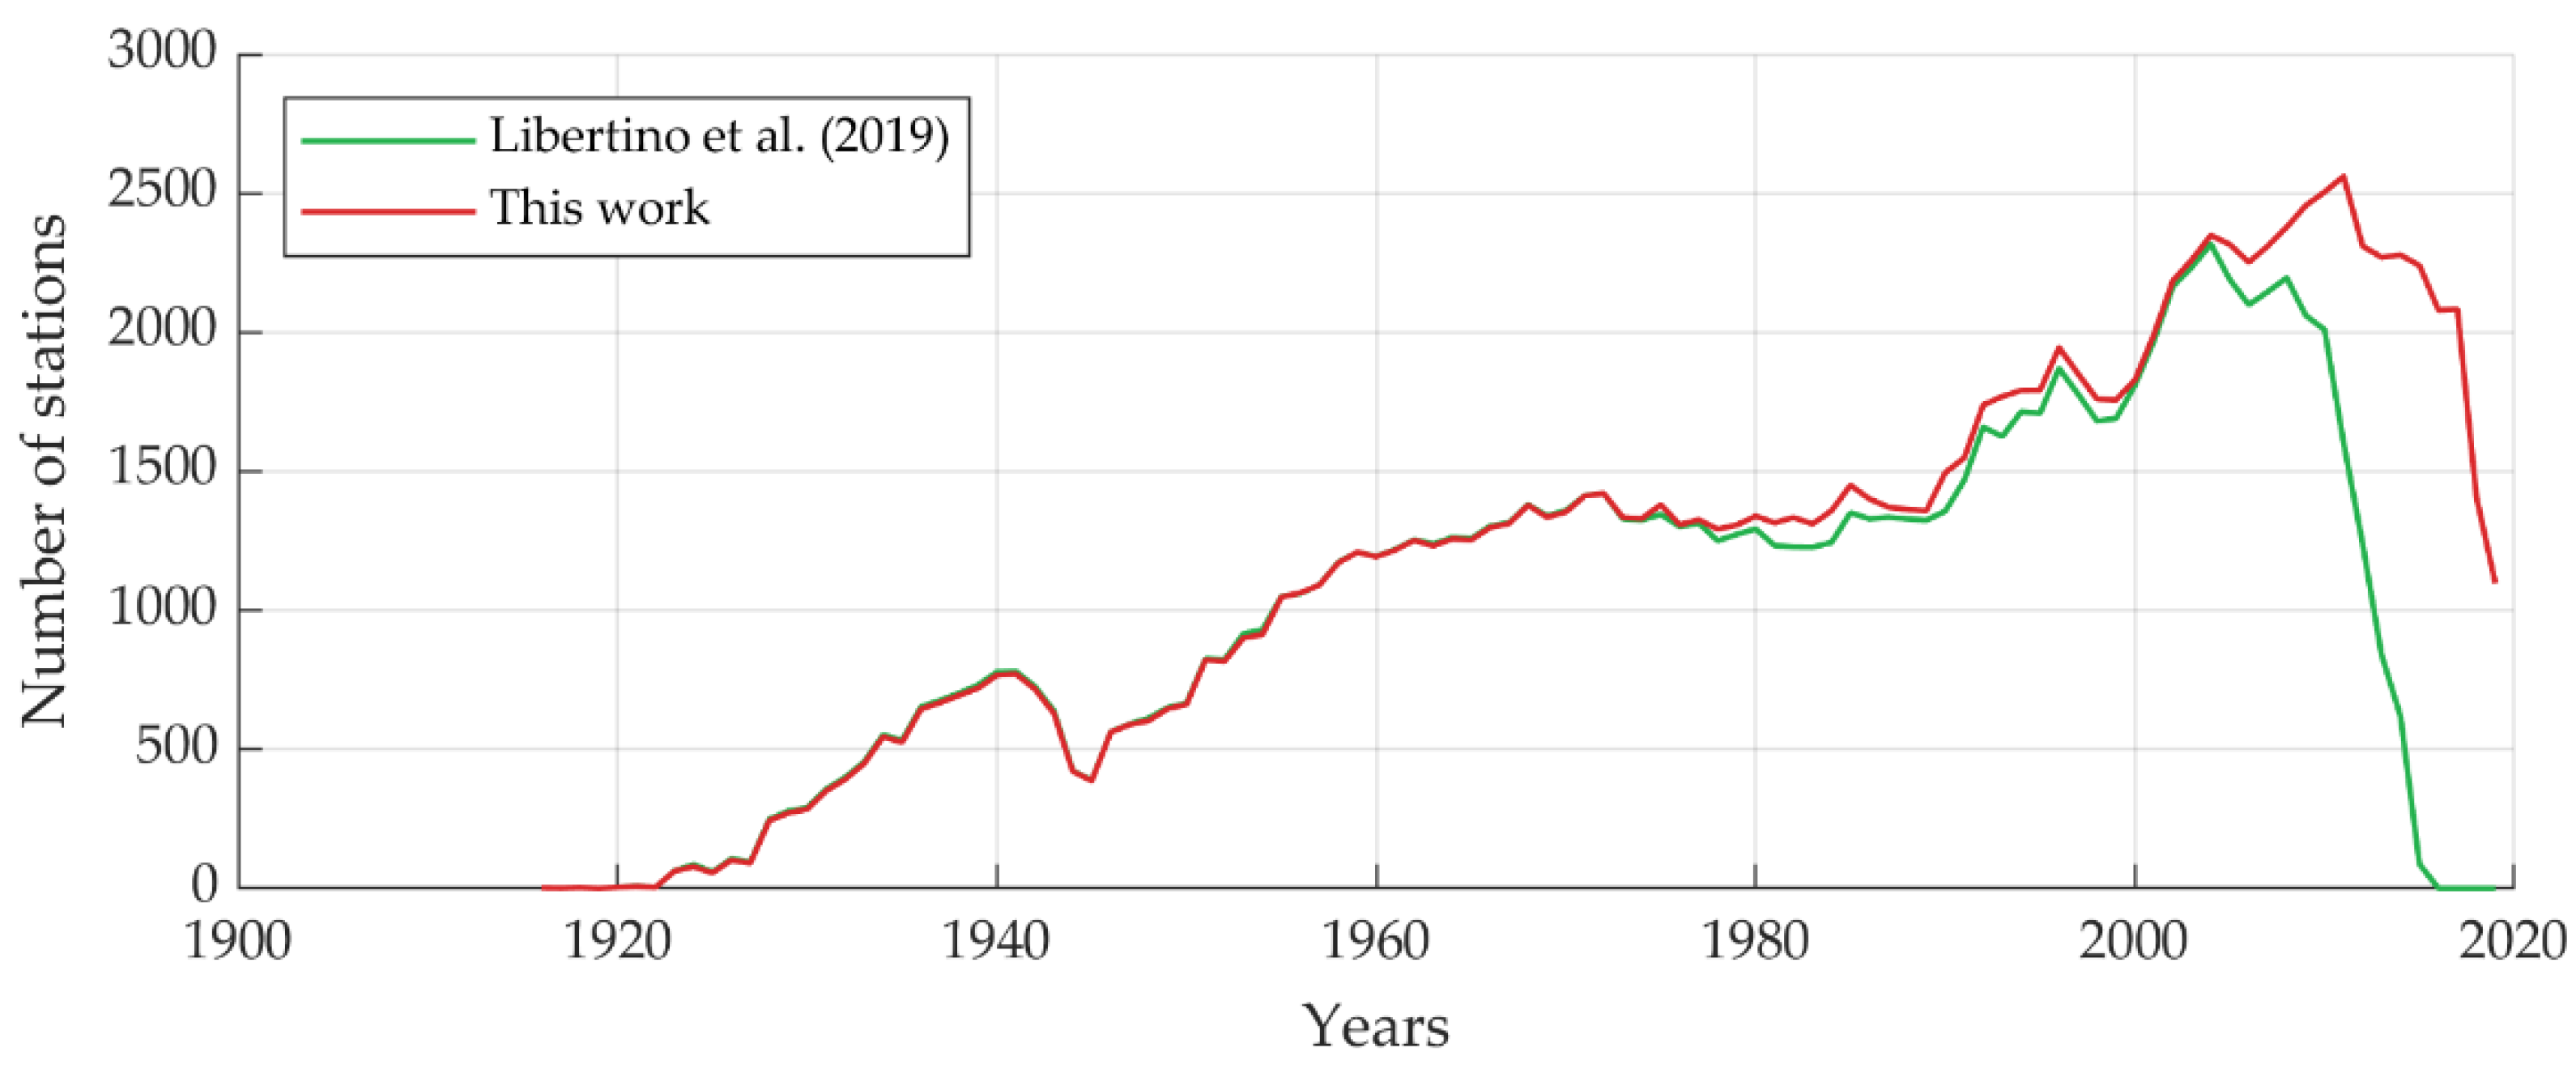
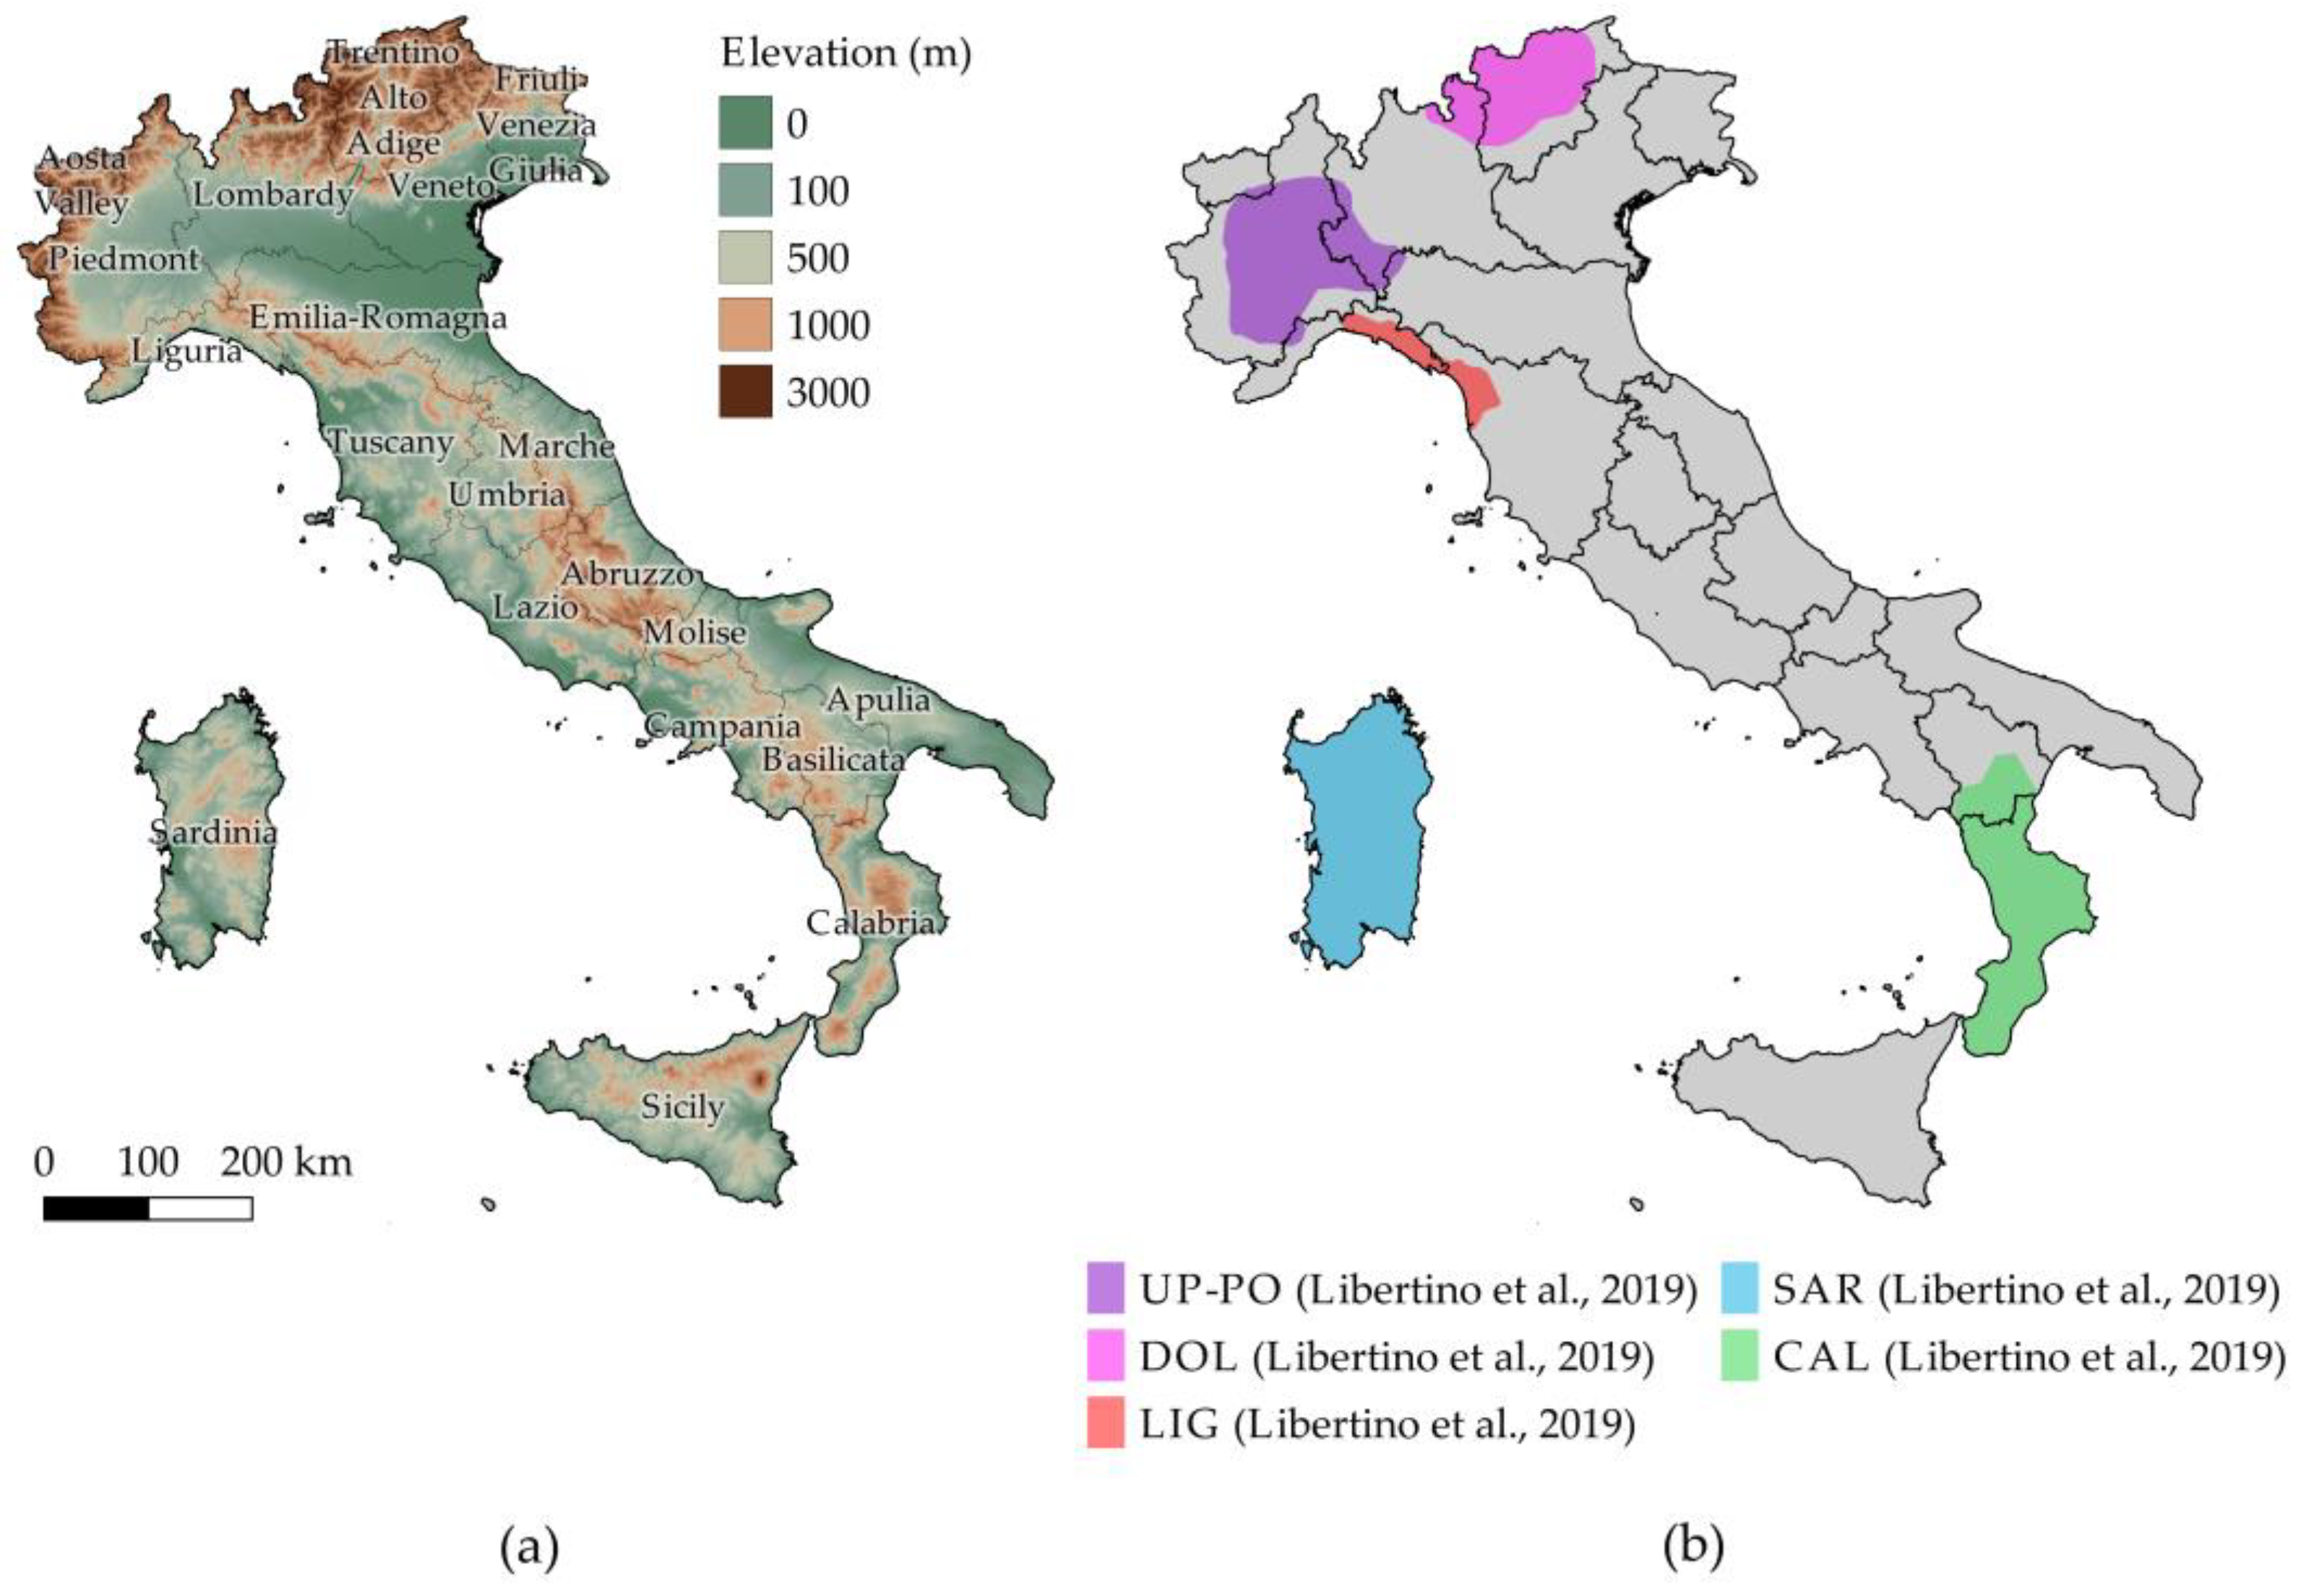
2.1. Rainfall Data
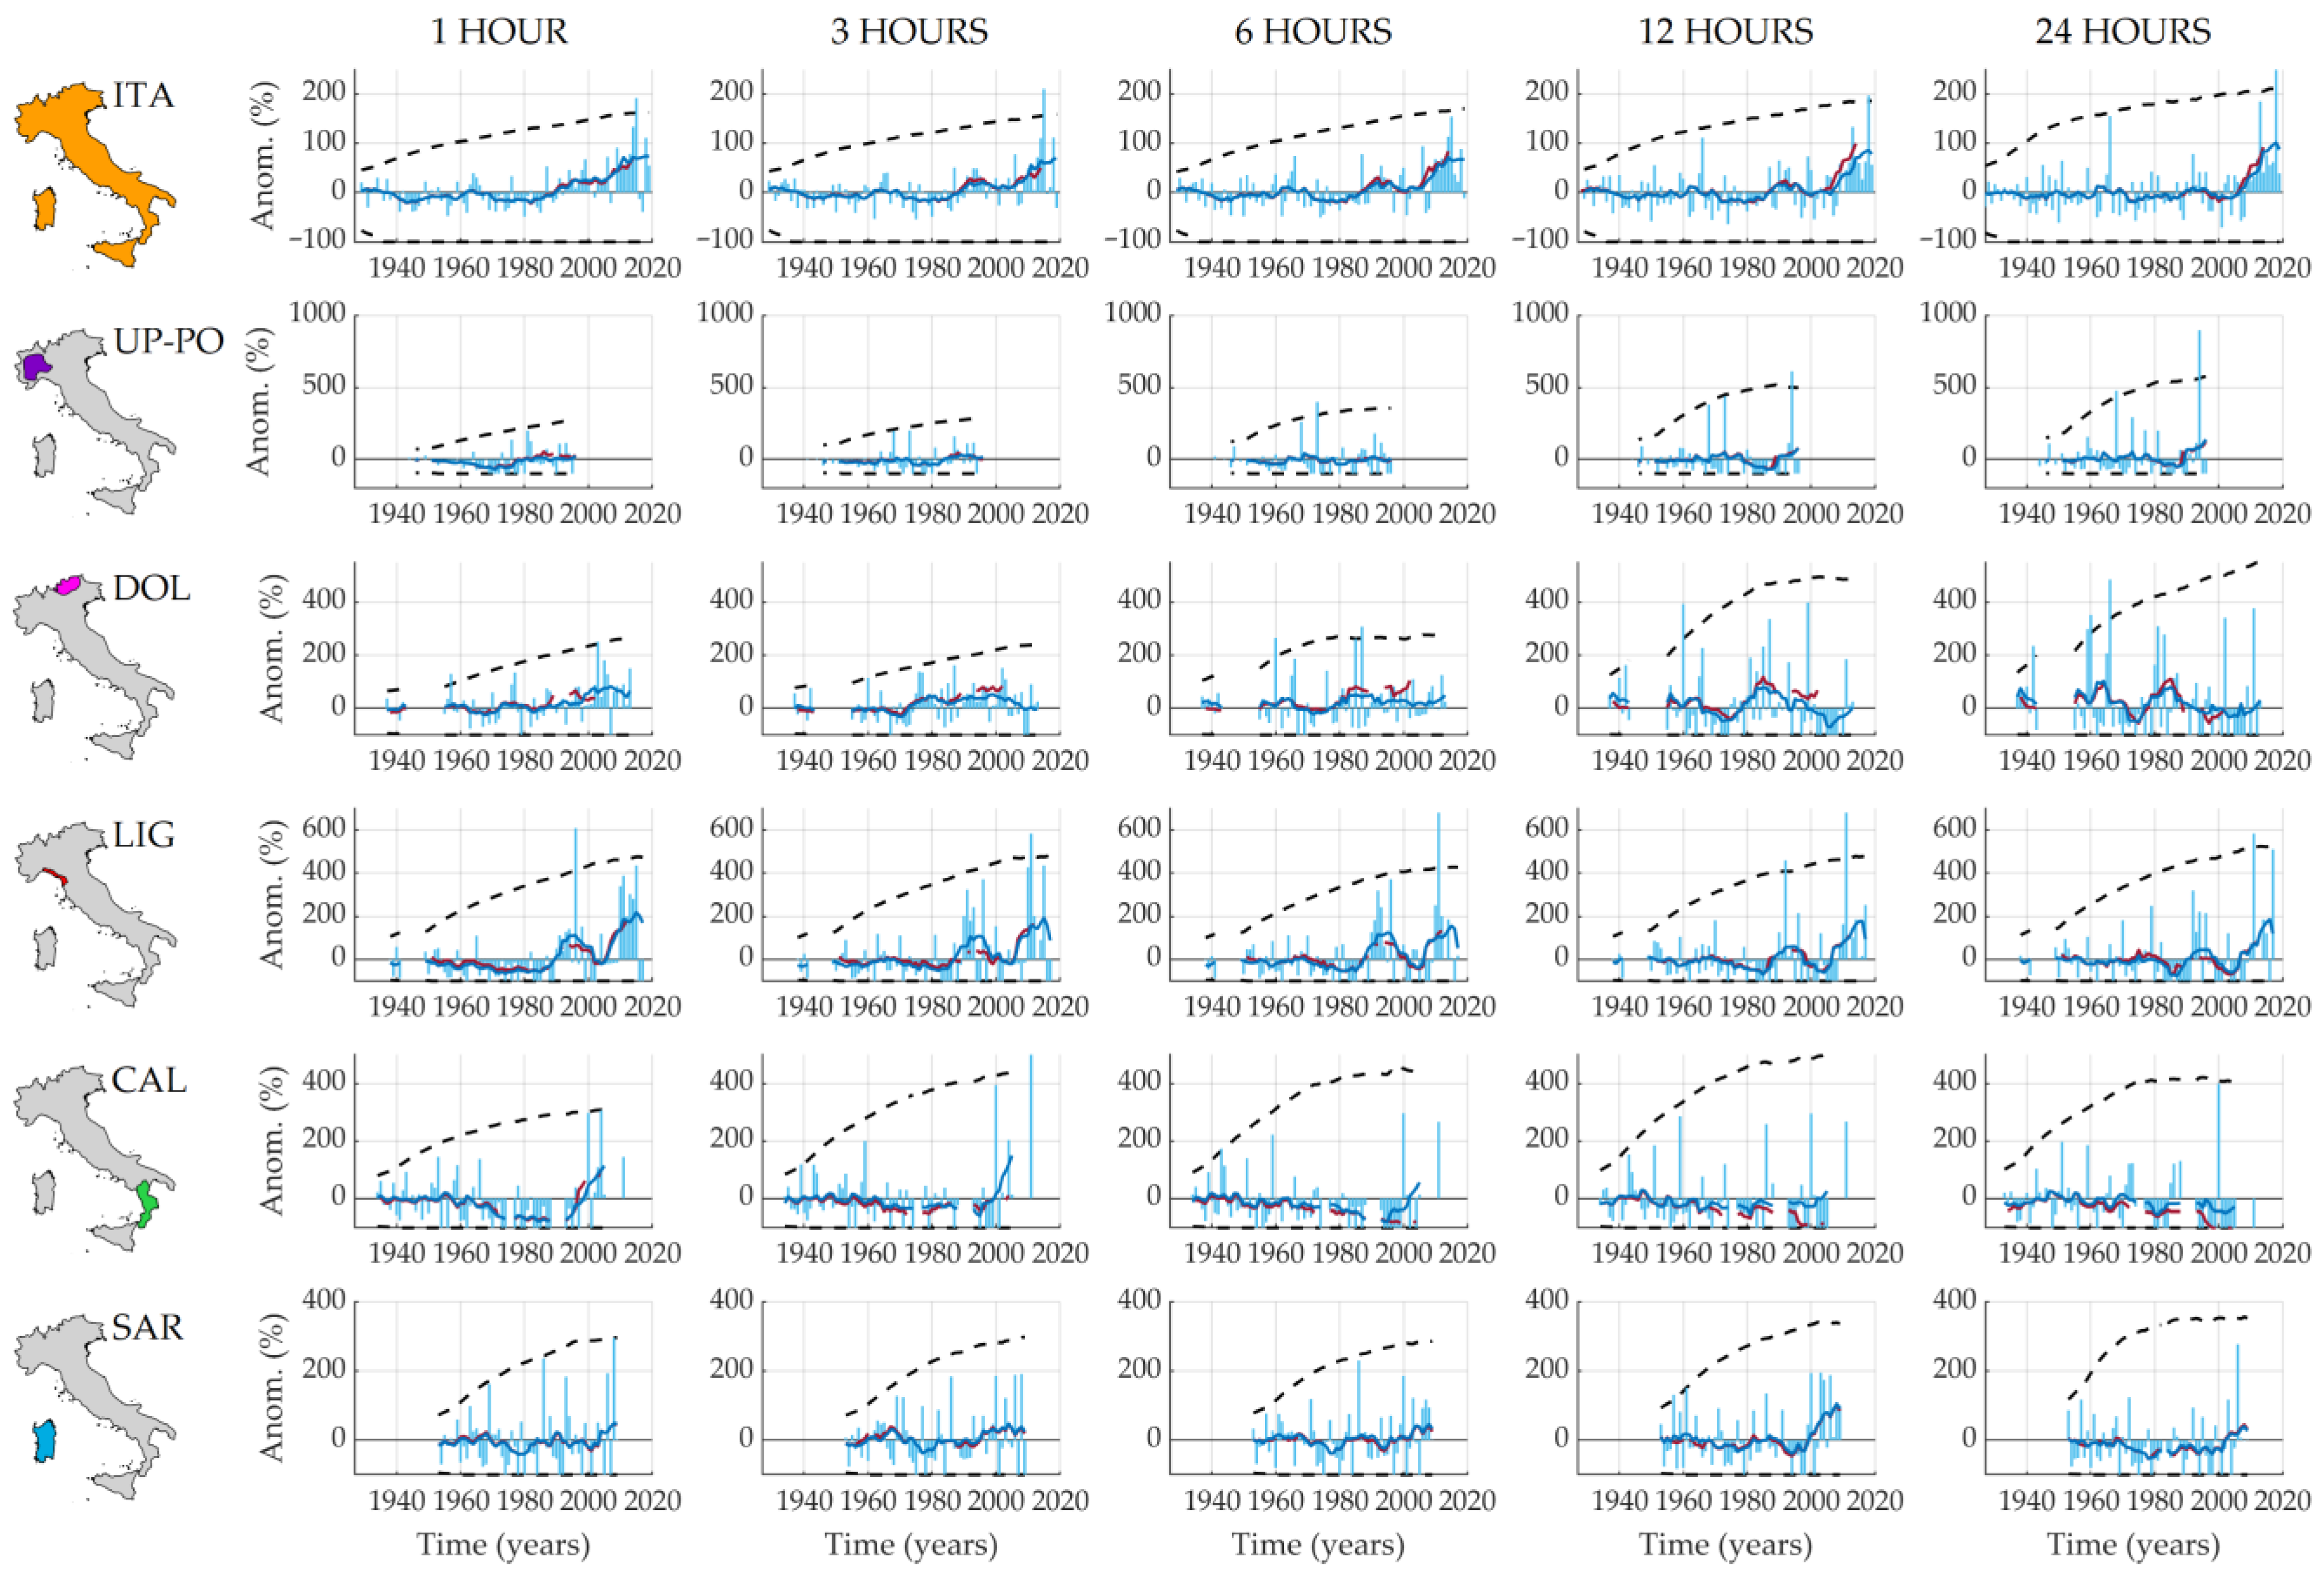
2.2. Record-Breaking (RB) Analysis
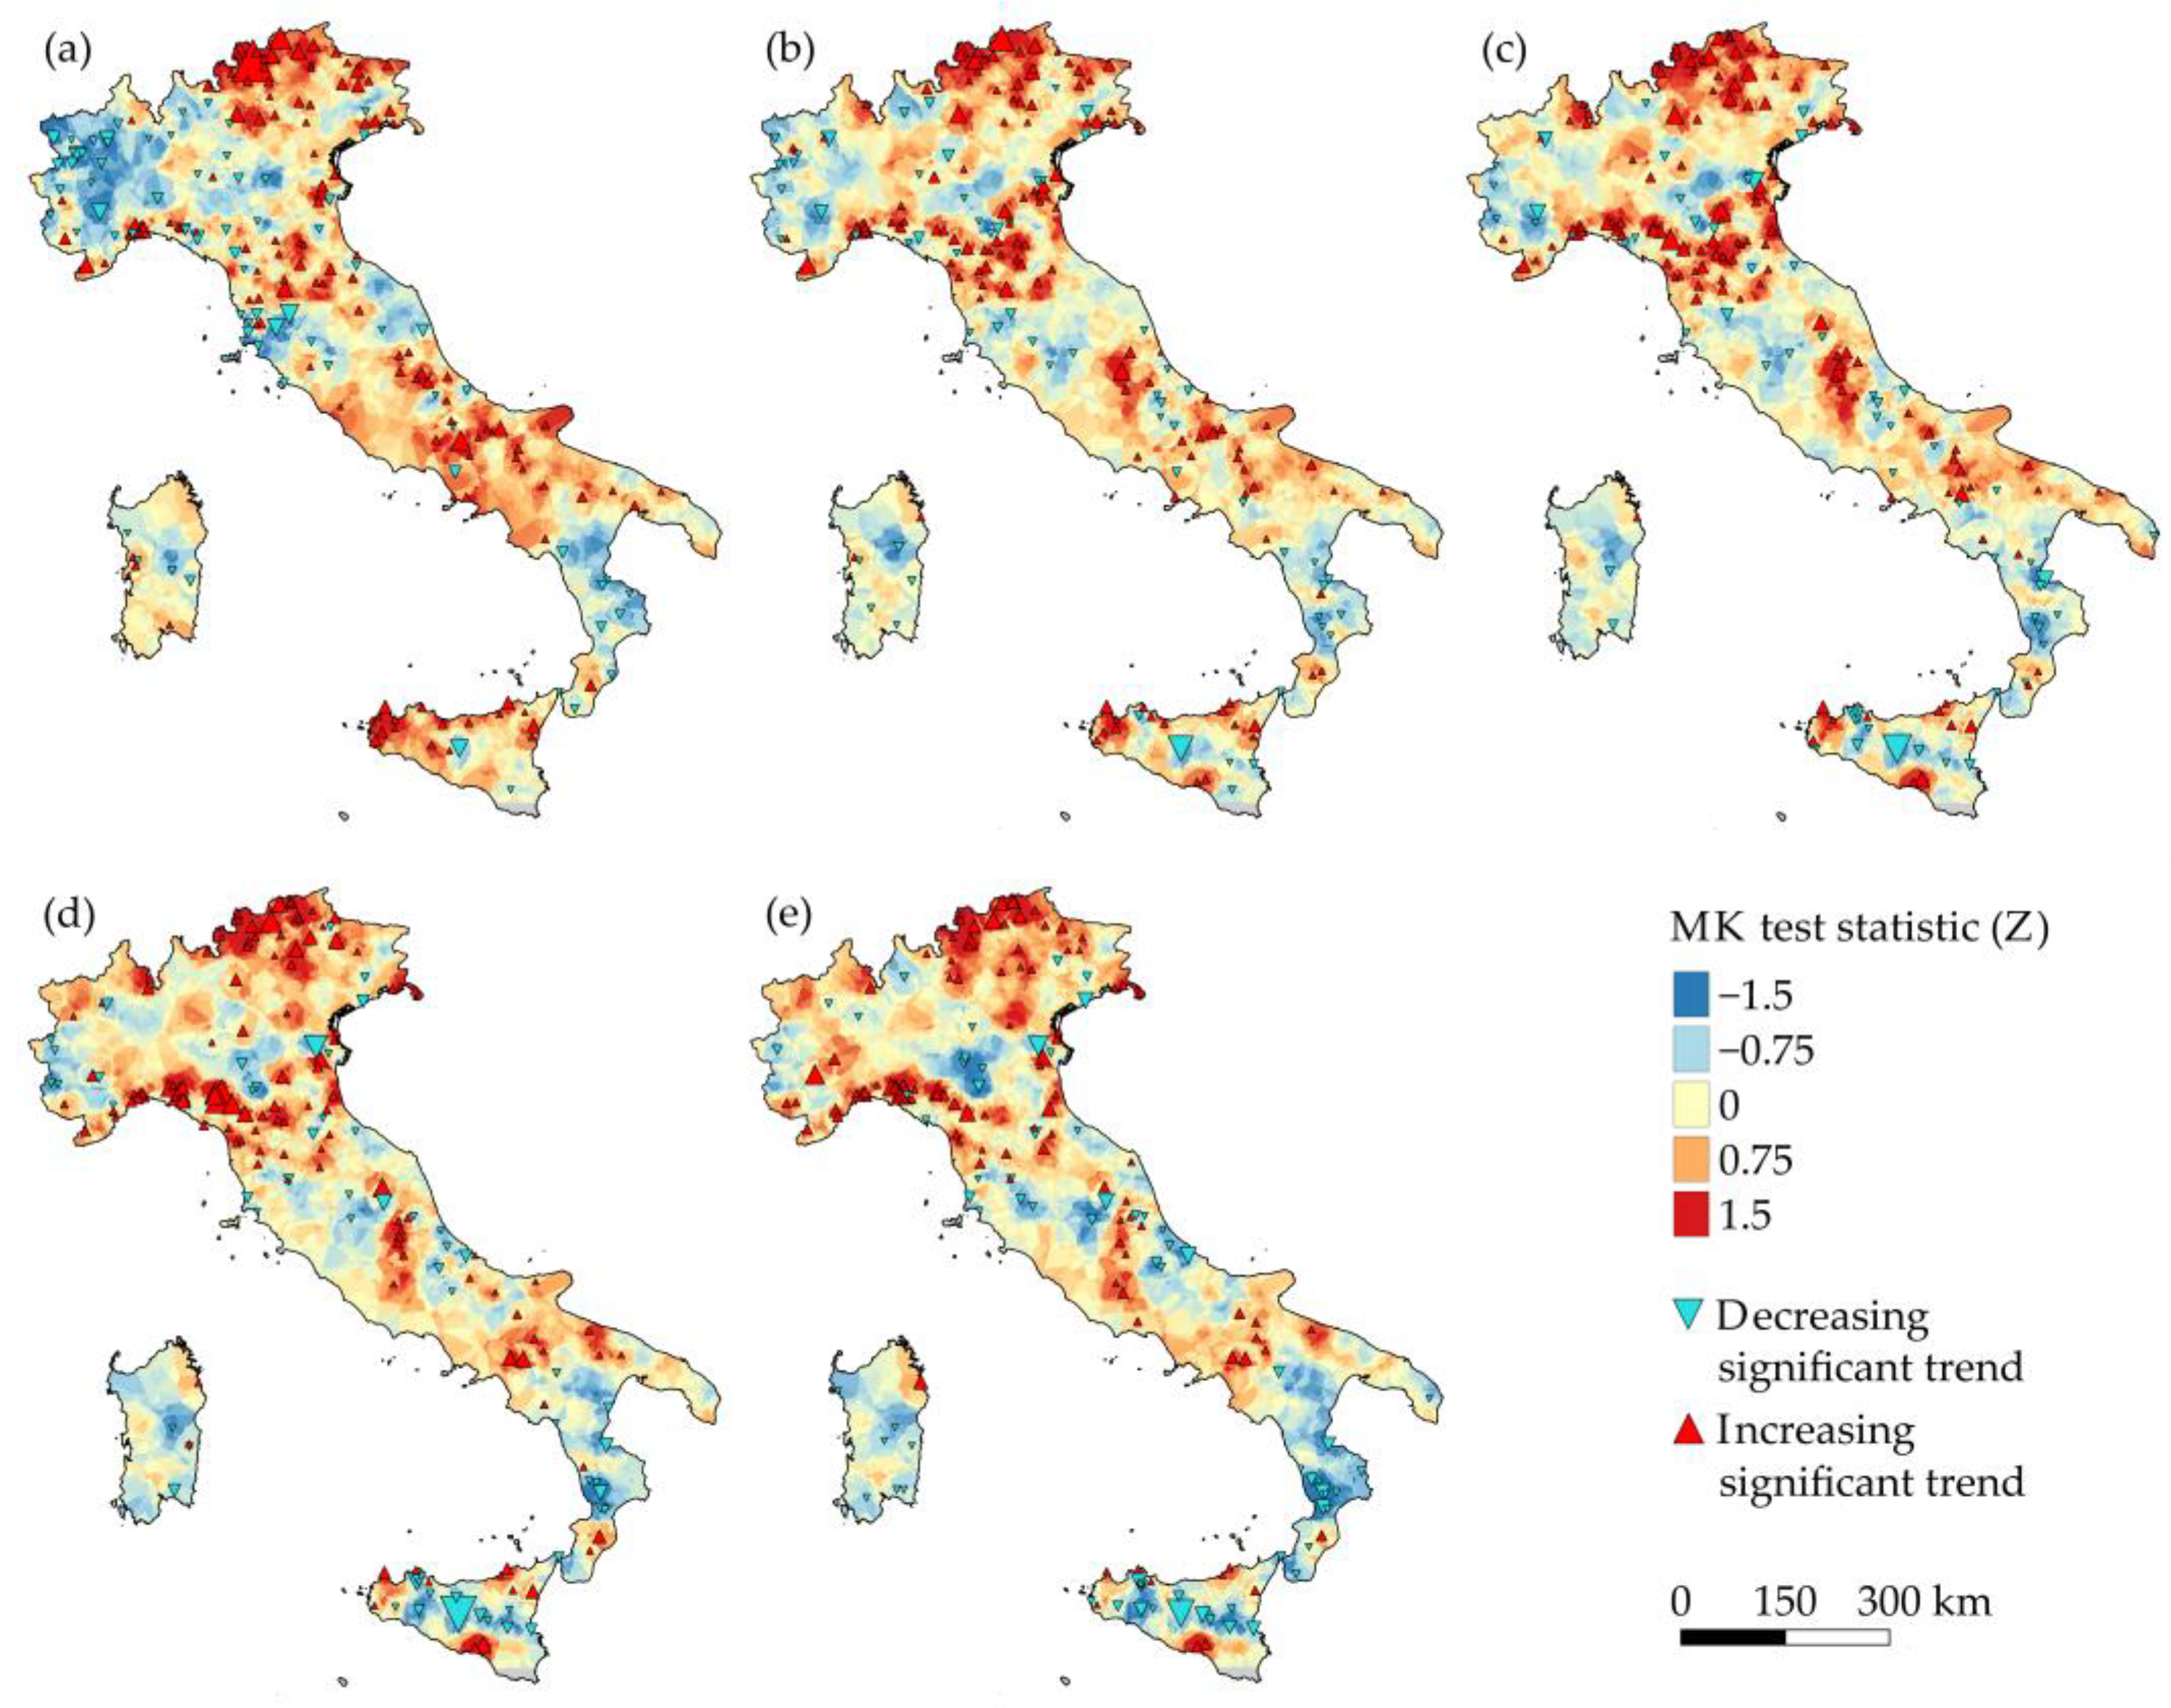
2.3. Mann-Kendall Test and Sen’s Slope Estimator
3. National and Regional Trend Analyses
4. Conclusions
Author Contributions
Funding
Institutional Review Board Statement
Informed Consent Statement
Data Availability Statement
Acknowledgments
Conflicts of Interest
References
- Mazzoglio, P.; Butera, I.; Claps, P. I2-RED: A massive update and quality control of the Italian annual extreme rainfall dataset. Water 2020, 12, 3308. [Google Scholar] [CrossRef]
- Libertino, A.; Ganora, D.; Claps, P. Technical note: Space–time analysis of rainfall extremes in Italy: Clues from a reconciled dataset. Hydrol. Earth Syst. Sci. 2018, 22, 2705–2715. [Google Scholar] [CrossRef] [Green Version]
- Libertino, A.; Ganora, D.; Claps, P. Evidence for increasing rainfall extremes remains elusive at large spatial scales: The case of Italy. Geophys. Res. Lett. 2019, 46, 7437–7446. [Google Scholar] [CrossRef]
- Lehmann, J.; Coumou, D.; Frieler, K. Increased record-breaking precipitation events under global warming. Clim. Chang. 2015, 132, 501–515. [Google Scholar] [CrossRef]
- Glick, N. Breaking records and breaking boards. Am. Math. Mon. 1978, 85, 2–26. [Google Scholar] [CrossRef]
- Mann, H.B. Nonparametric tests against trend. Econometrica 1945, 13, 245–259. [Google Scholar] [CrossRef]
- van Belle, G.; Hughes, J.P. Nonparametric tests for trend in water quality. Water Resour. Res. 1984, 20, 127–136. [Google Scholar] [CrossRef]
- Cesarini, L.; Martina, M. Are the short and intense precipitations in North of Italy affected by a significant trend? In Proceedings of the CLIMRISK2019, Trento, Italy, 23–25 October 2019. [Google Scholar]
- Uboldi, F.; Lussana, C. Evidence of non-stationarity in a local climatology of rainfall extremes in northern Italy. Int. J. Clim. 2018, 38, 506–516. [Google Scholar] [CrossRef]
- Persiano, S.; Ferri, E.; Antolini, G.; Domeneghetti, A.; Pavan, V.; Castellarin, A. Changes in seasonality and magnitude of sub-daily rainfall extremes in Emilia-Romagna (Italy) and potential influence on regional rainfall frequency estimation. J. Hydrol. Reg. Stud. 2020, 32, 100751. [Google Scholar] [CrossRef]
- Crisci, A.; Gozzini, B.; Meneguzzo, F.; Pagliara, S.; Maracchi, G. Extreme rainfall in a changing climate: Regional analysis and hydrological implications in Tuscany. Hydrol. Process. 2002, 16, 1261–1274. [Google Scholar] [CrossRef]
- Cifrodelli, M.; Corradini, C.; Morbidelli, R.; Saltalippi, C.; Flammini, A. The influence of climate change on heavy rainfalls in Central Italy. Procedia Earth Planet. Sci. 2015, 15, 694–701. [Google Scholar] [CrossRef] [Green Version]
- Bonaccorso, B.; Cancelliere, A.; Rossi, G. Detecting trends of extreme rainfall series in Sicily. Adv. Geosci. 2005, 2, 7–11. [Google Scholar] [CrossRef] [Green Version]
- Arnone, E.; Pumo, D.; Viola, F.; Noto, L.V.; La Loggia, G. Rainfall statistics changes in Sicily. Hydrol. Earth Syst. Sci. 2013, 17, 2449–2458. [Google Scholar] [CrossRef] [Green Version]
- Treppiedi, D.; Cipolla, G.; Francipane, A.; Noto, L.V. Detecting precipitation trend using a multiscale approach based on quantile regression over a Mediterranean area. Int. J. Clim. 2021, 41, 5938–5955. [Google Scholar] [CrossRef]


| Region | 1 h | 3 h | 6 h | 12 h | 24 h |
|---|---|---|---|---|---|
| ITA | 0.014 * | 0.024 * | 0.029 * | 0.033 * | 0.024 * |
| UP-PO | −0.093 | −0.042 | −0.033 | −0.024 * | 0.010 |
| DOL | 0.053 * | 0.069 * | 0.080 | 0.115 * | 0.152 |
| LIG | 0.017 * | 0.043 | 0.071 * | 0.106 * | 0.113 |
| CAL | −0.028 * | −0.035 | −0.050 * | −0.083 * | −0.200 * |
| SAR | 0 * | −0.021 | −0.036 | −0.050 * | −0.058 |
Publisher’s Note: MDPI stays neutral with regard to jurisdictional claims in published maps and institutional affiliations. |
© 2022 by the authors. Licensee MDPI, Basel, Switzerland. This article is an open access article distributed under the terms and conditions of the Creative Commons Attribution (CC BY) license (https://creativecommons.org/licenses/by/4.0/).
Share and Cite
Mazzoglio, P.; Ganora, D.; Claps, P. Long-Term Spatial and Temporal Rainfall Trends over Italy. Environ. Sci. Proc. 2022, 21, 28. https://doi.org/10.3390/environsciproc2022021028
Mazzoglio P, Ganora D, Claps P. Long-Term Spatial and Temporal Rainfall Trends over Italy. Environmental Sciences Proceedings. 2022; 21(1):28. https://doi.org/10.3390/environsciproc2022021028
Chicago/Turabian StyleMazzoglio, Paola, Daniele Ganora, and Pierluigi Claps. 2022. "Long-Term Spatial and Temporal Rainfall Trends over Italy" Environmental Sciences Proceedings 21, no. 1: 28. https://doi.org/10.3390/environsciproc2022021028