1. Introduction
In line with the Paris Agreement on Climate, the European Union has set an ambitious target to reduce emissions in the European Union by 55% between 1990 and 2030 and reach climate neutrality by 2050 [
1]. Cities are key to the low-carbon transition, as they account for 70% of greenhouse gas (GHG) emissions and the urban population continues to increase [
2,
3,
4]. In this context, city policymakers must monitor the quantity of GHG emitted on their territory, with timeliness and accuracy enabling reactivity and the adjustment of climate policies before the target years of 2030 and 2050.
Typically, cities are accountable for the task of building GHG emission inventories following guidance from international and national protocols, e.g., International Council for Local Environmental Initiatives (ICLEI) internationally, and Pôle National des Inventaires Territoriaux (PCIT) in France [
5,
6]. However, these self-reported inventories (SRIs) are often accessible to city stakeholders with a latency that lags in real-time by several years and is prone to large uncertainties, e.g., [
7].
The quantification of GHG emissions from atmospheric measurements offers complementary accounting to the traditional bottom-up approach, and scientific capabilities are evolving rapidly [
8,
9]. A recent study leveraged satellite data to quantify large releases of methane in the atmosphere from oil and gas companies, they found that ultra-emitters from the oil & gas industry represent as much as 12% of global methane emissions [
10]. The quantification of CO
2 emissions at the city scale from satellite observations is still at a research stage [
11], but the quantification of CO
2 emissions from high-frequency atmospheric GHG measurements at well-chosen station locations has proven to be scientifically applicable on a sub-annual city-level scale, e.g., [
12,
13].
Origins.earth, a SUEZ company, and its partners have leveraged the proven state-of-the-art scientific research to develop and deploy a solution delivering high-quality emission data to city stakeholders in less than one month. This solution, called MétéoCarbone®, offers an innovative service to cities and local governments to accelerate the implementation of the low-carbon transition.
Here, we report on the functionalities and scientific basis behind MétéoCarbone®. We present the robustness of the technology and evaluate its applicability for informing good decisions and driving sustainable policies, via learnings from a pilot project in the Paris area that fostered the deployment of the solution in partnership with scientific partners and city stakeholders. We then introduce its potential for expansion into other mature markets with a particular focus on Italy, to support its leaders with modern climate decision-making tools and accelerate actions to reach global low-carbon targets.
2. Presentation of the Solution
The MétéoCarbone
® solution is built upon hardware and software science and technology, delivered to the end-user via a user-friendly digital interface, CarboneDeck
®. Both the MétéoCarbone
® solution and the CarboneDeck
® digital interface are developed by Origins.earth. In this section, we first present the main views and functionalities of the CarboneDeck
® (
Section 2.1), and the science and technology powering the platform (
Section 2.2).
2.1. The CarboneDeck® Digital Platform
CarboneDeck® is a digital platform that collects the results of the space/time-resolved GHG emission maps and processes the data to deliver high-quality information in a user-friendly format. The targeted audiences are technical services in the local authority’s administrations, as well as decision-makers in local governments.
CarboneDeck
® acquires monthly the outcomes of the atmospheric inversion system, calibrated upon the CO
2 concentration measures, as a space/time-resolved emission map for seven activity sectors from 2018 until the previous month. The seven activity sectors are defined following the official nomenclature in France for reporting emissions (road transportation, off-road transportation, residential, tertiary, industry, energy, and waste) [
14]. CarboneDeck
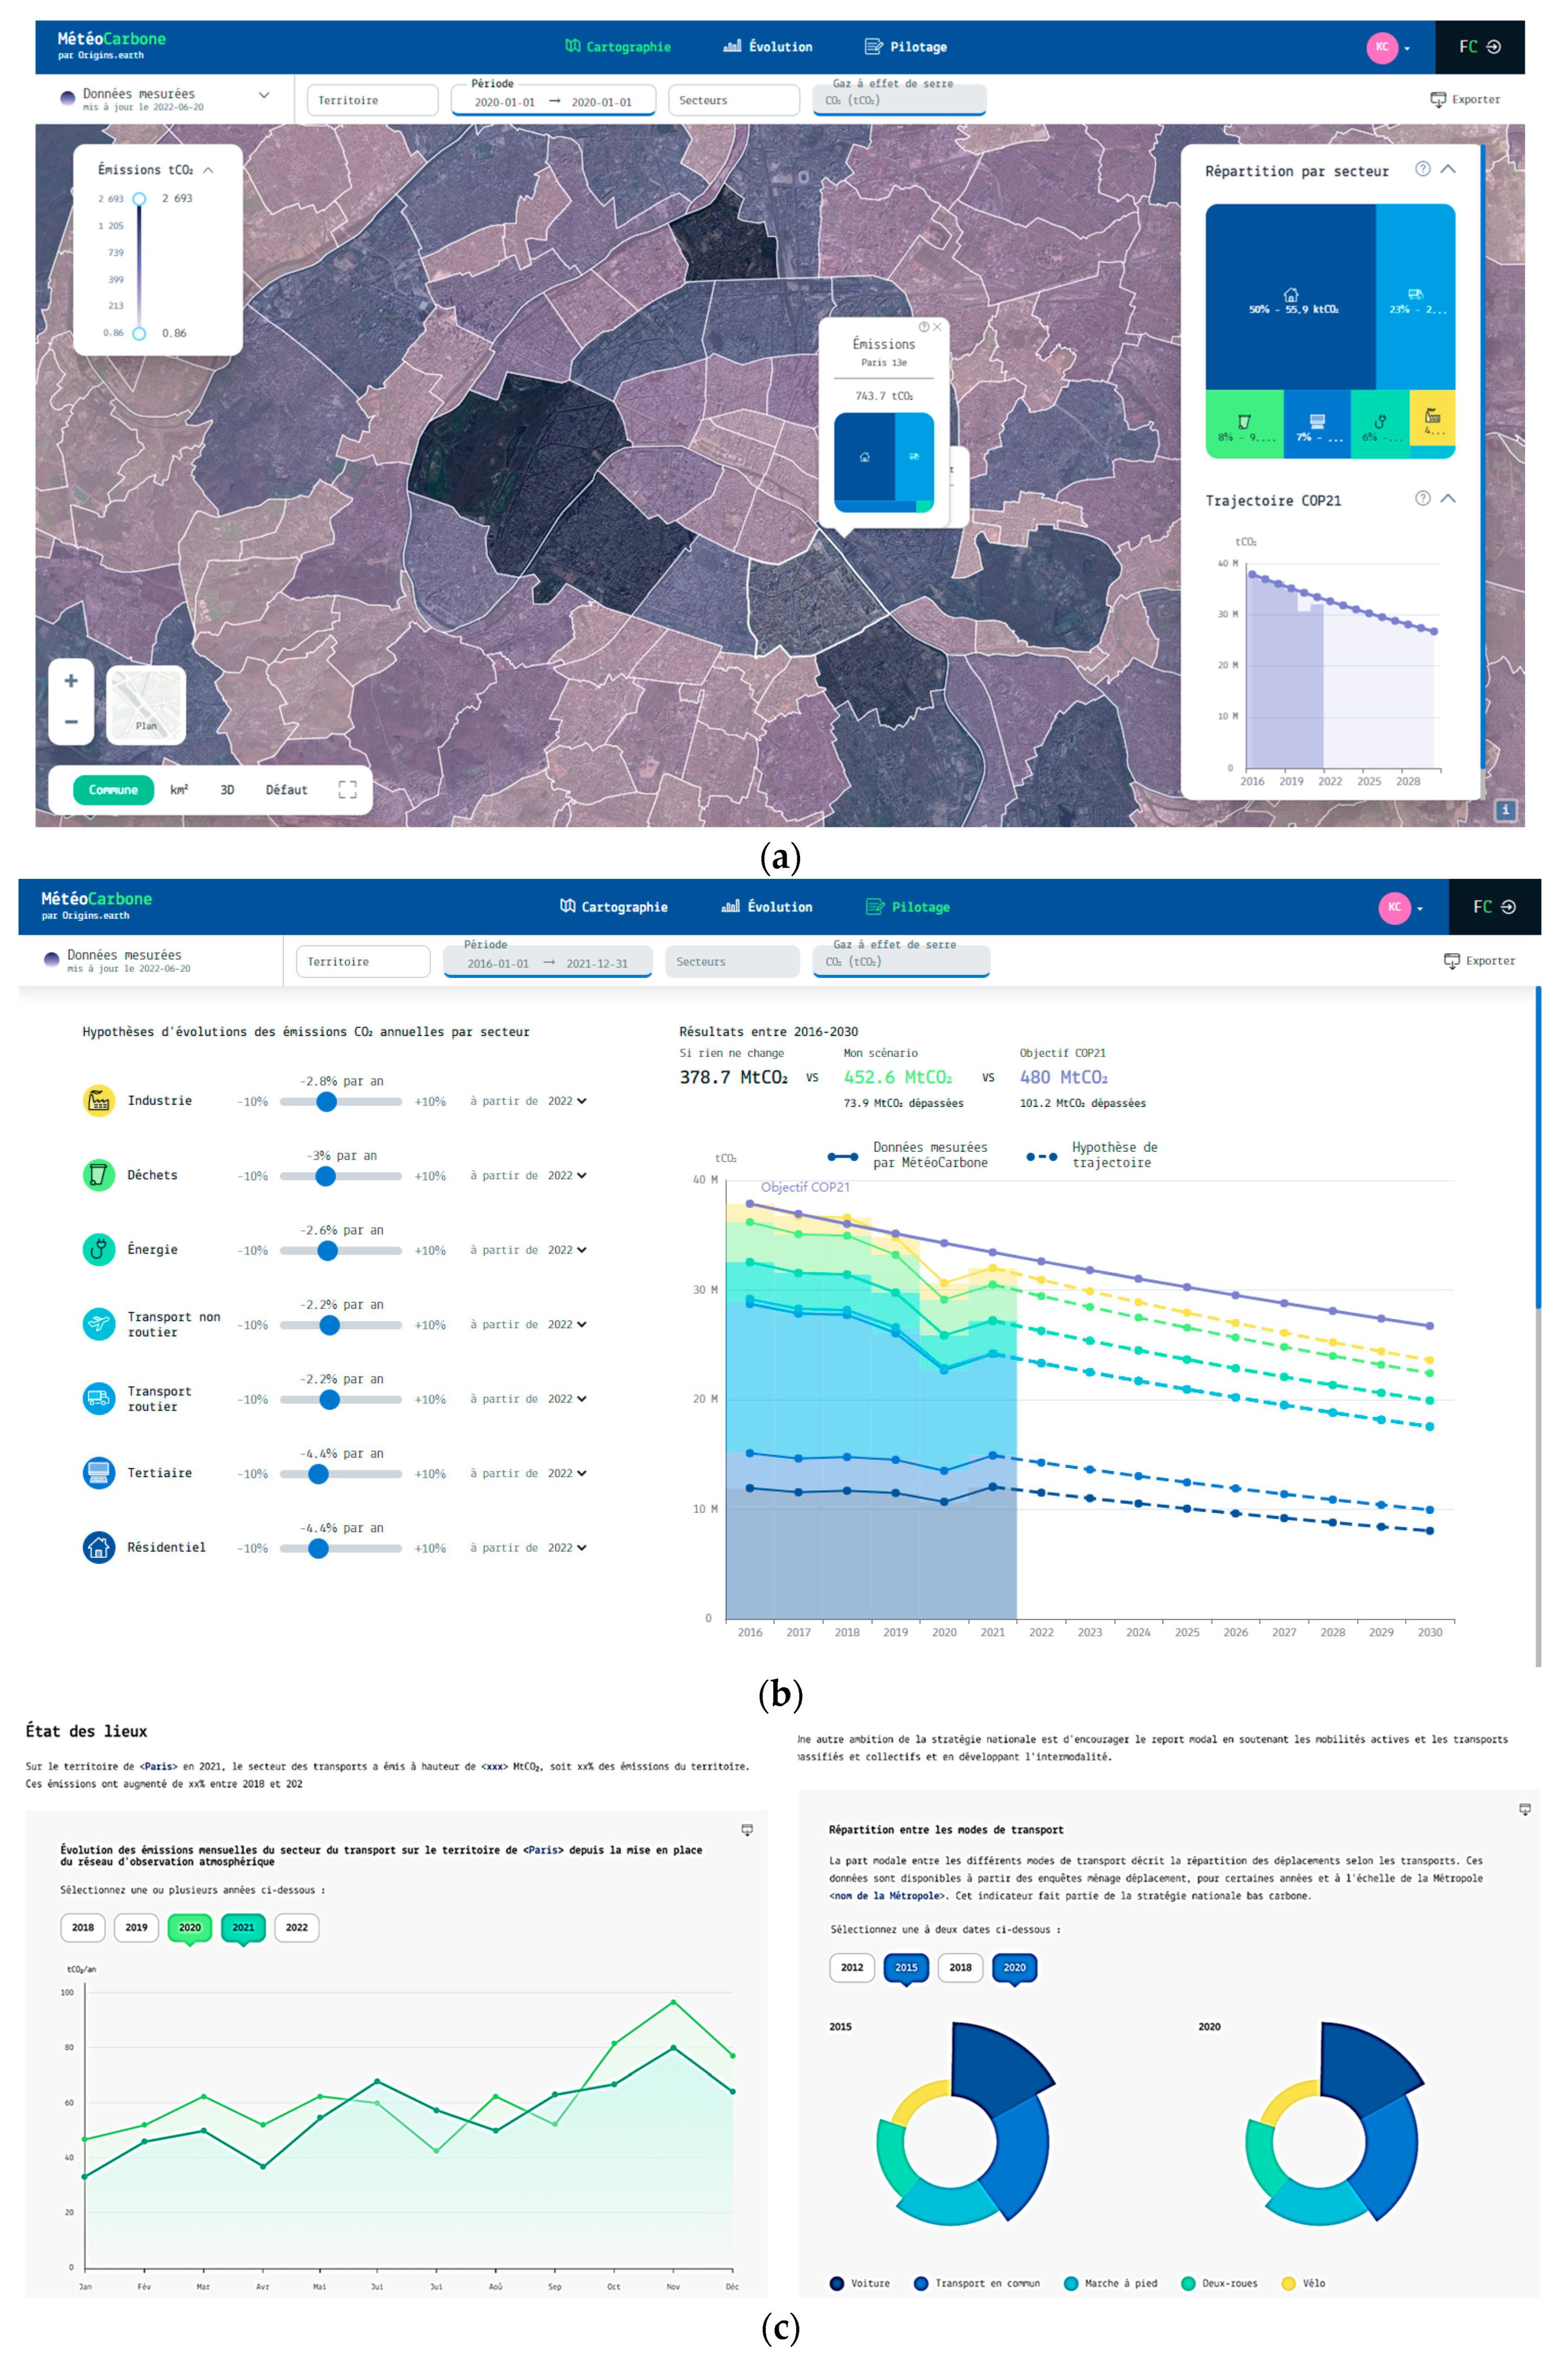
® processes this information and delivers it to the users through 3 main views with specific functionalities (
Figure 1):
The data navigation view, to explore the space and time distribution of emissions, by activity sector, with filtering features over the period of observation, geographical location, and by sector of activity;
A simulation and monitoring module, to simulate future scenarios related to the implementation of specific GHG emission reduction strategies to achieve low-carbon targets and science-grounded capabilities to interpret CO2 measurements and continually compare emissions with respect to predefined scenarios;
An analytical module with an advanced view per activity sector, which allows the calculation and continuous update of specific indicators to describe and characterize the emissions of each activity sector to effectively guide the design, implementation, and monitoring of specific policies.
The development of CarboneDeck® is performed within an agile framework, through iterative software-development stages (sprints), involving self-organized, cross-functional teams—including User-Interface (UI) and User-eXperience (UX) specialists—to progressively improve quality via short-term deliverables and continuous iterative interactions with end-users.
2.2. Data and Algorithms behind the Tool
This section is a brief overview of the data and algorithms leveraged in the tool. For a more comprehensive presentation, we invite the reader to read [
13].
The solution is a combined hardware-software technology, based on three components (
Figure 2):
An emission inventory with high spatial (1 km2) and temporal (1 h) resolution;
A network of continuous, high-precision CO2 concentration measurement instruments;
An atmospheric inversion system based on the Bayesian approach with Gaussian error statistics to reconstruct the space/time-resolved emission map.
Origins’ methodology for inventories is based on methodologies developed by Pôle National des Inventaires Territoriaux (PCIT), the body tasked by the French government to develop national guidelines for computing GHG emission inventories for local authorities [
6]. The unicity of Origins’ algorithms lies in building upon this methodology to further downscale emissions in space and time, with the goal to calculate emissions values for any relevant spatial resolution (e.g., road, building), for every hour, for any sector in the Standard Nomenclature for Air Pollution (SNAP) categories. Importantly, Origins’ algorithms produce CO
2 emission values in near-real-time.
The emission maps are then optimized by leveraging atmospheric measurements collected by the network of continuous CO
2 concentration monitoring stations. The atmospheric inversion is implemented following a Bayesian approach, where human CO
2 emissions are optimized for the best agreement between measured CO
2 concentrations and CO
2 concentrations outputted by an atmospheric model, both measurements and priors having a prescribed error [
13,
15]. The city-scale Bayesian inversion system is based on the near real-time CO
2 inventory, CO
2 measurements at in-situ stations combined with the meteorological measurements, and a high-resolution atmospheric transport model (
Figure 3). It provides emission values that are grounded in physical CO
2 observations in the atmosphere in near-real-time.
3. Application on Ville de Paris: The Paris Monitoring Project
The technology and digital platform have been deployed on the Parisian territory. In this section, we introduce the context behind the project, key operational results, as well as perspectives for further development of functionalities for guiding political decisions.
3.1. Political Context and Objectives
To comply with the United Nations and European-level commitments at the national level, the French government leverages territorial (i.e., infra-national) administrative levels to implement low-carbon transition plans. The first mentions of territorial climate plans dated back in France from 2004 [
16]. Today, all local authorities with more than 20,000 inhabitants are required by law to establish a Climate Plan within the framework of PCAET (Plan climat-air-énergie territorial) [
14]. As far as climate commitments are concerned, the PCAET consists of: (1) the diagnosis of all emissions and energy consumption in the geographical area relative to the local authority, (2) the definition of a strategy for reducing GHG emissions, (3) the definition of an action plan, and (4) the monitoring of the implementation of the action plan and associated results in terms of emissions and energy consumption. The PCAET takes place over 6 years, with an obligatory checkpoint after 3 years.
Ville de Paris is a pioneer in the elaboration of Climate Plans, with the first diagnosis of GHG emissions and energy consumption in 2004, followed by the adoption of a climate plan in 2007 [
17]. Paris’s local GHG emissions were cut by 25% between 2004 and 2018. The third Climate Plan adopted in 2018 outlines a series of actions to further reduce emissions and energy consumption. In November 2021, the leadership of Ville de Paris has been recognized with the UN Global Climate Award, which acknowledges transformative local actions and innovative actions for accelerating the fight against climate change [
18].
In 2020, Ville de Paris, the Laboratory of Sciences for Climate and the Environment, and Origins.earth, signed an agreement acting for the installation of urban atmospheric CO
2 measuring stations and the deployment of an observatory of CO
2 emissions in the Paris area [
19]. This world première is recognized and supported by the World Meteorological Organization via the Integrated Global Greenhouse Gas Information System (IG
3IS) Initiative. The agreement was signed with the ambition of enabling city officials to seamlessly monitor CO
2 emissions in the Paris urban area and continually verify the alignment of these emissions with reductions outlined in the Paris Climate Plan.
3.2. Scientific Results
A series of studies have attempted to analyze the sources and sinks of CO
2 and the spatial-temporal variability of CO
2 concentrations in the megacity of Paris with the aim of a better quantification of urban CO
2 emissions, e.g., [
20,
21]. Previous studies have shown that atmospheric measurements and top-down inversion models can provide low latency estimates of total CO
2 emissions over Paris, e.g., [
22,
23,
24]. However, there were few events associated with a sudden change in emissions to assess the accuracy of the atmospheric method for detecting changes. The large and sudden emissions reductions of the COVID-19 pandemic provide such a test bed.
With the MétéoCarbone
® solution, Origins.earth estimated CO
2 emissions in Paris over two COVID-19 lockdown periods in 2020 [
13]. The study used CO
2 measurements from six stations located within Paris and its vicinity, and the Weather Research and Forecasting model coupled with Chemistry (WRF-Chem) transport model at 1-km horizontal resolution driven by fossil fuel CO
2 emissions from the Origins inventory and biogenic CO
2 fluxes from the Vegetation Photosynthesis and Respiration model. The CO
2 emissions from the Paris megacity show decreases by 42~53% during the first lockdown with stringent measures, and by ~20% during the second one when restrictions were eased (
Figure 4). The robustness of the inverse estimates is evaluated through a series of sensitivity tests to the changes in inversion configuration and validated against independent emission estimates made by the city environmental services. Our results demonstrate skill in MétéoCarbone
® to identify changes in city-scale CO
2 emissions in a timely manner.
Ongoing work focuses on evaluating the derived estimates of CO2 emissions based on 6-year atmospheric inversion to better understand the seasonal and the inter-annual variations over Paris. This analysis is expected to help recognize the impact of environmental policy with the mid-term and long-term low-carbon targets.
3.3. Accelerating Use Cases for Supporting Public Policies and Fostering Citizen Buy-In in Cities
In parallel with the research work developing scientific capabilities relating to the monitoring CO2 of emissions via urban monitoring networks, we advance the actionability of CO2 measurements for supporting low-carbon public policies and fostering citizen buy-in, in constant dialogue with Ville de Paris and other local authorities.
The applicability of CO
2 networks in the framework of local policies lies in the agility and reliability of associated CO
2 emission information. While traditional accounting methods provide reliable emission values with a lag of 2 years, atmospheric-based emission values are accessible in under a month. Shaped and delivered via the CarboneDeck
® digital platform, the MétéoCarbone
® scientific and technical capabilities can therefore be leveraged to communicate emission values to city stakeholders and the general public in line with the urgency of the climate transition and the targets years of 2030 and 2050. The COVID example (
Section 3.2) has shown that results of large-scale public policy decisions can be quantified in terms of a drop in CO
2 emissions within a monthly time period. The solution can enable constant public dialogue between scientists, citizens, and decision-makers in cities focusing on the impact of actions through the lens of the decarbonization of activities in cities.
Reliable physically based CO2 emissions foster the development of analytical capabilities in a multidisciplinary approach. We have started a partnership with the Master of Economics for Smart Cities and Climate Policy, which brings in an econometrical view on the analysis of public policies as they relate to CO2 emissions, with use cases on road closures on weekends (Paris Respire) and building renovations. The political response to climate issues is complex and involves a range of environmental, social, economic, and legal expertise as well as citizen buy-in and implications. The development of multidisciplinary solutions fostered around the lens of physically based CO2 information will support and accelerate public policy actions implemented by city-level administrations, with a dialogue focused on decarbonization.
Finally, the use of intermediary quantities in the calculation of dynamic inventories (
Section 2.2) can be leveraged to discriminate social and environmental drivers of emissions. Another line of discussion with local authorities focuses on shaping dynamic inventory data and algorithms into easily accessible, timely, and actionable indicators for (1) establishing emission reduction strategies and an operational action plan, and (2) monitoring the progress of the action plan and its impact on CO
2 emission reductions.
4. Conclusions
In this paper, we introduced the MétéoCarbone solution designed for practitioners in local governments to support them with their climate policies, and the results of its deployment in collaboration with Ville de Paris, France. MétéoCarbone® leverages atmospheric CO2 measurements to calculate CO2 emissions in near-real time over the city, empowering government officials and their citizens to efficiently track the evolution of CO2 emissions and the progress towards carbon neutrality. MétéoCarbone® bridges the gap between capabilities developed by the scientific community and decision-makers in local governments and can contribute to the panel of solutions to successfully hold the increase in the global average temperature to well below 2°C above pre-industrial levels as stated in the 2015 Paris Agreement.
Italy and France display analogous political, reglementary, social, and economic frameworks, with similar stakes, ambitions, and objectives. The two national frameworks are an adaptation of the European Union’s target of a net domestic reduction of at least 55% in greenhouse gas emissions by 2030 compared to 1990 and achieving a climate-neutral EU by 2050 [
1]. Therefore, we propose that results obtained in the Paris Monitoring project be transferred to the Italian regional and municipal stakeholders (Regioni, Comuni, Agenzie Regionali e Provinciali per la Protezione dell’Ambiente—ARPA, etc.), with minor adaptations, through a two-step approach:
Implementation of a spatialized and automated dynamic inventory of GHG (spatial resolution 1 km2; temporal resolution 1 h) for regional territories;
Implementation of the continuous monitoring system of GHG (greenhouse gas) concentration at a local level, including:
Construction, deployment, and maintenance of high-precision CO2 monitoring stations;
Configuration of inverse atmospheric modeling for the monthly reconstruction of the space/time-resolved emission maps.
Both approaches will be delivered to end-users via the CarboneDeck® digital platform for data-driven and science-based informed decision-making, with the goal of acting on drivers of CO2 emissions via public policies and citizen actions in constant communication around physically-based CO2 concentrations in the atmosphere, which is what ultimately matters for the stability of the Earth’s climate system.
Author Contributions
Conceptualization, D.D., L.M., H.U. and K.C.; methodology, D.D. and K.C.; software, H.U., J.L. and K.C.; validation, H.U.; formal analysis, J.L., H.U. and K.C.; investigation, L.M., J.L., H.U. and K.C.; resources, D.D., L.M. and H.U.; data curation, J.L. and H.U.; writing—original draft preparation, K.C., J.L. and A.R.; writing—review and editing, K.C., J.L., A.R., L.M., H.U., M.A. and D.D.; visualization, J.L. and K.C.; supervision, K.C., L.M. and H.U.; project administration, D.D. and K.C.; funding acquisition, D.D. and L.M. All authors have read and agreed to the published version of the manuscript.
Funding
This research received no external funding.
Institutional Review Board Statement
Not applicable.
Informed Consent Statement
Not applicable.
Data Availability Statement
Data sharing is not applicable to this article as no new data were created or analyzed in this study.
Acknowledgments
The authors are thankful to researchers at the Laboratory of Sciences for Climate and the Environment (LSCE), Philippe Ciais, Thomas Lauvaux, Olivier Laurent, and Michel Ramonet for their precious contributions and support with the development and implementation of the scientific methods. They are also thankful to stakeholders at Ville de Paris, including Yann Françoise, Nicolas Turpin, Hugo Mattei, and Arnaud Cami, for their dialogue on implemented functionalities and actionability of scientific results.
Conflicts of Interest
The authors declare no conflict of interest.
References
- Council of the European Union. Submission to the UNFCCC on Behalf of the European Union and Its Member States on the Update of the Nationally Determined Contribution of the European Union and Its Member States 2020. Available online: https://data.consilium.europa.eu/doc/document/ST-14222-2020-REV-1/en/pdf (accessed on 17 March 2022).
- International Energy Agency (IEA). IEA: World Energy Outlook. 2016. Available online: https://iea.blob.core.windows.net/assets/680c05c8-1d6e-42ae-b953-68e0420d46d5/WEO2016.pdf (accessed on 17 March 2022).
- Seto, K.C.; Dhakal, S.; Bigio, A.; Blanco, H.; Delgado, G.C.; Dewar, D.; Huang, L.; Inaba, A.; Kansal, A.; Lwasa, S.; et al. Human settlements, infrastructure and spatial planning, chap. 12. In Climate Change 2014: Mitigation of Climate Change. IPCC Working Group III Contribution to AR5; Cambridge University Press: Cambridge, UK; New York, NY, USA, 2014. [Google Scholar]
- United Nations, Department of Economic and Social Affairs, Population Division. World Population Prospects 2019: Highlights (ST/ESA/SER.A/423). Available online: https://population.un.org/wpp/Publications/Files/WPP2019_Highlights.pdf (accessed on 17 March 2022).
- ICLEI 2012 Local Governments for Sustainability USA. U.S. Community Protocol for Accounting and Reporting of Greenhouse Gas Emissions. 2019. Available online: https://icleiusa.org/us-community-protocol/ (accessed on 17 March 2022).
- Pôle de Coordination des Inventaires Territoriaux, Guide Méthodologique Pour L’élaboration des Inventaires Territoriaux des Emissions Atmosphériques, 2018, Ministère Chargé de l’Environnement. Available online: https://www.lcsqa.org/system/files/media/documents/MTES_Guide_methodo_elaboration_inventaires_PCIT_mars2019.pdf (accessed on 17 March 2022).
- Mueller, K.; Lauvaux, T.; Gurney, K.; Roest, G.; Ghosh, S.; Gourdji, S.; Karion, A.; Decola, P.; Whetstone, J. An emerging GHG estimation approach can help cities achieve their climate and sustainability goals. Environ. Res. Lett. 2021, 8, 084003. [Google Scholar] [CrossRef]
- Weiss, R.F.; Prinn, R.G. Quantifying greenhouse-gas emissions from atmospheric measurements: A critical reality check for climate legislation. Phil. Trans. R. Soc. A 2011, 369, 1925–1942. [Google Scholar] [CrossRef] [PubMed] [Green Version]
- Hutyra, L.R.; Duren, R.; Gurney, K.R.; Grimm, N.; Kort, E.A.; Larson, E.; Shrestha, G. Urbanization and the carbon cycle: Current capabilities and research outlook from the natural sciences perspective. Earth’s Future 2014, 2, 473–495. [Google Scholar] [CrossRef] [Green Version]
- Lauvaux, T.; Giron, C.; Mazzolini, M.; d’Aspremont, A.; Duren, R.; Cusworth, D.; Shindell, D.; Ciais, P. Global assessment of oil and gas methane ultra-emitters. Science 2022, 375, 557–561. [Google Scholar] [CrossRef] [PubMed]
- Chevallier, F.; Broquet, G.; Zheng, B.; Ciais, P.; Eldering, A. Large CO2 Emitters as Seen From Satellite: Comparison to a Gridded Global Emission Inventory. Geophys. Res. Lett. 2022, 49, e2021GL097540. [Google Scholar] [CrossRef] [PubMed]
- Ciais, P.; Ramonet, M.; Lauvaux, T.; Bréon, F.M.; Lian, J.; Laurent, O.; Combaz, D.; Broquet, G.; Legendre, V.; Delmotte, M.; et al. Suivi atmosphérique des émissions de CO2 de la région parisienne. La Météorologie 2021, 114, 30–37. [Google Scholar] [CrossRef]
- Lian, J.; Lauvaux, T.; Utard, H.; Bréon, F.M.; Broquet, G.; Ramonet, M.; Laurent, O.; Albarus, I.; Cucchi, K.; Ciais, P. Assessing the Effectiveness of an Urban CO2 Monitoring Network over the Paris Region through the COVID-19 Lockdown Natural Experiment. Environ. Sci. Technol. 2022, 56, 2153–2162. [Google Scholar] [CrossRef] [PubMed]
- Légifrance. Arrêté du 4 Août 2016 Relatif au Plan Climat-Air-Energie Territorial. Available online: https://www.legifrance.gouv.fr/loda/id/JORFTEXT000032974938/ (accessed on 17 March 2022).
- Enting, I. Inverse Problems in Atmospheric Constituent Transport; Cambridge University Press: Cambridge, UK, 2002. [Google Scholar] [CrossRef] [Green Version]
- Ministère de L’écologie et du Développement Durable, Plan Climat 2004. Available online: https://unfccc.int/resource/country/plan_climat_fr.pdf (accessed on 17 March 2022).
- City of Paris, Green Parks and Environment, Urban Ecology Agency. Paris Climate Action Plan, 2nd ed.; 2020; Available online: https://cdn.paris.fr/paris/2020/11/23/257b26474ba3ba08ee02baa096f9c5dd.pdf (accessed on 17 March 2022).
- United Nations Climate Change. City of Paris: Carbon Neutral by 2050 for a Fair, Inclusive and Resilient Transition|France. Available online: https://unfccc.int/climate-action/un-global-climate-action-awards/climate-leaders/city-of-paris (accessed on 17 March 2022).
- City of Paris, Green Parks and Environment. Dispositif de mesure en temps continu des émissions de CO2—Convention Avec Origins.earth et le Laboratoire des Sciences du Climat et de l’Environnement. 2019. Available online: http://a06.apps.paris.fr/a06/jsp/site/plugins/odjcp/DoDownload.jsp?id_entite=50605&id_type_entite=6 (accessed on 17 March 2022).
- Lian, J.; Bréon, F.M.; Broquet, G.; Lauvaux, T.; Zheng, B.; Ramonet, M.; Xueref-Remy, I.; Kotthaus, S.; Haeffelin, M.; Ciais, P. Sensitivity to the sources of uncertainties in the modeling of atmospheric CO2 concentration within and in the vicinity of Paris. Atmos. Chem. Phys. 2021, 21, 10707–10726. [Google Scholar] [CrossRef]
- Lian, J.; Bréon, F.M.; Broquet, G.; Zaccheo, T.S.; Dobler, J.; Ramonet, M.; Staufer, J.; Santaren, D.; Xueref-Remy, I.; Ciais, P. Analysis of temporal and spatial variability of atmospheric CO2 concentration within Paris from the GreenLITE™ laser imaging experiment. Atmos. Chem. Phys. 2019, 19, 13809–13825. [Google Scholar] [CrossRef]
- Bréon, F.M.; Broquet, G.; Puygrenier, V.; Chevallier, F.; Xueref-Remy, I.; Ramonet, M.; Dieudonné, E.; Lopez, M.; Schmidt, M.; Perrussel, O.; et al. An attempt at estimating Paris area CO2 emissions from atmospheric concentration measurements. Atmos. Chem. Phys. 2015, 15, 1707–1724. [Google Scholar] [CrossRef] [Green Version]
- Staufer, J.; Broquet, G.; Bréon, F.M.; Puygrenier, V.; Chevallier, F.; Xueref-Rémy, I.; Dieudonné, E.; Lopez, M.; Schmidt, M.; Ramonet, M.; et al. The first 1-year-long estimate of the Paris region fossil fuel CO2 emissions based on atmospheric inversion. Atmos. Chem. Phys. 2016, 16, 14703–14726. [Google Scholar] [CrossRef] [Green Version]
- Wu, L.; Broquet, G.; Ciais, P.; Bellassen, V.; Vogel, F.; Chevallier, F.; Xueref-Remy, I.; Wang, Y. What would dense atmospheric observation networks bring to the quantification of city CO2 emissions? Atmos. Chem. Phys. 2016, 16, 7743–7771. [Google Scholar] [CrossRef]
| Disclaimer/Publisher’s Note: The statements, opinions and data contained in all publications are solely those of the individual author(s) and contributor(s) and not of MDPI and/or the editor(s). MDPI and/or the editor(s) disclaim responsibility for any injury to people or property resulting from any ideas, methods, instructions or products referred to in the content. |
© 2023 by the authors. Licensee MDPI, Basel, Switzerland. This article is an open access article distributed under the terms and conditions of the Creative Commons Attribution (CC BY) license (https://creativecommons.org/licenses/by/4.0/).

