Abstract
The diagnosis and recommendation integrated system (DRIS) approach assesses plants’ nutrient status by comparing crop nutrient ratios with optimum values from a high-yielding group (DRIS norms). Furthermore, in this study, twenty-one grids were selected using GPS for soil sampling from a 1-hectare olive orchard field with a grid size of 20 × 20 m. Using standard laboratory procedures, soil samples were analyzed for macronutrients (N, P, and K ranging from 0.06–0.17%, 1.44–5.56%, and 31.94–120.32 mg kg−1) and micronutrients (Fe, Cu, Mn, Zn and B ranging from 25.16–82.3, 1.09–1.8, 26.96–65.69, 0.01–4.5 and 0.48–1.06 mg kg−1), respectively, and in plant samples for macronutrients (N, P and K ranging from 0.63–1.93, 0.01–0.16 and 0.75–1.37%) and micronutrients (Fe, Cu, Zn, Mn and B ranging from 152.5–621.5, 8.5–17, 18–34 and 43.5–113 mg kg−1), respectively. The critical ranges were investigated in terms of their relationship to the population’s yield level. DRIS norms derived from olives were able to detect nutrient deficiency and excess.
1. Introduction
The diagnosis and recommendation integrated system (DRIS) diagnoses nutrient deficiency by evaluating essential nutrient ratios in specific plant tissue rather than the absolute value of individual nutrient norms. Nutrient ratios in high-yield populations provide a reference value for comparing ratios found in low-yield populations of the same crop varieties. The DRIS method was developed to provide a valid diagnostic regardless of plant age, the cultivar being grown, prevailing conditions, changes in sampling method, or sampling time [1]. Hence, our study aimed to help understand the availability of soil nutrients and apply fertilizer based on recommendations to achieve the highest yields through the use of the nutrient index model (DRIS). Olive (Olea europaea L.) is considered the most important fruit tree due to its economic significance for oil production [2]. Olive is cultivated over an estimated area of 10.51 million hectares all around the globe, producing around 21.07 million tonnes of olive fruit [3].
2. Materials and Methods
The index soil samples collection was performed by selecting twenty-one grids of olive orchard fields by QGIS software and samples were collected at 0–30 cm depth from one hectare with a grid size of 20 × 20 m. Geospatial analysis was performed to quantify the degree of spatial dependence/variability by using ArcGIS software. Olive plant samples were also collected from different cultivars in each grid. The collected samples were oven dried at 65 °C for 24 h and after that grinding and storage were performed for further analysis. Phosphorus, K, Ca, Mg, B, Zn, Cu, Fe, and Mn in Olive plants were determined by the wet digestion method and the use of nitric acid and chloric acid at a 2:1 ratio [4]. The nutrients released were measured by ICP-OES [5]. The total nitrogen (N) in the plant samples was determined by the combustion method on an Elemetar Vario EL iii-combustion analyzer in CNS mode. Dry and ground plant samples (15 mg) were combusted with the tungsten oxide catalyst. The resulting gases passed through various heat and chemical traps [6].
3. Results and Discussion
3.1. GIS Mapping and Olive Orchard
Geospatial analysis was performed to quantify the degree of spatial dependence/variability by using ArcGIS software (Figure 1).
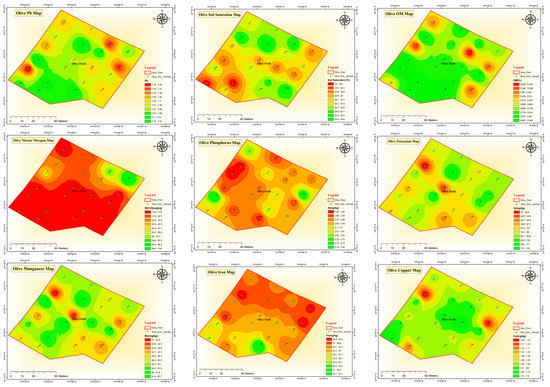
Figure 1.
GIS maps showing status of different soil porperties and nutrients in the olive orchard.
3.2. DRIS Model
The diagnosis and recommendation integrated system (DRIS) is used for predicting whether a nutrient is present in sufficient quantity or not. Different DIRS norms developed in an olive orchard in Koont, Chakwal. Moreover, the nutrient status of olive trees is determined by critical level approach.
3.3. Nutrient Ratios for Low and High Yielders
Different nutrients for high- and low-yield ratios were varied, for example, the N/P ratio for high yielders was 12.91 while for low yielders its value was 13.33. Similarly, the N/K ratio values for high- and low-yielding populations were 1.13 and 1.12, respectively, and were not significantly different. N/Fe values for high and low yielders were 37.21 and 34.98, respectively, while for N/Cu these values were 925.99 and 1028.65, respectively. These were also not significantly different. Phosphorus to other nutrients ratios were as follows: P/N 0.10, P/K 38.9/48.4, P/Zn 3.35/3.32, P/Fe 81.6/95.8, P/Cu P/Mn 17.2/20.3 and P/B 26.3/28.8. For K to other nutrients were as follows: K/N 408/474, K/P 11.6/11.1, K/Zn 408/473, K/Fe 33.2/32.1, K/Cu 866/948, K/Mn 179/196 and K/B 290/177. For Fe, the ratios were as follows: Fe/N, 0.03, Fe/P, 0.37/0.40, Fe/K, 0.03/0.04, Fe/Zn 12.6/16.3, Fe/Cu 26.8/32.6, Fe/Mn 5.51/6.79 and Fe/B 9.18/6.28. Cu ratios with other nutrients were as follows: Cu/N 0.00/0.00, Cu/P 0.01/0.01, Cu/K 0.00/0.00, Cu/Zn 0.47/0.50, Cu/Fe 0.04/0.03, Cu/Mn 0.22/0.23 and Cu/B 0.34/0.20. Zn ratios with other nutrients were as follows: Zn/N 0.00/0.00, Zn/P 0.03/0.03, Zn/K 0.00/0.00, Zn/Fe 0.08/0.07, Zn/Cu 2.12/2.01, Zn/Mn 0.46/0.43 and Zn/B 0.72/0.41. For manganese, the ratios with other nutrients were as follows: Mn/N 0.01/0.01, Mn/P 0.06/0.06, Mn/K 0.01/0.01, Mn/Zn 2.30/2.44, Mn/Fe 0.19/0.16, Mn/Cu 4.87/4.92 and Mn/B 1.65/0.95. Lastly, for B with other nutrients, the ratios were as follows: B/N 0.00/0.01, B/P 0.04/0.07, B/K 0.00/0.01, B/Zn 1.47/3.20, B/Fe 0.13/0.22, B/Cu 3.08/6.28 and B/Mn 0.67/1.34.
DRIS norms, descriptive data and analysis of variance showed significant differences for boron and zinc contents, while the rest of the nutrient concentration as well as ratios remained statistically at par for high- and low-yielding populations (Table 1 and Figure 2). According to nutrient indexing of the DRIS model, boron and iron contents were sufficient in olive trees while nitrogen, phosphorus, potassium, zinc, copper, and manganese contents were moderate to highly deficient with zinc being the most deficient nutrient. Many studies have reported variations in the growth and yield of olive trees in response to their nutrient variations. These results are confirmed by [7] who reported that Arbequina showed higher growth and yield as compared to other olive cultivars as it was able to absorb more nutrients from the soil even under supersensitive conditions. In addition, [8] also reported results in favor of the present study and found that olive cultivars, especially Arbequina, were found to be more productive according to DRIS norms in long-term studies as compared to the studies that continued for shorter periods.

Table 1.
DRIS nutrient index values according to Wadt methodology.
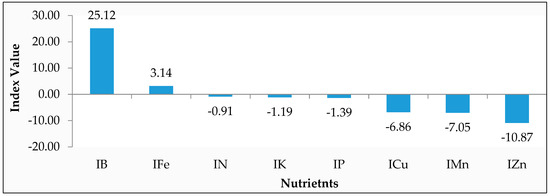
Figure 2.
Nutrient index value for olive orchard.
4. Conclusions
Essential plant nutrients play an important role in increasing the production of olive fruit as well as the efficiency of olive oil extraction. These nutrients are taken up from the soil solution and then play their respective roles in plant metabolism after their assimilation into different plant parts as required. Olive plants lose these nutrients after the removal of fruits or by pruning. Management of these deficient nutrients via organic and inorganic fertilizers is essential for obtaining maximum fruit and oil production. DRIS model has provided a precise estimation of nutrient requirements and deficiency levels of different nutrients in an olive orchard that might prove to be very helpful in recommending the guidelines for fertilizer application and correcting (Figure 2).
Author Contributions
Conceptualization, K.M.K. and Q.H.; methodology, K.M.K. and Q.H.; formal analysis, K.M.K.; investigation, Q.H. and M.A.; resources, Q.H., T.S.; data curation, K.M.K., T.S.; writing—original draft preparation, K.M.K.; writing—review and editing, K.M.K., Q.H., M.A., T.S., M.A.K., M.I., S.A. and R.M.; visualization, Q.H.; supervision, Q.H. All authors have read and agreed to the published version of the manuscript.
Funding
This study was funded by Pilot Project for Data-Driven Smart Decision Platform (DDSDP) for Increased Agriculture Productivity.
Institutional Review Board Statement
Not Applicable.
Informed Consent Statement
Not Applicable.
Data Availability Statement
Not Applicable.
Acknowledgments
This study was funded by Pilot Project for Data-Driven Smart Decision Platform (DDSDP) for Increased Agriculture Productivity. Authors are also thankful to institute of Soil and Environmental Science for providing laboratory facilities during analysis.
Conflicts of Interest
The authors declare no conflict of interest.
References
- Moreno, J.J.; Lucena, J.J.; Carpena, O. Effect of the iron supply on the nutrition of different citrus variety/rootstock combinations using DRIS. J. Plant. Nutr. 1996, 19, 689–704. [Google Scholar] [CrossRef]
- Fernandez-Escobar, R.; Mundi-Prensa, J.D. Olive Growing, 1st ed.; Barranco, D., Fernández-Escobar, R., Rallo, L., Eds.; Australian Olive Association Ltd.: Pendle Hill, Australia, 2010; Volume 1, pp. 18–19. [Google Scholar]
- Centeno, A.; García, J.M.; Gómez-del-Campo, M. Vegetative, productive and oil quality responses of ‘Arbequina’ and ‘Picual’ olive trees to foliar P and K application. Grasas Y Aceites 2020, 71, e356. [Google Scholar] [CrossRef]
- Ryan, J.; Estefan, G.; Rashid, A. Soil and Plant Analysis Laboratory Manual, 2nd ed.; International Center for Agricultural Research in Dry Area ICARDA: Alepo, Syria, 2001; pp. 118–127. [Google Scholar]
- Munter, R.C.; Grande, R.A. Plant Analysis and Soil Extracts by ICP-Atomic Emission Spectrometry, 1st ed.; Barnes, R.M., Ed.; Developments in Atomic Plasma Spectrochemical Analysis; Hcyden and Son, Ltd.: London, UK, 1981; pp. 653–672. [Google Scholar]
- Kjeldahl, C. A new method for the determination of nitrogen in organic matter. Anal Chem. 1883, 22, 366. [Google Scholar] [CrossRef]
- Gimenez, M.; Nieves, M.; Gimeno, H.; Tomé, J.M.; Nicolás, J.J.M. Nutritional diagnosis norms for three olive tree cultivars in superhigh-density orchards. J. Agric. Nat. Resour. 2021, 48, 34–44. [Google Scholar] [CrossRef]
- Díez, C.M.; Moral, J.; Cabello, D.; Morello, P.; Rallo, L.; Barranco, D. Cultivar and tree density as key factors in the long-term performance of super high-density olive orchards. Front. Plant Sci. 2016, 7, 1226. [Google Scholar] [CrossRef] [PubMed]


Publisher’s Note: MDPI stays neutral with regard to jurisdictional claims in published maps and institutional affiliations. |
© 2022 by the authors. Licensee MDPI, Basel, Switzerland. This article is an open access article distributed under the terms and conditions of the Creative Commons Attribution (CC BY) license (https://creativecommons.org/licenses/by/4.0/).