Proceeding Paper

An Assessment of the Relative Importance of Factors Impacting Surface UV Radiation Based on Simulations of the 6th Phase of the Coupled Intercomparison Project †

1
Laboratory of Atmospheric Physics, Physics Department, Aristotle University of Thessaloniki, 54124 Thessaloniki, Greece
2
Institute of Meteorology and Climate Research, Karlsruhe Institute of Technology, 76021 Karlsruhe, Germany
*
Author to whom correspondence should be addressed.
Presented at the 16th International Conference on Meteorology, Climatology and Atmospheric Physics—COMECAP 2023, Athens, Greece, 25–29 September 2023.
Environ. Sci. Proc. 2023, 26(1), 119; https://doi.org/10.3390/environsciproc2023026119
Published: 29 August 2023

Abstract

:
Aerosols, ozone, surface reflectivity, and clouds are, among other factors, important for the modulation of UV radiation levels at the Earth’s surface. In this study, these variables were extracted from climate model integrations that contributed to CMIP6 and from MACC global reanalysis provided by the CAMS. From the 1950s until the end of the 21st century and for various shared socioeconomic pathways considered by CMIP6, we conclude that total ozone will increase globally in 2100 by up to 11% under SSP5–8.5 relative to the 1950s, while under SSP1–2.6, ozone is not projected to recover to pre-ozone depletion levels. AOD at 550 nm shows reductions in 2090–2100 over the Northern Hemisphere of up to −0.38. Compared to CAMS, CMIP6 models show a general overestimation for total ozone of up to 2.5% in extra-polar regions for models with interactive chemistry. This implies systematically lower UV radiation from models based on these projections.

1. Introduction

Since the middle of the 20th century, climate change and ozone depletion have caused variability and trends in the amounts of UV radiation reaching Earth’s surface [1]. Climate change affects ozone depletion and, in turn, ozone depletion modulates the amounts of UV-B radiation and impacts multiple climatologic aspects (e.g., regional trends in temperature, precipitation, snow and ice coverage) [2]. Studies have shown that various factors such as ozone, aerosols, surface reflectivity, and clouds impact surface solar radiation, e.g., [3,4,5], including UV radiation.
With respect to ozone, the adoption and implementation of the Montreal Protocol and its amendments were essential in preventing increases in clear-sky UV-B radiation in the troposphere and near the surface. The changes in stratospheric ozone were largest over Antarctica during local spring (ozone hole), while in mid-latitudes, ozone depletion has been significantly smaller [6].
The emissions of greenhouse gases (GHGs) and the continuing increase in their atmospheric mixing ratios play a significant role in the atmospheric radiative budget and subsequently for climate change caused by global warming [7]. Of course, climate change also alters the atmospheric moisture content and, in addition, cloudiness [5].
Aerosol particles also play a crucial role in atmospheric radiative transfer and ultimately modify UV irradiance reaching Earth’s surface [8]. Depending on their physical properties and chemical composition, aerosols have different effects on radiation [9], so there is a large uncertainty regarding their radiative forcing [10] and net effect on UV levels.
This study investigates the variability in the most important factors that can affect the solar UV irradiance at Earth’s surface, i.e., ozone, aerosol optical depth, surface reflectivity, and, as a cumulative quantity, the cloud modification factor (CMF), in the period of 1950–2100. The resulting variations in the UV irradiance are discussed in another study.

2. Materials and Methods

The data used in this study were extracted from simulations of the 6th Phase of the Coupled Intercomparison Project (CMIP6) and the MACC global reanalysis of the Copernicus Atmosphere Monitoring Service (CAMS). Models of the CMIP6 database were selected according to the availability of all variables both in the past and future periods. First, the CMIP6 models were classified into two categories: the first includes models with prescribed ozone chemistry (hereafter Presc-O3), i.e., IPSL-CM6A-LR, MPI-ESM1-2-LR, and MPI-ESM1-2-HR; and the second includes models with interactive ozone chemistry (hereafter Inter-O3), i.e., CESM2-WACCM, CNRM-CM6-HR, CNRM-ESM2-1, GFDL-ESM4, GISS-E2-1-G, GISS-E2-1-H, MRI-ESM2-0, and UKESM1-0-LL.
The variables on which we focused in this study were the total ozone column (TOC), the aerosol optical depth (AOD) at 550 nm, and the upwelling and the downwelling shortwave (SW) irradiance under cloudy and clear-sky conditions. The ratio of upwelling and downwelling irradiance was used for the calculation of the surface reflectivity. For the calculation of the CMF, we used the ratio of the SW downwelling irradiance with clouds to the downwelling irradiance under clear skies (in this respect, the CMF is a cumulative quantity that does not distinguish different processes and cloud types).
Although this study covered the entire globe, the variables changed spatially; thus, some regional aspects are discussed later. To account for differences in the spatial resolution of the models, we re-gridded their outputs to a common 2° × 2.5° (latitude × longitude) grid. Firstly, we calculated the ensemble mean of each model and then we computed the multi-model mean of each set individually.
For the past, the analysis started in 1950, with the years 1950–1960 used as the base period, when total ozone was not yet depleted by anthropogenic halogens. Another period of interest was 1990–2000, when halogen-induced ozone depletion was strong and concentrations of ozone-depleting substances reached their highest levels. To gauge the future, we selected the period 2090–2100, which is typically the end of many simulations of CMIP6 models. Two shared socioeconomic pathways (SSPs) were considered: SSP1–2.6, which assumes the most sustainable scenario, and SSP5–8.5, the most pessimistic scenario.

3. Results

As systematic ozone changes have the greatest climatological effect on clear-sky surface UV radiation, its evolution through the years is important. Figure 1 presents the ratio of the multi-model annual averages of TOC for the years of 1950–2100 relative to the average in the base period of 1950–1960, separately for the Presc-O3 and the Inter-O3 models.
The TOC ratios seem to be close in the two sets of models for the whole period of interest. The Inter-O3 models show a smoother interannual variability than the Presc-O3 models, presumably arising from the averaging of year-to-year differences in the TOC produced by these models. Apparently, the globally averaged TOC decreased by as much as5.9% in 1993 for Presc-O3 and 6.5% in 2004 for the Inter-O3 models. Taking into consideration the trends of SSPs, in both scenarios, there is a late climate-change-driven alteration in future TOC levels (notwithstanding the general recovery due to decreasing halogens). Compared to TOC levels in the 1950s, for the SSP1–2.6-based projections, there is no full recovery of TOC by 2100, but under SSP5–8.5, TOC levels in 2100 are 10.8% and 9% higher for the Presc-O3 and Inter-O3 models, respectively, largely due to stratospheric cooling under climate change.
The upper set of diagrams in Figure 2 shows the differences in AOD at 550 nm from the base period of 1950–1960 for the periods of 1990–2000 and 2090–2100 for the two SSP scenarios of the Inter-O3 models, while the lower set displays the results for the Presc-O3 models. In both sets of models, the greatest increases for the years of 1990–2000 are over South-Eastern Asia, and are mainly attributable to increases in anthropogenic emissions since the 1950s. This feature has been discussed in other studies, e.g., [11,12], in more detail.
As, under SSP1–2.6, aerosol emissions are projected to decrease in 2090–2100 relative to the 1950s [13], in the Northern Hemisphere, the differences in AOD from the base period are −0.38 and −0.17 for Inter-O3 and Presc-O3 models, respectively. SSP5–8.5 projections show widely distributed increases in AOD especially over the Southern Hemisphere, while values over Europe and N. America have a decreasing trend, which is larger for Inter-O3 models. In the Presc-O3 models, AOD is decreasing over the same areas as well, but a hotspot appears over West Africa, with an increased AOD of around 0.48 compared to the mean of 1950–1960.
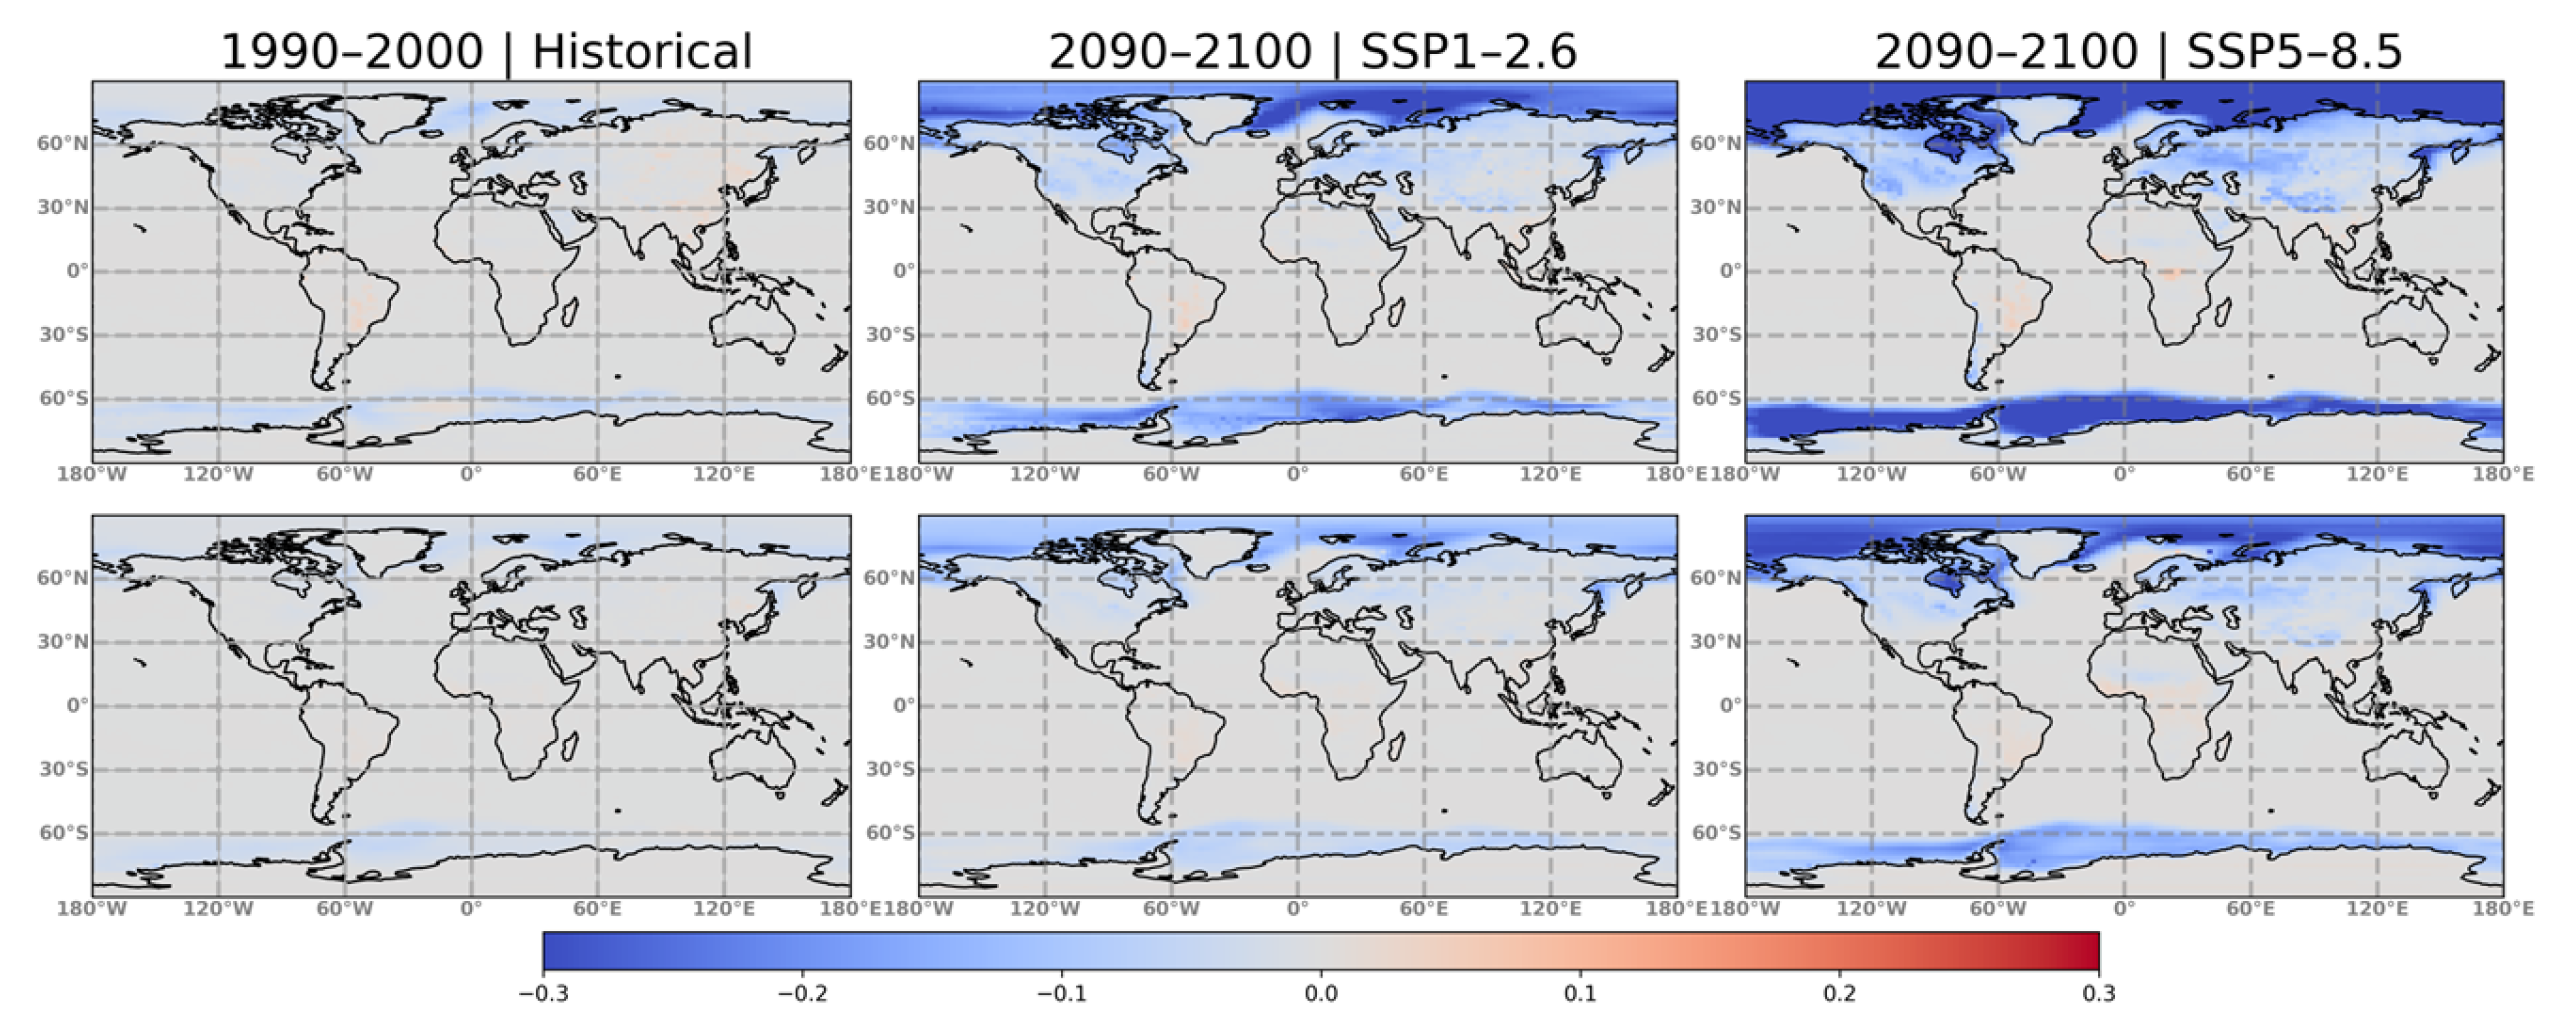
Regarding the SW surface reflectivity, as shown in Figure 3, there are no significant changes between the period of 1990–2000 and the 1950s. There is a small decrease in the reflectivity of around −0.07 over the polar regions for both sets of models, which results from the prescribed or modeled reduction in sea-ice in the respective set of models. The greatest decrease relative to 1950–1960 of up to −0.46 and −0.43 for the Inter-O3 and the Presc-O3 models, respectively, appears for SSP5–8.5.
Table 1 presents the CMF percentage difference relative to the base period for January and July and for five latitudinal bands. For the years of 1990–2000 (“Hist.”), the changes are small for both sets of models, with Inter-O3 models ranging in January from −0.17% to 0.08% and in July from −0.5% to 0.3%, while Presc-O3 models range from −0.07% to 0.5% in January and −0.9% to 0.33% in July. In both sets of models, CMF is projected to decrease in the polar regions of both hemispheres, while in other latitudes, there are both increases and decreases. Note that in models with Presc-O3, the reduction in CMF is greater.
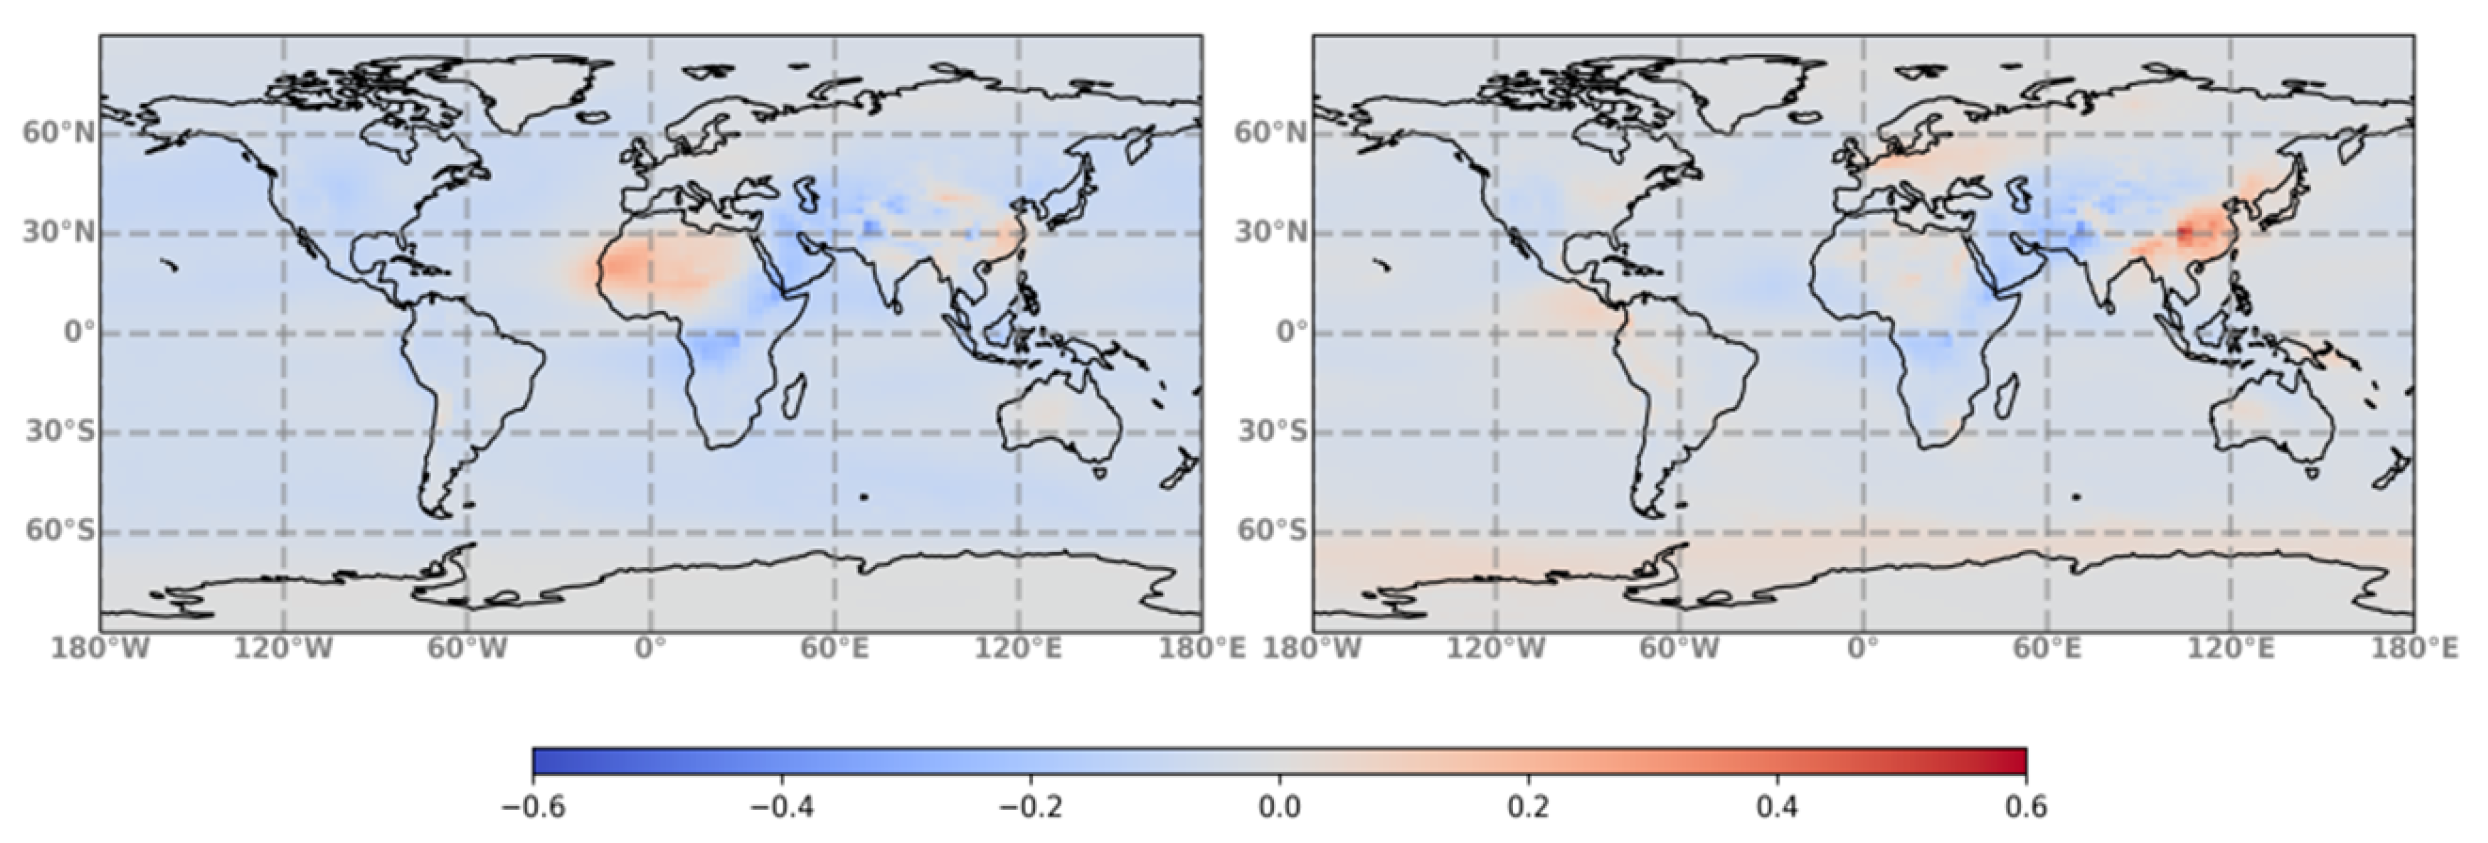
After characterizing the variability in TOC and AOD from CMIP6 simulations, in Figure 4, we compare these variations with the MACC global reanalysis product of CAMS. Owing to the availability of MACC data, the comparison is restricted to the period of 2003–2012. There are large regions distributed globally, where Inter-O3 and Presc-O3 models overestimate the TOC on average by up to around 3% and 11%, respectively, while over the polar regions, the TOC is underestimated by up to about 6% and 20%, respectively. Figure 5 compares the difference in AOD at 550 nm to CAMS data, showing quite significant differences, ranging from −0.37 to +0.54 in Inter-O3 and from −0.37 to +0.27 in Presc-O3 models.

4. Conclusions

In both sets of models (Presc-O3 and Inte-O3) used in this study, the simulations of TOC for the 21st century show an increasing trend since the mid- to late-1990s. Changes in TOC in the 21st century relative to the 1950s are similar in both sets of models for SSP5–8.5, but differ for SSP1–2.6 with Presc-O3 models showing smaller changes. The AOD at 550 nm for 1990–2000 is mostly increased compared with the base period of 1950–1960, especially over industrialized areas. For the future, the projections show decreases in AOD over Europe, while over areas near significant natural (e.g., Saharan desert) or anthropogenic (e.g., East Asia) sources, increases are projected. The SW surface reflectivity is reduced, relative to the base period, mostly in polar regions, due to the decreasing trend in ice cover.
Changes in polar regions are also detectable in the CMF, with reductions of up to 9.8% in Inter-O3 and 16.3% in Presc-O3 models in January under SSP5–8.5 over the Arctic. In Antarctica, the greatest reduction occurs in winter (July) with −11.5% for Inter-O3 models and −10.6% for Presc-O3 models. The reduced CMF can partly be linked to the reduced reflectivity, while both may lead to decreases in UV radiation at the surface.
As Figure 5 shows, there are large differences between the AOD at 550 nm derived by the MACC reanalysis and the Inter-O3 models, not only over industrialized areas, where anthropogenic emissions are high, but also elsewhere. In general, the AOD levels are lower in Inter-O3 models than in CAMS, except in Europe, East Asia, Australia, near Colombia, and around Antarctica.
With respect to past and future UV changes, we characterize a number of sources of uncertainty in CMIP6 projections and contextualize them with respect to CAMS data. It might be worrying that the biases between models and CAMS are still quite significant for the present day and that the two sets of CMIP6 models show different projections for the future, even for the same scenario. However, the general characteristics of temporal variability seem to be captured well, so relative changes are (with some limitations) usable for impact studies. For example, the CMIP6 projections can feed radiative transfer models to produce projections of spectral irradiance and various biologically weighted doses relevant for various ecosystems.

Author Contributions

Conceptualization, A.C., K.T., A.F.B., P.B. and R.R.; methodology, A.C., K.T., A.F.B. and R.R.; writing—original draft preparation, A.C., K.T. and A.F.B.; writing—review and editing, A.C., K.T., A.F.B., P.B. and R.R.; supervision, K.T. and A.F.B. All authors have read and agreed to the published version of the manuscript.

Funding

This research was financed by the Karlsruhe Institute of Technology (KIT—“The Research University in the Helmholtz Association-HEPTA”).

Data Availability Statement

The CMIP6 data are publicly available from the Earth System Grid Federation (ESGF) (https://esgf-node.llnl.gov/search/cmip6/, accessed on 2 December 2022) and the CAMS data are also publicly available from the Copernicus Catalogue (https://atmosphere.copernicus.eu/catalogue#/, accessed on 10 December 2022).

Conflicts of Interest

The authors declare no conflict of interest.

References

  1. Barnes, P.W.; Williamson, C.E.; Lucas, R.M.; Robinson, S.A.; Madronich, S.; Paul, N.D.; Bornman, J.F.; Bais, A.F.; Sulzberger, B.; Wilson, S.R.; et al. Ozone depletion, ultraviolet radiation, climate change and prospects for a sustainable future. Nat. Sustain. 2019, 2, 569–579. [Google Scholar] [CrossRef]
  2. Barnes, P.W.; Robson, T.M.; Neale, P.J.; Williamson, C.E.; Zepp, R.G.; Madronich, S.; Wilson, S.R.; Andrady, A.L.; Heikkilä, A.M.; Bernhard, G.H.; et al. Environmental effects of stratospheric ozone depletion, UV radiation, and interactions with climate change: UNEP Environmental Effects Assessment Panel, Update 2021. Photochem. Photobiol. Sci. 2022, 21, 275–301. [Google Scholar] [CrossRef] [PubMed]
  3. Hunter, N.; Rendell, R.J.; Higlett, M.P.; O’Hagan, J.B.; Haylock, R.G.E. Relationship between erythema effective UV radiant exposure, total ozone, cloud cover and aerosols in southern England, UK. Atmos. Chem. Phys. 2019, 19, 683–699. [Google Scholar] [CrossRef]
  4. Tourpali, K.; Bais, A.F.; Kazantzidis, A.; Zerefos, C.S.; Akiyoshi, H.; Austin, J.; Brühl, C.; Butchart, N.; Chipperfield, M.P.; Dameris, M.; et al. Clear sky UV simulations for the 21st century based on ozone and temperature projections from Chemistry-Climate Models. Atmos. Chem. Phys. 2009, 9, 1165–1172. [Google Scholar] [CrossRef]
  5. Waugh, D.W.; Oman, L.D.; Kawa, S.R.; Stolarski, R.S.; Pawson, S.; Douglass, A.R.; Newman, P.; Nielsen, J. Impacts of climate change on stratospheric ozone recovery. Geophys. Res. Lett. 2009, 36. [Google Scholar] [CrossRef]
  6. EEAP. Environmental Effects and Interactions of Stratospheric Ozone Depletion, UV Radiation, and Climate Change; 2022 Assessment Report; Environmental Effects Assessment Panel, United Nations Environment Programme (UNEP): Nairobi, Kenya, 2023; Available online: https://ozone.unep.org/science/assessment/eeap (accessed on 1 June 2022).
  7. Prather, M.J.; Holmes, C.; Hsu, J. Reactive greenhouse gas scenarios: Systematic exploration of uncertainties and the role of atmospheric chemistry. Geophys. Res. Lett. 2012, 39. [Google Scholar] [CrossRef]
  8. McKenzie, R.B.; Björn, L.O.; Bais, A.F.; Ilyasd, M. Changes in biologically active ultraviolet radiation reaching the Earth’s surface. Photochem. Photobiol. Sci. 2003, 2, 5–15. [Google Scholar] [CrossRef]
  9. Kuniyal, J.C.; Guleria, R.P. The current state of aerosol-radiation interactions: A mini review. J. Aerosol Sci. 2019, 130, 45–54. [Google Scholar] [CrossRef]
  10. Boucher, O.; Randall, D.; Artaxo, P.; Bretherton, C.; Feingold, G.; Forster, P.; Kerminen, V.M.; Kondo, Y.; Liao, H.; Lohmann, U.; et al. 2013: Clouds and Aerosols. In Climate Change 2013: The Physical Science Basis. Contribution of Working Group I to the Fifth Assessment Report of the Intergovernmental Panel on Climate Change; Cambridge University Press: Cambridge, UK; New York, NY, USA, 2013. [Google Scholar]
  11. Chin, M.; Diehl, T.; Tan, Q.; Prospero, J.M.; Kahn, R.A.; Remer, L.A.; Yu, H.; Sayer, A.M.; Bian, H.; Geogdzhayev, I.V.; et al. Multi-decadal aerosol variations from 1980 to 2009: A perspective from observations and a global model. Atmos. Chem. Phys. 2014, 14, 3657–3690. [Google Scholar] [CrossRef]
  12. Lamarque, J.-F.; Bond, T.C.; Eyring, V.; Granier, C.; Heil, A.; Klimont, Z.; Lee, D.; Liousse, C.; Mieville, A.; Owen, B.; et al. Historical (1850–2000) gridded anthropogenic and biomass burning emissions of reactive gases and aerosols: Methodology and application. Atmos. Chem. Phys. 2010, 10, 7017–7039. [Google Scholar] [CrossRef]
  13. Riahi, K.; Van Vuuren, D.P.; Kriegler, E.; Edmonds, J.; O’Neill, B.C.; Fujimori, S.; Bauer, N.; Calvin, K.; Dellink, R.; Fricko, O.; et al. The Shared Socioeconomic Pathways and their energy, land use, and greenhouse gas emissions implications: An overview. Glob. Environ. Change 2016, 42, 153–168. [Google Scholar] [CrossRef]
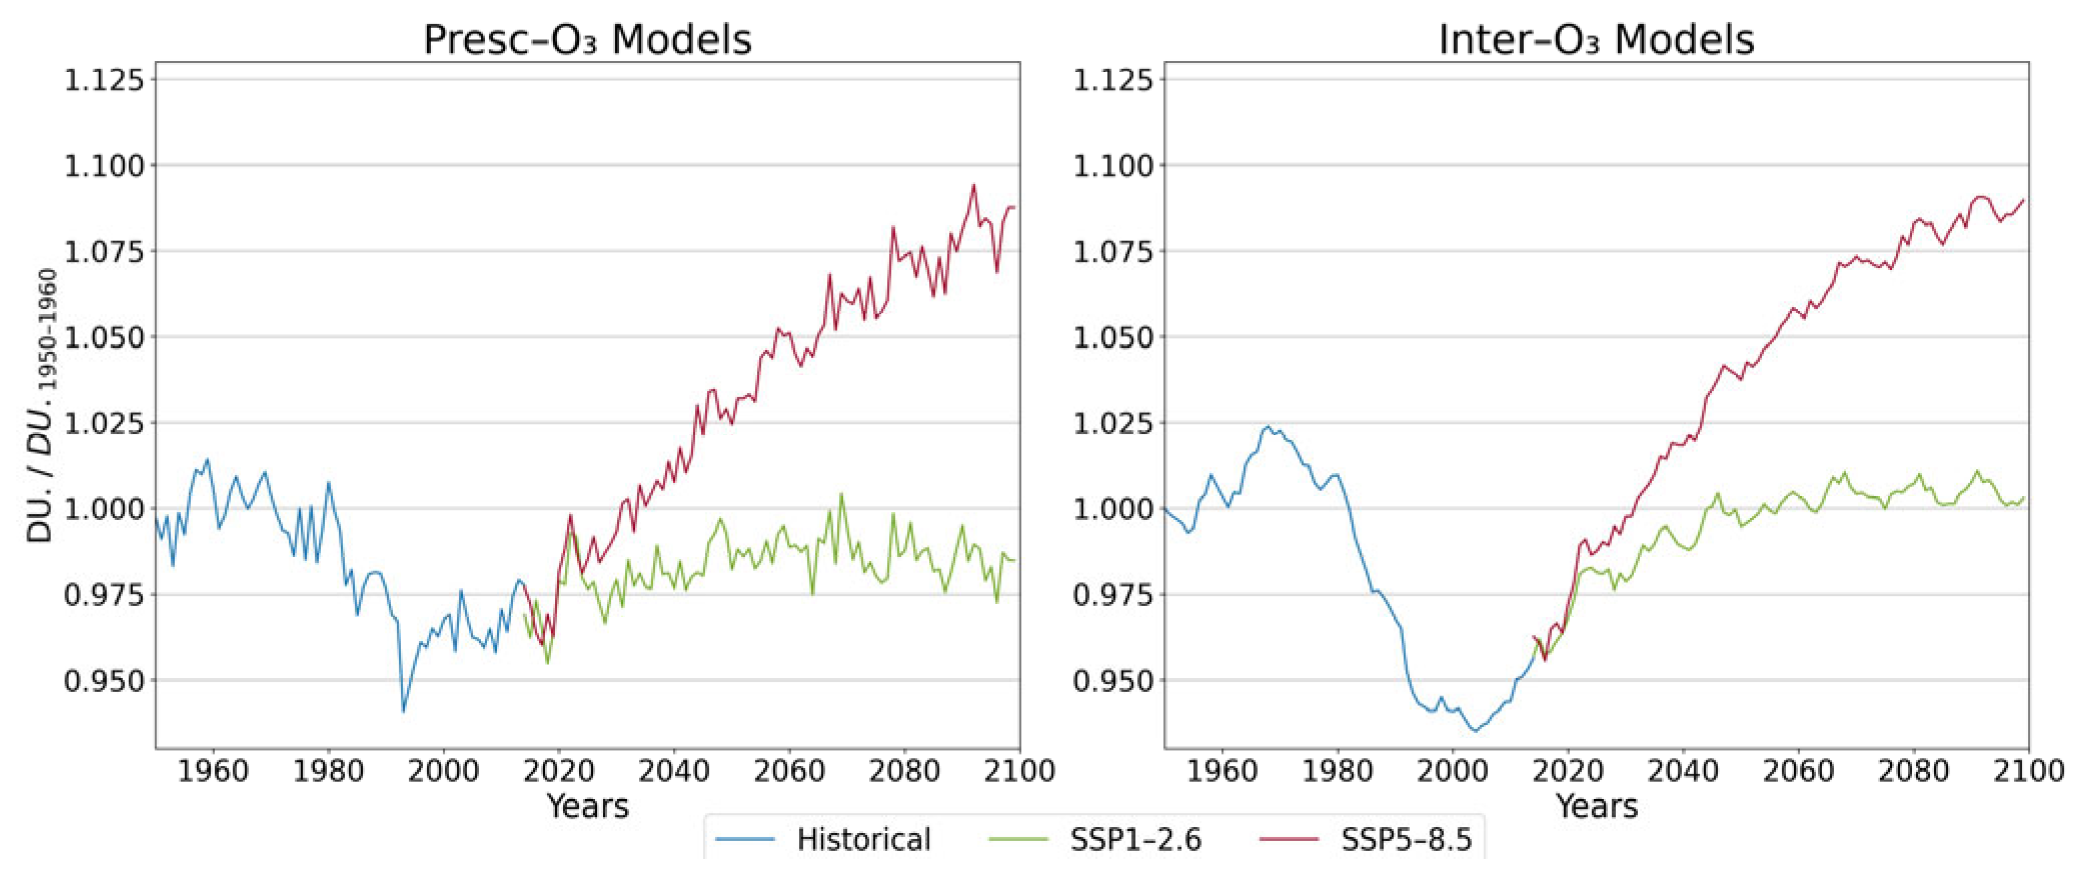
Figure 1. Time series of the ratio of the multi-model annual average TOC to the average of the years 1950–1960, in the period 1950–2100, from CMIP6 models with prescribed (left) and interactive (right) ozone chemistry and for two SSPs (green: SSP1–2.6, red: SSP5–8.5).
Environsciproc 26 00119 g001
Figure 2. Difference in AOD at 550 nm for the periods 1990–2000 and 2090–2100 (the latter separately for SSP1–2.6 and SSP5–8.5) relative to the base period 1950–1960. The upper panels correspond to Inter-O3 models, while the lower panels correspond to Presc-O3 models.
Environsciproc 26 00119 g002
Figure 3. Difference in SW surface reflectivity for the periods 1990–2000 and 2090–2100 (the latter separately for SSP1–2.6 and SSP5–8.5) relative to the base period 1950–1960. The upper panels correspond to Inter-O3 models, while the lower panels correspond to Presc-O3 models.
Environsciproc 26 00119 g003
Figure 4. Percentage difference in TOC from Presc-O3 (left) and Inter-O3 (right) models, in comparison to MACC global reanalysis data for 2003–2012.
Environsciproc 26 00119 g004
Figure 5. Same as in Figure 4, but for AOD at 550 nm.
Environsciproc 26 00119 g005
Table 1. Mean percentage difference and standard deviation of SW CMF for the periods 1990–2000 and 2090–2100 relative to the base period 1950–1960 under the two SSPs for January and July.
Inter-O3 ModelsPresc-O3 Models
Hist.SSP1–2.6SSP5–8.5Hist.SSP1–2.6SSP5–8.5
JanJulJanJulJanJulJanJulJanJulJanJul
60–90° N0.0 ± 1.7−0.5 ± 0.8−2.8 ± 4.5−2.7 ± 5.2−9.8 ± 8.7−8.1 ± 12.40.5 ± 16.1−0.9 ± 1.4−5.2 ± 7.9−4.5 ± 5.6−16.3 ± 11.2−8.23 ± 12.8
30–60° N0.08 ± 1.0−0.13 ± 0.80.5 ± 3.72.05 ± 1.9−0.73 ± 7.73.15 ± 3.80.0 ± 1.10.28 ± 0.9−2.0 ± 4.01.36 ± 1.8−4.0 ± 10.04.31 ± 5.5
30° N–30° S−0.17 ± 0.8−0.17 ± 0.60.41 ± 1.50.44 ± 1.50.88 ± 2.91.06 ± 3.10.0 ± 0.60.08 ± 0.60.08 ± 1.50.02 ± 1.50.19 ± 4.0−0.03 ± 4.4
30–60° S0.06 ± 1.00.3 ± 0.90.47 ± 1.40.94 ± 1.90.23 ± 3.71.49 ± 4.10.46 ± 1.10.33 ± 1.0−0.23 ± 1.9−0.19 ± 2.3−0.63 ± 4.8−0.7 ± 6.2
60–90° S0.01 ± 1.1−0.23 ± 1.9−1.79 ± 1.6−4.28 ± 4.1−5.1 ± 3.3−11.5 ± 7.6−0.07 ± 1.0−0.42 ± 1.6−1.85 ± 1.8−3.13 ± 2.6−6.22 ± 5.1−10.6 ± 5.4
Disclaimer/Publisher’s Note: The statements, opinions and data contained in all publications are solely those of the individual author(s) and contributor(s) and not of MDPI and/or the editor(s). MDPI and/or the editor(s) disclaim responsibility for any injury to people or property resulting from any ideas, methods, instructions or products referred to in the content.