Proceeding Paper

Seasonal Changes on PM2.5 Concentrations and Emissions at Urban Hotspots in the Greater Athens Area, Greece †

by
Kyriaki-Maria Fameli
1,*,
Komninos Dionysis
1,2 and
Vasiliki Assimakopoulos
1
1
Institute for Environmental Research and Sustainable Development, National Observatory of Athens, 15236 Athens, Greece
2
Department of Physics, University of Patras, 26500 Patras, Greece
*
Author to whom correspondence should be addressed.
Presented at the 16th International Conference on Meteorology, Climatology and Atmospheric Physics—COMECAP 2023, Athens, Greece, 25–29 September 2023.
Environ. Sci. Proc. 2023, 26(1), 124; https://doi.org/10.3390/environsciproc2023026124
Published: 29 August 2023

Abstract

:
At highly populated areas, such as the Greater Athens Area in Greece, the air quality differs significantly from one municipality to another, being highly affected by the local anthropogenic sources (traffic, residential heating, navigation) and consequent emissions. Thus, the existence of a dense network of low-cost air quality sensors provides evidence of seasonal patterns on particulate concentrations within the urban zone. In the present study, hourly PM2.5 concentrations recorded using low-cost sensors at six municipalities in the Greater Athens Area (Vrilissia, Psychiko, Peristeri, Rentis, Agia Varvara, Palaio Faliro) with different characteristics (population density, pollutant sources, surrounding land use) were collected for the year 2022. The highest mean seasonal values were recorded in the western and southern suburbs (Peristeri, Rentis and Palaio Faliro) during the cold period (winter of the year 2022). Mean concentrations decreased significantly in spring; the mean concentrations were 31.3 μg/m3 and 18.5 μg/m3 in Vrilissia in winter and spring, respectively (year: 2022).

1. Introduction

Despite the measures taken which led to reductions in emissions in 2021, 97% of the European Union (EU)’s urban population was exposed to concentrations of fine particulate matter (PM2.5) above the WHO annual limit of 5 µg/m3 [1]. The Greater Athens Area (GAA) is the most densely populated area in Greece, since about 3.2 million people live and work within 415 km2. It is subdivided into five regional units (Central Athens, North Athens, Piraeus, South Athens and West Athens; Figure 1). Due to the anthropogenic activities, and consequently, the variety of emission sources (traffic, residential heating, port of Piraeus on the south, off-road activities) as well as the complex topography and the meteorological conditions, exceedances of the EU limit values for air and particulate pollutants’ concentrations [2] are often recorded by the stations of the National Monitoring Network of Air Pollution [3]. However, the pollutants’ emission intensities and, consequently, the air quality differ significantly throughout the year [4,5] and geographically [6]. The existence of a dense network of low-cost air quality sensors can provide evidence of the sources and the seasonal patterns on particulate concentrations within the urban zone [7]. For this reason, in the present study, hourly PM2.5 concentrations recorded using low-cost sensors at six municipalities in the Greater Athens Area (Vrilissia, Psychiko, Peristeri, Rentis, Agia Varvara, Palaio Faliro) with different characteristics (population density, pollutant sources, surrounding land use) were collected for the year 2022.

2. Materials and Methods

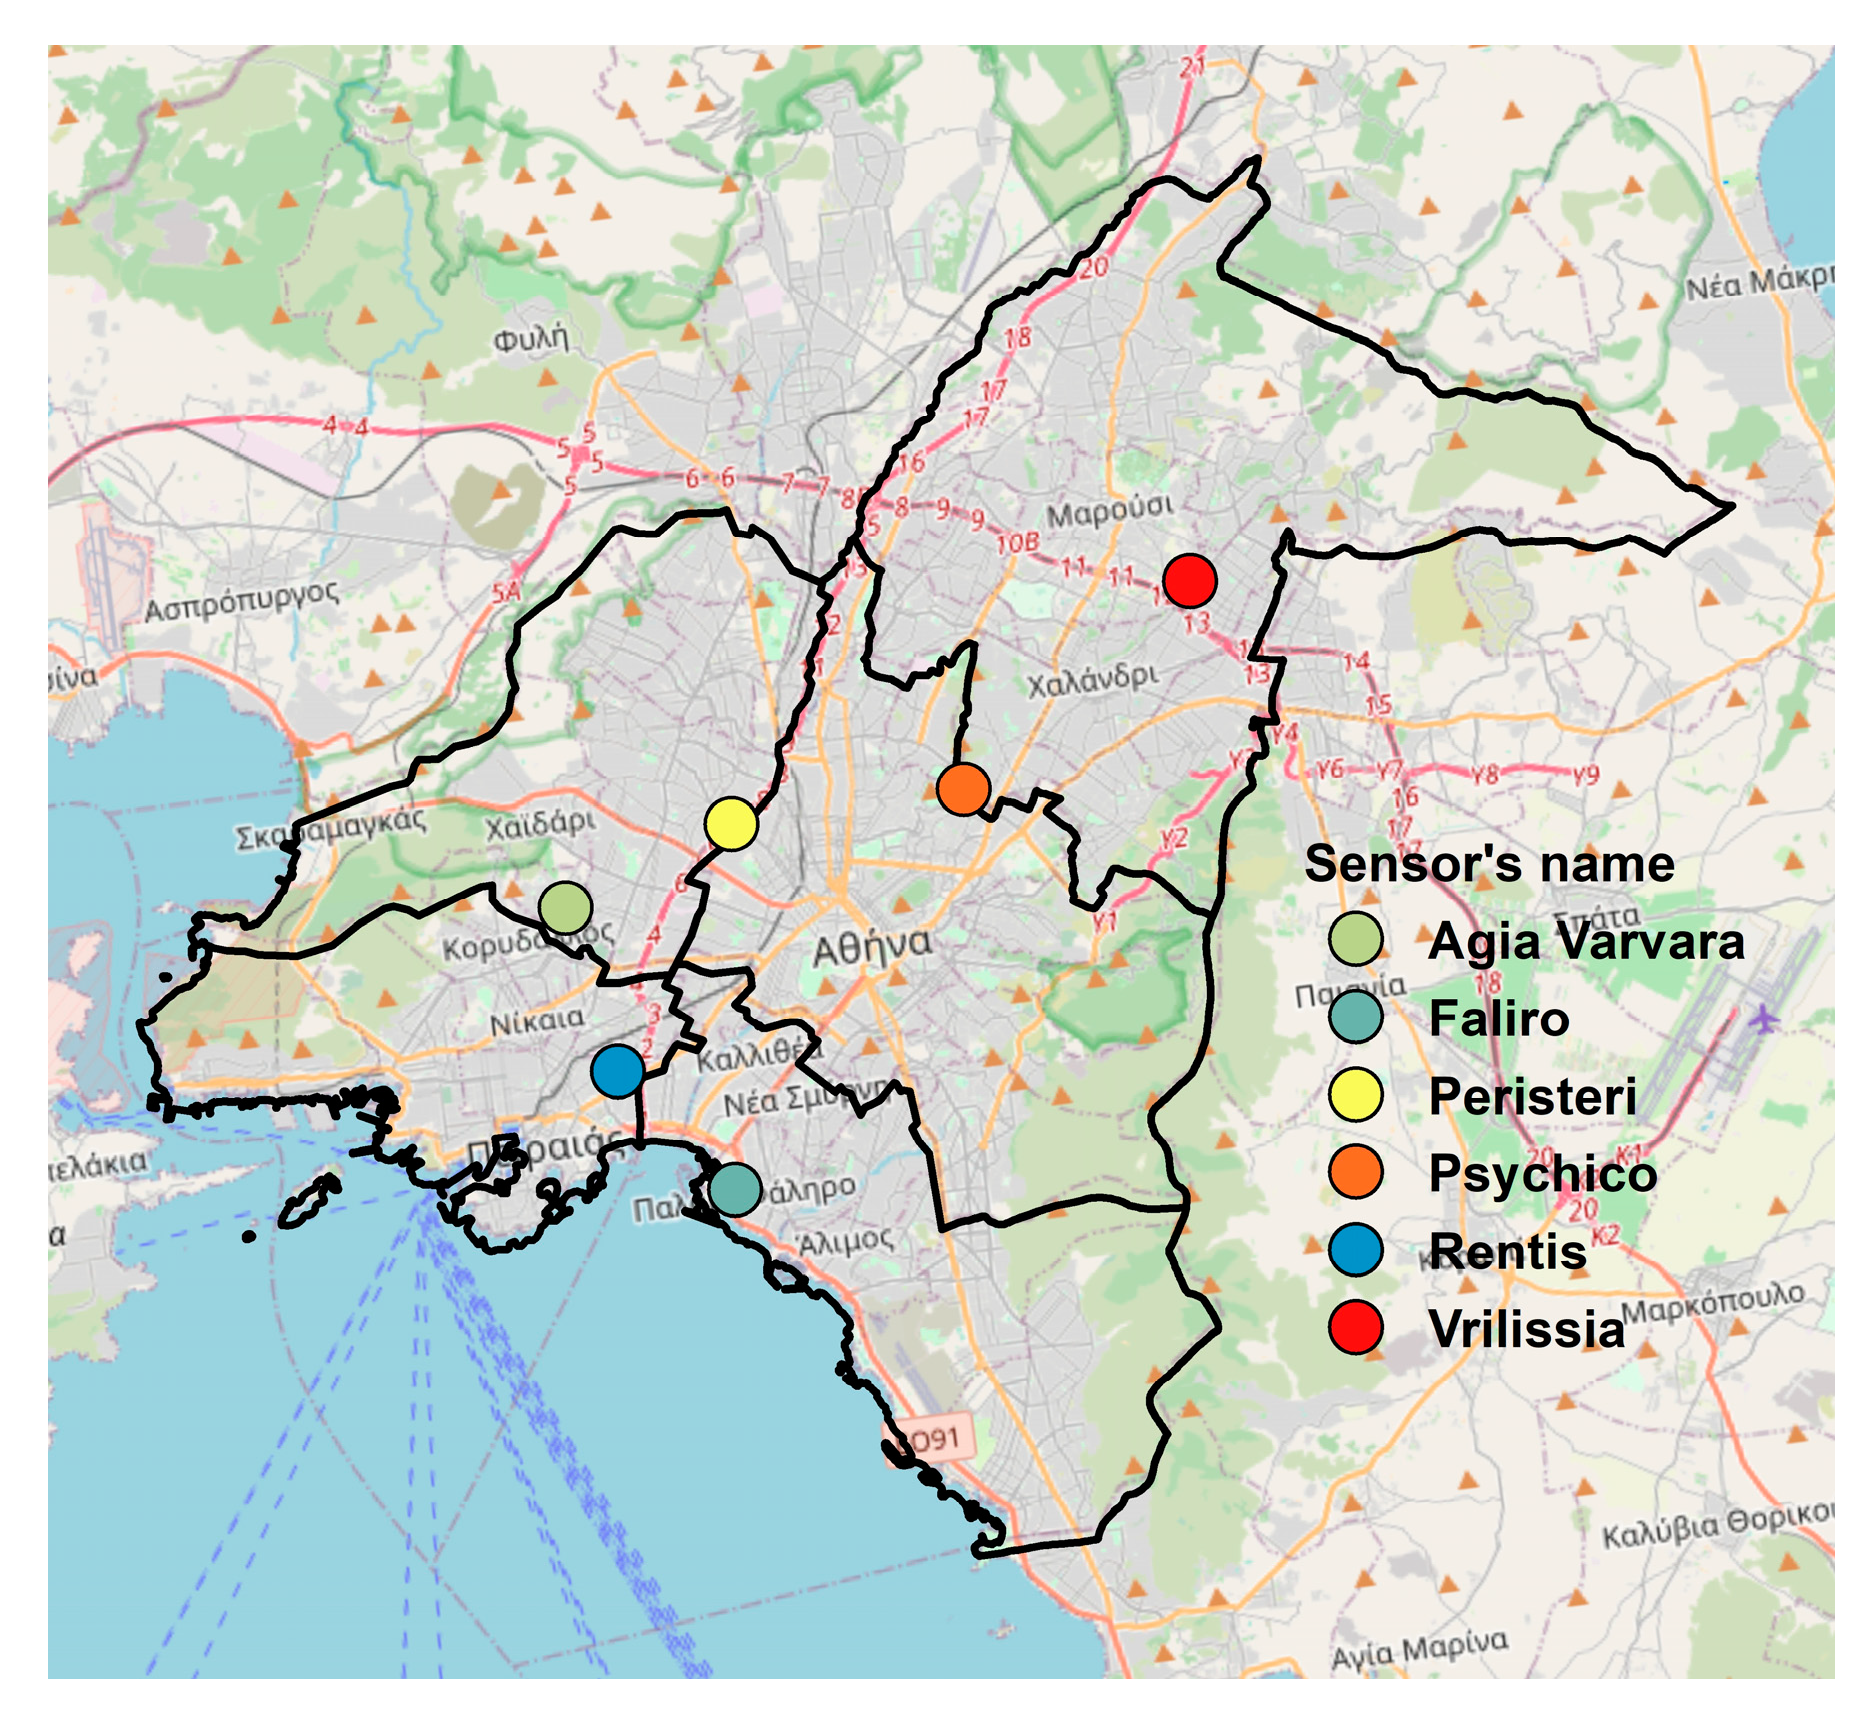
2.1. Instrumentation and Measuring Sites

Six low-cost PurpleAir sensors were deployed at schools, public buildings, and private residences within five regional units of the GAA (Figure 1) to cover the different characteristics of each area. The operation of PurpleAir sensors is based on the monitoring of the PM concentrations through the detection of a sample of air through a laser beam. The device has two Plantower PMS5003 sensors, labelled as channel A and B. A built-in fan draws air and particles into the measurement chamber in each sensor. The reflection of the laser beam by the particles to a detection plate is measured as a pulse. Afterwards, the output signal (practically the length of the pulse) is used to calculate the PM1, PM2.5, and PM10 concentrations in µg/m3. The values are provided to the user without any correction, labelled CF = 1, and with the application of a proprietary algorithm developed by Plantower Ltd. (Nanchang, China), labelled as CF = atm. In the present study, the PM2.5 CF = 1 values were used, which were corrected by applying Equation (1), as proposed by [8]:
PM2.5cor = 9.32 + 0.464 × PM2.5(CF = 1) − 0.0574 × RH,
where PM2.5cor is the corrected PM2.5 concentrations, PM2.5 (CF = 1) is the average concentration of the values measured by channel A and channel B and RH is the relative humidity measured with the sensor. It should be noted that temperature, humidity, and pressure data are also recorded by the PurpleAir sensor. Data for the year 2022 were selected as a post-COVID-19 period with no restrictions.

2.2. FEI-GREGAA Emissions Inventory

The Urban Environmental Sustainability Group (UESG) of the National Observatory of Athens has developed the Flexible Emission Inventory for Greece and the Greater Athens Area (FEI-GREGAA), a database of anthropogenic emissions from multiple anthropogenic activities (road transport, navigation, aviation, residential heating, commercial cooking, agriculture and industry) mapped at a 2 × 2 km2 grid for Greece and 1 × 1 km2 grid for the region of Attica [9,10,11]. It has been created in a geographic information system according to the methodology proposed by the European Environment Agency, following bottom-up/top-down approaches depending on the type of source, and using data from official sources (Ministries, Hellenic Statistical Authority, Eurostat). The database covers the period 2006–2019 and is updated on a continuous basis.

3. Results and Discussion

3.1. FEI-GREGAA PM2.5 Emissions

As presented in Table 1, PM2.5 emissions from road transport are higher in Peristeri, while emissions from residential heating are more significant in urban areas. This is due to differences in population density and type of activity. In Vrilissia, biomass burning is preferable as a fuel for residential heating; however, the sensor is located close to the local market, an area having very few residences, that is why the PM2.5 emissions are very low compared to the rest of the cells. Concerning the monthly profile of emissions at Peristeri (Figure 2), it is obvious that higher values from residential heating are attributed in winter, while the values from road transport are almost equally distributed throughout the year. Less emissions are seen in August due to the decrease in traffic because of the summer holidays.

3.2. PM2.5 Measurements

The main statistical parameters of the PM2.5 measurements are presented in Table 2. The highest annual mean values are found in Peristeri, which is located close to the main urban highway of Athens (Kifissos Highway), and in Rentis, a mixed industrial/urban area. More specifically, during the morning (7.30–9.30 LT) and the afternoon (6.30–18.30 LT) rush hours, large traffic jams occur on the National Highway, especially in the area around the site, resulting in stagnant and low-speed vehicles and consequently higher exhaust emissions. The maximum value of 230 μg/m3 was recorded in January. The air quality in Rentis is quite poor since small industries operate in the surrounding area. In addition the existence of the National Highway, the Athinon–Piraeus Avenue as well as two shopping centres further aggravate the problem. Moreover, under favourable meteorological conditions (low wind, temperature inversion, sea breeze), emissions from activities at the nearby port of Piraeus (ships arrivals/departures, vehicles moving from/to the port) can affect the local air quality. The sensor in Faliro is located on the roof of a school that is very close to the coast; thus, it is affected by the sea breeze during the summer. In winter, emissions from residential heating, in combination with the densely built high buildings and the narrow streets that prevent the adequate dispersion of pollutants, lead to increased concentrations being recorded in the evening (max. value on 29 January at 01.00 LT, 199.93 μg/m3). Similarly, in Vrilissia, the highest values were found during winter (mean value 20.55 μg/m3, Figure 3) in the evening, earlier than the rest of the sites (from 20.00 to 22.00 LT). This is because the municipality of Vrilissia is at the North Athens regional unit, so the temperature is lower compared to the other sites, and citizens heat their residences earlier in the day. It is characterised by low population density; however, the biomass burning is very popular, leading to high particulate emissions. Lower concentrations are recorded in Agia Varvara (West Athens) and Psychiko (Central Athens) since both sites are located at medium-population-density areas, mainly affected by heating and traffic without any other important pollution sources.
Concerning the seasonal variation of PM2.5 concentrations (Figure 2), one can observe two obvious patterns. The first one is that values peaked during winter (December–February) at all sites, with spikes being recorded in January for Peristeri, Rentis and Faliro in the evening. This is due to the emissions from residential heating and the prevalence of meteorological conditions that prevent pollutant dispersions (e.g., temperature inversions and lower-boundary layer height). The second pattern is the small range of values in summer (from 3.63 μg/m3 in Vrilissia to 33.5 μg/m3 in Peristeri). It should be mentioned that the lower values were recorded in July. Increased values are also recorded in May, probably due to the occurrence of Sahara dust events as well as the dispersion of natural particles.

4. Conclusions

PM2.5 measurements from six low-cost sensors located at different areas within the GAA were examined for the year 2022 to reveal possible seasonal trends. Higher values were found during wintertime under the prevalence of traffic and residential heating emissions (wood burning). The sensor located close to the Kifissos Highway (Peristeri) recorded the highest values, followed by the sensor in a mixed industrial–urban area (Rentis), which is also affected by the port activities (ships arrivals/departures, traffic) taking place around the largest Greek port of Piraeus.

Author Contributions

Conceptualisation, K.-M.F. and V.A.; methodology, K.-M.F. and V.A.; validation, K.-M.F. and V.A.; data analysis, K.-M.F., K.D. and V.A.; writing—original draft preparation, K.-M.F., K.D. and V.A.; visualisation, K.-M.F.; supervision, K.-M.F.; project administration, K.-M.F. All authors have read and agreed to the published version of the manuscript.

Funding

This research was co-funded by the project “Observatory of Air and Particulate Pollution over Greece (Acronym: AirPaP)” (Hellenic Foundation for Research and Innovation (HFRI) and the General Secretariat for Research and Innovation (GSRI), under grant agreement No. 409) and the research exploitation programme of the National Observatory of Athens (number: 8017).

Institutional Review Board Statement

Not applicable.

Informed Consent Statement

Not applicable.

Data Availability Statement

Data are available upon request.

Conflicts of Interest

The authors declare no conflict of interest.

References

  1. European Environmental Agency. Air Quality in Europe 2022. 2022. Available online: https://www.eea.europa.eu/publications/europes-air-quality-status-2023 (accessed on 30 May 2023).
  2. EU. Directive 2008/50/EC of the European Parliament and of the Council of 21 May 2008 on Ambient Air Quality and Cleaner Air for Europe. Off. J. Eur. Union 2008. Available online: https://eur-lex.europa.eu/legal-content/en/ALL/?uri=CELEX%3A32008L0050 (accessed on 1 June 2023).
  3. Ministry of the Environment and Energy. Annual Report on Air Quality. June 2022. Available online: https://ypen.gov.gr/wp-content/uploads/2022/07/%CE%95%CE%9A%CE%98%CE%95%CE%A3%CE%97-2021.pdf (accessed on 1 June 2023). (In Greek)
  4. Liu, H.; Tian, H.; Zhang, K.; Liu, S.; Cheng, K.; Yin, S.; Liu, Y.; Liu, X.; Wu, Y.; Liu, W.; et al. Seasonal variation, formation mechanisms and potential sources of PM2.5 in two typical cities in the Central Plains Urban Agglomeration, China. Sci. Total Environ. 2019, 657, 657–670. [Google Scholar] [CrossRef] [PubMed]
  5. Ren, Y.; Wei, J.; Wu, Z.; Ji, Y.; Bi, F.; Gao, R.; Wang, X.; Wang, G.; Li, H. Chemical components and source identification of PM2.5 in non-heating season in Beijing: The influences of biomass burning and dust. Atmos. Res. 2021, 251, 105412. [Google Scholar] [CrossRef]
  6. Florou, K.; Papanastasiou, D.K.; Pikridas, M.; Kaltsonoudis, C.; Louvaris, E.; Gkatzelis, G.I.; Patoulias, D.; Mihalopoulos, N.; Pandis, S.N. The contribution of wood burning and other pollution sources to wintertime organic aerosol levels in two Greek cities. Atmos. Chem. Phys. 2017, 17, 3145–3163. [Google Scholar] [CrossRef]
  7. Kosmopoulos, G.; Salamalikis, V.; Matrali, A.; Pandis, S.N.; Kazantzidis, A. Insights about the Sources of PM2.5 in an Urban Area from Measurements of a Low-Cost Sensor Network. Atmosphere 2022, 13, 440. [Google Scholar] [CrossRef]
  8. Stavroulas, I.; Grivas, G.; Michalopoulos, P.; Liakakou, E.; Bougiatioti, A.; Kalkavouras, P.; Fameli, K.M.; Hatzianastassiou, N.; Mihalopoulos, N.; Gerasopoulos, E. Field evaluation of low-cost PM sensors (Purple Air PA-II) Under variable urban air quality conditions, in Greece. Atmosphere 2020, 11, 926. [Google Scholar] [CrossRef]
  9. Fameli, K.M.; Assimakopoulos, V.D. The new open Flexible Emission Inventory for Greece and the Greater Athens Area (FEI-GREGAA): Account of pollutant sources and their importance from 2006 to 2012. Atmos. Environ. 2016, 137, 17–37. [Google Scholar] [CrossRef]
  10. Fameli, K.M.; Papagiannaki, K.; Kotroni, V. Optimizing the knowledge on residential heating characteristics in Greece via crowd-sourcing approach. Atmosphere 2021, 12, 1178. [Google Scholar] [CrossRef]
  11. Fameli, K.M.; Kladakis, A.; Assimakopoulos, V.D. Inventory of Commercial Cooking Activities and Emissions in a Typical Urban Area in Greece. Atmosphere 2022, 13, 792. [Google Scholar] [CrossRef]
Figure 1. The area of interest and the location of the six PurpleAir sensors.
Environsciproc 26 00124 g001
Figure 2. The monthly variation of PM2.5 emissions at Peristeri.
Environsciproc 26 00124 g002
Figure 3. Seasonal box plots of hourly PM2.5 concentrations from the six sites.
Environsciproc 26 00124 g003aEnvironsciproc 26 00124 g003b
Table 1. Annual PM2.5 emissions from the FEI-GREGAA for road transport and residential heating at the six measuring sites.
PM2.5 Emissions (Tonnes/Cell/y)
road transportresidential heating
Faliro2.078.53
Rentis2.2615.05
Agia Varvara0.9210.01
Peristeri4.0910.41
Psychico0.672.45
Vrilissia1.372.02
Table 2. Statistical analysis of the PM2.5 concentrations (in μg/m3) measured using the PurpleAir sensors located at six sites in the GAA (all values in μg/m3).
StatisticStd. Error StatisticStd. Error
FaliroMean16.21390.15748PsychikoMean14.73330.0991
Median12.32 Median12.4332
Std. Deviation14.30867 Std. Deviation9.0042
Min3.38 Min3.69
Max199.93 Max125.85
Agia VarvaraMean15.60370.12493VrilissiaMean13.74380.13575
Median12.7309 Median10.549
Std. Deviation11.35175 Std. Deviation12.33443
Min3.64 Min3.42
Max155.36 Max180.87
RentisMean16.92710.16353PeristeriMean17.66350.17582
Median12.8685 Median13.1665
Std. Deviation14.85881 Std. Deviation15.97523
Min3.63 Min3.64
Max193.31 Max230.15
Disclaimer/Publisher’s Note: The statements, opinions and data contained in all publications are solely those of the individual author(s) and contributor(s) and not of MDPI and/or the editor(s). MDPI and/or the editor(s) disclaim responsibility for any injury to people or property resulting from any ideas, methods, instructions or products referred to in the content.

