1. Introduction
Maintaining IAQ is vital for people’s well-being and comfort. It can be affected by several factors, including the rate of ventilation, air distribution patterns, and pollution sources. To achieve acceptable IAQ, the World Health Organization (WHO) has recommended a list of pollutants [
1]; however, this paper will focus on only one pollutant from the list, PM
2.5. While there has been increasing concern about the impact of atmospheric PM on human health, resulting in stricter regulations for controlling ambient air quality, similar awareness for indoor environments has not been achieved [
2,
3,
4,
5]. This is alarming, considering that people, especially in urban areas, spend more than 80% of their time indoors in homes, offices, schools, transportation, and other gathering places [
6]. Furthermore, several studies have shown that air pollution can be the cause of asthma, respiratory disease, chronic bronchitis and even heart disease [
7,
8,
9].
The rising concern for the health effects of air pollution has led to the development of low-cost sensors that can be used in residential environments to monitor the IAQ of one’s home. PurpleAir is a community-based system that utilizes low-cost sensors to measure PM of different sizes, including PM
1.0, PM
2.5 and PM
10. The PurpleAir system relies on a decentralized approach, where community members take responsibility for installing, operating, and maintaining the sensors. This distributed model facilitates a broader coverage of monitoring locations and engages local communities in actively contributing to air quality data collection [
9,
10,
11]. It should be noted that the measurements of PurpleAir sensors cannot be used for assessing ambient concentration levels as they may have limitations and may not provide entirely accurate results for evaluating regulatory compliance with air quality standards. However, after undergoing calibration they can be utilized to offer realistic ambient concentration levels [
7,
12,
13].
This paper assesses the air pollution levels of a residence located in central Athens using data from PurpleAir’s low-cost sensors. For this reason, the AQI was calculated. The results highlight the need for the development of combined strategies and for enabling occupants to use ventilation systems aiming to achieve optimum air quality.
2. Area of Study
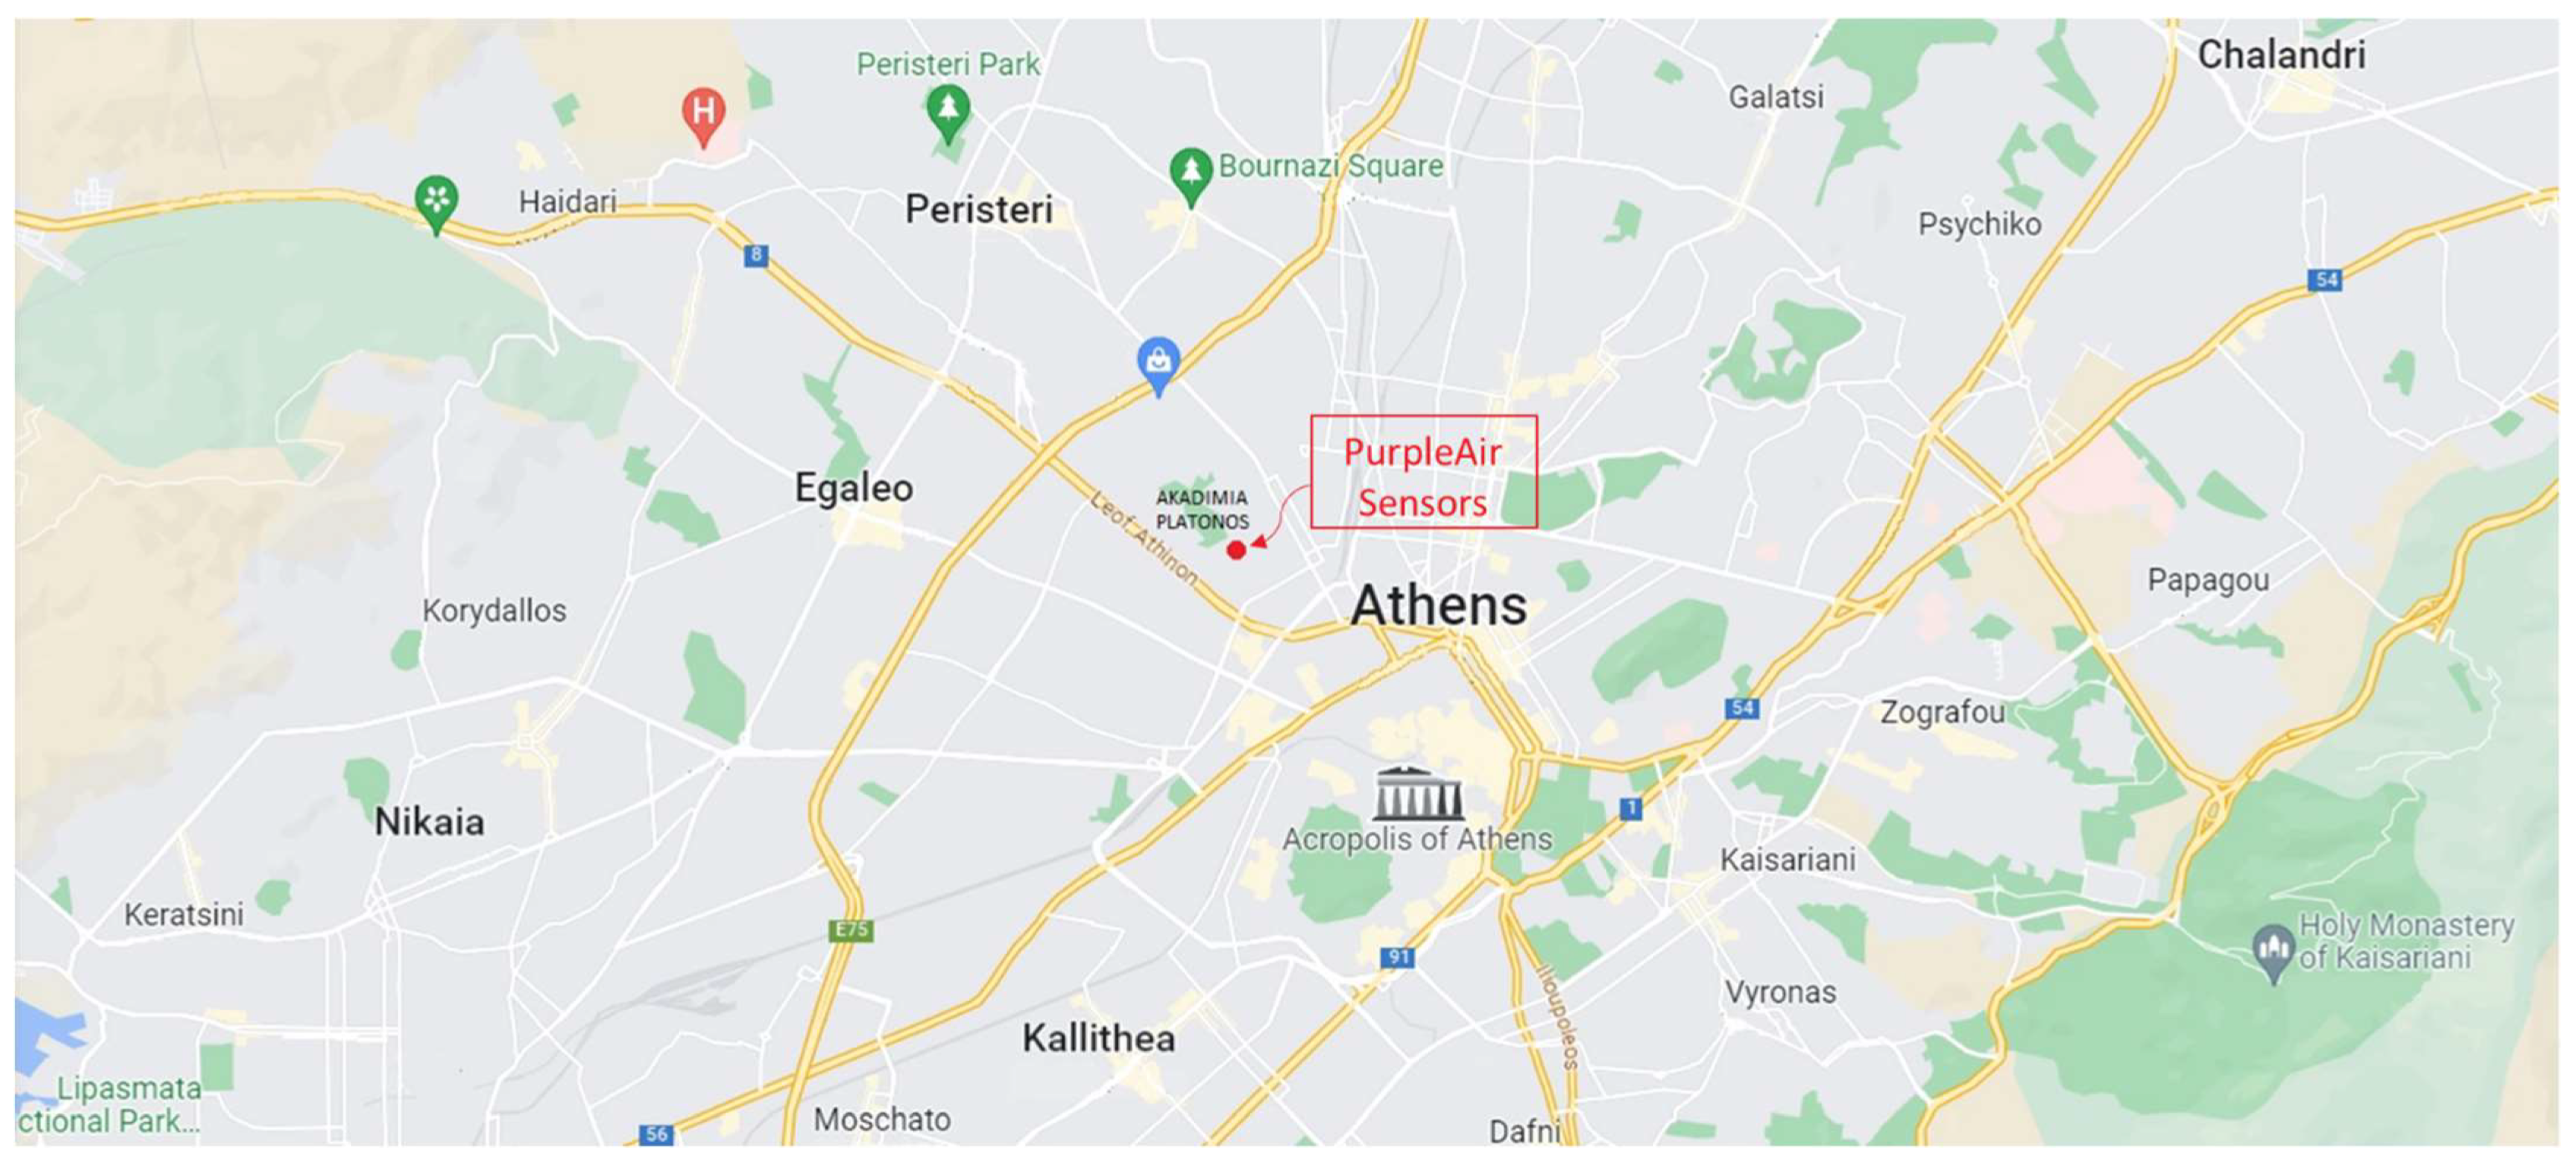
The residential building under study, as seen in
Figure 1, is located in central Athens approximately 1.5 km from Metaxourgio, 3.5 km from Syntagma, 850 m from the park Academy of Plato and near two avenues. The climate is Mediterranean, with mild, moderately rainy winters and hot, sunny summers. Summers in Athens are characterized by hot, dry, and clear weather conditions, whereas winters tend to be long, cold, windy, and partly cloudy. The hot season spans approximately three months, starting from 10 June and ending on September 12 with an average daily high temperature that exceeds 29.4 °C. The cool season extends for approximately four months, starting from November 24 and ending on 27 March with an average daily high temperature that remains below 16.7 °C [
14].
3. Materials and Methods
3.1. Instrumentention
The monitoring of the residence was executed with the help of two PurpleAir Classic Air Quality Monitors (PA-II). To facilitate a comparison between the indoor and outdoor environment, one sensor was installed inside the residence and one outside on the balcony. They are equipped with an electronic two-channel data recording system that facilitates the collection of data that can later be uploaded to the cloud or stored in an SD card. By means of dual laser counters (PMS-5003), the sensors monitor the PM concentrations in real time [
11,
15]. The PM measurements are then utilised in the estimation of the PM
1.0, PM
2.5 and PM
10 concentrations, and two data series are generated (CF1 and ATM) [
16]. In this study, all the calculations were performed with the use of the CF1 data.
3.2. Data Calibration
As mentioned in the
Section 1, before any calculations are attempted, the measurements should be calibrated. Various studies have found significant correlations between the measurements of Plantower PMS sensors and reference monitors, indicating their capability to provide reliable data as well as also identified biases associated with relative humidity and elevated levels of ambient PM [
12,
13,
17,
18,
19,
20]. As a result, different approaches were proposed in order to address and correct the concentration outputs of the sensors. The data of the current study are from September 2021 to September 2022 and have been calibrated using the following equation [
12].
where
is the average of the
measurements from the two data series.
3.3. Air Quility Index Calculation
The AQI calculation was based on the following equation [
21]:
where
is the input concentration for a given pollutant, in this case PM
2.5,
is the concentration breakpoint that is less that or equal to
,
is the concentration breakpoint that is greater than or equal to
,
is the AQI value/breakpoint corresponding to
, and
is the AQI value/breakpoint corresponding to the
. The numbers used for the calculations are presented in
Table 1.
4. Results
The number AQI exudences and their percentage in the data set are presented in
Table 2. It is evident that even though the residence is in an urban area and near two avenues, the air quality for the most part is within the boundaries of “Good” and “Moderate”. Notably, the difference between indoors and outdoors is minimal but not nonexistent. There is a 1.9% difference in the “Unhealthy for Sensitive Groups” category and a 2.4% difference in the “Unhealthy” category as well as the appearance of “Very Unhealthy” and “Hazardous” outdoors. Another important contrast is the appearance of more “Moderate” values indoors rather than outdoors, representing a difference of 5.2%. This is also apparent in
Figure 2a, though further elaboration on this matter will be provided in the following section. The differences might be minute, but it is apparent that the air quality is better indoors.
The monthly, daily and hourly average of the AQI for PM
2.5 is depicted in
Figure 2a–c, accordingly. For the monthly average, one can observe that the average outdoor AQI is higher than the indoor one during autumn and winter, but the opposite is true for two out of the three spring months as well as during the summer. The paradox occurring during the hot months can be attributed to the air conditioning and the poor ventilation of the residence due to the high temperatures that prevent the home owners from opening the windows. Regarding the winter months, it is evident that the average outdoor AQI is significantly higher than indoors. The cause of this is the smoke that pollutes the atmosphere from the use of fireplaces. The notable disparity observed in March could potentially be caused by an increase in pollen levels.
In terms of the daily average, there is no day when the indoor average exceeds the outdoor average. However, there is an increase in both indoor and outdoor measurements during the weekend. To draw accurate conclusions, simultaneous recordings would be necessary to account for whether someone is at home or not. It is possible that the owners of the residence are home more hours in the weekends and that there might generally be more traffic around the area.
With respect to the hourly average, it is noteworthy to highlight the differences observed between indoors and outdoors in the morning and afternoon, as well as in the evening and early hours of the night. For the morning hours, one can see that the indoor average is higher than the outdoor average around the time people commence their daily activities. The ambient atmosphere is disrupted, as activity resumes within the house. When the occupants of the residence leave for work, the house remains closed, resulting in the indoor pollution levels remaining elevated until the typical end of the workday. Regarding the evening and night hours, as stated before, the occupants return and ventilate the house. Subsequently, activities gradually diminish as the day comes to an end, and the occupants go to sleep.
5. Conclusions
The Air Quality Index was calculated with PM2.5 measurements from low-cost PurpleAir sensors for an urban residence in central Athens. The data covered the time span from September 2021 to September 2022. The significantly higher indoor AQI values during the hot months of the year and the morning hours of the day emphasize the importance of implementing comprehensive strategies and enabling occupants to utilize ventilation systems in order to attain optimal air quality. Subsequent research will incorporate the significance of thermal comfort in conjunction with IAQ.
Lastly, it should be mentioned that low-cost air pollution sensors have become increasingly valuable for real-time and localized air quality monitoring. In the past, government agencies relied on expensive and intricate equipment to conduct air quality monitoring, resulting in limited data availability for only a few selected areas. Fortunately, the advent of low-cost sensors has revolutionized the field, offering affordable and user-friendly solutions for monitoring air quality. These sensors have broadened the scope of monitoring by making it possible to assess air quality in numerous locations at a reduced cost.
Author Contributions
Conceptualization, G.S.; methodology, M.-L.N. and G.S.; formal analysis, M.-L.N. and G.S.; investigation, M.-L.N. and G.S.; resources, G.S.; data curation, M.-L.N. and G.S.; writing—original draft preparation, M.-L.N.; writing—review and editing, M.-L.N. and G.S.; visualization, M.-L.N. and G.S.; supervision, G.S. All authors have read and agreed to the published version of the manuscript.
Funding
This research received no external funding.
Institutional Review Board Statement
Not applicable.
Informed Consent Statement
Not applicable.
Data Availability Statement
The data presented in this study are available on request from the corresponding author.
Conflicts of Interest
The authors declare no conflict of interest.
References
- World Health Organization. WHO Guidelines for Indoor Air Quality: Selected Pollutants. 2010. Available online: https://apps.who.int/iris/handle/10665/260127 (accessed on 27 April 2023).
- WHO Global Air Quality Guidelines: Particulate Matter (PM2.5 and PM10), Ozone, Nitrogen Dioxide, Sulfur Dioxide and Carbon Monoxide. Available online: https://www.who.int/publications-detail-redirect/9789240034228 (accessed on 12 May 2023).
- World Health Organization. WHO Air Quality Guidelines for Particulate Matter, Ozone, Nitrogen Dioxide and Sulfur Dioxide: Global Update 2005: Summary of Risk Assessment. Available online: https://apps.who.int/iris/handle/10665/69477 (accessed on 13 May 2023).
- Directive 2008/50/EC of the European Parliament and of the Council of 21 May 2008 on Ambient Air Quality and Cleaner Air for Europe. Available online: http://data.europa.eu/eli/dir/2008/50/oj/eng (accessed on 12 May 2023).
- Spyropoulos, G.; Nastos, P.; Moustris, K.; Chalvatzis, K. Transportation and Air Quality Perspectives and Projections in a Mediterranean Country, the Case of Greece. Land 2022, 11, 152. [Google Scholar] [CrossRef]
- Tofful, L.; Canepari, S.; Sargolini, T.; Perrino, C. Indoor air quality in a domestic environment: Combined contribution of indoor and outdoor PM sources. Build. Environ. 2021, 202, 108050. [Google Scholar] [CrossRef]
- Spyropoulos, G.; Nastos, P.; Moustris, K. Performance of Aether Low-Cost Sensor Device for Air Pollution Measurements in Urban Environments. Accuracy Evaluation Applying the Air Quality Index (AQI). Atmosphere 2021, 12, 1246. [Google Scholar] [CrossRef]
- Nastos, P.T.; Matzarakis, A. Weather impacts on respiratory infections in Athens, Greece. Int. J. Biometeorol. 2006, 50, 358–369. [Google Scholar] [CrossRef] [PubMed]
- Ntourou, K.; Moustris, K.; Spyropoulos, G.; Fameli, K.-M.; Manousakis, N.M. Adverse Health Effects (Bronchitis Cases) Due to Particulate Matter Exposure: A Twenty-Year Scenario Analysis for the Greater Athens Area (Greece) Using the AirQ+ Model. Atmosphere 2023, 14, 389. [Google Scholar] [CrossRef]
- Mojave Desert Air Quality Management District. PurpleAir—Community Sensor Map. Available online: https://www.mdaqmd.ca.gov/air-quality/purple-air-community-monitor-map (accessed on 30 May 2023).
- PurpleAir Community. What Do Purpleair Sensors Measure, and How Do They Work? Available online: https://community.purpleair.com/t/what-do-purpleair-sensors-measure-and-how-do-they-work/3499 (accessed on 12 May 2023).
- Stavroulas, I.; Grivas, G.; Michalopoulos, P.; Liakakou, E.; Bougiatioti, A.; Kalkavouras, P.; Fameli, K.M.; Hatzianastassiou, N.; Mihalopoulos, N.; Gerasopoulos, E. Field Evaluation of Low-Cost PM Sensors (Purple Air PA-II) Under Variable Urban Air Quality Conditions, in Greece. Atmosphere 2020, 11, 926. [Google Scholar] [CrossRef]
- Zheng, T.; Bergin, M.H.; Johnson, K.K.; Tripathi, S.N.; Shirodkar, S.; Landis, M.S.; Sutaria, R.; Carlson, D.E. Field evaluation of low-cost particulate matter sensors in high- and low-concentration environments. Atmos. Meas. Tech. 2018, 11, 4823–4846. [Google Scholar] [CrossRef]
- Athens Climate, Weather By Month, Average Temperature (Greece)—Weather Spark. Available online: https://weatherspark.com/y/89228/Average-Weather-in-Athens-Greece-Year-Round (accessed on 30 May 2023).
- PurpleAir, Inc. PurpleAir Classic Air Quality Monitor. Available online: https://www2.purpleair.com/products/purpleair-pa-ii (accessed on 31 May 2023).
- Wallace, L.; Bi, J.; Ott, W.R.; Sarnat, J.; Liu, Y. Calibration of low-cost PurpleAir outdoor monitors using an improved method of calculating PM2.5. Atmos. Environ. 2021, 256, 118432. [Google Scholar] [CrossRef]
- Feenstra, B.; Papapostolou, V.; Hasheminassab, S.; Zhang, H.; Der Boghossian, B.; Cocker, D.; Polidori, A. Performance evaluation of twelve low-cost PM2.5 sensors at an ambient air monitoring site. Atmos. Environ. 2019, 216, 116946. [Google Scholar] [CrossRef]
- Spyropoulos, G.; Nastos, P.; Moustris, K.; Katopodis, T. The use of low-cost sensing for air pollution measurements in urban outdoor environments. In Proceedings of the 14th International Conference on Meteorology, Climatology and Atmospheric Physics (COMECAP), Alexandroupolis, Greece, 15–17 October 2018. [Google Scholar]
- Zamora, M.L.; Xiong, F.; Gentner, D.; Kerkez, B.; Kohrman-Glaser, J.; Koehler, K. Field and Laboratory Evaluations of the Low-Cost Plantower Particulate Matter Sensor. Environ. Sci. Technol. 2019, 53, 838–849. [Google Scholar] [CrossRef] [PubMed]
- Wang, Z.; Calderón, L.; Patton, A.P.; Sorensen Allacci, M.; Senick, J.; Wener, R.; Andrews, C.J.; Mainelis, G. Comparison of real-time instruments and gravimetric method when measuring particulate matter in a residential building. J. Air Waste Manag. Assoc. 2016, 66, 1109–1120. [Google Scholar] [CrossRef]
- AirNow Discussion Forum. The AQI Equation—Air Quality and AQI Info. Available online: https://forum.airnowtech.org/t/the-aqi-equation/169 (accessed on 13 May 2023).
- Britannica Dictionary. Parts of the Day: Early Morning, Late Morning, Etc. Available online: https://www.britannica.com/dictionary/eb/qa/parts-of-the-day-early-morning-late-morning-etc (accessed on 31 May 2023).
| Disclaimer/Publisher’s Note: The statements, opinions and data contained in all publications are solely those of the individual author(s) and contributor(s) and not of MDPI and/or the editor(s). MDPI and/or the editor(s) disclaim responsibility for any injury to people or property resulting from any ideas, methods, instructions or products referred to in the content. |
© 2023 by the authors. Licensee MDPI, Basel, Switzerland. This article is an open access article distributed under the terms and conditions of the Creative Commons Attribution (CC BY) license (https://creativecommons.org/licenses/by/4.0/).


