1. Introduction
Pieria in Central Macedonia is an area frequently affected by extreme weather phenomena such as severe storms, frosts and floods. That was one of the main reasons to choose Pieria region to conduct the “Agroray” project (entitled “Development of a forecasting system and geographical indicators for agriculture”). The “Agroray” project aims at developing an integrated information system for farmers with high-spatial-resolution local weather forecasting, adapted to the needs of each crop and the particular climatic and topographical characteristics of the area. Via the “Agroray” project, a high-resolution NWP system is being developed for the area, based on the non-hydrostatic WRF model, that produces operational forecasts. Accurate forecasting of weather conditions implies direct economic benefits for agriculture through improved production efficiency, as well as reduced costs of fertilization, irrigation, energy needs and pesticides. More about the “Agroray” project can be found at [
1].
This study aims to understand and analyze the synoptic mechanisms that are responsible for producing heavy rainfall over the area. Similarities in structure, intensity and behavior of synoptic patterns are identified and numerical simulations of the events are performed.
Several observational and/or modeling studies of heavy precipitation events have been carried out over the Greek area by [
2,
3,
4,
5,
6,
7]. Extreme precipitation events offer a unique context for investigating the performance of numerical weather prediction models.
2. Data and Methodology
This study uses upper air weather charts taken from the University of Wyoming “
http://weather.uwyo.edu, accessed on 3 March 2023” and surface analysis retrieved from the U.K. Met Office “
https://www.wetter3.de/archiv_ukmet_dt.html, accessed on 3 March 2023”. Daily surface observations from all available automatic weather stations that have been operating in the area for the last 15 years were also collected and analyzed. Weather radar data were obtained from the C-band (5 cm) weather radar made by 3D s.a. “
http://www.3dsa.gr, accessed on 4 March 2023”, which is located on Mount Filyro (40.672° N, 23.014° E) northeast of Thessaloniki. The cell tracker TITAN [
8] was used for obtaining storm characteristics and the amount of precipitation using the Marshall–Palmer relationship (constant values a = 200, b = 1.3) after calibration by the Greek Agricultural Insurance Organization [
9]. Finally, numerical simulations of these extreme precipitation events were produced by the non-hydrostatic WRF-ARW (v4.3.3) weather prediction model [
10,
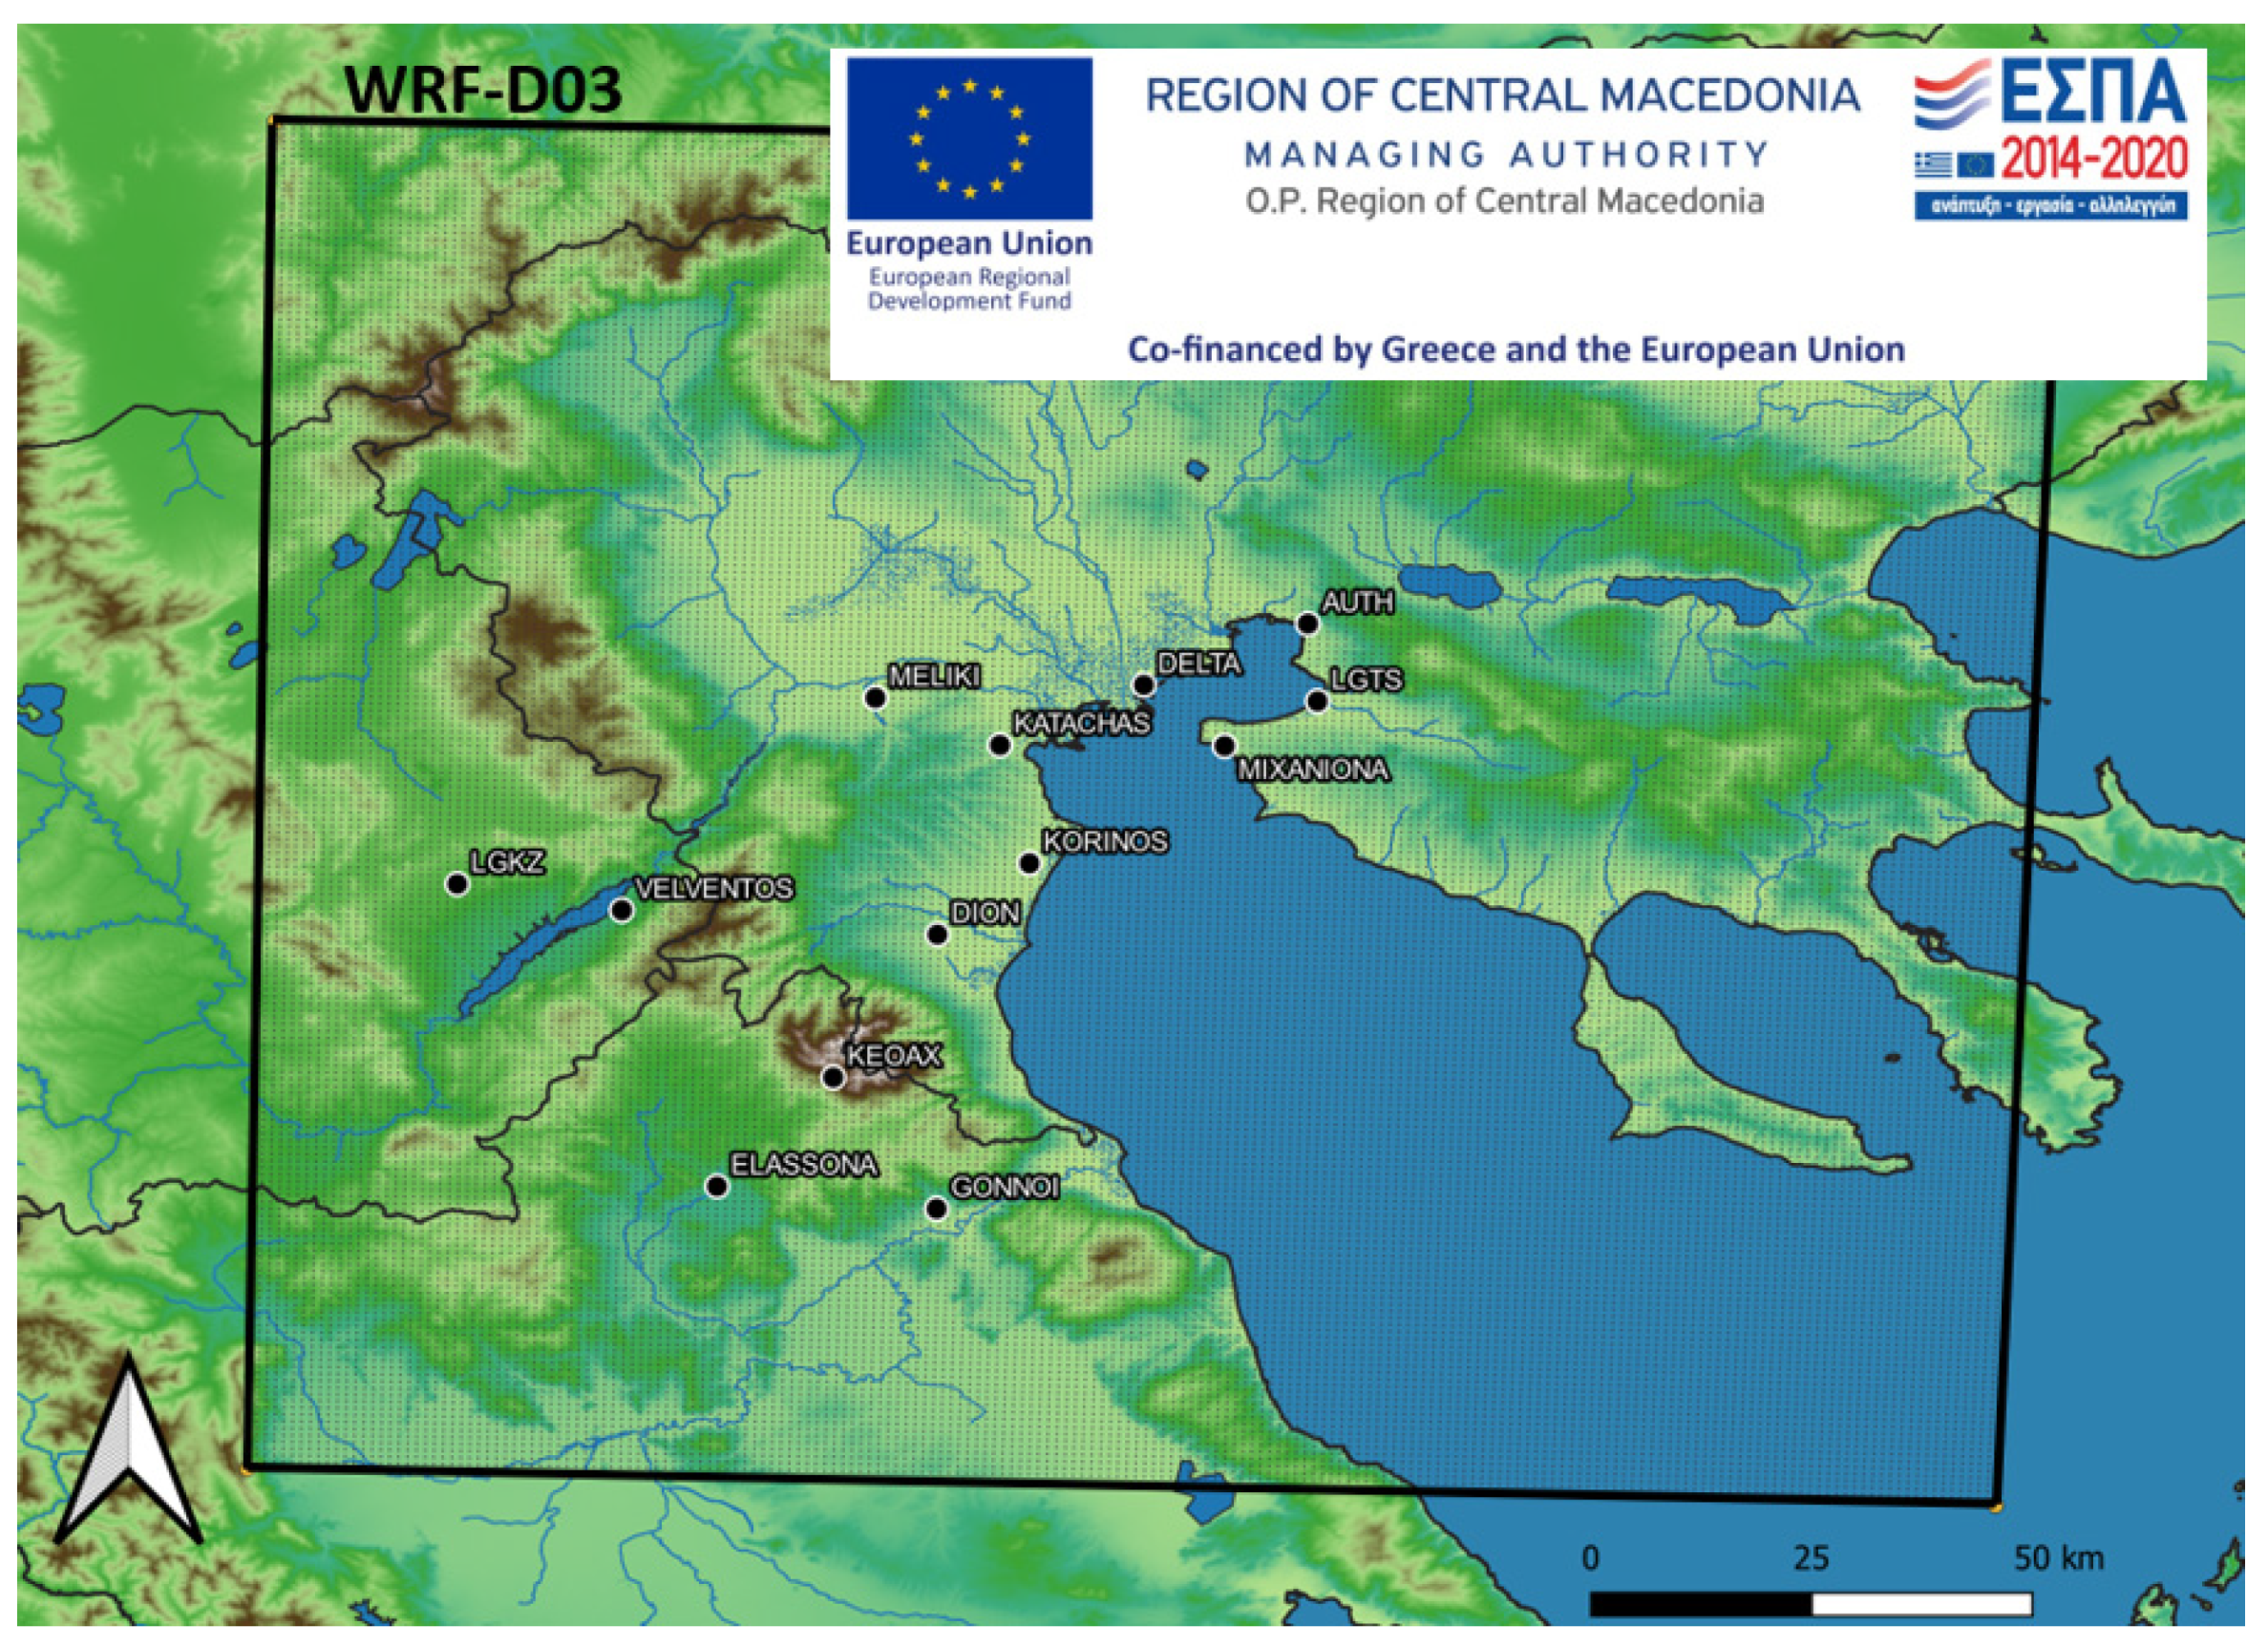
11]. Three model domains using telescoping nesting (one way) that covers Europe at 9 km grid spacing, Greece at 3 km and the area of interest at 1 km (
Figure 1) were used. The NCEP/GDAS (National Centers for Environmental Prediction/Global Data Assimilation System) analyses at 6 h intervals and 0.25° × 0.25° lat-lon resolution were used as initial and boundary conditions for the coarse domain in the numerical simulations.
The WSM6 scheme was utilized for the representation of microphysical processes and the RRTMG scheme for the treatment of longwave and shortwave radiation. The Mellor–Yamada–Janjic scheme was employed for the boundary layer and the Monin–Obukhov (Eta similarity) theory for the surface layer. Soil physics were represented by the NOAH model while deep and shallow convection was parametrized by the Kain–Fritsch scheme only in the outer domain. The USGS land cover dataset was utilized for the representation of land use in the model.
With the above model setup, four different experiments were performed using different vertical model levels. In the levs39-eta experiment the model used 39 sigma levels (up to 50 hPa) with increased resolution in the boundary layer. The levs50-wrf experiment utilized the default hybrid vertical coordinate (HVC) which is terrain-following near the ground and becomes isobaric at a user-predefined level. Here 50 vertical levels were chosen while the thickness of the lower layer (between surface and 1st model level) was set at 50 m. The levs50-wrfs experiment was similar to levs50-wrf except for the thickness of the lower layer which was set at 20 m and a higher resolution in the lower troposphere. In the levs80-wrf experiment, 80 vertical model levels were deployed with the default thickness of the lower layer (at 50 m).
3. Results
To analyze the amount of precipitation over the area, three distinct heavy precipitation events were chosen for this study from the daily surface observations database. These episodes took place on 12–13 March 2016, 15–17 November 2017 and 24–25 March 2018, respectively. The accumulated amount of precipitation recorded by the available automatic weather stations in the area is presented in
Table 1. As observed from
Table 1, precipitation exhibited significant spatial variability over the area as a result of both synoptic forcing conditions and local topographic features.
The prevailing synoptic conditions over the area in all three episodes presented remarkable similarities. In the upper troposphere, at 300 hPa, a closed low is situated over the central Mediterranean while the jet stream is located south of it (not shown).
The area of interest lies at the left exit of the jet stream being associated with upward motions and upper-level divergence. In the middle troposphere, at 500 hPa, the closed low is also present over the central Mediterranean (
Figure 2a,d,g). The area is affected by a strong southerly flow associated with this system. The low is also present and well organized at the 850 hPa level where the area of interest is affected by a southeast flow bringing warm moist air masses from the Aegean Sea (
Figure 2b,e,h). At the surface level, a low-pressure system with its center located over south Italy is present, associated with frontal activity over the area of interest. The low-level wind pattern presents a well-established southeast to northwest flow exhibiting strong low-level convergence zones over the area (
Figure 2c,f,i).
These intense precipitation events were captured by the weather radar and simulated using the WRF model. The model was able to capture these events adequately, even though discrepancies occurred regarding the intensity and the location of the precipitation maxima. A neighborhood-based technique was followed to compare the precipitation of WRF-d03 with the radar-estimated one [
1]. The equitable threat score at the threshold of 10 mm/6 h, averaged for all cases at boxes with sides of 1–61 km around each grid point and 6 h periods after the model’s spin-up period (first 12 h), is equal to 0.238, 0.236, 0.233 and 0.231 in levs50-wrfs, levs80-wrf, levs50-wrf and levs39-eta, respectively.
Figure 3 depicts the accumulated precipitation for 48 h (from 15 November 17 00:00 UTC to 16 November 17 23:59 UTC) estimated using the weather radar (
Figure 3a) and the four different model experiments (
Figure 3b–e). Most of the precipitation estimated from the radar data and simulated by all the WRF experiments appears in the western part of the domain, covering Pieria. Levs80-wrf produces smaller areas with very intense precipitation (>200 mm/48 h, 300 mm/48 h) than the other experiments, and so it is closer to the radar data.
4. Conclusions
The three most intense precipitation events from the last 15 years of daily observations by the weather stations in Pieria region were identified, and the synoptic and dynamic characteristics of these events were analyzed. The synoptic and dynamic conditions that prevailed over the area in all three episodes presented significant similarities, suggesting the strong influence of dynamical forcing in such events. The synoptic conditions indicated that strong low-level convergence zones supplemented with moist inflow from the Aegean Sea and upper-level divergence zones were present resulting in these extreme precipitation events over the area. The total amount of precipitation was also captured and calculated from weather radar data, giving an overall picture of the regional distribution of rainfall over the area. Finally, using the high-resolution non-hydrostatic WRF-ARW numerical weather prediction model, the events were simulated to test the ability of the model in reproducing the intensity and distribution of precipitation. The results indicated that the WRF model was able to capture these events adequately, even though discrepancies occurred regarding the intensity and the location of the precipitation maxima. Using several model setups with different model levels revealed good overall performance of the model.
The results of this study are useful for agricultural purposes and to prevent human and property loss from extreme weather phenomena. Further research could include more sensitivity simulations in order to investigate the effect of different model setups on the model’s performance.
Author Contributions
Conceptualization, D.B., S.K., I.P., V.K., C.S., I.T., P.Z.; Conceptualization, methodology, resources, writing—review and editing, D.B., S.K.; methodology, software, writing, visualization, S.K., I.P.; review, D.B., I.P., S.K., V.K., C.S., I.T., P.Z. All authors have read and agreed to the published version of the manuscript.
Funding
This research was carried out as part of the project «Agroray» (Project code: ΚΜΡ6-0078047) under the framework of the Action «Investment Plans of Innovation» of the Operational Program «Central Macedonia 2014–2020», that is co-funded by the European Regional Development Fund and Greece.
Institutional Review Board Statement
Not applicable.
Informed Consent Statement
Not applicable.
Data Availability Statement
The data presented in this study are available on request from the corresponding author.
Acknowledgments
We thank NCAR, NCEP, USGS, UKMO and the University of Wyoming for providing the WRF numerical model, the gridded meteorological data, the land use input data and the weather charts. The visualization was produced using NCL.
Conflicts of Interest
The authors declare no conflict of interest. The funders had no role in the design of the study; in the collection, analysis, or interpretation of data; in the writing of the manuscript; or in the decision to publish the results.
References
- Pytharoulis, I.; Kartsios, S.; Kostopoulos, V.; Spyrou, C.; Tegoulias, I.; Bampzelis, D.; Zanis, P. The high-resolution numerical weather prediction system of Agroray project. In Proceedings of the 16th International Conference on Meteorology, Climatology and Atmospheric Physics (COMECAP2023), Athens, Greece, 25–29 September 2023. [Google Scholar]
- Kallos, G.; Pytharoulis, I. Short-term predictions (weather forecasting purposes). In Encyclopedia of Hydrological Sciences; Anderson, M.G., Ed.; Wiley: London, UK, 2005; pp. 2791–2811. [Google Scholar]
- Kotroni, V.; Kallos, G.; Lagouvardos, K. Convergence zones over the Greek Peninsula and associated thunderstorm activity. Q. J. R. Meteorol. Soc. 1997, 123, 1961–1984. [Google Scholar] [CrossRef]
- Kotroni, V.; Lagouvardos, K.; Kallos, G.; Ziakopoulos, D. Severe flooding over central and southern Greece associated with pre-cold frontal orographic lifting. Q. J. R. Meteorol. Soc. 1999, 125, 967–991. [Google Scholar] [CrossRef]
- Lagouvardos, K.; Kotroni, V.; Dobricic, S.; Nickovic, S.; Kallos, G. The storm of October 21–22 1994 over Greece: Observations and model results. J. Geophys. Res. 1996, 101, 26217–26226. [Google Scholar] [CrossRef]
- Papadopoulos, A. A Regional Numerical Model with Special Capabilities in the Use of the Initial and Boundary Conditions. Ph.D. Thesis, University of Athens, Athens, Greece, 2001. [Google Scholar]
- Pytharoulis, I.; Kotsopoulos, S.; Tegoulias, I.; Kartsios, S.; Bampzelis, D.; Karacostas, T. Numerical modelling of an intense precipitation event and its associated lightning activity over northern Greece. Atmos. Res. 2016, 169, 523–538. [Google Scholar] [CrossRef]
- Dixon, M.J.; Wiener, G. TITAN: Thunderstorm identification, tracking, analysis and nowcasting: A radar-based methodology. J. Atmos. Ocean. Technol. 1993, 10, 785–797. [Google Scholar] [CrossRef]
- Sioutas, M.; Rudolph, R.C. Z–R relationships for summertime convective rainfall in northern Greece. In Proceedings of the 4th International Conference on Precipitation, Iowa City, IA, USA, 26–28 April 1993. [Google Scholar]
- Skamarock, W.C.; Klemp, J.B.; Dudhia, J.; Gill, D.O.; Zhiquan, L.; Berner, J.; Wang, W.; Powers, J.G.; Duda, M.G.; Barker, D.M.; et al. A Description of the Advanced Research WRF Model Version 4 NCAR Technical Note; National Center for Atmospheric Research: Boulder, CO, USA, 2019; p. 145. [Google Scholar] [CrossRef]
- Wang, W.; Bruyère, C.; Duda, M.G.; Dudhia, J.; Gill, D.O.; Kavulich, M.; Werner, K.; Chen, M.; Lin, H.-C.; Michalakes, J.; et al. ARW Version 4 Modeling System User’s Guide; Mesoscale & Miscroscale Meteorology Division, National Center for Atmospheric Research: Boulder, CO, USA, 2019; p. 408. [Google Scholar]
| Disclaimer/Publisher’s Note: The statements, opinions and data contained in all publications are solely those of the individual author(s) and contributor(s) and not of MDPI and/or the editor(s). MDPI and/or the editor(s) disclaim responsibility for any injury to people or property resulting from any ideas, methods, instructions or products referred to in the content. |
© 2023 by the authors. Licensee MDPI, Basel, Switzerland. This article is an open access article distributed under the terms and conditions of the Creative Commons Attribution (CC BY) license (https://creativecommons.org/licenses/by/4.0/).


 ,
, 


