Abstract
Today, high-density building areas, along with low albedo construction materials and a lack of green spaces, have led to higher urban temperatures. Climate change significantly intensifies the magnitude of urban overheating and the frequency of extreme heat events is expected to increase over time. The aim of this research is to showcase new insights into the cooling effects of urban elements and layouts in a residential area consisting of several building blocks in a Mediterranean city (Athens). The microclimatic model ENVI-met was applied to simulate thermal conditions for a typical summer day. Thermal conditions were evaluated according to air temperature and the estimations of the Universal Climate Thermal Index (UTCI, °C). The results showed that during the hottest hours of the day (11:00–17:00), among the examined design layouts, courtyards and the NS street induced the lower heat stress conditions, that fluctuated within the ‘Moderate heat stress’ condition. On the opposite end, the EW street, the avenue, the trees, and the pavement-affected areas induced ‘Very strong heat stress’ conditions. The maximum UTCI value, 40.9 °C (15:00 LST), was obtained in the areas affected by the EW street. The findings of this study highlighted the urban design layout patterns that enhance the development of hotspots and should be considered when designing mitigation strategies in cities with a Mediterranean climate.
1. Introduction
Many studies have already demonstrated the adverse effects of heat exposure on human health in many regions, and heat-related effects on mortality have also been confirmed [1,2]. Most studies that examine the health-related outcomes of heat exposure conclude that urban areas are more vulnerable to heat [3].
In this context, numerous studies have been conducted around the world aiming at evaluating the thermal environment in open urban areas such as parks [4], squares [5], urban canyons [6], and courtyards [7]. This kind of research may include microclimatic monitoring [8], the use of a structured questionnaire for the visitors of the examined areas [4], and the use of bioclimatic indices to assess human thermal comfort [9]. Over recent years, many investigators have used computational fluid dynamic (CFD) models to simulate the microclimatic environment of the examined urban areas (e.g., [10]). Many studies examine the cooling effect of certain urban forms such as green [11] and/or blue elements [10] and then suggest a number of mitigation strategies to improve the thermal environment [12,13]. To date, few studies have attempted to investigate the thermal conditions that are configurated in urban residential blocks [14].
This is a preliminary study, the aim of which is to examine the thermal conditions in a densely populated urban area consisting of nine urban blocks in a suburb of Athens, on a typical summer day. The examined area was selected since it concentrates a variety of aspects that are commonly found in an urban area such as a square, a church with a courtyard, NS and EW streets, one avenue, and several courtyards. The above-mentioned urban layout consists of almost all the most commonly used urban aspects, which may be evaluated both individually and as a whole for their environmental footprint. The focus was given to closely evaluating the thermal environment within the examined urban blocks, identifying the potential thermal patterns that develop hotspots.
2. Methods
2.1. Study Area and Climatic Conditions
The examined urban area is a suburban municipality in the western part of Athens (4 km west of the center of Athens, 37°59′31″ N 23°40′41″ E) (Figure 1a). The examined area consists of nine residential blocks and has a total size of 62,328 m2 (Figure 1b). The urban blocks are symmetrical, each covering almost the same surface area (≈4576 m2 each), whereas the remaining area of about 21,144 m2 (34% of the total area) consists of streets, as well as one avenue, and is covered mainly by pavement and asphalt. The seven urban blocks are covered by multi-storey building apartments (from approximately 2 to 6 floors), whereas the two central ones consist of a square and a church courtyard, respectively (Figure 1b). It is worth mentioning that in each urban block, except for the two central ones, there is also a courtyard that covers about 10% of the total surface area of the block. The metro station is located on the square making it a crowded transportation hub throughout the year. The square consists of trees and grass while the ground surface is covered by pavement. A total of 185 trees were identified in the examined area: Citrus and Aurantium (60 trees), spherical medium trunk, sparse, 5 m (4 trees), spherical medium trunk, dense, 5 m (5 trees), spherical medium trunk, sparse, 5 m (12 trees), cylindric medium trunk, dense, 5 m (2 trees), Betula Pendula (4 trees), Olea Europaea (5 trees), Albizia Julibrissim (5 trees), Senegalia greggi (16 trees), Pinus pinea (4 trees). Finally, there is an absence of any blue element, such as a fountain, in the examined area.
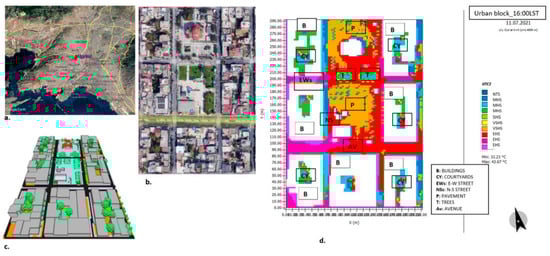
Figure 1.
(a) Satellite image of the greater Athens area. (b) aerial photo of the study area. (c) the 3D digitized study area, and (d) the spatial distribution UTCI across the square at 16:00 LST, at 1.4 m height.
Based on Koeppen’s classification [15], Athens enjoys a Mediterranean climate, mildly humid with dry, warm, and hot summers (Csa). In July, the hottest month of the year, the average climatic temperature of Athens is 27.0 °C whereas the mean maximum and mean minimum temperature are 32.6 °C and 22.0 °C, respectively, according to the National Observatory of Athens. At the examined date the average air temperature was recorded as 27.0 °C, the average wind speed at 1.5 m·s−1 (NNE direction), and the maximum and minimum relative humidity at 31% and 57%, respectively (the daily data were retrieved by the nearest automatic weather station NOAAN network of NOA (Korydallos, ELEV: 75 m LAT: 38°00′ N LONG: 23°36′ E)).
2.2. Model Simulation and Thermal Conditions
The latest version of the three-dimensional environmental model ENVI-met [16] was applied to simulate the microclimatic conditions of the study area. ENVI-met is a three-dimensional grid-based non-hydrostatic model developed for the simulation of surface–plant–air interactions, especially within the urban canopy layer. The typical horizontal resolution of the model spans from 0.5 to 10 m and the typical time frame is from 24 to 48 h with a time step of 10 s at maximum.
The examined area was first digitized with a resolution of 2.5 m × 2.5 m × 2.0 m resulting in a grid of 85 × 117.6 × 30 cells (Figure 1c). The microclimatic conditions were simulated for 11.7.2022, a typical day in July according to the meteorological records of the nearest automatic weather station. The microclimatic simulations were set to start at 01:00 and the total simulated time lasted 24 h. ENVI-met results represented values at a height of 1.4 m above the ground. The thermal sensation was estimated using the Mediterranean thermal stress scale [4] of the bioclimatic index UTCI [17] (Table 1), through the BioMet ENVI-met tool (https://envi-met.info/doku.php?id=apps:biomet, accessed on 24 August 2023). Biomet is a post-processor tool for calculating human thermal comfort indices from ENVI-met model output values (i.e., hourly Tair (°C), humidity (RH%), mean radiant temperature (Tmrt, °C), and wind speed (WS, m·s−1)). The simulation accuracy of ENVI-met has already been tested for the examined area in the study [18], which used microclimatic data selected from eleven open areas across Athens.

Table 1.
Assessment scales of the Universal Thermal Climate Index (UTCI).
3. Results
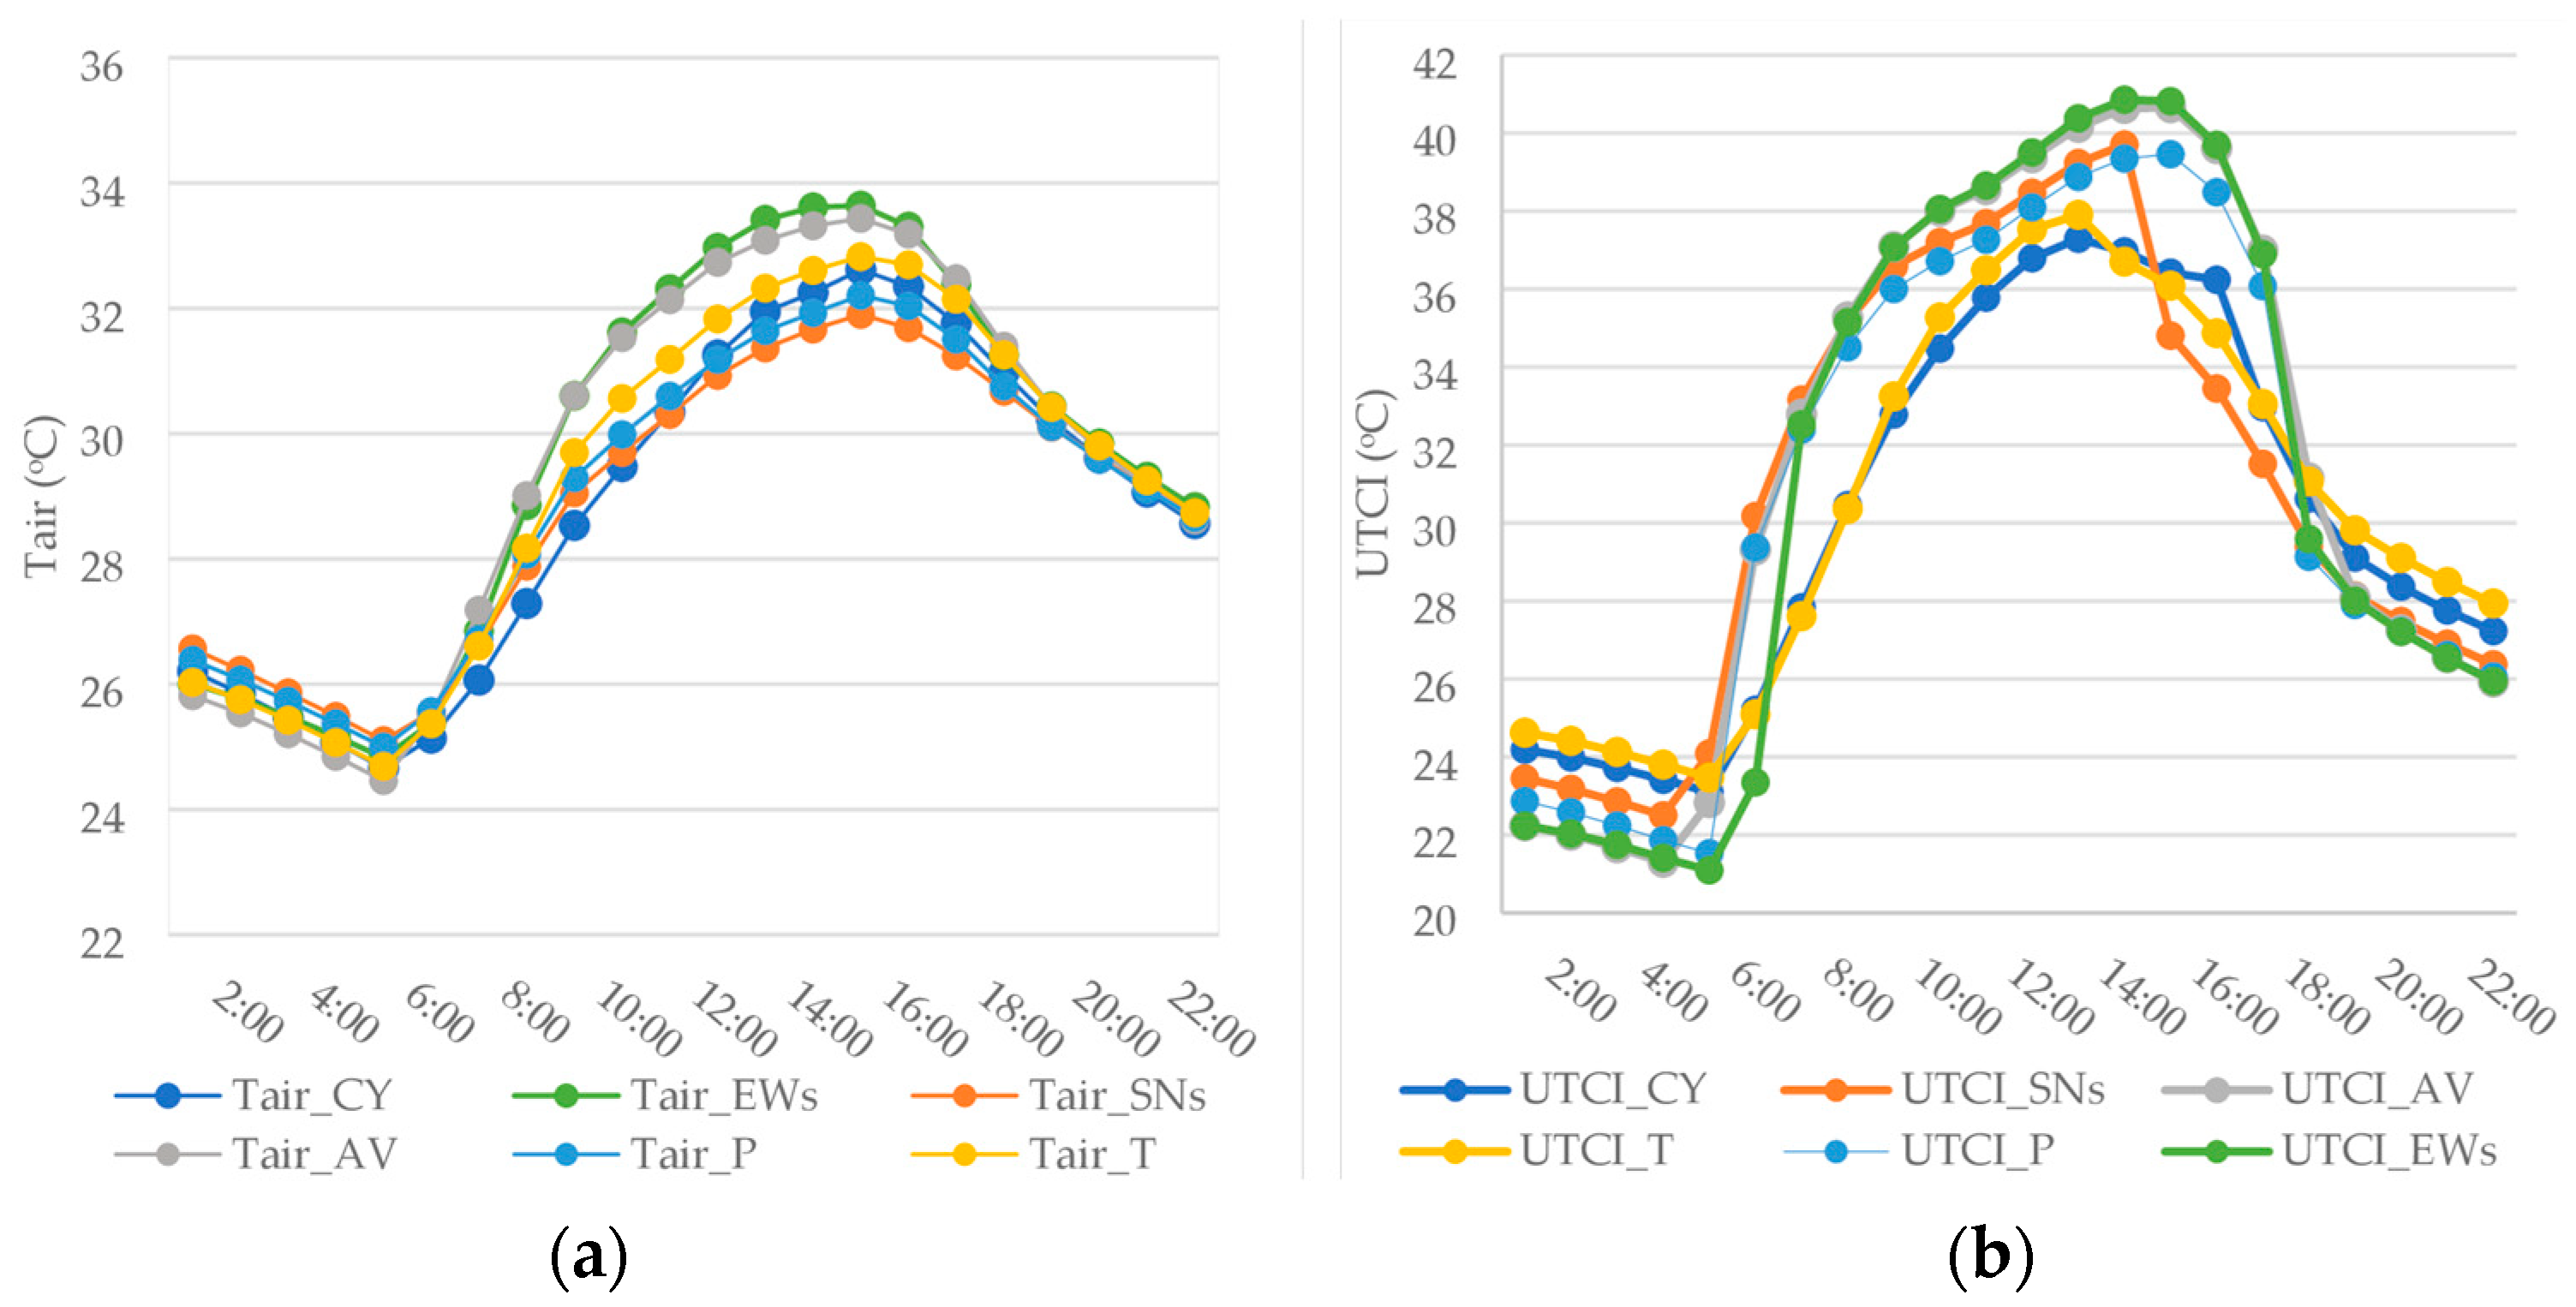
Hourly UTCI (°C) and Tair (°C) values were calculated at several characteristic spots across the urban blocks, in order for each of the examined spots to represent different urban design layouts, i.e., the courtyard, EW street, NS street, avenue, and the two squares. In the case of the squares, spots that were affected by trees and pavement materials were selected to be evaluated as representative elements of the square design layouts. All results are shown at local time, which is LST +2 for the date 11.07.2021 and are presented at the pedestrian level of 1.4 m. Figure 2 shows the effect of the six examined design layouts, i.e., courtyard (CY), EW street (EWs), NS street (NSs), avenue (AV), trees (T), and pavement (P) on the hourly ambient air temperature TairCY, TairEWs, TairNSs, TairAv, TairT and, TairP, respectively. Similarly, Figure 2b shows the effect of the design layouts on the hourly UTCI values (UTCI_CY, UTCI_EWs, UTCI_NSs and UTCI_A, UTCI_T, and UTCI_P).
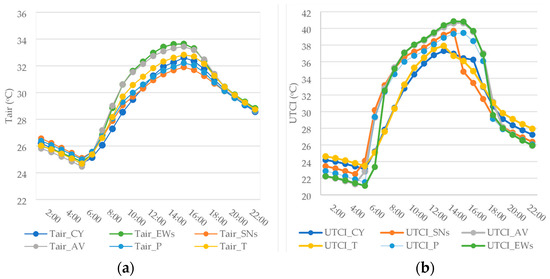
Figure 2.
The effect of the examined urban design elements on (a) Τair, (°C) and (b) UTCI (°C).
In Table 2 the daily average (02:00 LST to 23:00 LST), minimum, and maximum Tair and UTCI values for the examined spots are presented along with the average Tair and UTCI from 11:00 LST to 17:00 LST, which represent the hottest hours of the day.
Table 2.
Average, maximum, and minimum Tair (°C) and UTCI (°C) values per examined urban design layout.
Figure 2a shows the effect of the examined design elements on Tair from 02:00 LST to 23:00 LST. As can be seen, the ‘CY’ induced the lowest air temperature values (Tair_CY) throughout the day, whereas the ‘EWs’ induced the highest (Tair_EWs) within the examined residential area. The maximum daily air temperature values were obtained at 16:00 LST for all the examined design layouts. The maximum Tair was indicated over the ‘EWs’, probably because it is an unshaded area for most of the day receiving high amounts of solar radiation. On the other hand, the ‘CY’ maintained the lowest daily average air temperature. Figure 2b shows the effect of the examined design layouts on UTCI from 02:00 LST to 23:00 LST. Despite the fact that the daily average UTCI values fell into the ‘no thermal stress (NTS)’ category, the average UTCI values during the hottest hours of the day (11:00–17:00 LST) lay mainly within the ‘strong heat stress (SHS)’ and the ‘very strong heat stress (VSHS)’ categories. The exception to this pattern was observed at the ‘CY’ and the ‘T’ spots, which produced ‘moderate heat stress’ conditions (MHS) (Figure 2b). Although the ‘AV’ spot induced the highest daily average UTCI value, the ‘EWs’ induced the highest average UTCI value from 11:00 to 18:00 and the maximum UTCI value among the examined spots (Table 2). Figure 1d shows the spatial distribution of UTCI at 16:00 LST across the study area. As can be seen, the highest UTCI values that correspond to the ‘extreme heat stress (EHS)’ category were produced across the ‘EWs’ and the ‘AV’, both sharing the same orientation. It is worth noting that, although the ‘EW’ street has a double H/W ratio compared to the ‘AV’, both presented similar microclimatic characteristics during the day. On the opposite end, ‘NSs’ presented the lowest UTCI values within the study area at 16:00 LST, which corresponded to the ‘moderate heat stress (MHS)’ category, probably due to the shade provided by the adjacent building. Similar UTCI values to that of ‘SNs’ were indicated for the areas affected by the tree shading (‘T’), however, the cooling effect induced by the trees covers less area compared to that provided by the buildings (Figure 1d). The areas affected by the ‘P’ induced UTCI values that corresponded mainly to the ‘strong heat stress (SHS)’ category. Finally, ‘CYs’ induced UTCI values which fluctuated between the MHS and SHS categories, depending on the provided tree shading from the adjacent trees.
4. Conclusions
The present study investigated the thermal conditions in a residential urban area consisting of several urban blocks, highlighting the areas with the most adverse thermal conditions that mitigation strategies should focus on. Among the examined design layouts, the areas affected by courtyards maintained lower Tair and produced ‘moderate heat stress’ conditions during the hottest hours of the day. The EW street and the avenue, despite the different H/W ratios, induced ‘extreme heat stress’ conditions during the hottest hours, probably due to their extensive exposure to solar radiation at this time of the year. On the opposite end, the NS street produced ‘moderate heat stress’ conditions during the hottest hours, probably due to the shade provided by the adjacent buildings. Based on the current results, mitigation strategies may apply in the examined area to improve the thermal environment. The focus should be mainly given to EW streets and avenues, where the addition of more side trees could possibly mitigate the thermal stress levels. Additionally, in the case of avenues, a number of trees should also be added across the middle divider line. The blue element does not currently exist in the examined area, a number of fountains, however, in the two squares may possibly improve the thermal conditions. Nevertheless, in order to evaluate the effectiveness of the proposed design elements on micrometeorological and thermal conditions further investigation is required.
Author Contributions
Conceptualization, A.T.; methodology, A.T.; software, A.T.; writing—original draft preparation, A.T.; writing—review and editing, A.T., E.M., A.M. and I.T. All authors have read and agreed to the published version of the manuscript.
Funding
This research received no external funding.
Institutional Review Board Statement
Not applicable.
Informed Consent Statement
Not applicable.
Data Availability Statement
The authors confirm that the data supporting the findings of this study are available upon request.
Conflicts of Interest
The authors declare no conflict of interest.
References
- Guo, C.; Lanza, K.; Li, D.; Zhou, Y.; Aunan, K.; Loo, B.P.; Lee, J.K.; Luo, B.; Duan, X.; Zhang, W.; et al. Impact of heat on all-cause and cause-specific mortality: A multi-city study in Texas. Environ. Res. 2023, 224, 115453. [Google Scholar] [CrossRef]
- Zafeiratou, S.; Analitis, A.; Founda, D.; Giannakopoulos, C.; Varotsos, K.V.; Sismanidis, P.; Keramitsoglou, I.; Katsouyanni, K. Spatial variability in the effect of high ambient temperature on mortality: An analysis at municipality level within the greater athens area. Int. J. Environ. Res. Public Health 2019, 16, 3689. [Google Scholar] [CrossRef] [PubMed]
- Demoury, C.; Aerts, R.; Vandeninden, B.; Van Schaeybroeck, B.; De Clercq, E.M. Impact of Short-Term Exposure to Extreme Temperatures on Mortality: A Multi-City Study in Belgium. Int. J. Environ. Res. Public Health 2022, 19, 3763. [Google Scholar] [CrossRef] [PubMed]
- Tseliou, A.; Tsiros, I.; Nikolopoulou, M.; Papadopoulos, G. Outdoor thermal sensation in a Mediterranean climate (Athens): The effect of selected microclimatic parameters. Archit. Sci. Rev. 2016, 59, 190–202. [Google Scholar] [CrossRef]
- Xiao, J.; Yuizono, T. Climate-adaptive landscape design: Microclimate and thermal comfort regulation of station square in the Hokuriku Region, Japan. Build. Environ. 2022, 212, 108813. [Google Scholar] [CrossRef]
- Peng, M.; Huang, H. The Synergistic Effect of Urban Canyon Geometries and Greenery on Outdoor Thermal Comfort in Humid Subtropical Climates. Front. Environ. Sci. 2022, 10, 851810. [Google Scholar] [CrossRef]
- Tsiros, I.X.; Hoffman, M.E.; Tseliou, A.; Christopoulou, V.; Lykoudis, S. An assessment to evaluate potential passive cooling patterns for climate change adaptation in a residential neighbourhood of a Mediterranean coastal city (Athens, Greece). Int. J. Glob. Warm. 2018, 16, 181. [Google Scholar] [CrossRef]
- Heshmat Mohajer, H.R.; Ding, L.; Kolokotsa, D.; Santamouris, M. On the Thermal Environmental Quality of Typical Urban Settlement Configurations. Buildings 2022, 13, 76. [Google Scholar] [CrossRef]
- Gaspari, J.; Fabbri, K.; Lucchi, M. The use of outdoor microclimate analysis to support decision making process: Case study of Bufalini Square in Cesena Italy. Sustain. Cities Soc. 2018, 42, 206–215. [Google Scholar] [CrossRef]
- Jacobs, C.; Klok, L.; Bruse, M.; Cortesão, J.; Lenzholzer, S.; Kluck, J. Are urban water bodies really cooling? Urban Clim. 2020, 32, 100607. [Google Scholar] [CrossRef]
- Morakinyo, T.E.; Lau, K.K.L.; Ren, C.; Ng, E. Performance of Hong Kong’s common trees species for outdoor temperature regulation, thermal comfort and energy saving. Build. Environ. 2018, 137, 157–170. [Google Scholar] [CrossRef]
- Tseliou, A.; Koletsis, I.; Pantavou, K.; Thoma, E.; Lykoudis, S.; Tsiros, I.X. Evaluating the effects of different mitigation strategies on the warm thermal environment of an urban square in Athens, Greece. Urban Clim. 2022, 44, 101217. [Google Scholar] [CrossRef]
- Del Serrone, G.; Peluso, P.; Moretti, L. Evaluation of Microclimate Benefits Due to Cool Pavements and Green Infrastructures on Urban Heat Islands. Atmosphere 2022, 13, 1586. [Google Scholar] [CrossRef]
- Chen, Y.; Zheng, B.; Hu, Y. Numerical Simulation of Local Climate Zone Cooling Achieved through Modification of Trees, Albedo and Green Roofs—A Case Study of Changsha, China. Sustainability 2020, 12, 2752. [Google Scholar] [CrossRef]
- Beck, H.E.; Zimmermann, N.E.; McVicar, T.R.; Vergopolan, N.; Berg, A.; Wood, E.F. Present and future köppen-Geiger climate classification maps at 1-km resolution. Sci. Data 2018, 5, 180214. [Google Scholar] [CrossRef] [PubMed]
- Bruse, M.; Fleer, H. Simulating surface-plant-air interactions inside urban environments with a three-dimensional numerical model. Environ. Model. Softw. 1998, 13, 373–384. [Google Scholar] [CrossRef]
- Jendritzky, G.; Havenith, G.; Weihs, P.; Batchvarova, E. Towards a Universal Thermal Climate Index UTCI for assessing the thermal environment of the human being. Final report COST Action 730, Freiburg, Germany. 2009. Available online: https://www.cost.eu/actions/730/ (accessed on 24 August 2023).
- Koletsis, I.; Tseliou, A.; Lykoudis, S.; Tsiros, I.X.; Lagouvardos, K.; Psiloglou, B.; Founda, D.; Pantavou, K. Validation of ENVI-met microscale model with in-situ measurements in warm thermal conditions across Athens area. In Proceedings of the 17th International Conference on Environmental Science and Technology, CEST2021, Athens, Greece, 1–4 September 2021. [Google Scholar]

Disclaimer/Publisher’s Note: The statements, opinions and data contained in all publications are solely those of the individual author(s) and contributor(s) and not of MDPI and/or the editor(s). MDPI and/or the editor(s) disclaim responsibility for any injury to people or property resulting from any ideas, methods, instructions or products referred to in the content. |
© 2023 by the authors. Licensee MDPI, Basel, Switzerland. This article is an open access article distributed under the terms and conditions of the Creative Commons Attribution (CC BY) license (https://creativecommons.org/licenses/by/4.0/).