Article

Top and Side Leakage Effects on Thermoregulation and Moisture Retention with Facemask Wearing

1
Department of Biomedical Engineering, University of Massachusetts, Lowell, MA 01854, USA
2
Department of Aerospace, Industrial and Mechanical Engineering, California Baptist University, Riverside, CA 92504, USA
3
Department of Mechanical Engineering, University of Massachusetts, Lowell, MA 01854, USA
*
Author to whom correspondence should be addressed.
J. Respir. 2025, 5(2), 5; https://doi.org/10.3390/jor5020005
Submission received: 6 February 2025 / Revised: 23 March 2025 / Accepted: 1 April 2025 / Published: 3 April 2025
(This article belongs to the Collection Feature Papers in Journal of Respiration)

Abstract

:
Background/Objectives: Mask-wearing-induced discomfort often leads to unconscious loosening of the mask to relieve the discomfort, thereby compromising protective efficacy. This study investigated how leakage flows affect mask-associated thermoregulation and vapor trapping to inform better mask designs. An integrated ambience–mask–face–airway model with various mask-wearing misfits was developed. Methods: The transient warming/cooling effects, thermal buoyancy force, tissue heat generation, vapor phase change, and fluid/heat/mass transfer through a porous medium were considered in this model, which was validated using Schlieren imaging, a thermal camera, and velocity/temperature measurements. Leakages from the top and side of the mask were analyzed in comparison to a no-leak scenario under cyclic respiration conditions. Results: A significant inverse relationship was observed between mask leakage and facial temperature/humidity. An equivalent impact from buoyancy forces and exhalation flow inertia was observed both experimentally and numerically, indicating a delicate balance between natural convection and forced convection, which is sensitive to leakage flows and critical in thermo-humidity regulation. For a given gap, the leakage fraction was not constant within one breathing cycle but constantly increased during exhalation. Persistently higher temperatures were found in the nose region throughout the breathing cycle in a sealed mask and were mitigated during inhalation when gaps were present. Vapor condensation occurred within the mask medium during exhalation in all mask-wearing cases. Conclusions: The thermal and vapor temporal variation profiles were sensitive to the location of the gap, highlighting the feasibility of leveraging temperature and relative humidity to test mask fit and quantify leakage fraction.

1. Introduction

Face covering was widely adopted during the COVID-19 pandemic [1]. While these protective measures serve as barriers against pathogen transmission, they introduce challenges related to user discomfort and compromised compliance. Healthcare workers wear facial protection for extended periods, often experiencing significant physical discomfort, particularly associated with thermal regulation and skin health [2,3].
The rivalry between mask effectiveness and user comfort presents a critical challenge in facemask design, as well as in public health [4]. When individuals experience discomfort, they often adjust or improperly wear their masks, creating gaps that compromise mask protection [5]. These gaps, even when minimal, can notably reduce the mask’s ability to filter airborne particles, especially in masks with higher filtration efficiencies [6]. The challenge becomes more pronounced in high-temperature environments or during high levels of physical activity, where temperature and vapor buildup can create a cascade of adverse physiological responses [7,8].
Individuals with pre-existing dermatological conditions face additional challenges. The perioral region (i.e., around the nose and mouth), particularly the philtrum, contains a dense network of blood vessels and nerve endings, making it especially sensitive to temperature fluctuations [9,10]. Common skin conditions, such as rosacea, eczema, and psoriasis, can be aggravated by the warm and humid microenvironment underneath the mask, creating unique challenges in mask design and usage protocols [11,12]. The complex interplay between temperature changes and skin tissue properties plays a crucial role in mask comfort, as thermal discomfort can trigger varying physiological responses that affect user compliance [13,14,15].
A few studies have investigated physiological responses due to mask-wearing. A systemic review by Ipaki et al. showed that variables, such as material breathability, mask fit, and environmental conditions, significantly influence the user experience [16]. Li et al. demonstrated that, while surgical masks generally cause less thermal discomfort compared to N95 respirators, both types can affect the wearer’s comfort levels, especially during sustained use or physical exertion [17]. According to Scarano et al., who used infrared imaging to evaluate facial skin temperature, the higher levels of discomfort with N95 were due to its tighter fit and lower breathability (or higher filtration efficiency), leading to more heat and moisture retention than a surgical mask [18]. The complaint rate for N95 masks was 5% higher than surgical masks regarding humidity and 50% higher for heat, breathing difficulty, and discomfort perception [18]. The accumulation of heat and moisture within the mask can also affect cardiovascular responses, though these effects vary among individuals and usage conditions [19]. This complex interplay between protection, comfort, and compliance highlights the need for innovative solutions in mask design and usage protocols. Similarly, understanding these dynamics is crucial for developing more effective and user-friendly protective equipment, particularly in scenarios requiring extended wear periods or use in challenging environmental conditions.
Numerical modeling techniques have proven valuable in studying facemask effectiveness and COVID-19 transmission. Computational fluid dynamics (CFD) has been widely used to simulate airborne virus dispersion in various settings, evaluate ventilation systems, and assess the impact of social distancing and mask-wearing [20,21]. These models have improved understanding of the mechanisms of respiratory virus transmission and the efficacy of face masks in blocking virus-carrying particles [22]. Advanced designs incorporating nanofibers and antimicrobial properties have also been investigated [23]. Specifically, surgical masks can reduce particles during speaking and coughing by substantial margins (i.e., 90%) on average compared to wearing no mask at all [24]. On the other hand, aerosol dispersion models have helped optimize mask designs by showing how different materials and fits affect particle filtration, leading to recommendations for multi-layer masks and proper fitting techniques [25,26].
The obstructed breathing and excessive thermal sensations from mask-wearing often prompt a natural response to loosen the fit or remove the mask for relief [27,28,29]. According to Scarano et al., participants touched the masks 12 times per hour on average when wearing an N95 mask and 6 times per hour when wearing a surgical mask [18]. Such mask-touching behaviors were often involuntary but could generate significant leakage flows that mitigated discomfort. The facial perception of thermo-humidity can be affected by many factors, including cyclic respiration, exhaling warm, moist air and inhaling cool, dry ambient air, tissue heat generation, tissue sensitivity, mask fit, and filter material [30]. The transient balance between heat generated by the skin, warming from the respiratory tract, and cooling from inhalation each play a role in this process. Additionally, thermoregulation between the mask and face is sensitive to the physical properties of the mask, such as resistance, thermal conductivity, and specific heat, as well as the fit of the mask. Mask gaps, which allow air to flow in and out of the mask without filtration, can dramatically alter the spatial and temporal distributions of heat, air, and moisture [31].
This study aimed to numerically investigate how leakage flows impact facial thermoregulation and moisture retention under the mask. Specific tasks include
(1)
Developing a unified ambiance–mask–face–airway model with varying gaps that account for cyclic breathing, heat transfer, vapor transport, and phase change.
(2)
Validating the computational model using experimental methods, including Schlieren imaging of exhaled flows, leakage velocities using an anemometer, infrared imaging of facial/mask temperatures, and real-time temperature using thermal probes.
(3)
Analyzing variations in temperature and vapor trapping beneath the mask under different leakage conditions (Top and Side) in comparison to scenarios with no mask and mask-wearing with a perfect fit.
(4)
Examining airflow dynamics responsible for the spatiotemporal variations in facial temperatures, particularly at key facial regions. such as the philtrum, chin, nose bridge, and cheeks, as well as in the proximity of the gaps.

2. Materials and Methods

2.1. Integrated Respiratory–Facial Interface Simulation

Figure 1a shows the computational model employed in this study, simulating an adult male wearing a three-pleat surgical mask. This model integrates four key components: the ambient environment, a detailed facial topology, a well-fitting surgical mask, and the upper respiratory airway from nostrils to trachea [32,33]. Two gaps, one at the nose top and the other at the left face, were also developed (Figure 1b). Each of these elements is represented as a distinct volume within the simulation. The mask geometry was developed using Blender based on a series of photographs captured from multiple angles [11,12]. In the model, the surgical mask is treated as a porous medium to consider its material properties. The facial and airway structures were rendered based on MRI scans of an adult male, providing a realistic anatomical basis [11]. This face–airway model was then seamlessly integrated with the mask geometry, creating a holistic representation of the mask-wearing scenario. By unifying the surrounding air, the mask itself, the space between the mask and face, and the upper respiratory tract, including the mouth, nose, pharynx, and larynx, this model enables a detailed analysis of the complex interactions between breath, mask, and facial structures.

2.2. Facemask Properties

The mask’s physical properties included density, thickness, thermal conductivity, heat capacity, and flow resistance. The mask was made of polyethylene with a density of 946 kg/m3. It had a measured thickness of 2.3 mm, a dimension of 16.5 × 7.5 cm, and a mass of 2390.3 mg. The nominal density of the porous medium was calculated at 84.0 kg/m3, indicating a porosity of 91.1%. The thermal conductivity was 0.11 W/m·K, and the heat capacity was 42.85 J/kg·K [34]. The flow resistance of the mask was measured at 14.6 mmH2O at 85 L/min using a mask Filter Tester 8130A (TSI, Shoreview, MN, USA) and was calculated at 3.727 × 10⁹ 1/m2 based on the mask thickness.

2.3. Boundary Conditions

Tidal breathing was considered in this study, following a waveform (Figure 1c) representing normal physical activity as measured by Noto et al. [35]. The respiration waveform followed a cyclic breathing pattern, with a tidal volume of 0.5 L and a respiration rate of 12 breaths per minute (Figure 1c). The airway wall had a temperature of 310.15 K (37 °C) and a relative humidity of 99.5%. The face had a thermal conductivity of 0.187 W/m·K and a heat capacity of 3770 J/kg·K [29,36]. The boundary conditions are listed in Table 1, consisting of inlet, face, airway, and outlet (Ambient). A mixed thermal boundary condition with convection, radiation, and tissue heat generation was employed for the face, with a near-wall free stream temperature of 305 K, a heat transfer coefficient of 0.66 W/m·K, an external emissivity of 0.98, and a tissue heat generation rate of 6666 W/m3, as listed in Table 1 [36,37]. Two cases with no mask (NM1 and NM2) were considered for comparison purposes.
The boundary conditions in this study were set up to model natural convective heat transfer using the Boussinesq approximation [38]. For the air phase, the reference operating temperature was 286.5 K, the specific heat (Cp) was 1006.43 J/kg·K, the thermal conductivity was 0.0242 W/m·K, and the viscosity was 1.7894 × 10⁻⁵ kg/m·s. The water vapor had a density of 0.7659 kg/m3, a thermal conductivity of 0.0261 W/m·K, and a Cp of 1996 J/kg·K. The liquid water had a constant density of 998.2 kg/m3, a thermal conductivity of 0.6 W/m·K, and a Cp of 4182 J/kg·K [39]. The drag forces in this study were modeled using the Schiller–Naumann correlation for vapor–air and water–air interactions [40]. The drag coefficient was based on this default model, which accounts for spherical particles in a fluid and is commonly used for multiphase flows. The slip velocity, representing the relative velocity between phases, was modeled following Wang and Cheng [41]. This method ensures accurate predictions of momentum exchange between phases, which is critical for simulating vapor–air and water–air interactions under varying flow conditions.

2.4. Numerical Methods

The computational mesh for this study was generated using Ansys ICEMCFD (Canonsburg, PA, USA), employing a multi-domain, multi-scale meshing approach where coarse cells were applied for the environment space, ultra-fine cells for the mask, regular cells for the face, and fine cells for the airway (Figure 1d). A mesh sensitivity analysis evaluated mesh densities ranging from 2 to 8 million cells at a temperature of 24 °C and a relative humidity of 30%, achieving grid independence at 6.4 million cells for the temperature at the philtrum (Figure 1d). The face mask was simulated as one volume of porous media, while gaps were simulated as individual volumes of air. Four layers of prismatic cells were applied on the air–wall interface, including those in the gap-volumes, to accurately capture the boundary flows.
Ansys Fluent 23 (Canonsburg, PA, USA) was used to solve governing equations for mass, momentum, and energy of the moist air. The second-order upwind algorithm was used to discretize equations for the momentum, turbulence properties, and energy, while the “PRESTO!” scheme was applied for pressure, allowing more accurate handling of pressure gradients at boundaries. The respiratory flows were modeled using the low Reynolds number (LRN) k-ω turbulence model, which has been well validated for both transitional and turbulent flow regimes [42,43,44,45].
The simulation of moist air, comprising air, vapor, and water components, was conducted using a mixture multiphase approach. The system’s behavior was characterized by fundamental governing equations that address mixture continuity, momentum, and energy conservation [41]:
t ρ m + · ρ m V m = 0 ;   ρ m = k = 1 n α k ρ k ;   V m = k = 1 n α k ρ k V k / ρ m
t ρ m V m + · ρ m V m V m = P + · μ m V m + V m T + ρ m g + F · k = 1 n α k ρ k V d r , k V d r , k
t k ( α k ρ k C p , k T ) + · k ( α k V k ( ρ k C p , k T + p ) ) = · k e f f T k j ( h j J j , k + ( τ = e f f · V k ) ) + S h
The governing equations for mixture dynamics describe a system with multiple components or phases, capturing their combined behavior through terms representing the overall density ρ m in Equation (1), where αk is the volume fraction of phase k and V m is the velocity of the mixture. It includes a drift velocity for phase k, V d r , k , which accounts for the relative motion between the different phases, adding complexity by modeling how each component moves independently within the system. The viscous stress tensor μ m V m + V m T describes friction-induced interactions among components. The rightmost term in Equation (2) accounts for the momentum transfer due to the relative motion of n different phases or components. Other variables P, g, and F in Equation (2) are pressure, gravity, and external force (0 in this study). In Equation (3), Cp,k is the specific heat capacity at constant pressure for phase k, T is temperature, keff is the effective thermal conductivity of the mixture, hj is the enthalpy of species j, Jj,k is the diffusive flux of species j in phase k, τeff is viscous stress tensor, and Sh is the heat source (0 in this study). The double summation over k (phases) and j (species) accounts for the contribution of each species in each phase. The phase change was modeled using the Lee evaporation–condensation approach, while the Manninen model governed slip velocity calculations. A surface tension coefficient of 0.074 N/m was applied for vapor–water interactions, and the Schiller–Naumann scheme was implemented to determine the drag coefficient between air–vapor and air–water pairs [46].
The ratio of vapor partial pressure to saturated pressure gives the RH (%). The dew point is also related to RH and the Magnus formula was used to calculate the dew point temperature (Tdew) [47]:
T d e w ° C = 243.04 × ln R H 100 + 17.625 T 243.04 + T 17.625 ln R H 100 17.625 T 243.04 + T
Here, T is in °C and RH (relative humidity) in %, while the Psat is calculated by the Antoine equation [48]:
P S a t m b a r = 1.333 × 10 8.07131 1730.63 243.04 + T a
Here, RH = Pv/Psat and Pv is calculated from the mass fraction of vapor:
M F v = P v P t o t × 18.015 M o l a r   m a s s   o f   s t e a m , g r m o l P v P t o t × 18.015 + P a i r P t o t × 28.97 M o l a r   m a s s   o f   a i r , g r m o l
Using the Magnus formula, the mass fraction of vapor from the simulation can be used to calculate the vapor pressure (Pv), which in turn allows for the determination of relative humidity (RH) [49]. Once RH and the air temperature (Ta) are known, the dew point (Tdew) can be calculated for each point.

2.5. Experimental Methods

To validate the CFD projections, leakage flow measurements were conducted using a full-sized head manikin with a controlled experimental setup. A predefined gap was created using a 6.5 × 17 mm rectangular duct positioned at the left central cheek between the mask and skin surface, while all other potential leakage points were sealed with tape. Flow measurements were obtained using a TSI 9565 VelociCalc anemometer (Shoreview, MN, USA) during consistent inhalation conditions maintained at 15 L/min by a Robinair vacuum (Warren, MI, USA). Temperature variations during normal breathing were monitored using a FLIR ONE Pro iOS thermal camera (Wilsonville, OR, USA) on a volunteer subject. The participation of human subjects in this study was approved by the Institutional Review Board at University of Massachusetts Lowell. The experimental data were collected in quintuplicate to calculate mean values and standard deviations for comparison with computational predictions. A Schlieren optical imaging system was employed to visualize exhaled flows with and without mask usage. Temperature measurements were conducted using a CR1000 datalogger with a 105T-L thermocouple (Campbell Scientific, Logan, UT, USA) positioned 2 cm beneath the nostril, while ambient conditions were monitored using a Fluke 971 temperature humidity meter. Tests were performed in a room environment (24 °C, 30% RH), with medical tape ensuring mask seal integrity [39].

3. Results

3.1. Computional Model Validation

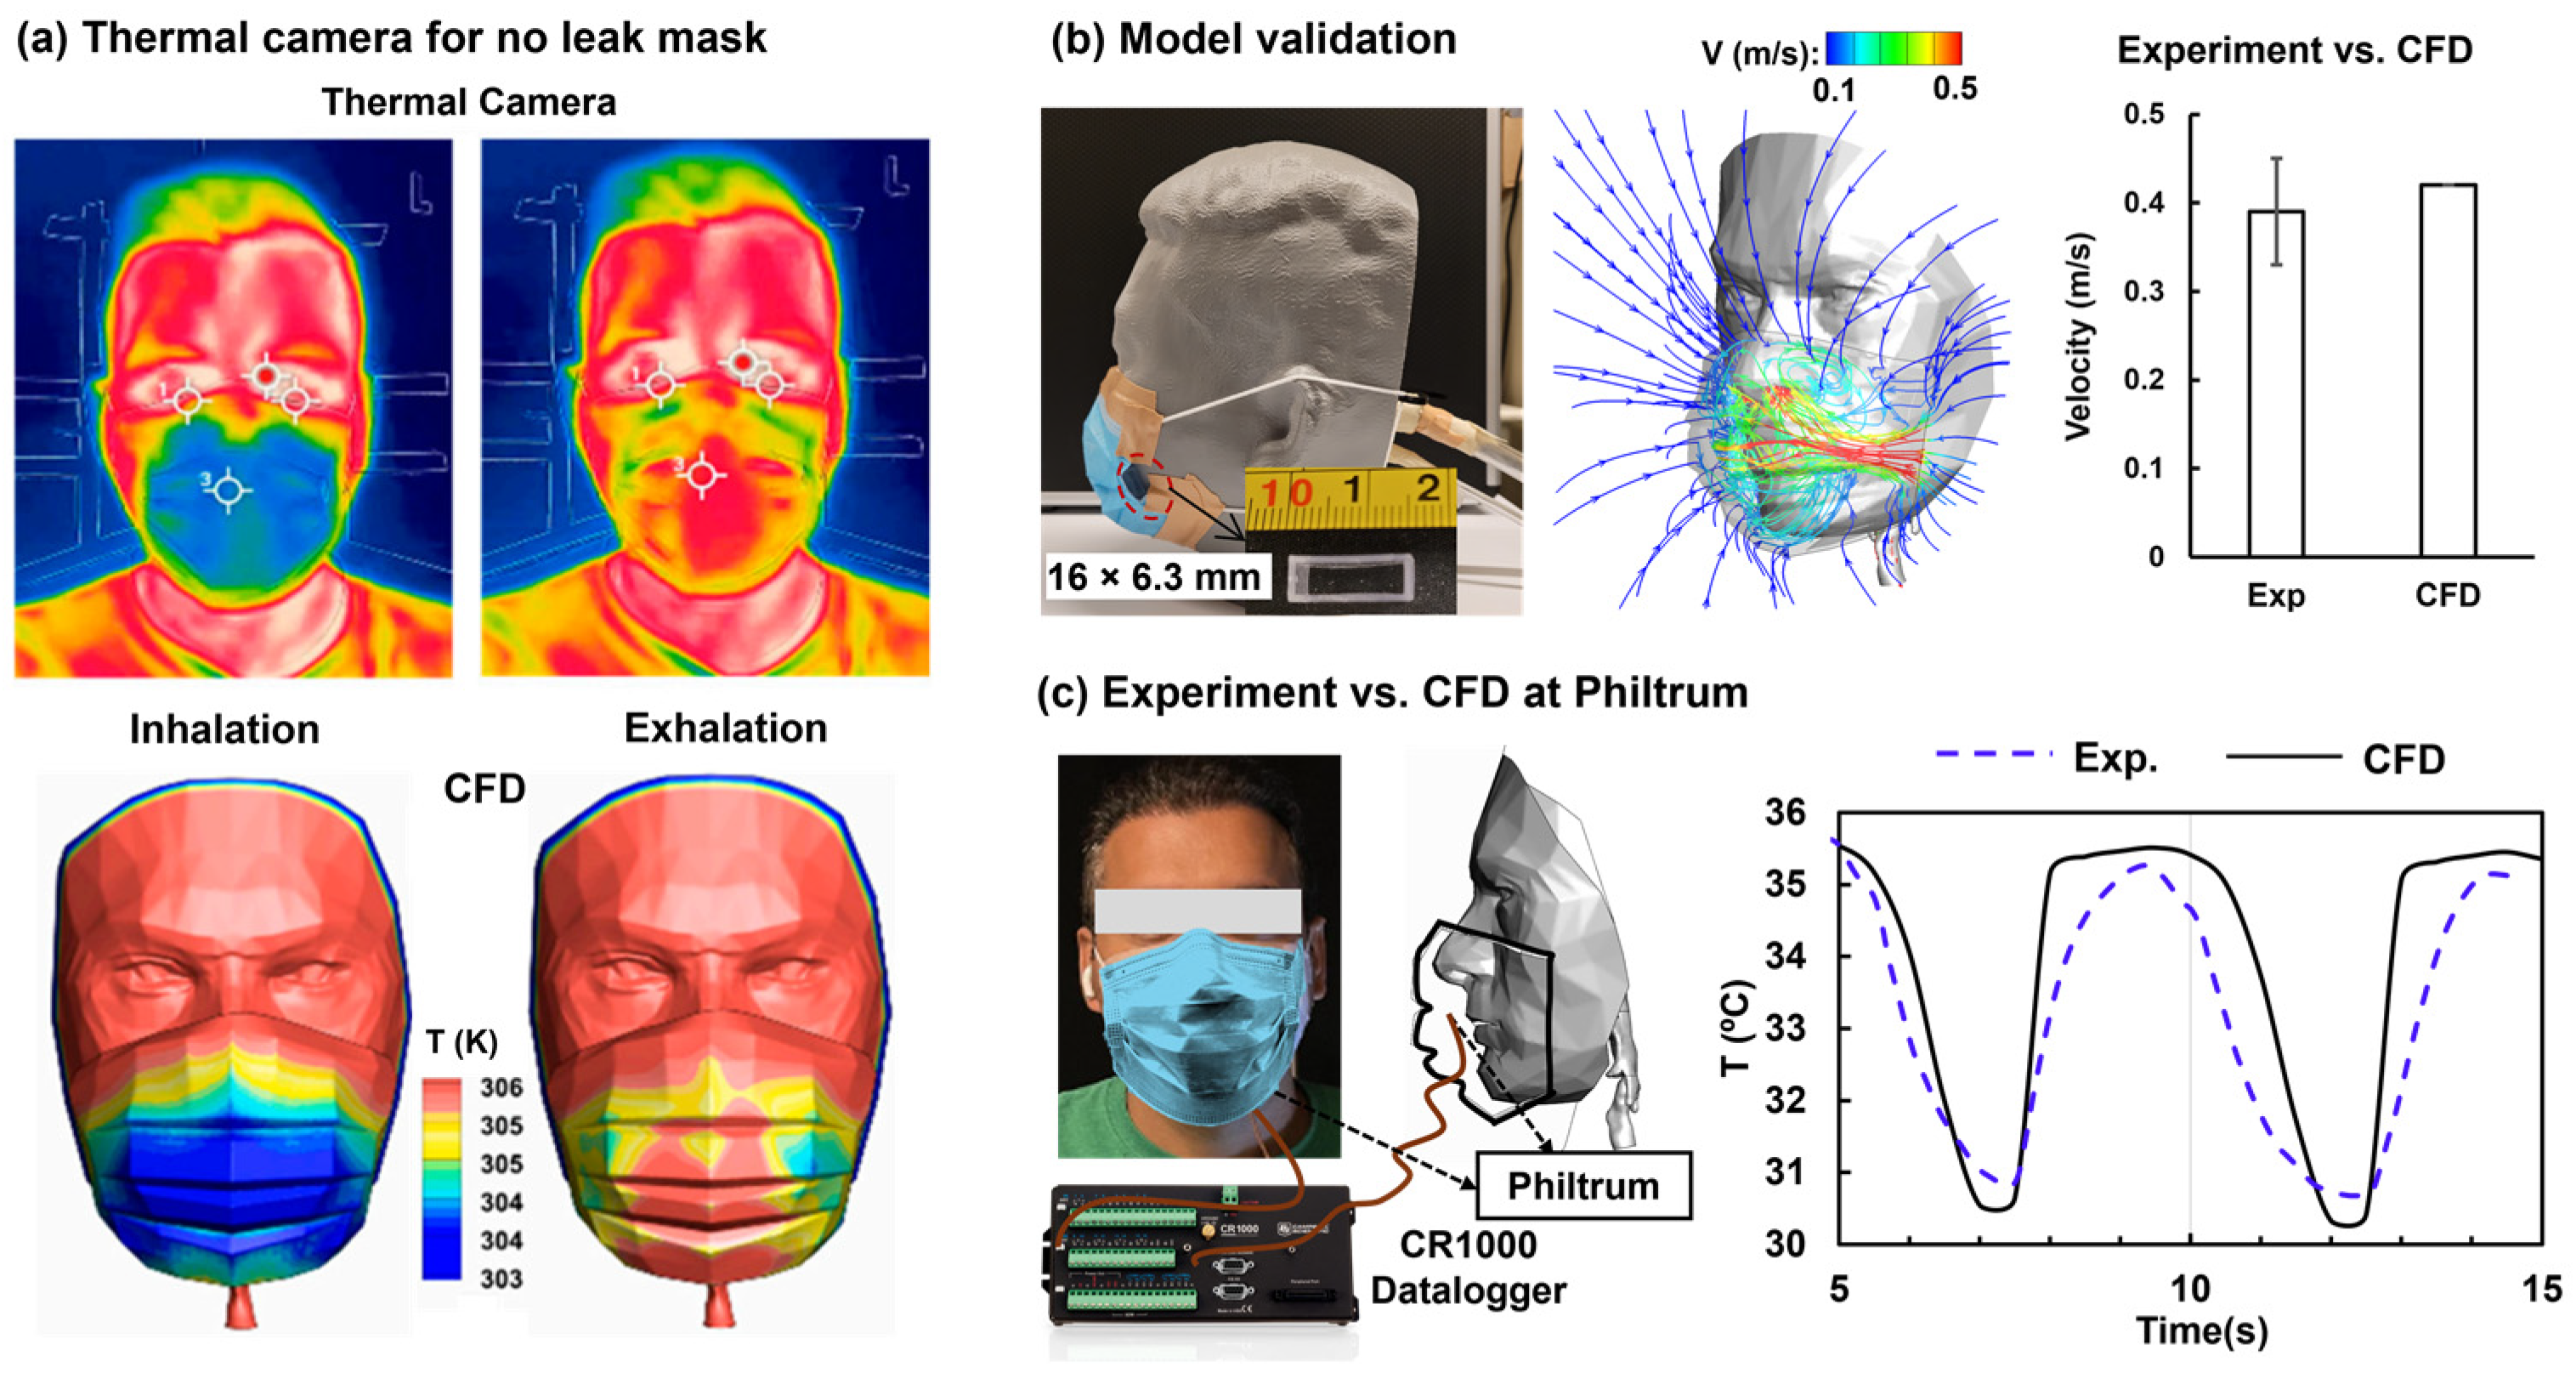
The computational model was validated from three aspects: (1) infrared thermal imaging of the face and mask (Figure 2a), (2) leakage flow velocity from a side gap in a surgical mask, as well as CFD-predicted exhaled airflow patterns (Figure 2b), and (3) temperature measurement vs. CFD at the philtrum with no leakage (Figure 2c). Good agreement was achieved for all three comparisons, thus validating the accuracy of the model predictions in both flow and temperature.
The validation process further demonstrated the computational model’s capacity to capture the detailed flow dynamics associated with mask usage. Notably, the model successfully predicted the exhaled air’s velocity patterns both through and around the mask, especially when gaps were present, offering insight into how small structural imperfections in mask fit can significantly alter airflow distribution (Figure 2b). The use of thermal imaging (Figure 2a) and velocity probes (Figure 2b) reinforced that the model could replicate not just airflow but also temperature variations on the mask and face, which are critical for understanding both leakage and the overall efficacy of the mask in preventing the spread of aerosols. The agreement between computational and measured temperature across two breathing cycles, including inhalation and exhalation (Figure 2c), confirmed the model’s capacity to simulate real-life conditions.

3.2. Airflows

3.2.1. No Mask (NM)

Figure 3 compares the relative effects of forced convection vs. natural convection in the no mask (NM) scenario. Two velocities were selected during exhalation: 1.703 m/s (NM1) and 0.56 m/s (NM2, one-third of NM1), as listed in Table 1. The simulation reveals a key distinction between these two scenarios, showing how airflow characteristics shift based on velocity. At higher velocities (NM1), exhaled air forms a stable, jet-like flow that projects outward and diagonally downward from the nostrils. The strong momentum of this jet-like flow prevents significant interaction with the surrounding air, allowing the airflow to retain heat and moisture for a longer duration as it travels away from the face. In contrast, in the reduced velocity scenario (NM2), buoyancy forces dominate, causing the airflow to curve upward due to thermal expansion and lower momentum. This slower, upward-curving flow results in more mixing with the ambient air, leading to a faster dissipation of heat and moisture.
The influence of buoyancy is particularly evident in NM2, where the reduced velocity allows the exhaled air to lose its initial inertia quickly (Figure 3a vs. Figure 3b). This inertial reduction creates a scenario where the warm, moist exhalation rises due to the natural buoyant forces acting on the less dense moist air. The result is a more pronounced upward curve in the exhalation path compared to NM1, where the stronger airflow resists buoyancy and continues in a more jet-like trajectory. This distinction demonstrates how exhalation dynamics can vary significantly depending on the force of the breath, with slower velocities leading to more rapid cooling and moisture loss.
Quantitative data from probes placed at the philtrum (P1) and in front of the lips (P2) further underscore these differences, as shown in Figure 3c. At both probe locations, NM1 exhibits higher values for temperature, relative humidity (RH), dew point temperature (Tdew), and vapor mass fraction (Vmf), indicating that the fast-moving jet maintains heat and moisture more effectively. In NM2, however, these parameters drop off more sharply between P1 and P2 due to the increased mixing with the cooler surrounding air. These data reveal a key insight: higher exhalation velocities, as in NM1, not only preserve heat and moisture closer to the source but also result in a less mixed (more concentrated) exhaled flow, which contrasts with the dispersed and cooler flow in NM2.
The interplay between velocity and buoyancy also impacts the thermal expansion of the exhaled air, as visualized in Figure 3a,b. The Boussinesq approximation used in the simulations shows that even small temperature differences between the exhaled air and the ambient environment can noticeably alter the airflow’s trajectory. In NM2, the buoyant forces are stronger due to the lower velocity, causing the exhaled air to rise more sharply. This thermal expansion effect is less pronounced in NM1, where the higher velocity helps maintain a more stable, direct flow, minimizing the influence of buoyancy.
Schlieren imaging in Figure 3a,b provides visual confirmation of these simulated results, offering further validation of the computational model. The images show a clear correspondence between the modeled airflow patterns and the actual behavior of exhaled air under both NM1 and NM2 conditions. In NM1, the Schlieren imaging captures the straight, jet-like flow (Figure 3a), while in NM2, the upward-curving airflow due to buoyancy is distinctly visible (Figure 3b). This strong agreement between the experimental imaging and the simulation results highlights the accuracy of the model in capturing complex airflow dynamics, reinforcing its utility for studying exhalation behavior under various conditions.

3.2.2. Airflow and Pressure Visualization in Mask-Wearing Cases

Figure 4 compares the expiratory flow dynamics and pressure at t = 8 s among three mask-wearing cases: no-leak, top gap, and side gap, which will be referred to as NL, Top, and Side henceforth. The two panels on the leftmost side in Figure 4a–c show the front and lateral views of the streamlines colored by velocity. First, the velocities of the airflow passing through the mask (cyan to greenish colors, 0.08–0.13 m/s) are much lower than those inside the mask (red color). This is because the mask resistance effectively spreads the exhaled flows across its entire surface, increasing the filtration area and reducing the penetrating speed. Meanwhile, strong recirculation occurs within the mask-face space, retaining the large flow inertia and high-speed emanating from the nostrils. The low speed of the filtered airflows causes their streamlines to curve upward, as the buoyancy force experienced by these warm flows in a cooler environment overcomes the low flow inertia.
Second, the existence of a gap at the mask–face interface can cause a large fraction of leakage flow, indicated by the dense, red streamlines exiting through the top and side gaps (Figure 4b,c). In Figure 4b, the high-speed leakage flow from the top gap (red) decreases the local pressure and draws inward the low-speed streamlines rising from the outer surface of the mask (cyan color), which converge at the top of the forehead. Strong leakage flows from the top and side gaps also clearly manifest themselves in the plots of flow iso-surfaces (at 0.25 m/s, third panel), vortices (fourth and fifth panels), and cross-sectional velocity contours (sixth panel, Figure 4b,c). It is interesting to note the accumulation of vortices around the model’s geometrical landmarks, such as the mask pleats, mask–face interface, brow, etc., demonstrating a high sensitivity of instantaneous coherent structures to the surface topology. These coherent structures are often considered as energy capacitors with concentrated moment, energy, and moisture mass, which can play an important role in mask-related thermoregulation and vapor trapping.
The rightmost panels in Figure 4a–c show the pressure under the mask during exhalation (t = 8 s), which is the highest in the NL case and lower in the two gap cases. The clear distinction of pressure between the inside and outside of the mask, irrespective of gap presence, suggests that the mask filter medium is an effective flow barrier. The expiratory pressure drop across the mask is 1.12, 0.34, and 0.29 Pa in the case of NL, Top, and Side (rightmost, Figure 4a–c). In contrast, the pressure drop from the trachea to the nostrils is substantially higher, at 13.6, 12.9, and 12.8 Pa for the three cases, respectively.
In the two gap cases (Figure 4b,c), the pressure distribution under the mask is non-uniform, being higher close to the inner surface of the mask (i.e., low-speed flows) and lower around the nostrils or gaps (i.e., fast-moving flows). Note that the same volume (i.e., tidal volume) of exhaled airflows will exit into the environment regardless of gap presence, shape, size, or location. The presence of a gap, however, can significantly (1) reduce the overall breathing resistance and (2) redistribute the exhaled flow between the mask filtration and gap leakage. In addition, depending on the gap size and location, the flow dynamics change, further affecting mask-associated heat and mass transfer, which will be examined in detail in later sections.

3.2.3. Leakage Flow Quantification

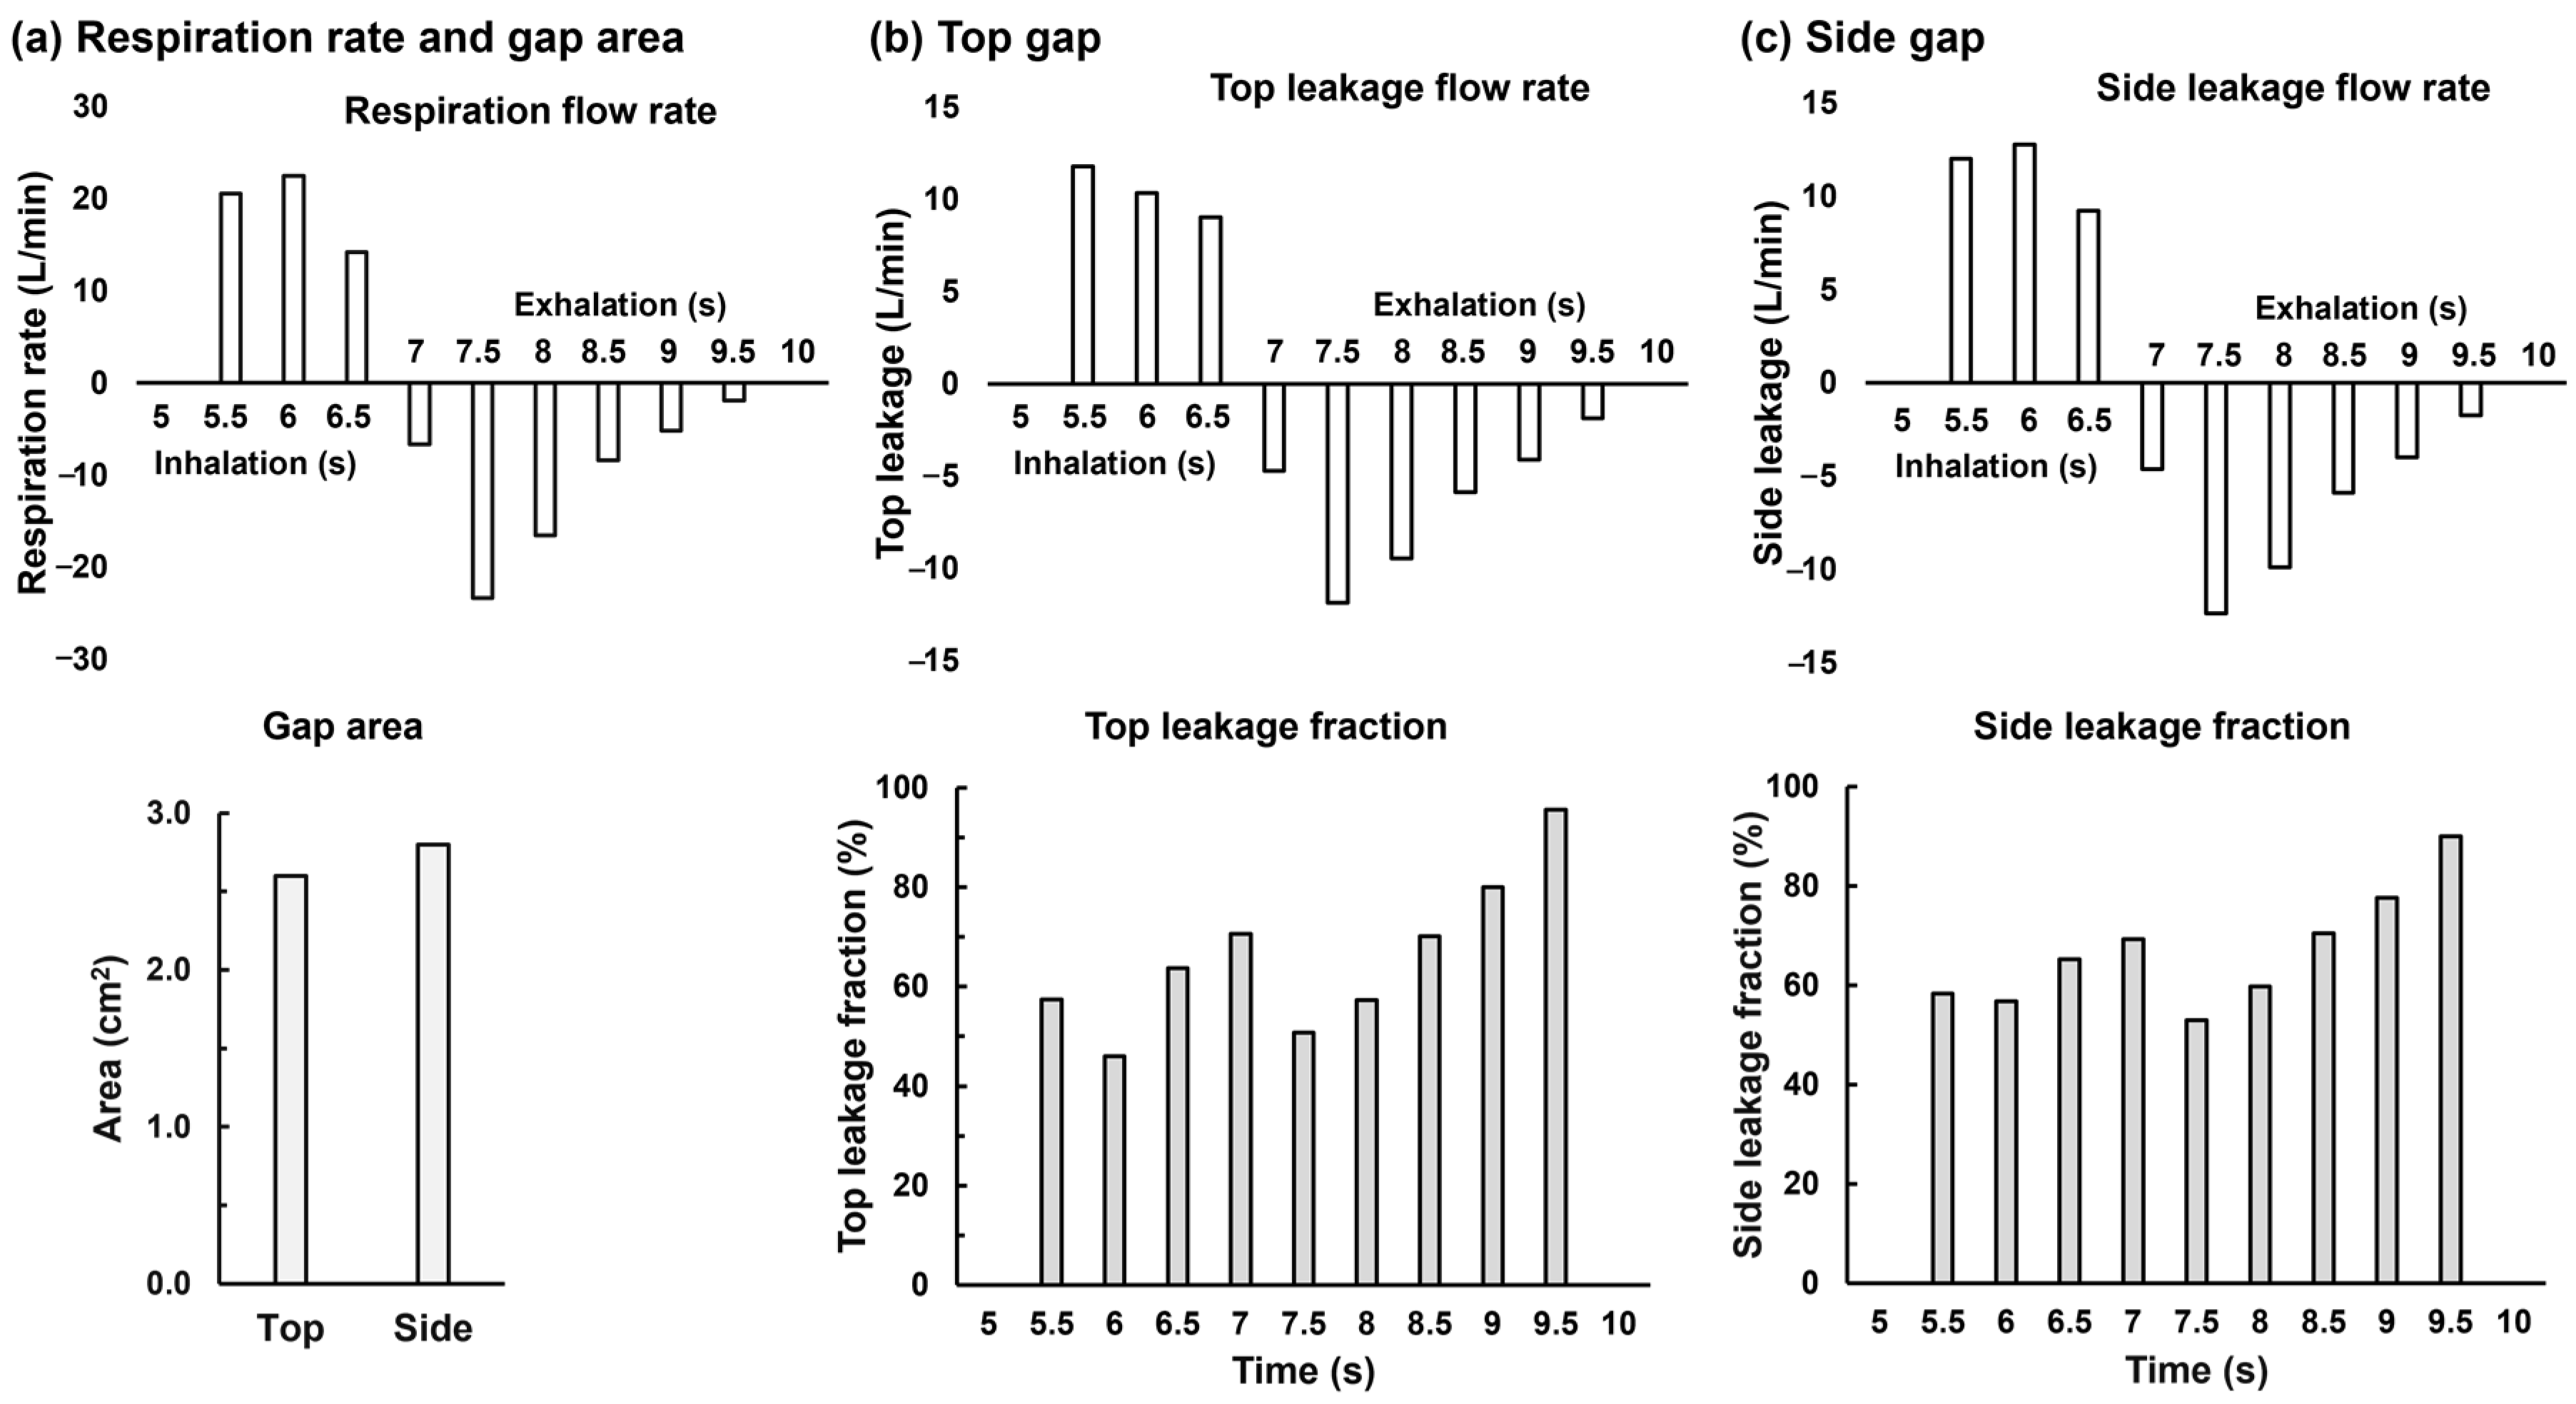
Considering that the flow partition between the mask filter medium and the gap may not be constant, instantaneous leakage flow rate and leakage fraction have been quantified at nine instants within one breathing cycle (5–9 s) for the two gap cases (Figure 5). Figure 5a shows the temporal variation of the respiration flow rate in and out of the lung through the trachea (upper panel). The areas of the two gaps are very close, i.e., 2.6 cm2 for the top and 2.8 cm2 for the side, as presented in the lower panel of Figure 5a.
For both gaps, the leakage flow rate appears to follow the respiration flow rate (upper panels, Figure 5a–c). However, when plotting the leakage flow as the fraction over the respiration flow rate, we observe different ratios vs. time (lower panels, Figure 5b,c). Overall, the mean leakage fraction is around 55% for the top gap and 60% for the side gap. It is also observed that, during exhalation, the leakage fraction constantly increases for both gap cases and reaches 90% at 9.5 s. Although this may seem too high, it is possible considering two factors: (1) the mask filter resistance is much higher than the gap-induced flow resistance; and (2) the mask filter resistance is a material property (thus independent of the flow rate Q, or ΔP = RˑQ), while the gap-induced flow resistance is proportional to Q (ΔP~Q2 or QˑQ). The lower the flow rate, the smaller the gap resistance relative to the mask filter, leading to a linearly increasing leakage fraction during 7.5–9.5 s (exhalation) when the respiration rate constantly decreases.

3.3. Leakage-Elicited Thermo-Humidity Regulations

3.3.1. No Leak

Figure 6 shows the temporal variation of the thermo-humidity variables in the no-leak scenario within the second breathing cycle (5–10 s); the first cycle (0–5 s) was conducted only to establish the respiration flow and remove spurious effects from initial conditions. The cooling effect during inhalation (5–6.8 s) is apparent. As shown in the first panel of Figure 6a, the airflow temperature at 5.5 s (i.e., 0.5 s after the onset of the second breathing cycle) is low close to the mask but remains high on the mask-covered face, especially the nose, which has lower ventilation from the cooler inspiratory airflow relative to other mask-covered regions. With further inhalation (5.5–6.5 s), both the airflow temperature and facial temperature under the mask continue to decrease. However, the cooling effects on the mask-covered face are uneven and are particularly low on the nose, whose temperature remains persistently high.
At 7.5 s (exhalation), the airflow temperature starts to increase due to the exhaled air, while the facial temperature remains unchanged. With continuous exhalation, the facial temperature increases until reaching an equilibrium with the warm, moist air (8.5 s, Figure 6a). At the same time, continual exhalation further warms up the airspace under the mask almost homogenously due to strong mixing, including the nose, which is the least ventilated and is the last region to be warmed up underneath the mask.
The dew point temperature, Tdew, at which the current vapor starts to condensate into liquid, is plotted in Figure 6b. Thus, Tdew is closely correlated to the local vaper mass fraction Vmf). As expected, the highest Tdew (or Vmf) is observed at the end of exhalation because of the maximal cumulation of exhaled moisture (9.5 s, Figure 6b), while the lowest Tdew occurs during inhalation (6.5 s, Figure 6b) when the inspiratory dry air dilutes the trapped moist air under the mask.
One interesting observation is that, during the inhalation–exhalation transition (6.5–7.5 s), the location of the lowest Tdew coincides with the beard and mustache (upper lip, 7.5 s, Figure 6b) of a typical adult male. For instance, at 6.5 s, the lowest Tdew region under the mask is the chin (pink arrow, Figure 6b), and at 7.5 s is the region around the upper lip, where the mustache grows (red arrow, Figure 6b). This observation reflects a larger fluctuation magnitude in Tdew (or Vmf) than in other regions within one breathing cycle. Considering that facial hair is related to the thermoregulation of that region, the above observation may be consistent with certain biological implications, e.g., aiding air-conditioning of tissue in the perioral area, which is more sensitive than other facial regions to thermal stress.
Figure 6c shows the difference between the local temperature and Tdew; a negative value indicates potential vapor condensation. Note that condensation occurs when the local air contains more moisture than it can hold (i.e., RH ≥ 100%), often due to a decreased temperature (T ≤ Tdew). Facemask-associated condensation will most likely occur during exhalation, which supplies excess vapor to a relatively cooler environment than exhaled air. A trace of negative (T ≤ Tdew) in the mask filter medium (red color) is spotted at 7.5 s, which grows progressively throughout the entire exhalation process (7.5–9.5 s, Figure 6c). In Figure 6d, the temporal RH variation confirms the above observation. It also shows that the highest RH, both in the mask-covered space and on the face, occurs at the end of exhalation. The RH values are close to saturation at 9.5 s (Figure 6d), indicating a potential to elicit a wet sensation on the covered face.
The temperature and moisture content on the face are presented in Figure 6e and 6f, respectively. Obviously, the mask-covered face cools down during inhalation (5.5–6.5 s) and warms up during exhalation (7.5–9.5 s), Even with no leak, the exhaled warm air, after passing through the mask filter medium, rises up due to buoyancy and increases the temperature of the forehead region, particularly the inner edges of the eyes (Figure 6e). The only region that remains at high temperatures throughout the breathing cycle is the mask-covered nose, as visualized in Figure 6a.
The vapor mass fraction (Vmf) on the face varies drastically within one breathing cycle both inside and outside the mask (Figure 6f). Vapor trapping within a well-fit mask is evident, as shown by the clear distinction of Vmf inside and outside the mask, indicating that the mask is an effective barrier to vapor transport. The highly heterogeneous vapor distribution under the mask indicates that vapor transport is sensitive to the facial geometrical details of the model in this study. Low vapor concentrations are noted at 6.5 s in Figure 6f at the chin and nose tip, and at 7.5 s at the mustache region, corroborating the similarly low Tdew observed in Figure 6b.

3.3.2. Top Gap

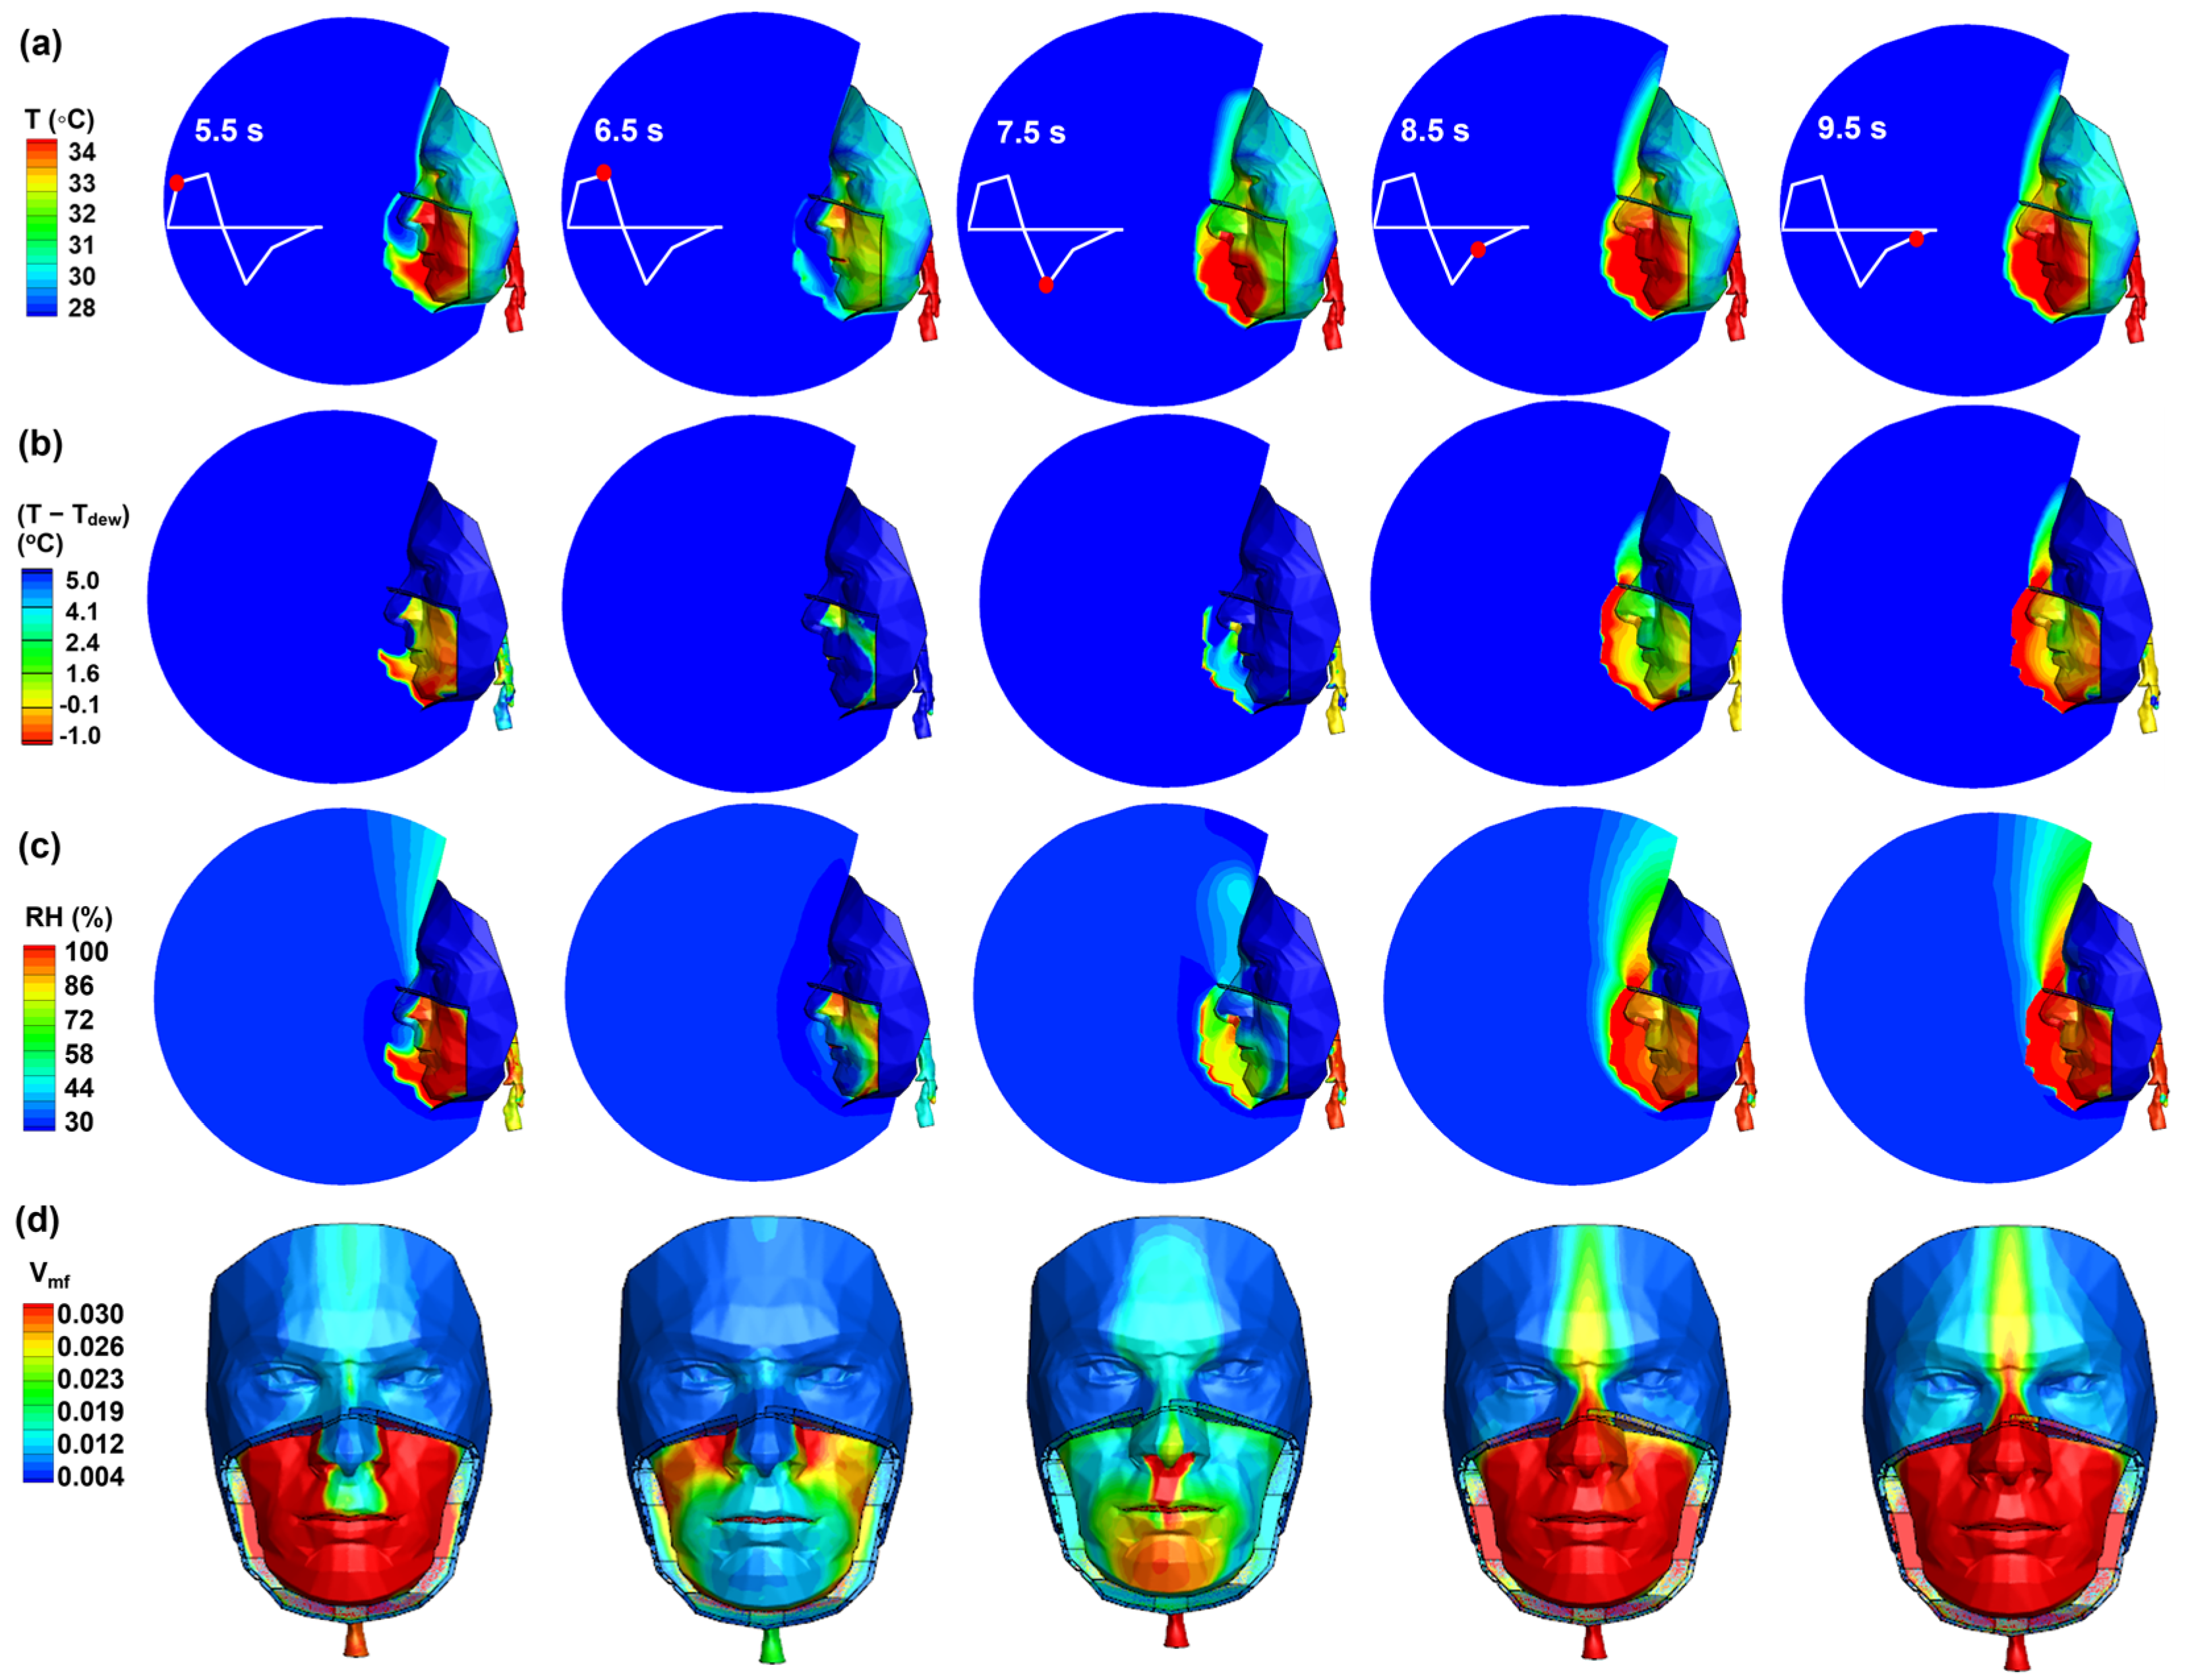
Effects of a leakage flow at the nose top on thermo-humidity regulation are shown in Figure 7. Considering the temperature, two differences are noteworthy. First, the influx of ambient air through the top gap quickly cools down the trapped air close to the nose. On the other hand, the decreased influx through the mask slows the cooling process of the trapped air in the chin area, as evidenced by the distinct temperatures in the upper and lower regions of the mask (5.5 s, Figure 7a). Second, at 6.5 s, the majority of the mask-covered space has been cooled down by the strong convection of the leakage flow. The facial temperature at 6.5 s is also notably lower than that in the no-leak scenario. The persistently high temperature on the nose in the no-leak case is also absent here at 6.5 s and 7.5 s. From 7.5 s, the temperature of the face and nose starts to increase and becomes similar to that in the no-leak case at 8.5 s (Figure 7a vs. Figure 6a).
The temporal evolution of (T − Tdew) and RH shares certain resemblances with that of the temperature (Figure 7b,c vs. Figure 7a). First, the quick intake of cool, dry air through the gap from the environment swiftly washes out the trapped moisture and thus reduces the chance for vapor condensation (6.5 s, Figure 7b). Second, during exhalation, similar patterns in (T − Tdew) between the top-gap and no-leak cases are observed, despite the quick efflux of expiratory warm, moist air from the top gap. Even though this decreases the vapor accumulation, it also decreases the thermal buildup, which together leads to similar patterns in (T − Tdew) and RH to those of the no-leak case (Figure 7b,c vs. Figure 6c,d).
Considering the vapor mass fraction Vmf at varying instants in Figure 7d, the top gap leads to two signature features: the localized cooling/drying of the philtrum and nose during inhalation (5.5 s, Figure 7d) and the focused moist region on the forehead during exhalation (8.5–9.5 s, Figure 7d). By contrast, both features are absent in the no-leak scenario. The moisture distribution on the forehead during exhalation is significantly more dispersed in the no-leak case, where all exhaled vapor slowly penetrates the mask before rising upward, yielding a diffusive vapor distribution on the eyes and forehead (9.5 s, Figure 6f).

3.3.3. Side Gap

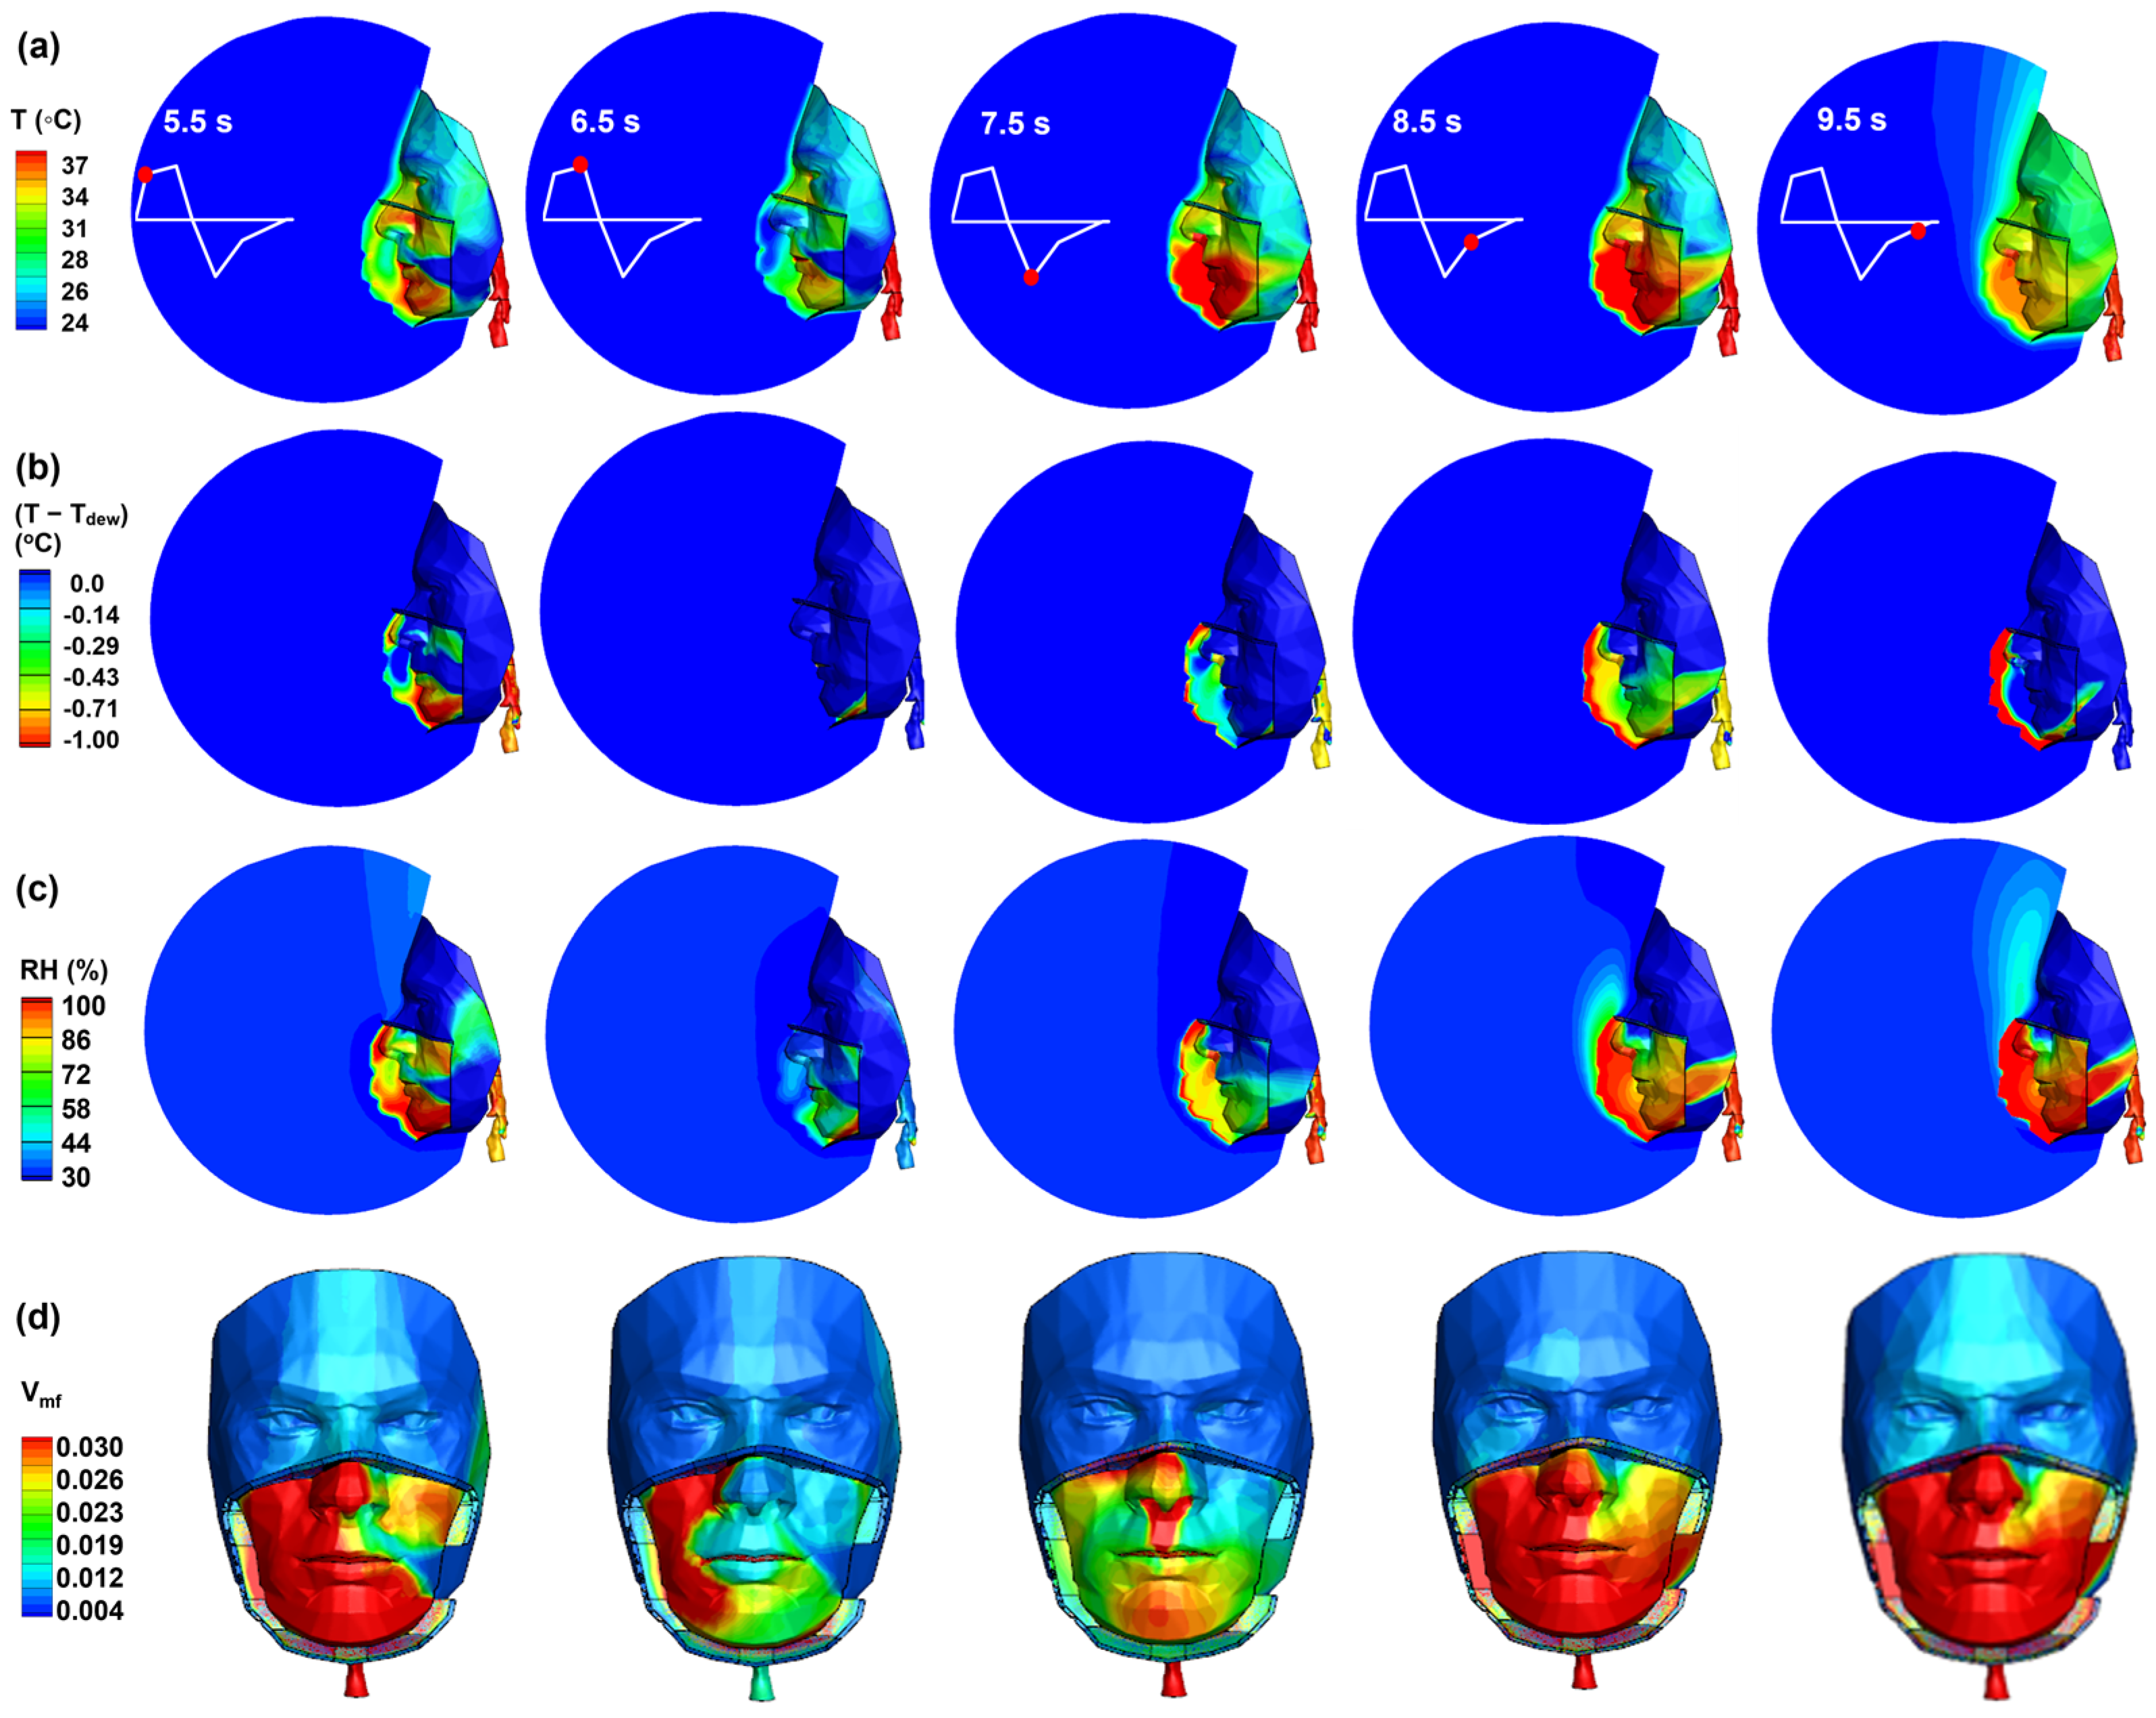
In comparison to the no-leak or top-gap scenarios, the side gap elicited distinct features in thermo-humidity dynamics underneath the mask. Recall that a mean of 60% of respiratory flows entered or exited the mask-face space through the gap (presented in Figure 5). The closer proximity between the side gap and nostrils, as well as the horizontal leakage flow direction, results in quicker cooling and warming of the left cheek during inhalation and exhalation, respectively (Figure 8a). The persistently high temperature on the nose in the no-leak case was absent in this case during inhalation; the nose temperature was also apparently lower during exhalation (Figure 8a vs. Figure 6a), indicating a potent cooling effect with a side gap. Due to the buoyancy effect, the exhaled leakage flow rises upward along the left face (Figure 8a, 7.5–9.5 s). By contrast, the inhalation flows through the gap do not follow this pattern, but instead show a converging pattern (Figure 8a, 5.5–6.5 s, blue color).
The distributions of (T − Tdew) and RH are also notably altered by the side leakage flows (Figure 8b,c). In addition to the large fluctuation amplitude and upward-curving profiles on the left face, pronounced differences in (T − Tdew) are observed at the beginning of inhalation (5.5 s) and exhalation (7.5 s), when the strong convective leakage flows disturb the moisture distribution and alter the regional potential for vapor condensation. At 5.5 s, the swift cooling effect from inhalation leakage flows increases the chance of vapor condensation at the bottom of the mask, i.e., close to the chin (Figure 8b). During exhalation (7.5–9.5 s), insignificant differences in (T − Tdew) patterns are noted between this and the other two cases, presumably because the slower heat buildup due to leakage flows offsets the similarly slower vapor accumulation.
In Figure 8c, the RH above the nose is significantly lower than in the other two cases at all instants considered within one breathing cycle. This is because the side gap diverts approximately 60% of respiratory flows horizontally, leaving only 40% to pass through the mask filter. Recall that, even in the no-leak case, the buoyancy force drives mask-filtered exhaled flows upward, reaching the forehead and leading to a similar pattern as the top-gap case. Highly asymmetric moisture distributions are observed on the mask-covered face in Figure 8d, as opposed to the relatively symmetric distributions in the no-leak and top-gap cases (Figure 6f and Figure 7d). From 5.5 s to 6.5 s, the inhalation of ambient air through the side gap effectively dries up the moisture on the left face (blue color, Figure 8d). During exhalation, the quick efflux of the exhaled air through the side gap delays moisture accumulation on the left side, particularly in the left upper region under the mask.

3.4. Quantitative Analysis of Thermo-Humidity Variables

A quantitative comparison of thermo-humidity variables is shown in Figure 9 in terms of T, RH, and Vmf at sampling points P2–P6. Results at P1 are not presented due to their close similarity to those at P2. Due to the proximity of P2 to the nostril, insignificant differences among the three cases are noted in RH, and Vmf, with T being more sensitive to the top gap than to the NL and side gap scenarios (Figure 9a).
P3 is in proximity to the inner surface of the mask, while P4 is located outside the mask opposite P3. Considering temperature, the fluctuation amplitude at P3 in the NL scenario is smaller than those in the Top and Side gap cases, reflecting the mask’s effective thermal insulation. By contrast, the NL case has the largest fluctuation amplitude at P4, as all NL respiratory flows pass through the mask and thus carry more thermal energy across it. The similarity between the Top and Side gap cases in the temperature profiles at P3 and P4 is consistent with the similar gas size and leakage flow fractions through them, as previously presented in Figure 5.
At P3 (Figure 9b), the difference in RH or Vmf among the three cases is smaller than that in temperature (T), reflecting that the mask resists mass transfer more effectively than heat transfer. At P4, which is outside the mask, the higher T fluctuation magnitude with NL than Top and Side is due to the larger mass transfer through the mask in the NL scenario (Figure 9c). Worth noting is the difference in the temporal profiles of T vs. RH and Vmf; the latter exhibits a simpler dome shape (i.e., without the reflection point), indicating stronger nonlinear dynamics affecting vapor behavior.
P5 is located at the side gap (Figure 9d). As expected, the T profile with a side gap (blue color) has a significantly larger fluctuation magnitude than that with NL (black dashed) or a top gap (red). The RH profile with a side gap also differs from that with NL or a top gap; the former appears to closely follow the inhalation–exhalation waveform, while the latter two have prolonged high-RH, indicating vapor trapping at the side mask-face interface when there is no leak. The RH difference among the three cases is also smaller in magnitude than the T difference, reflecting different transfer mechanisms for mass and heat. Similar profiles between Vmf and RH are observed at P5 (Figure 9d).
P6 is located at the nose bridge (Figure 9e). As expected, the largest T fluctuation at P6 occurs in the top-gap scenario (red color), due to strong leakage flows at P6, causing cooling/warming during inhalation/exhalation. For the same reason, the largest fluctuation amplitudes of RH and Vmf are also found in the top-gap scenario. On the other hand, the smallest fluctuation amplitude occurs in the side-gap case, which diverts a large portion of respiratory flow horizontally, leaving only a small portion of respiratory flow reaching the nose bridge. Moreover, the lowest absolute RH value is 30%, which is consistent with the ambient RH.
There are two unique features in the RH profile at P6 in the top-gap scenario (red color, Figure 9e): (1) the phase shift and (2) the bimodal pattern (with a reflection point). This phase shift to the left is due to the quick convection of top leakage flows that causes an earlier start of RH elevation. The bimodal profile with a top gap can be attributed to two concurrent flows in the forehead region: the fast-moving leakage flow through the top-gap and the slow-moving thermal plume rising from the mask’s outer surface. The larger magnitude of the second peak presumably results from the increasing fraction of the leakage flow towards the end of exhalation (as shown in Figure 5), which maximizes vapor transport toward the forehead, including P6 (Figure 9e).

4. Discussion

During the global COVID-19 pandemic with the universal mask mandate, it was not uncommon to experience or observe various types of misfits related to mask-wearing [50]. People instinctively adjust or remove their masks when heat- or vapor-related discomfort becomes excessive, leading to leakage flows and reduced protection efficiency. To explore the effects of leakage on these thermo-humidity dynamics, a computational model was developed that unified environmental factors, mask characteristics, facial anatomy, respiratory pathways, and variable gaps at the mask–face interface. This model incorporated various heat transfer mechanisms, including cyclic cooling/warming, tissue heat production, facial thermal dissipation, vapor condensation, and moist air thermal expansion. Benchmark model predictions were validated against experiments both visually and quantitatively. Respiratory flows and thermo-humidity regulation were then investigated under cyclic breathing conditions. The simulations revealed several previously undocumented aspects of mask-associated dynamics, offering insights that traditional experimental methods could not capture. These findings have practical implications for developing mask fit evaluation tools and establishing evidence-based guidelines for mask usage and design, which are discussed in more detail below.

4.1. Leakage Flows and Thermoregulation

Results of this study demonstrate that, for a given gap, the leakage flow fraction is not constant but varies with time over the breathing cycle. For both the top and side gaps considered herein, the temporal variation appears erratic during inhalation but exhibits a regular trend during exhalation, increasing constantly from 7.5 s to 9.5 s, as shown in Figure 5b,c. With a gap area of 2.6–2.8 cm2, the mean leakage fraction is approximately 55–60%; however, the leakage fraction increases to 90% at 9.5 s. Although the exhalation flow rate is very low at the end of exhalation (9.5 s), this elevated leakage ratio is still alarming from a public health perspective, indicating a higher viral transmission risk (i.e., unfiltered exhalation) from an infected person than previously estimated. Such risks could be particularly higher for health professionals or caretakers, considering the nature of frequent and close contact with patients. This also highlights that proper mask-wearing with a good fit is essential to curb viral transmission [51,52,53,54].
This study provides new insights into the thermal discomfort of mask-wearing and people’s natural tendency to loosen masks to alleviate that discomfort. With a perfectly sealed mask (i.e., no leak), the nose under the mask maintains a consistently high temperature throughout the entire respiratory cycle (Figure 6a). Note that other facial regions under the mask, unlike the nose, experience alternative cooling and warming phases. With persistent thermal stress without cooling recovery, tissue irritation can grow beyond tolerance after prolonged mask-wearing. On the other hand, it is also observed that a small gap at the mask–face interface can induce significant leakage, which effectively cools down the nose during inhalation (Figure 7a and Figure 8a), providing relief that interrupts accumulating irritation to the nose tissue.

4.2. Moisture Accumulation and Implications

In a recent study, we investigated mask-associated thermoregulation in a perfectly sealed surgical mask in an environment of 10 °C both experimentally and numerically [39]. Transient temperature variations under the mask were measured using thermal probes at 10 °C, and results were used to validate model predictions [39]. This new study focused on mask thermoregulation in a typical indoor environment (24 °C and 30% RH). Moreover, the effects of leakage from a top gap and side gap were considered, which were absent in [39]. To assess moisture retention, relative humidity (RH) and dew point temperature (Tdew) were also evaluated, which showed high potential for vapor condensation (i.e., RH ≥ 100% or T ≤ Tdew) during exhalation, as shown in Figure 6, Figure 7, Figure 8 and Figure 9. Potential vapor condensation during exhalation was predicted for all three cases considered (no-leak, top-gap, and side gap), indicating a minor effect of the leakage flow on moisture retention within the mask filter medium. Condensation occurred when warm, moist air was exhaled through the nostrils and contacted the cold filter medium, which had been cooled by inspiratory flow and was still warming during expiration. Considering that both vapor transport and mask cooling/warming are transient in nature, the condensed moisture will be sensitive to the respiration rate, tidal volume, and the inhalation/exhalation (I/E) ratio [55,56].
Condensation can interfere with a mask’s ability to maintain proper functions, impacting both breathability and filtration efficiency. Guan et al. highlighted that the increase in moisture inside a mask could reduce its air permeability, leading to increased breathing resistance and thermal discomfort [57]. Tcharkhtchi et al. showed that moisture buildup can interfere with the mask’s ability to filter out particles effectively, potentially compromising its protective capabilities [58]. Furthermore, the presence of moisture increases the electrical conductivity of the fibers, leading to charge dissipation over time [59]. The moist environment also potentially serves as a medium for microbial growth, further compromising the mask’s protective properties [60,61,62]. Thus, managing moisture accumulation in facemasks is crucial for maintaining their filtration efficiency, breathability, and hygiene [63,64,65,66].

4.3. Limitations

This study has several limitations that should be considered when interpreting its findings. Firstly, only a surgical mask model with two gaps (top and side) was considered. Developing a mask fit tester based on temperature measurements necessitates simulations of more leakage scenarios [67,68]. Secondly, only a standardized head model was used, yet human facial features exhibit considerable intersubject variability, which may alter the vortex dynamics, as shown in Figure 5 [69]. Thirdly, ambient conditions can significantly affect the physiological responses of the facial tissues [70]. During high-temperature periods, the trapped moisture and impaired heat dissipation can significantly increase the risk of heat-related stress, particularly affecting individuals who must wear masks for extended periods in warm environments or exercising high levels of physical activity [71,72,73]. Further numerical simulations and complementary experiments are needed in future studies.

5. Conclusions

A mask-wearing computational model with different gaps was developed, and various thermo-humidity processes were considered, including cyclic cooling/warming, tissue heat generation, thermal expansion, and moisture condensation. This model was experimentally validated using leakage flow measurement, Schlieren visualization, and real-time temperature monitoring beneath the mask. The validated model was applied to investigate the effects of gaps on cyclic airflows, heat transfer, and vapor transport/condensation. Specific findings are listed below:
(1)
The balance between natural and forced convection plays an important role in regulating thermo-humidity underneath the mask and is sensitive to leakage flows.
(2)
For a given gap, the leakage fraction varies significantly within one breathing cycle.
(3)
In the no-leak scenario, the nose is the major region that benefits least from inhalation cooling and thus experiences excess thermal stress throughout the breathing cycle. Leakage flows mitigate this stress during inhalation in both top and side gap cases.
(4)
Vapor condensation occurs in the mask filter medium during exhalation for all mask-wearing cases, causing moisture retention in the filter.
(5)
When considering thermo-humidity variations at a matrix of sampling points, unique patterns are observed that differentiate the no-leak, top-gap, and side-gap cases, suggesting the feasibility of leveraging multi-point thermo-humidity measurements to quantify mask fit and/or leakage fraction.

Author Contributions

Conceptualization, X.S., R.H. and J.X.; methodology, K.B., X.S. and J.X.; software, K.B. and J.X.; validation, R.H., X.S. and J.X.; formal analysis, K.B., X.S. and J.X.; investigation, K.B., X.S. and J.X.; data curation, K.B. and R.H.; writing—original draft preparation, K.B. and J.X.; writing—review and editing, X.S. and R.H.; visualization, K.B. and J.X.; supervision, R.H. and J.X. All authors have read and agreed to the published version of the manuscript.

Funding

This research received no external funding.

Institutional Review Board Statement

The study was conducted in accordance with the Declaration of Helsinki and approved by the Institutional Review Board of University of Massachusetts Lowell, (24-177-XI-XPD, date of approval: 18 November 2024).

Informed Consent Statement

Informed consent was obtained from all subjects involved in the study.

Data Availability Statement

The original contributions presented in this study are included in the article. Further inquiries can be directed to the corresponding author.

Acknowledgments

Amr Seifelnasr at UMass Lowell Biomedical Engineering is gratefully acknowledged for editing and proofreading this manuscript.

Conflicts of Interest

The authors declare no conflicts of interest.

References

  1. Scheid, J.L.; Lupien, S.P.; Ford, G.S.; West, S.L. Commentary: Physiological and psychological impact of face mask usage during the COVID-19 pandemic. Int. J. Environ. Res. Public. Health 2020, 17, 6655. [Google Scholar] [PubMed]
  2. Cucinotta, D.; Vanelli, M. WHO declares COVID-19 a pandemic. Acta Biomed. 2020, 91, 157–160. [Google Scholar] [PubMed]
  3. Buzzin, A.; Domènech-Gil, G.; Fraschetti, E.; Giovine, E.; Puglisi, D.; Caputo, D. Assessing the consequences of prolonged usage of disposable face masks. Sci. Rep. 2022, 12, 16796. [Google Scholar]
  4. Stadnytskyi, V.; Bax, C.E.; Bax, A.; Anfinrud, P. The airborne lifetime of small speech droplets and their potential importance in SARS-CoV-2 transmission. PNAS 2020, 117, 11875–11877. [Google Scholar] [CrossRef]
  5. Alsved, M.; Matamis, A.; Bohlin, R.; Richter, M.; Bengtsson, P.-E.; Fraenkel, C.-J.; Medstrand, P.; Löndahl, J. Exhaled respiratory particles during singing and talking. Aerosol Sci. Technol. 2020, 54, 1245–1248. [Google Scholar] [CrossRef]
  6. Cates, V.C.; Marullo, A.L.; Isakovich, R.; Bird, J.D.; Keess, J.L.; Ricord, K.C.; Leslie, K.M.; Janssens, A.A.; Bhardwaj, R.; Day, T.A. Comparison of mild physiological effects of surgical masks and N95 respirators over 60 min at rest. J. Appl. Physiol. 2023, 135, 227–237. [Google Scholar] [CrossRef]
  7. Gyapong, F.; Debrah, E.; Oforiwaa, M.; Isawumi, A.; Mosi, L. Challenges and adverse effects of wearing face masks in the COVID-19 era. Challenges 2022, 13, 67. [Google Scholar] [CrossRef]
  8. Pan, X.; Li, X.; Kong, P.; Wang, L.; Deng, R.; Wen, B.; Xiao, L.; Song, H.; Sun, Y.; Zhou, H. Assessment of use and fit of face masks among individuals in public during the COVID-19 pandemic in China. JAMA Netw. Open 2021, 4, e212574. [Google Scholar] [CrossRef]
  9. Su, W.-C.; Lee, J.; Xi, J.; Zhang, K. Investigation of mask efficiency for loose-fitting masks against ultrafine particles and effect on airway deposition efficiency. Aerosol Air Qual. Res. 2022, 22, 210228. [Google Scholar] [CrossRef]
  10. Schmitt, J.; Wang, J. A critical review on the role of leakages in the facemask protection against SARS-CoV-2 infection with consideration of vaccination and virus variants. Indoor Air 2022, 32, e13127. [Google Scholar] [CrossRef]
  11. Barari, K.; Si, X.; Xi, J. Impacts of mask wearing and leakages on cyclic respiratory flows and facial thermoregulation. Fluids 2023, 9, 9. [Google Scholar] [CrossRef]
  12. Xi, J.; Barari, K.; Si, X.A.; Abdollahzadeh Jamalabadi, M.Y.; Park, J.H.; Rein, M. Inspiratory leakage flow fraction for surgical masks with varying gaps and filter materials. Phys. Fluids 2022, 34, 041908. [Google Scholar]
  13. Dai, X.; Wang, Z.; Zheng, W.; He, Z.; Wang, Y. Numerical simulation of the thermo-mechanical coupling behavior of skin tissue exposed to repetitive pulse laser irradiation. Int. J. Heat. Mass. Transf. 2024, 234, 126063. [Google Scholar]
  14. Paiva-Santos, A.C.; Gonçalves, T.; Peixoto, D.; Pires, P.C.; Velsankar, K.; Jha, N.K.; Chavda, V.P.; Mohammad, I.S.; Cefali, L.C.; Mazzola, P.G. Rosacea topical treatment and care: From traditional to new drug delivery systems. Mol. Pharm. 2023, 20, 3804–3828. [Google Scholar] [PubMed]
  15. Rathi, S.K.; Dsouza, J.M. Maskne: A new acne variant in COVID-19 era. Indian. J. Dermatol. 2022, 67, 552–555. [Google Scholar] [CrossRef]
  16. Ipaki, B.; Merrikhpour, Z.; Taheri Rizi, M.S.; Torkashvand, S. A study on usability and design parameters in face mask: Concept design of UVW face mask for COVID-19 protection. Hum. Factors Ergon. Manuf. 2021, 31, 664–678. [Google Scholar]
  17. Li, Y.; Tokura, H.; Guo, Y.; Wong, A.; Wong, T.; Chung, J.; Newton, E. Effects of wearing N95 and surgical facemasks on heart rate, thermal stress and subjective sensations. Int. Arch. Occup. Environ. Health 2005, 78, 501–509. [Google Scholar]
  18. Scarano, A.; Inchingolo, F.; Lorusso, F. Facial skin temperature and discomfort when wearing protective face masks: Thermal infrared imaging evaluation and hands moving the mask. Int. J. Environ. Res. Public. Health 2020, 17, 4624. [Google Scholar]
  19. Park, S.r.; Han, J.; Yeon, Y.M.; Kang, N.Y.; Kim, E. Effect of face mask on skin characteristics changes during the COVID-19 pandemic. Skin. Res. Technol. 2021, 27, 554–559. [Google Scholar]
  20. Mohamadi, F.; Fazeli, A. A review on applications of CFD modeling in COVID-19 pandemic. Arch. Comput. Methods Eng. 2022, 29, 3567–3586. [Google Scholar]
  21. Xi, J.; Si, X.A.; Nagarajan, R. Effects of mask-wearing on the inhalability and deposition of airborne SARS-CoV-2 aerosols in human upper airway. Phys. Fluids 2020, 32, 123312. [Google Scholar]
  22. Liao, M.; Liu, H.; Wang, X.; Hu, X.; Huang, Y.; Liu, X.; Brenan, K.; Mecha, J.; Nirmalan, M.; Lu, J.R. A technical review of face mask wearing in preventing respiratory COVID-19 transmission. Curr. Opin. Colloid. Interface Sci. 2021, 52, 101417. [Google Scholar] [CrossRef] [PubMed]
  23. O’Dowd, K.; Nair, K.M.; Forouzandeh, P.; Mathew, S.; Grant, J.; Moran, R.; Bartlett, J.; Bird, J.; Pillai, S.C. Face masks and respirators in the fight against the COVID-19 pandemic: A review of current materials, advances and future perspectives. Materials 2020, 13, 3363. [Google Scholar] [CrossRef] [PubMed]
  24. Goyal, A.; Reeves, D.B.; Thakkar, N.; Famulare, M.; Cardozo-Ojeda, E.F.; Mayer, B.T.; Schiffer, J.T. Slight reduction in SARS-CoV-2 exposure viral load due to masking results in a significant reduction in transmission with widespread implementation. Sci. Rep. 2021, 11, 11838. [Google Scholar] [CrossRef]
  25. Rasekh, M.; Pisapia, F.; Hafizi, S.; Rees, D. Filtering efficiency and design properties of medical- and non-medical-grade face masks: A multiscale modeling approach. Appl. Sci. 2024, 14, 4796. [Google Scholar] [CrossRef]
  26. Schmitt, J.; Wang, J. Quantitative modeling of the impact of facemasks and associated leakage on the airborne transmission of SARS-CoV-2. Sci. Rep. 2021, 11, 19403. [Google Scholar]
  27. Bukhari, A.E.; Dakhil, A.A.B.; Albrkheel, A.A.; Almutlq, M.M.; Alolayan, O.K.; Alqahtani, M.A.; Alsubaie, F.S.; Alessa, D.S.; Alzamil, F.M. Face mask-induced skin changes: A new common phenomenon during the coronavirus disease 2019 pandemic. Dermatol. Rep 2023, 15, 9526. [Google Scholar]
  28. Gericke, A.; Militký, J.; Venkataraman, M.; Steyn, H.; Vermaas, J. The effect of mask style and fabric selection on the comfort properties of fabric masks. Materials 2022, 15, 2559. [Google Scholar] [CrossRef]
  29. Lee, K.-P.; Yip, J.; Kan, C.-W.; Chiou, J.-C.; Yung, K.-F. Reusable face masks as alternative for disposable medical masks: Factors that affect their wear-comfort. Int. J. Environ. Res. Public. Health 2020, 17, 6623. [Google Scholar]
  30. Kwong, L.H.; Wilson, R.; Kumar, S.; Crider, Y.S.; Reyes Sanchez, Y.; Rempel, D.; Pillarisetti, A. Review of the breathability and filtration efficiency of common household materials for face masks. ACS Nano 2021, 15, 5904–5924. [Google Scholar]
  31. Cherrie, J.W.; Wang, S.; Mueller, W.; Wendelboe-Nelson, C.; Loh, M. In-mask temperature and humidity can validate respirator wear-time and indicate lung health status. J. Expo. Sci. Environ. Epidemiol. 2019, 29, 578–583. [Google Scholar] [CrossRef] [PubMed]
  32. Xi, J.; Kim, J.; Si, X.A.; Mckee, E.; Corley, R.A.; Kabilan, S.; Wang, S. CFD modeling and image analysis of exhaled aerosols due to a growing bronchial tumor: Towards non-invasive diagnosis and treatment of respiratory obstructive diseases. Theranostics 2015, 5, 443–455. [Google Scholar] [CrossRef] [PubMed]
  33. Talaat, K.; Xi, J.; Baldez, P.; Hecht, A. Radiation dosimetry of inhaled radioactive aerosols: CFPD and MCNP transport simulations of radionuclides in the lung. Sci. Rep. 2019, 9, 17450. [Google Scholar] [CrossRef] [PubMed]
  34. Cai, L.; Song, A.Y.; Wu, P.; Hsu, P.C.; Peng, Y.; Chen, J.; Liu, C.; Catrysse, P.B.; Liu, Y.; Yang, A.; et al. Warming up human body by nanoporous metallized polyethylene textile. Nat. Commun. 2017, 8, 496. [Google Scholar] [CrossRef]
  35. Noto, T.; Zhou, G.; Schuele, S.; Templer, J.; Zelano, C. Automated analysis of breathing waveforms using BreathMetrics: A respiratory signal processing toolbox. Chem. Senses 2018, 43, 583–597. [Google Scholar] [CrossRef]
  36. Romanovsky, A.A. Skin temperature: Its role in thermoregulation. Acta Physiol. 2014, 210, 498–507. [Google Scholar] [CrossRef]
  37. Li, C.; Guan, G.; Reif, R.; Huang, Z.; Wang, R.K. Determining elastic properties of skin by measuring surface waves from an impulse mechanical stimulus using phase-sensitive optical coherence tomography. J. R. Soc. Interface 2012, 9, 831–841. [Google Scholar] [CrossRef]
  38. Guevara Morel, C.R.; van Reeuwijk, M.; Graf, T. Systematic investigation of non-Boussinesq effects in variable-density groundwater flow simulations. J. Contam. Hydrol. 2015, 183, 82–98. [Google Scholar] [CrossRef]
  39. Barari, K.; Thakkar, J.; Si, X.A.; Hajian, R.; Xi, J. Facemask vapor trapping, condensation, and thermoregulation. Int. J. Heat. Mass. Transf. 2024, 234, 126080. [Google Scholar] [CrossRef]
  40. Guan, X.; Li, X.; Yang, N.; Liu, M. CFD simulation of gas-liquid flow in stirred tanks: Effect of drag models. Chem. Eng. J. 2020, 386, 121554. [Google Scholar] [CrossRef]
  41. Wang, C.Y.; Cheng, P. A multiphase mixture model for multiphase, multicomponent transport in capillary porous media—I. Model development. Int. J. Heat. Mass. Transf. 1996, 39, 3607–3618. [Google Scholar]
  42. Wilcox, D.C. Formulation of the k-w Turbulence model revisited. AIAA J. 2008, 46, 2823–2838. [Google Scholar] [CrossRef]
  43. Si, X.A.; Talaat, M.; Xi, J. SARS COV-2 virus-laden droplets coughed from deep lungs: Numerical quantification in a single-path whole respiratory tract geometry. Phys. Fluids 2021, 33, 023306. [Google Scholar]
  44. Xi, J.; Zhao, W. Correlating exhaled aerosol images to small airway obstructive diseases: A study with dynamic mode decomposition and machine learning. PLoS ONE 2019, 14, e0211413. [Google Scholar] [CrossRef]
  45. Liu, J.; Hao, M.; Chen, S.; Yang, Y.; Li, J.; Mei, Q.; Bian, X.; Liu, K. Numerical evaluation of face masks for prevention of COVID-19 airborne transmission. Environ. Sci. Pollut. Res. Int. 2022, 29, 44939–44953. [Google Scholar]
  46. Sun, D.; Xu, J.; Chen, Q. Modeling of the evaporation and condensation phase-change problems with FLUENT. Numer. Heat. Transf. B Fundam. 2014, 66, 326–342. [Google Scholar] [CrossRef]
  47. Alduchov, O.A.; Eskridge, R.E. Improved magnus form approximation of saturation vapor pressure. J. Appl. Meteorol. 1996, 35, 601–609. [Google Scholar] [CrossRef]
  48. Lawrence, M.G. The relationship between relative humidity and the dewpoint temperature in moist air: A simple conversion and applications. Bull. Amer Meteor. Soc. 2005, 86, 225–234. [Google Scholar] [CrossRef]
  49. Verheyen, C.A.; Bourouiba, L. Associations between indoor relative humidity and global COVID-19 outcomes. J. R. Soc. Interface 2022, 19, 20210865. [Google Scholar]
  50. Pires, C. A pre-systematic review on the use of masks as a protection material for SARS-COV-2 during the COVID-19 pandemic. Int. J. Clin. Pract. 2021, 75, e14215. [Google Scholar]
  51. Yi, L.; Fengzhi, L.; Qingyong, Z. Numerical simulation of virus diffusion in facemask during breathing cycles. Int. J. Heat. Mass. Transf. 2005, 48, 4229–4242. [Google Scholar] [CrossRef] [PubMed]
  52. Siu, J.Y. Qualitative study on the shifting sociocultural meanings of the facemask in Hong Kong since the severe acute respiratory syndrome (SARS) outbreak: Implications for infection control in the post-SARS era. Int. J. Equity Health 2016, 15, 73. [Google Scholar] [CrossRef] [PubMed]
  53. Chaabna, K.; Doraiswamy, S.; Mamtani, R.; Cheema, S. Facemask use in community settings to prevent respiratory infection transmission: A rapid review and meta-analysis. Int. J. Infect. Dis. 2021, 104, 198–206. [Google Scholar] [CrossRef] [PubMed]
  54. Xi, J.; Lei, L.R.; Zouzas, W.; April Si, X. Nasally inhaled therapeutics and vaccination for COVID-19: Developments and challenges. MedComm 2021, 2, 569–586. [Google Scholar] [CrossRef]
  55. Ni, R.; Michalski, M.H.; Brown, E.; Doan, N.; Zinter, J.; Ouellette, N.T.; Shepherd, G.M. Optimal directional volatile transport in retronasal olfaction. PNAS 2015, 112, 14700–14704. [Google Scholar] [CrossRef]
  56. Nuckols, M.L.; Zumrick, J.L.; Johnson, C.E. Heat and water vapor transport in the human upper airways at hyperbaric conditions. J. Biomech. Eng. 1983, 105, 24–30. [Google Scholar] [CrossRef]
  57. Guan, X.; Lin, J.; Han, J.; Gao, X.; Zhang, Y.; Hu, B.; Guidoin, R.; Wang, L. Prolonged use of surgical masks and respirators affects the protection and comfort for healthcare workers. Materials 2022, 15, 7918. [Google Scholar] [CrossRef]
  58. Tcharkhtchi, A.; Abbasnezhad, N.; Zarbini Seydani, M.; Zirak, N.; Farzaneh, S.; Shirinbayan, M. An overview of filtration efficiency through the masks: Mechanisms of the aerosols penetration. Bioact. Mater. 2021, 6, 106–122. [Google Scholar] [CrossRef]
  59. Peng, Z.; Shi, J.; Xiao, X.; Hong, Y.; Li, X.; Zhang, W.; Cheng, Y.; Wang, Z.; Li, W.J.; Chen, J.; et al. Self-charging electrostatic face masks leveraging triboelectrification for prolonged air filtration. Nat. Commun. 2022, 13, 7835. [Google Scholar] [CrossRef]
  60. Morris, N.B.; Piil, J.F.; Christiansen, L.; Flouris, A.D.; Nybo, L. Prolonged facemask use in the heat worsens dyspnea without compromising motor-cognitive performance. Temperature 2021, 8, 160–165. [Google Scholar] [CrossRef]
  61. Yip, W.L.; Leung, L.P.; Lau, P.F.; Tong, H.K. The effect of wearing a face mask on body temperature. Hong Kong J. Emerg. Med. 2005, 12, 23–27. [Google Scholar]
  62. Delanghe, L.; Cauwenberghs, E.; Spacova, I.; De Boeck, I.; Van Beeck, W.; Pepermans, K.; Claes, I.; Vandenheuvel, D.; Verhoeven, V.; Lebeer, S. Cotton and surgical face masks in community settings: Bacterial contamination and face mask hygiene. Front. Med. 2021, 8, 732047. [Google Scholar]
  63. Howard, J.; Huang, A.; Li, Z.; Tufekci, Z.; Zdimal, V.; van der Westhuizen, H.M.; von Delft, A.; Price, A.; Fridman, L.; Tang, L.H.; et al. An evidence review of face masks against COVID-19. PNAS 2021, 118, e2014564118. [Google Scholar]
  64. Gupta, D. Living with in-mask micro-climate. Med. Hypotheses 2020, 144, 110010. [Google Scholar]
  65. Mehta, P.; Picken, H.; White, C.; Howarth, K.; Langridge, K.; Nazari, K.; Taylor, P.; Qutachi, O.; Chang, M.W.; Ahmad, Z. Engineering optimisation of commercial facemask formulations capable of improving skin moisturisation. Int. J. Cosmet. Sci. 2019, 41, 462–471. [Google Scholar] [CrossRef]
  66. Singh, S.; Shauloff, N.; Sharma, C.P.; Shimoni, R.; Arnusch, C.J.; Jelinek, R. Carbon dot-polymer nanoporous membrane for recyclable sunlight-sterilized facemasks. J. Colloid. Interface Sci. 2021, 592, 342–348. [Google Scholar]
  67. Sharifi, A.R.; Ardalan, S.; Tabatabaee, R.S.; Soleimani Gorgani, S.; Yousefi, H.; Omidfar, K.; Kiani, M.A.; Dincer, C.; Naghdi, T.; Golmohammadi, H. Smart wearable nanopaper patch for continuous multiplexed optical monitoring of sweat parameters. Anal. Chem. 2023, 95, 16098–16106. [Google Scholar]
  68. Bianco, G.M.; Marrocco, G. Sensorized facemask with moisture-sensitive RFID antenna. IEEE Sens. Lett. 2021, 5, 6000604. [Google Scholar]
  69. Si, X.; Xi, J.S.; Talaat, M.; Park, J.H.; Nagarajan, R.; Rein, M.; Xi, J. Visualization and quantification of facemask leakage flows and interpersonal transmission with varying face coverings. Fluids 2024, 9, 166. [Google Scholar] [CrossRef]
  70. Peko, L.; Ovadia-Blechman, Z.; Hoffer, O.; Gefen, A. Physiological measurements of facial skin response under personal protective equipment. J. Mech. Behav. Biomed. Mater. 2021, 120, 104566. [Google Scholar]
  71. Morabito, M.; Messeri, A.; Crisci, A.; Pratali, L.; Bonafede, M.; Marinaccio, A.; Group, W.C. Heat warning and public and workers’ health at the time of COVID-19 pandemic. Sci. Total Environ. 2020, 738, 140347. [Google Scholar] [PubMed]
  72. Shi, D.; Song, J.; Du, R.; Chan, P.W. Dual challenges of heat wave and protective facemask-induced thermal stress in Hong Kong. Build. Environ. 2021, 206, 108317. [Google Scholar] [CrossRef] [PubMed]
  73. Gholamreza, F.; Nadaraja, A.V.; Milani, A.S.; Golovin, K. Enhanced protection face masks do not adversely impact thermophysiological comfort. PLoS ONE 2022, 17, e0265126. [Google Scholar]
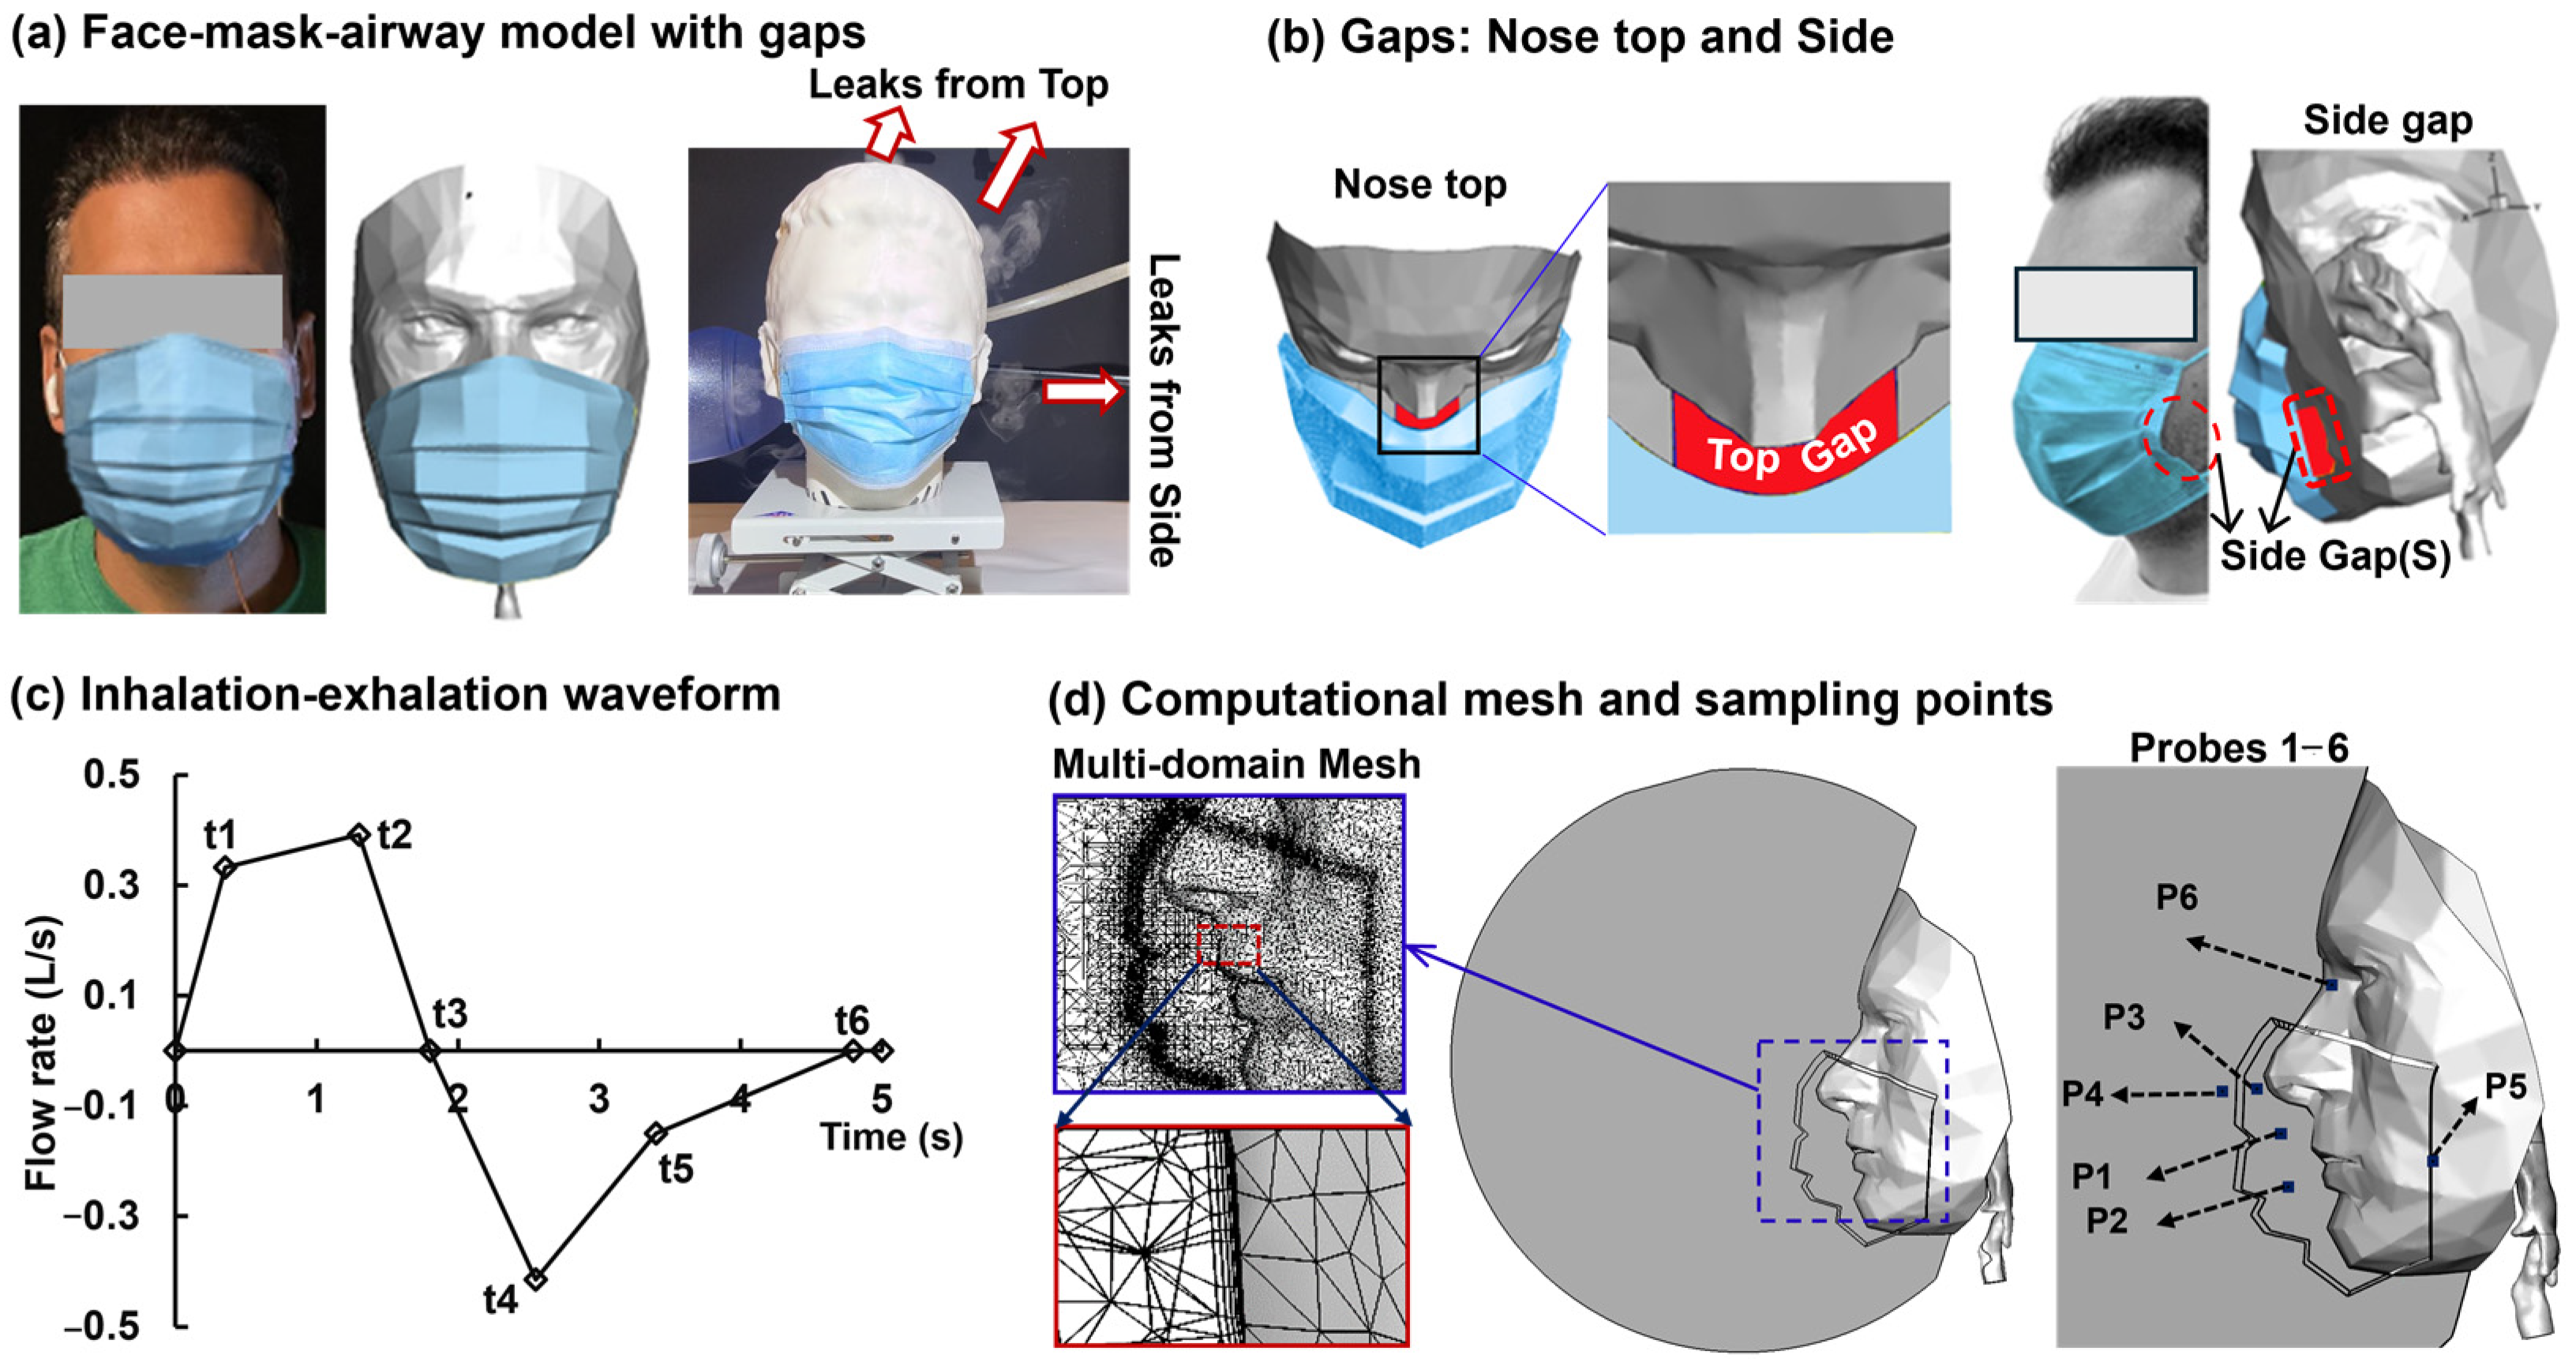
Figure 1. Model development: (a) Disposable three-pleat surgical mask and leakages from the top and side; (b) Computational model with gaps at the mask top and side; (c) Respiration waveform; (d) Computational mesh and the locations of six sampling points (probes).
Jor 05 00005 g001
Figure 2. Model validation: (a) Thermal imaging, (b) Side gap velocity, (c) Temperature measurement vs. CFD at the philtrum.
Jor 05 00005 g002
Figure 3. Comparison of airflow and thermo-humidity variables without a mask at two instants (with different velocities) during exhalation: (a) t = 7.5 s (peak exhalation); (b) t = 9 s; and (c) quantitative comparison of T, RH, Tdew, and Vmf.
Jor 05 00005 g003
Figure 4. Comparison of expiratory flows at t = 8 s in terms of streamlines, iso-surface, vortices, velocity contour, and pressure among three cases: (a) No leak (NL); (b) Top gap; and (c) Side gap.
Jor 05 00005 g004
Figure 5. Mask leakage quantification within one breathing: (a) Respiration flow rate; (b) Top gap leakage flow rate and fraction; and (c) Side gap leakage flow rate and fraction.
Jor 05 00005 g005
Figure 6. Cyclic simulation results with NL: (a) Temperature, T; (b) Dew point temperature, Tdew; (c) (T − Tdew); (d) Relative humidity, RH; (e) Temperature on the face; (f) Vapor mass fraction, Vmf, on the face. Simulations were conducted at an ambient temperature of 24 °C and an RH of 30%.
Jor 05 00005 g006
Figure 7. Cyclic simulation results with a surgical mask with Top nose gaps within a breathing cycle with an ambient temperature of 24 °C and relative humidity of 30%: (a) Temperature, T; (b) (T − Tdew); (c) Relative humidity, RH; (d) Vapor mass fraction, Vmf, on the face.
Jor 05 00005 g007
Figure 8. Cyclic simulation results with a surgical mask with side gap within a breathing cycle with an ambient temperature of 24 °C and relative humidity of 30%: (a) Temperature, T; (b) (T − Tdew); (c) Relative humidity, RH; (d) Vapor mass fraction, Vmf, on the face.
Jor 05 00005 g008
Figure 9. Predicted temperature (T), relative humidity (RH), and vapor mass fraction (Vmf) vs. time at different sampling points: (a) Point 2; (P2); (b) P3; (c) P4; (d) P5, and (e) P6.
Jor 05 00005 g009
Table 1. Boundary conditions for momentum, multiphase, and thermal equations.
MomentumMultiphaseThermal
InletNM1: 1.703, NM2: 0.56 1 m/s
Waveform
Air: N/A, Vapor: 0.039 2
Water: 0.0
310.15 K
FaceNo SlipN/A 3Mixed 4
AirwayNo SlipN/A310.15 K
Outlet (Ambient)0 PaAir: N/A, Vapor: 0.055, Water: 0.0297.15 K
1 One-third velocity in the second no-mask (NM2) scenario. 2 The mass fraction is nondimensional. 3 On the Face, nothing was assigned for the mixture. 4 Heat transfer coefficient: 0.66 W/m2·K; Emissivity: 0.98; Heat generation:6666 W/m3.
Disclaimer/Publisher’s Note: The statements, opinions and data contained in all publications are solely those of the individual author(s) and contributor(s) and not of MDPI and/or the editor(s). MDPI and/or the editor(s) disclaim responsibility for any injury to people or property resulting from any ideas, methods, instructions or products referred to in the content.