Brief Report

Influence of an Extreme Saharan Dust Event on the Air Quality of the West Region of Portugal

1
CERENA–Centro de Ambiente e Recursos Naturais, Universidade de Lisboa, 1049-001 Lisboa, Portugal
2
ISEL–Instituto Superior de Engenharia de Lisboa, Instituto Politécnico de Lisboa, 1959-007 Lisboa, Portugal
3
Innovair, Lda., 2495-40 Fátima, Portugal
*
Author to whom correspondence should be addressed.
Gases 2022, 2(3), 74-84; https://doi.org/10.3390/gases2030005
Submission received: 24 May 2022 / Revised: 24 June 2022 / Accepted: 3 July 2022 / Published: 7 July 2022

Abstract

:
This paper describes how an extreme Saharan dust event that took place in March 2022 affected the Iberian Peninsula and was noticed not only by the outdoor air quality monitoring stations measuring PM2.5 and PM10 but also by indoor air monitoring systems in Fatima, central Portugal. The observed particulate matter concentrations clearly show the influence that such an event has on the indoor air quality inside buildings and that the magnitude of that influence is also dependent on the specific characteristics of the buildings, mainly the ventilation conditions, as should be expected. Therefore, this study alerts us to the necessity of integrating indoor and outdoor air quality monitoring systems to achieve automated air conditioning systems capable of efficiently controlling both temperature and air cleanliness.

1. Introduction

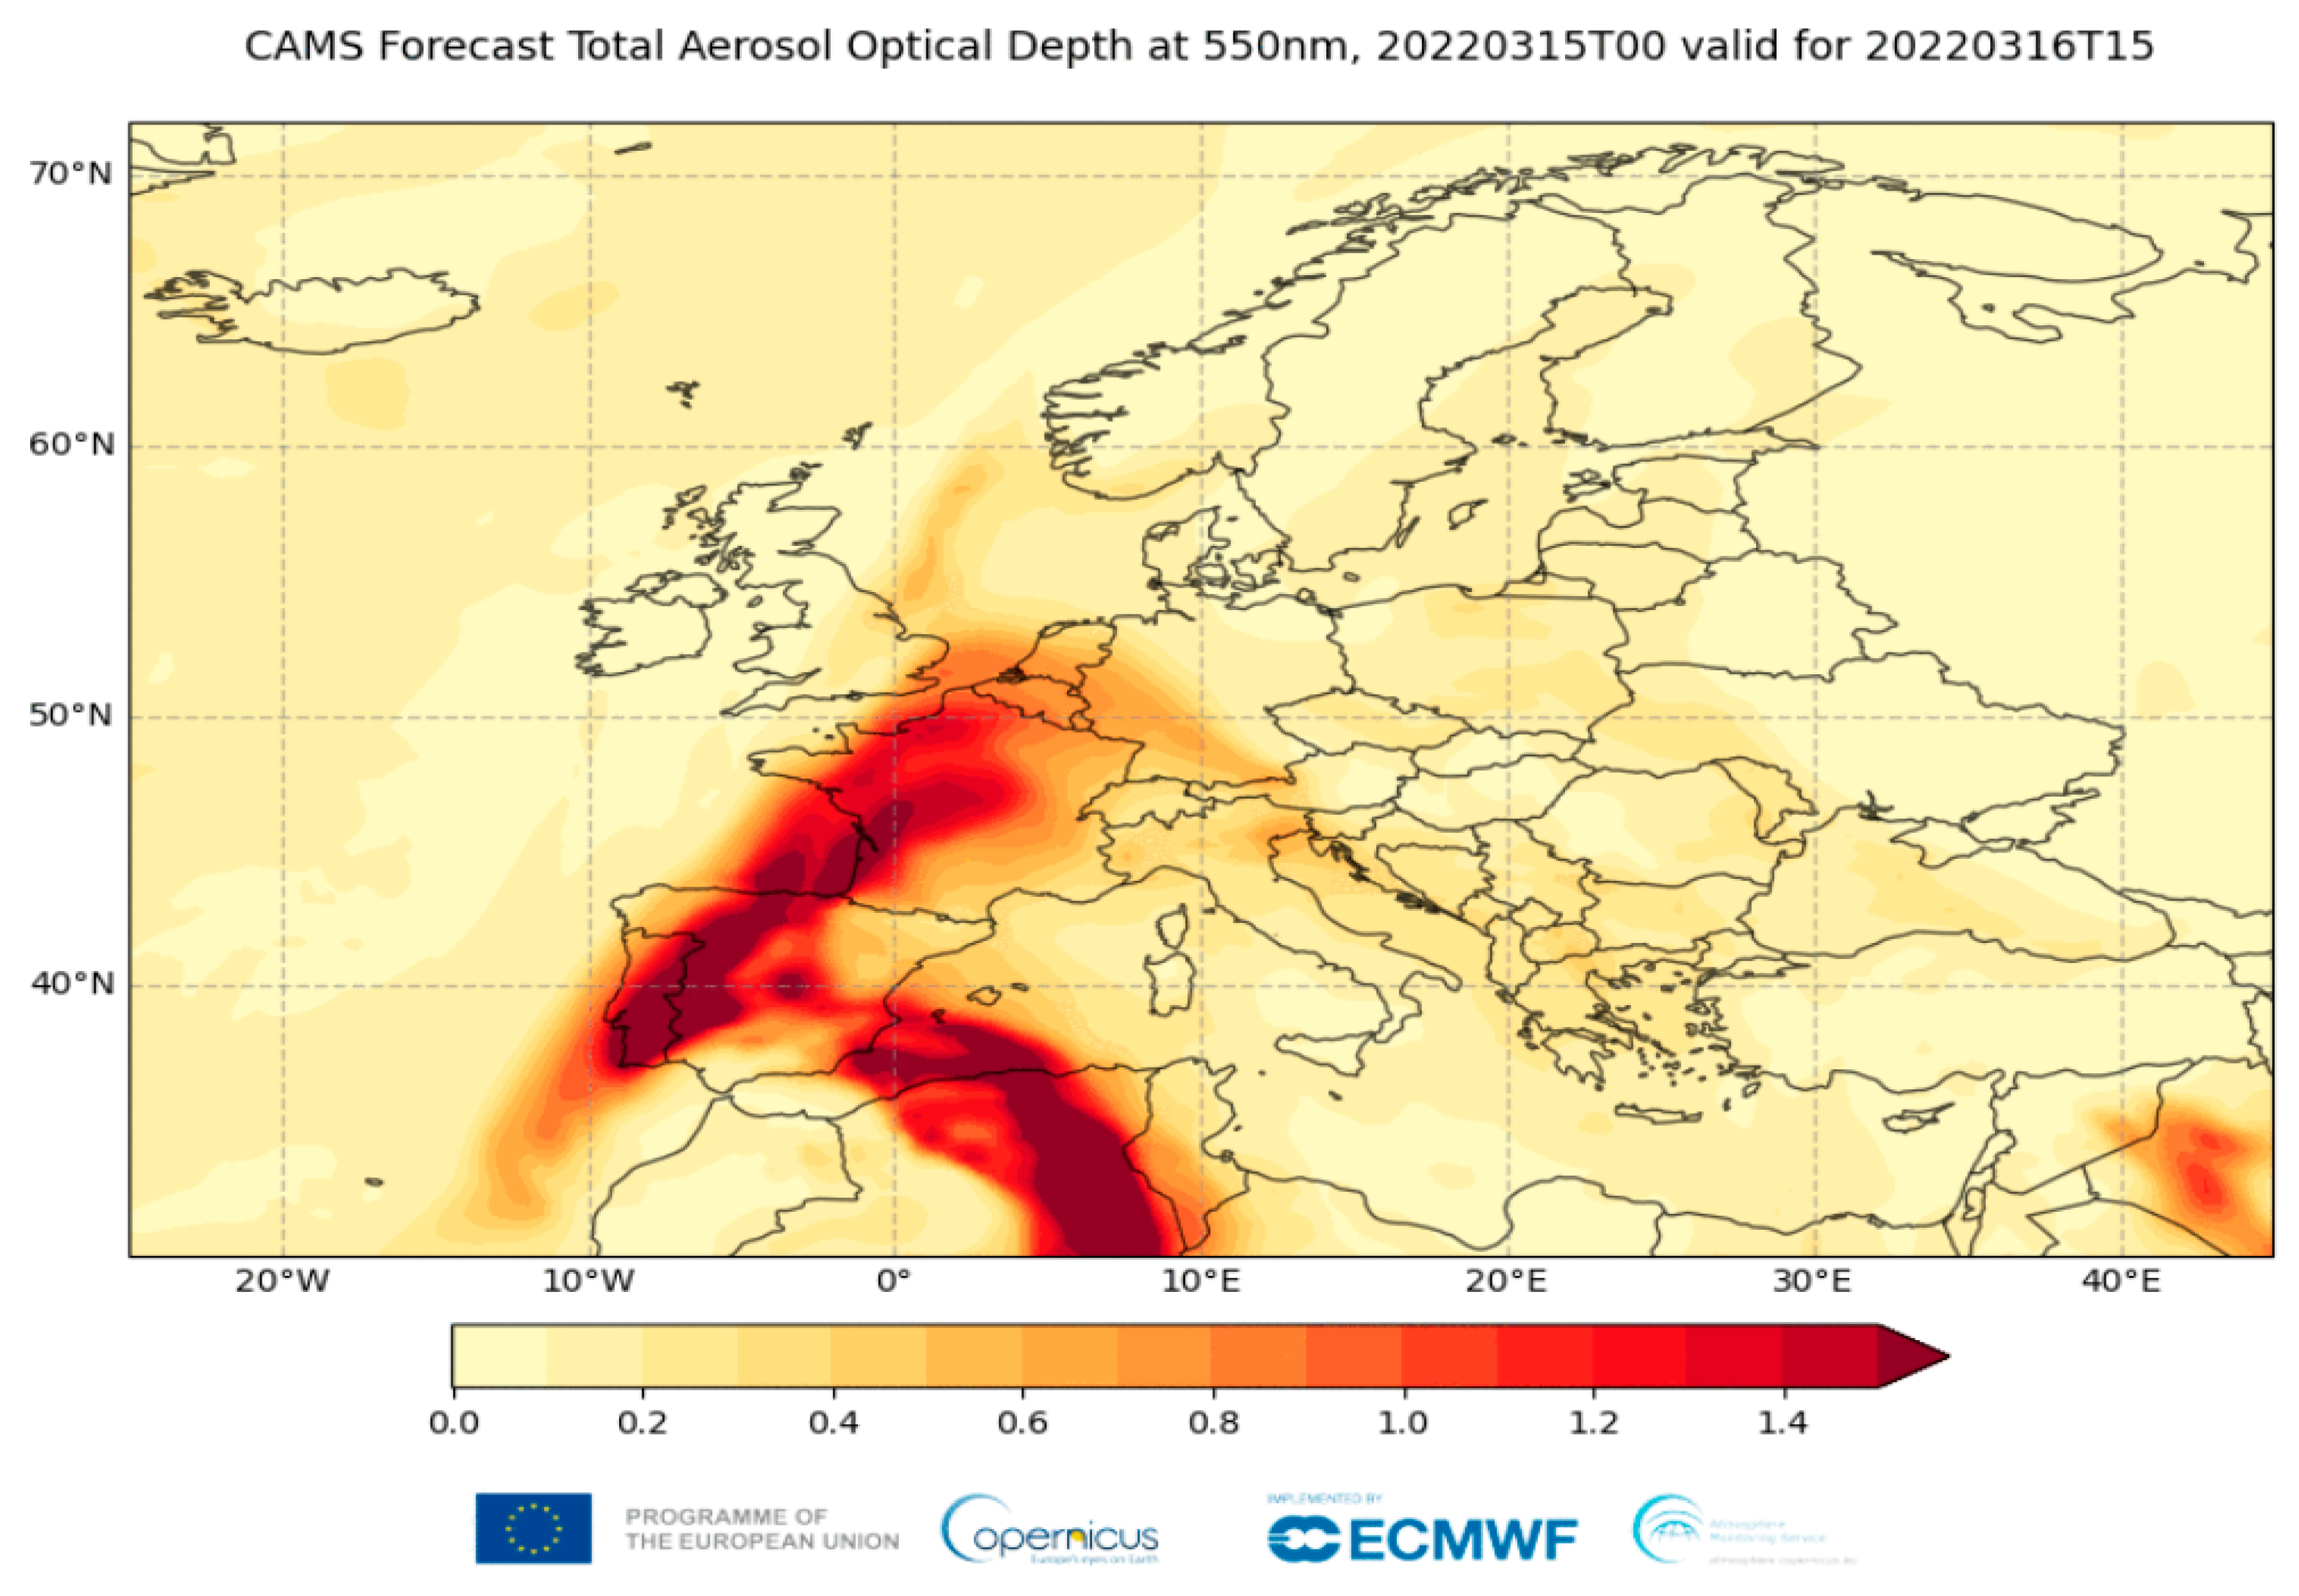
Particulate Matter (PM) aerosols originate frequently from semiarid or arid regions as a consequence of continuous soil erosion produced by winds [1]. The strong warming of desert areas during the daytime period produces vertical thermal turbulences that can reach altitudes of about 5 km, followed by subsequent periods of nocturnal stability [2]. Therefore, the resuspension of huge amounts of particulate aerosols is thus produced, and these can be transported over long distances by several different mechanisms. About 40% of the aerosol mass emitted into the troposphere is attributed to desert dust and is currently considered to be the second-largest source of natural aerosols, after sea salt, much more than the amounts usually attributed to anthropogenic PM pollution (which is mostly related to the fine and ultrafine fractions) [3,4,5]. The main desert dust source is the Sahara Desert since it is responsible for more than half of the world’s atmospheric particulate dust [6,7,8,9]. Under specific meteorological situations, large amounts of Saharan dust can be transported toward the Mediterranean basin over which the planetary boundary layer is usually relatively shallow [10,11,12,13]. From the point of view of air quality, it has been demonstrated that African dust is the main particle source, contributing to the regional background levels of PM10 across the Mediterranean (accounting for 35 to 50% of PM10) with maximum contributions up to 80% of the total PM10 mass [14]. These sporadic but huge natural contributions of PM have been responsible for a high number of excedencies of the PM10 daily limit value (50 µg/m3, according to the 2008/50/EC European Directive [15]) as registered in different rural and urban monitoring sites across the Mediterranean Basin, particularly in Portugal and in Spain [16,17]. The specific origin of the air masses could be determined by back-trajectories simulation using the NOAA/ARL hybrid single-particle Lagrangian integrated trajectory (HYSPLIT) model. That would allow the air mass origin (that could, eventually, be from the Sahara desert and/or from a continental origin in the South of Europe, in this type of event) to be ascertained with certainty. However, the Portuguese Environment Agency (APA, Amadora, Portugal) presented a forecast relating to 15 March 2022, which is one of the days monitored in this study [18]. This study comprises data from the model NMMB/BSC-DUST MODEL of the Barcelona Supercomputing Center, along with HYSPLIT model back-trajectories or the Copernicus data (shown in Figure 2), which are considered necessary for ascertaining the origin of the air mass [19,20]. Additionally, the origin of air masses could be also confirmed by performing chemical characterization of PM2.5 and PM10 sampled in filters, since the North of Africa air masses are, typically, characterized by high concentrations of crust elements, such as Al, Fe, and Si [21].
Nevertheless, it can be said that there is a direct relationship between the occurrence of these extreme events in the desert, and the increase in recorded PM levels regarding outdoor air quality [22]. As indoor air quality derives, mainly, from ambient (and thus, outdoor) air, it can be expected that these events will also influence indoor PM levels, but the nature of effects on indoor air quality remains to be investigated, particularly with regard to the recorded increases per size range of PM [23].

2. Materials and Methods

An extreme event resulting in dust transport from the Saharan region to Portugal took place from the early morning of the 15th of March to the end of the 17th of March, 2022 and was described as causing a considerable decrease in visibility and the appearance of an “orange sky”, as can be shown in Figure 1 depicting Lisbon. Figure 2 is a forecast of the PM movement over the Iberian Peninsula for the 15–16th of March, clearly affecting Portugal and Spain.
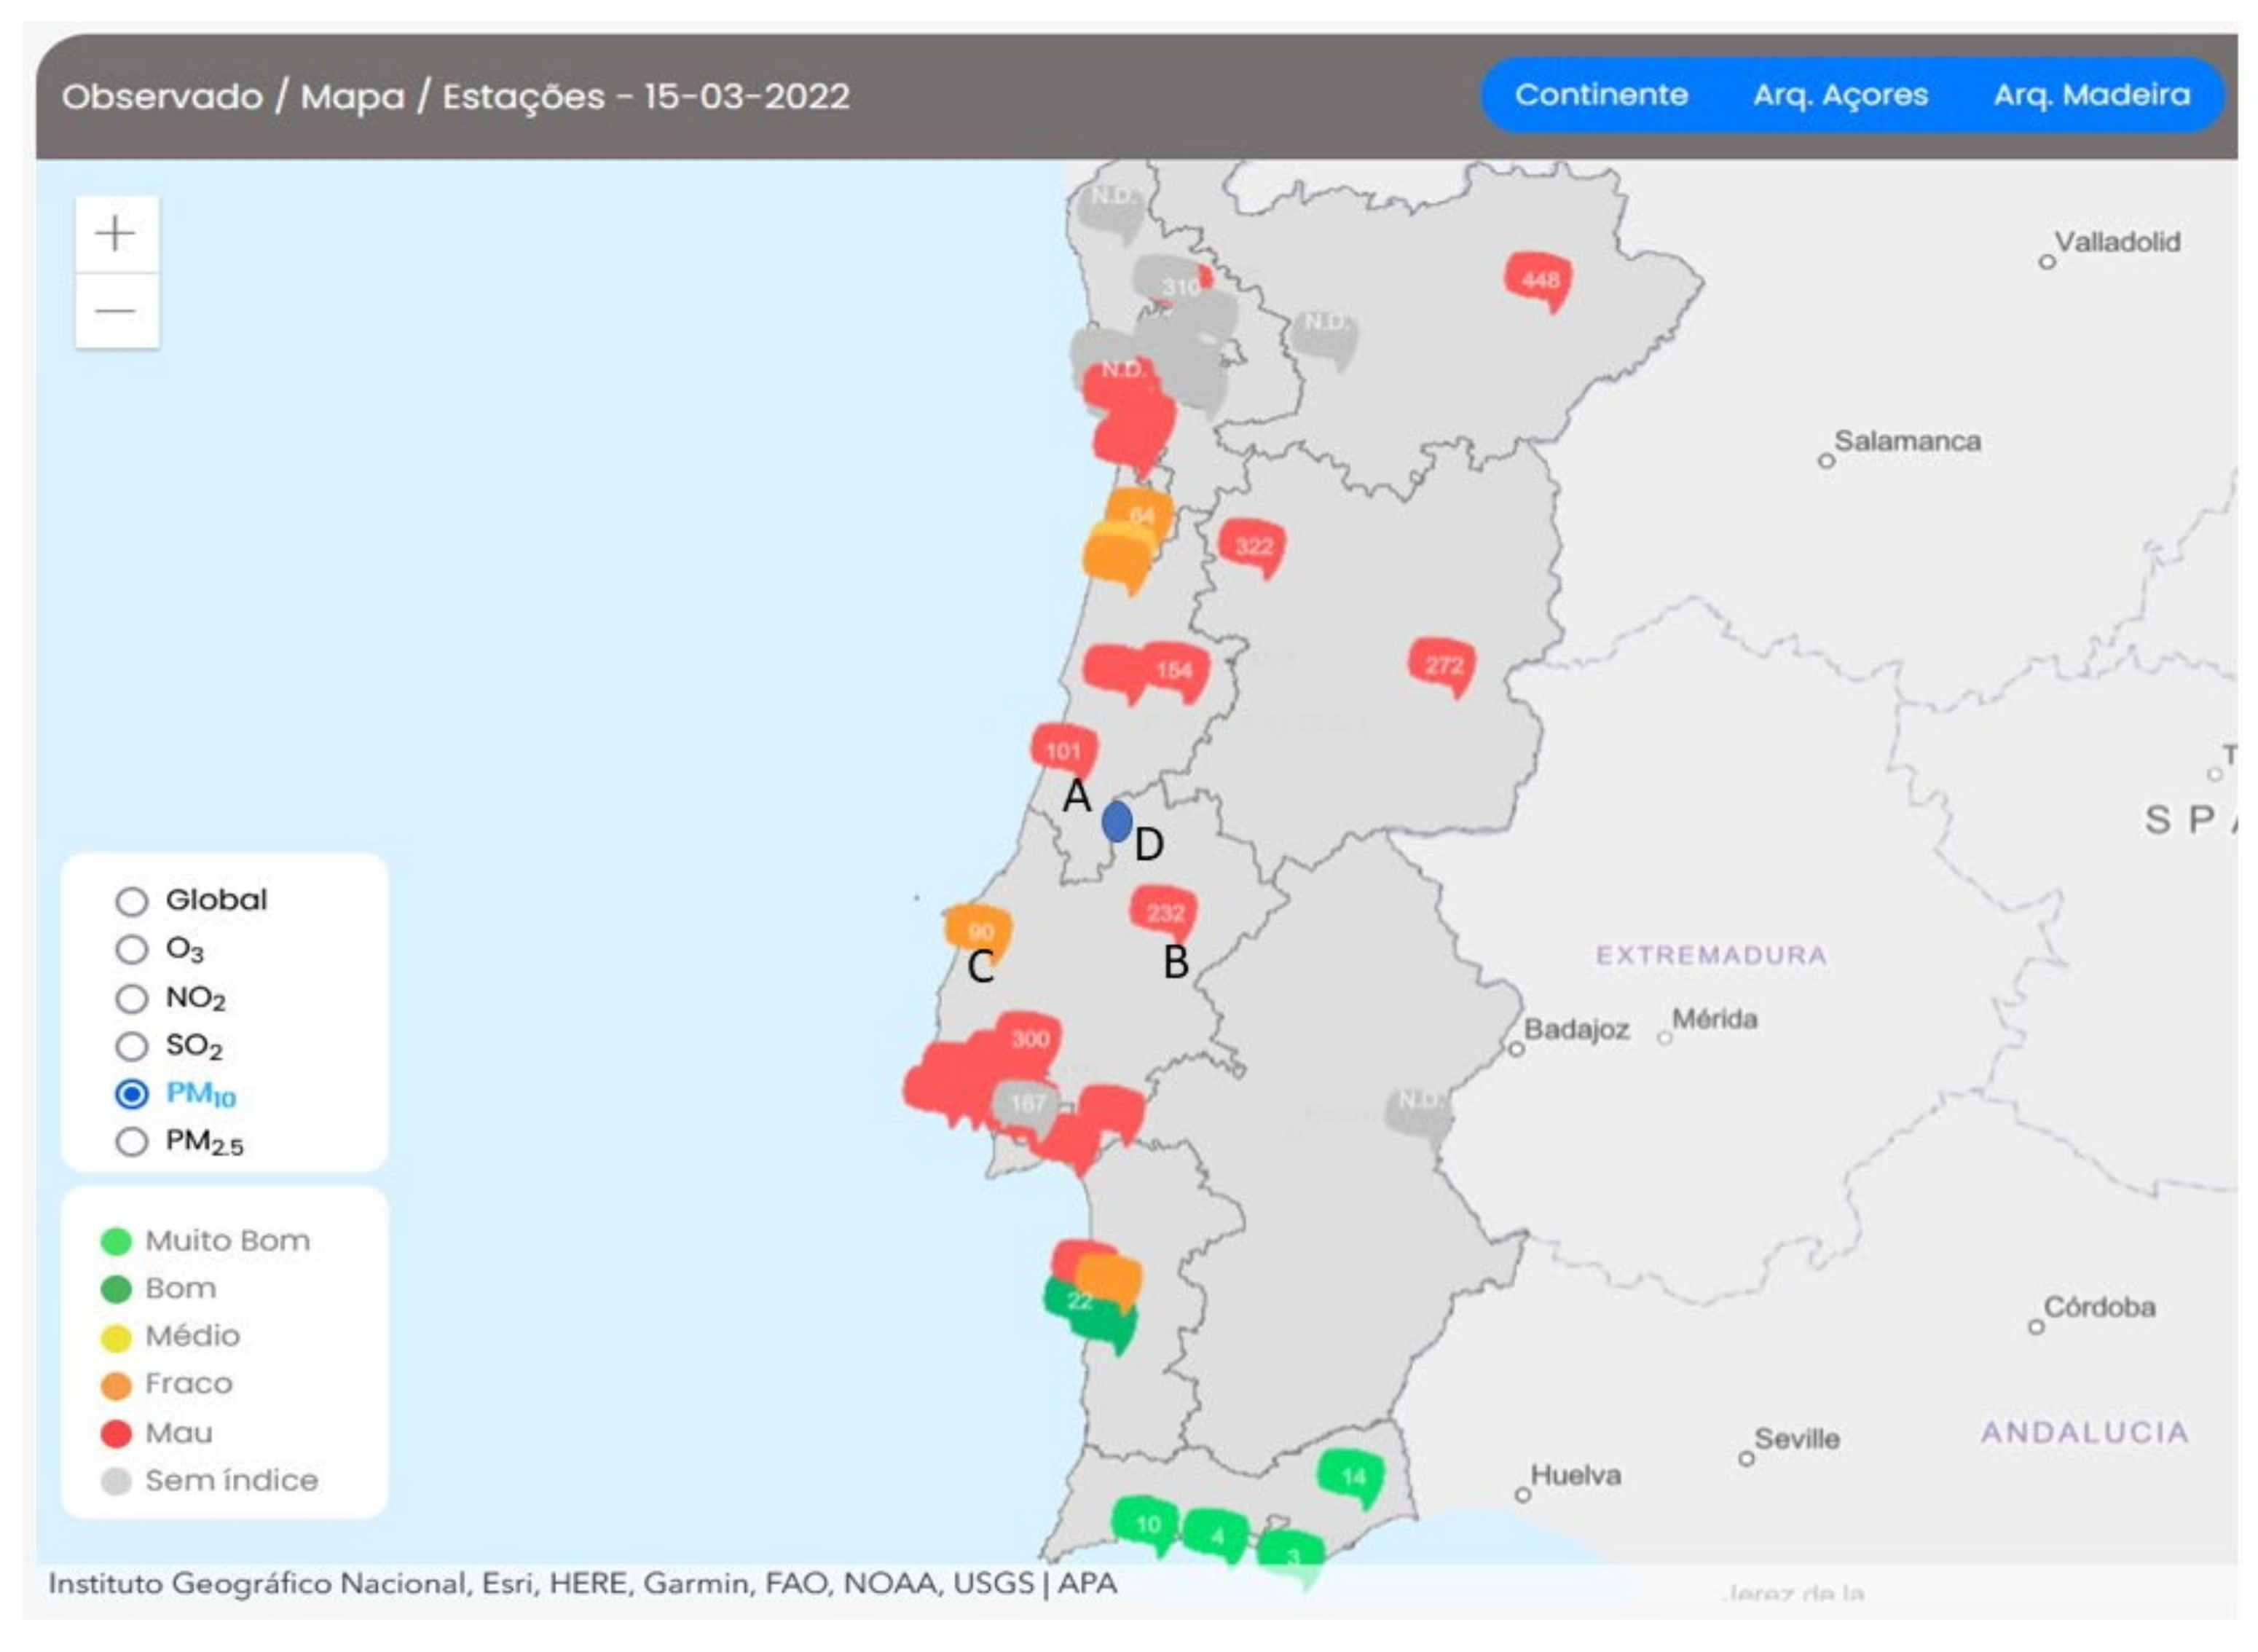
Outdoor air quality is monitored in Portugal through the National Air Quality Network, operated by the Portuguese Environment Agency (APA, Amadora, Portugal), covering the national territory, as shown in Figure 3. PM2.5 and PM10 were obtained through the national information system of air quality, QualAr (https://qualar.apaambiente.pt/ accessed on 23 June 2022) for the following monitoring stations: (A) Ervedeira, Leiria (latitude: 39.75333; longitude: −8.80733); (B) Chamusca, Santarém (latitude: 39.35956; longitude: −8.49745); (C) Lourinhã, Leiria (latitude: 39.24410; longitude: −9.31242). These stations all have the typology of rural stations and are equipped with beta attenuation PM monitors. Daily mean concentrations were calculated from the hourly values of PM2.5 and PM10.
It should be noted that, according to the current European legislation, Directive 2008/50/EC of 21 May 2008 [15], the limit value for PM2.5 is 20 µg/m3 (annual average), and for PM10 it is 50 µg/m3 (daily average), which must not be exceeded more than 35 times a year. The WHO daily guideline values for PM2.5 and PM10 are 15 µg/m3 and 45 µg/m3, respectively, not to be exceeded more than 3–4 days per year [24]. Therefore, the dust event could be said to be noticed from 15 to 17 March per measured PM10 values, and from 15 to 16 March per measured PM2.5. This observation could be related to the size range nature of the transported dust, lying mainly with the PM10 fraction, instead of the PM2.5 fraction.
Indoor air quality is routinely monitored in three buildings (designated as 1, 2, and 3) located in Fátima, Leiria (latitude: 39.621820; longitude: −8.688008), corresponding to point D in Figure 3, which are more closely located near station A (but still there is a distance of about 50 km from A to D), and equipped with air conditioning systems. This monitoring is made by specifically calibrated sensors which comprise the automatic patented system Innovair24 that includes Alphasense OPC-N3 (Braintree, United Kingdom) LASER-based particle counters for particulate matter according to the following size ranges: PM1, PM2.5, and PM10. These particle counters were calibrated against a reference dust monitor GRIMM PM10/PM2.5/PM1, model 1.107 (Hamburg, Germany). The estimated accuracy of the Alphasense sensors is, respectively, 11–14%; 17–24%; and 4–5% for PM1, PM2.5, and PM10.
This indoor air quality monitoring does follow the most recent ones recommended within the scope of Cost Action CA17136 [25,26]. The Portuguese regulation [27] prescribes the following indoor limit values: (i) 50 µg/m3 for PM10, and (ii) 25 µg/m3 for PM2.5.
Regarding the specific characteristics of the three buildings, building 1 has natural ventilation and the air conditioning system (AC) was not operating for most of the time. Building 3 had the AC functioning, and building 2 had only a mechanical extraction system (no AC) and had people entering and exiting through a door.

3. Results

Table 1 shows the measured concentrations of PM2.5 and PM10, for the period 14–18 March, in three stations in the West Region of Portugal, as follows: (A) Ervedeira, Leiria; (B) Chamusca, Santarém; (C) Lourinhã, Leiria. These results clearly show marked high concentrations in all stations A, B, and C, considerably higher than during the same period of the previous year, with breaches of the European limit values, particularly on the 15th and the 16th of March 2022.
Figure 4 shows the hourly evolution of PM2.5 and PM10 measured at station A (the one close to the location of indoor air monitored buildings) for the period 14 to 19 March 2022. The dust event, that is, the abnormal increase in PM concentrations, is noticeable from 14:00 GMT on 15 March to 16:00 GMT on 16 March, showing a marked reduction from this time until 2:00 GMT on 17 March, and then plateauing to 11:00 GMT of the same day, where a second surge was also noticeable. For the 15th, 16th, and 17th of March, the European limit values were exceeded for both PM2.5 and PM10.
The above-named sensors monitored the indoor PM1, PM2.5, and PM10 concentrations every 5 min during the whole day, in the three buildings, where the dust event is particularly noticeable from the 15th of March to the 17th of March.
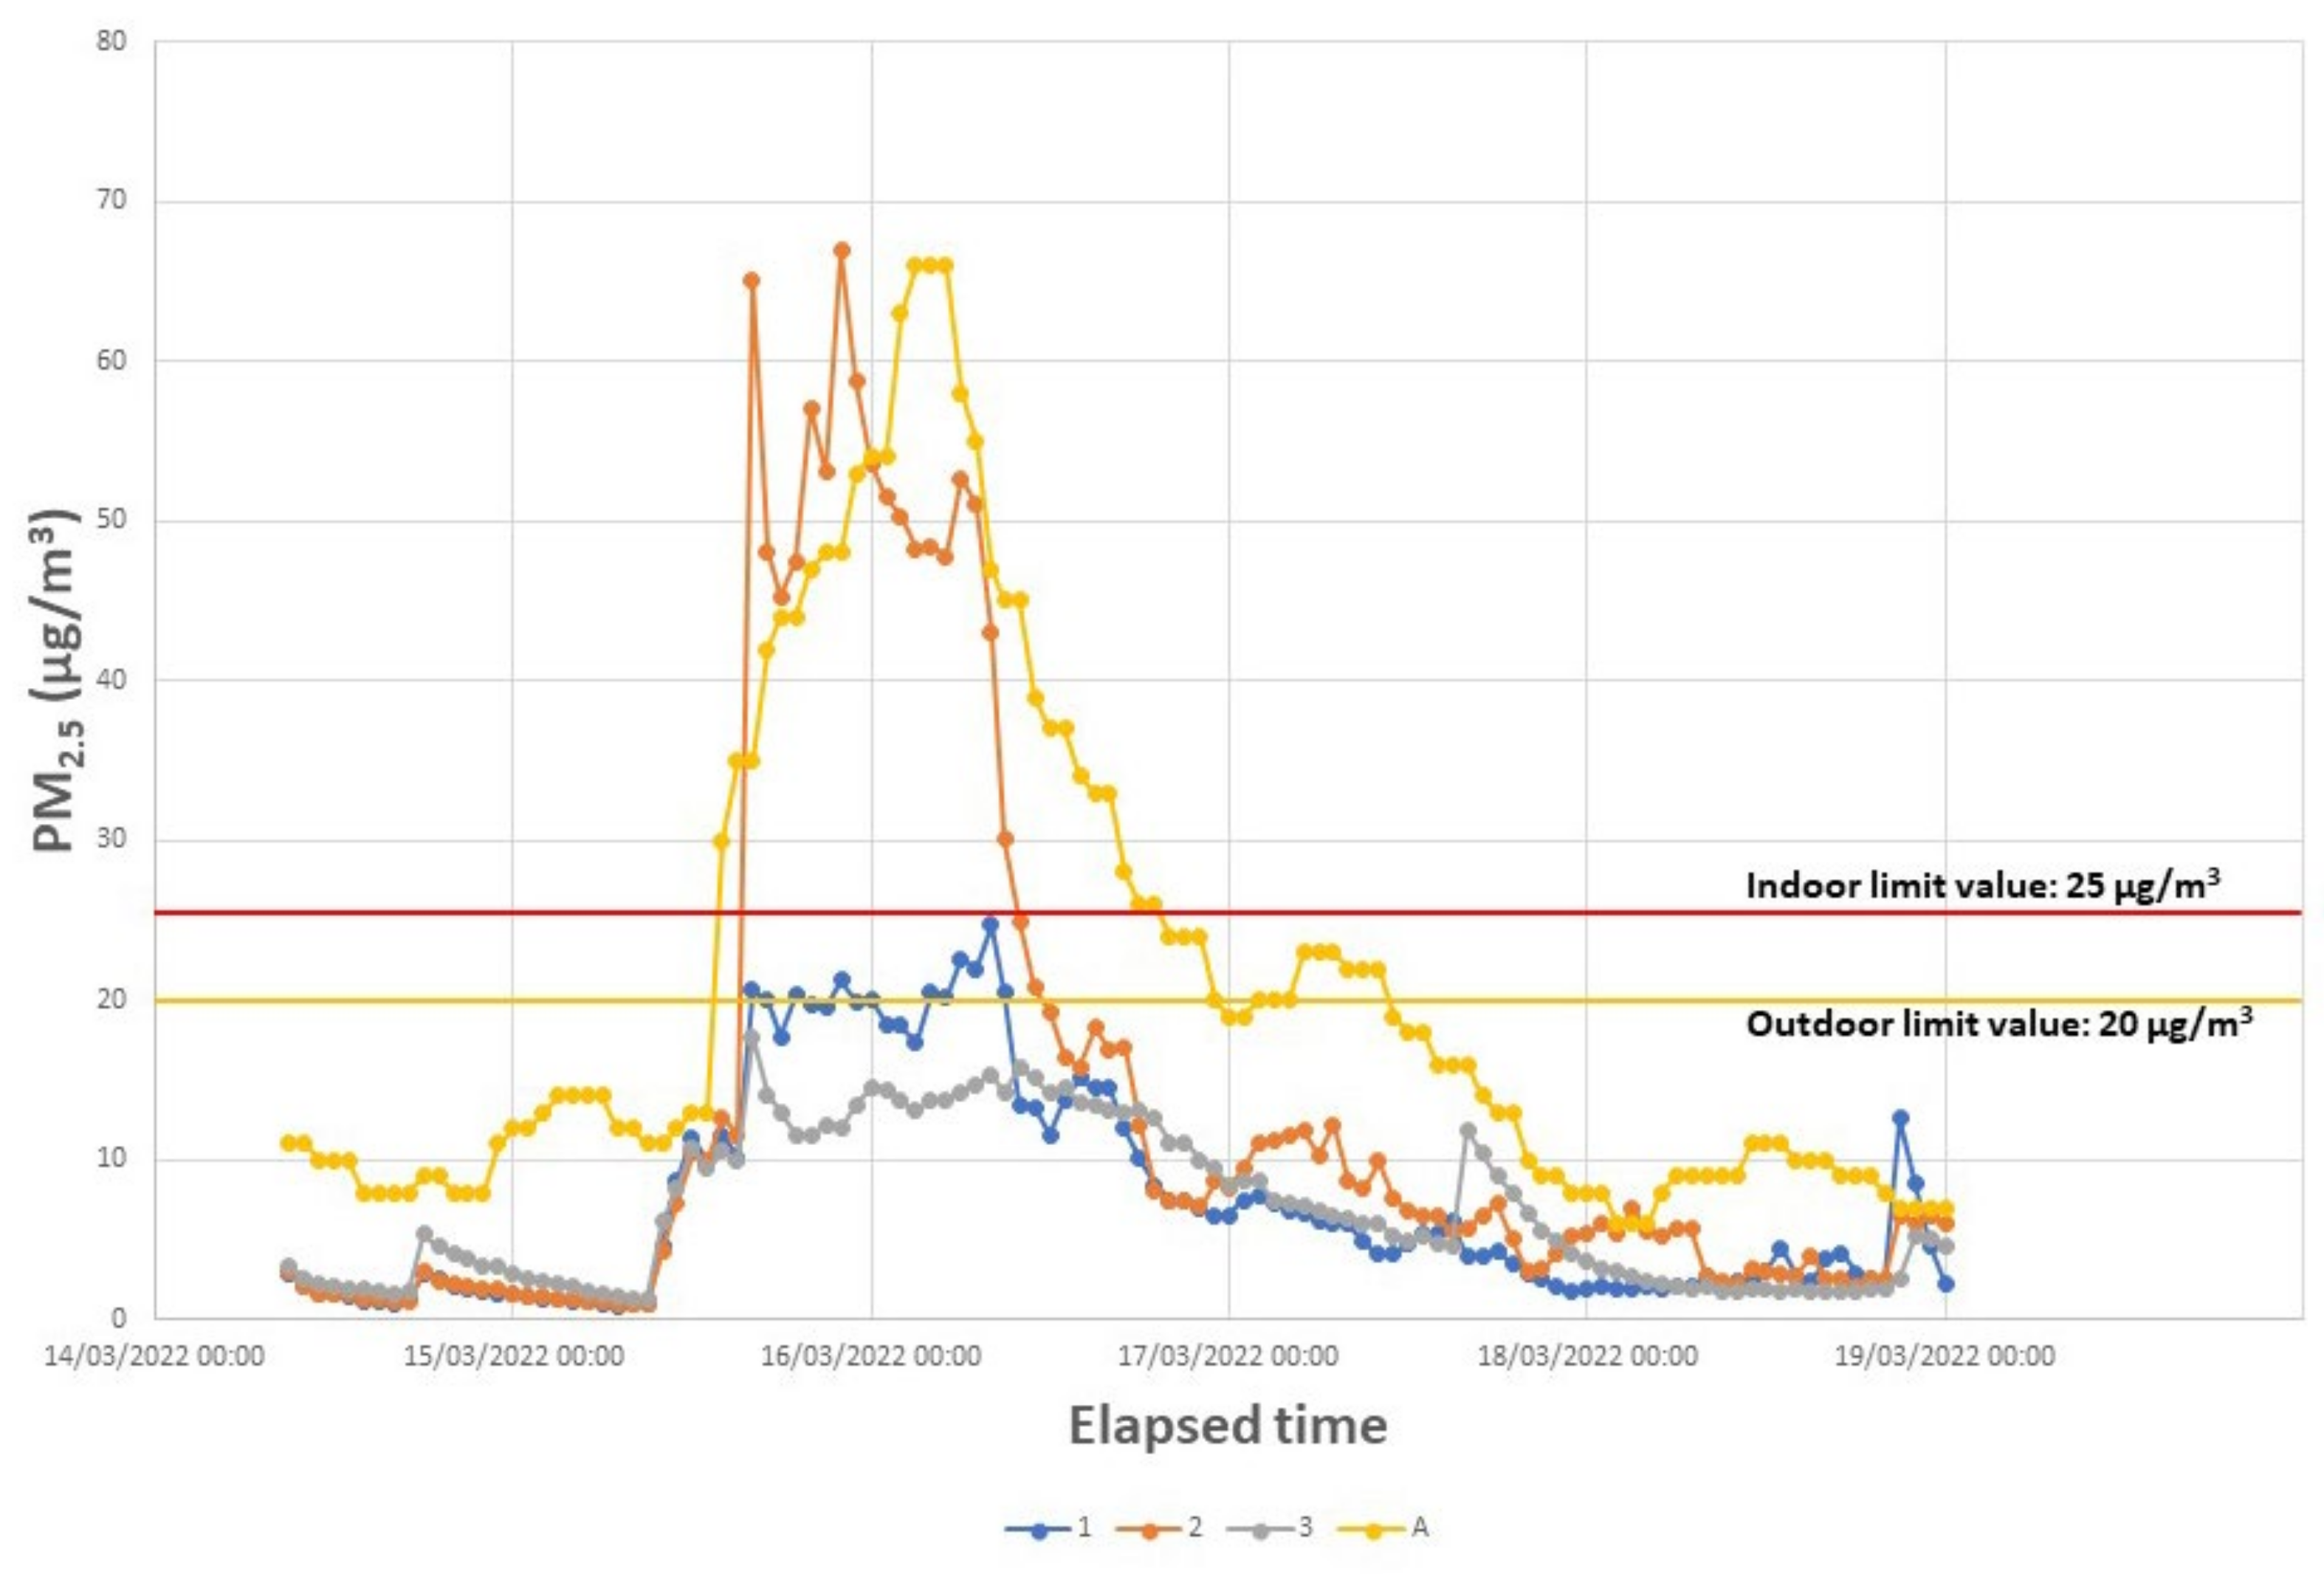
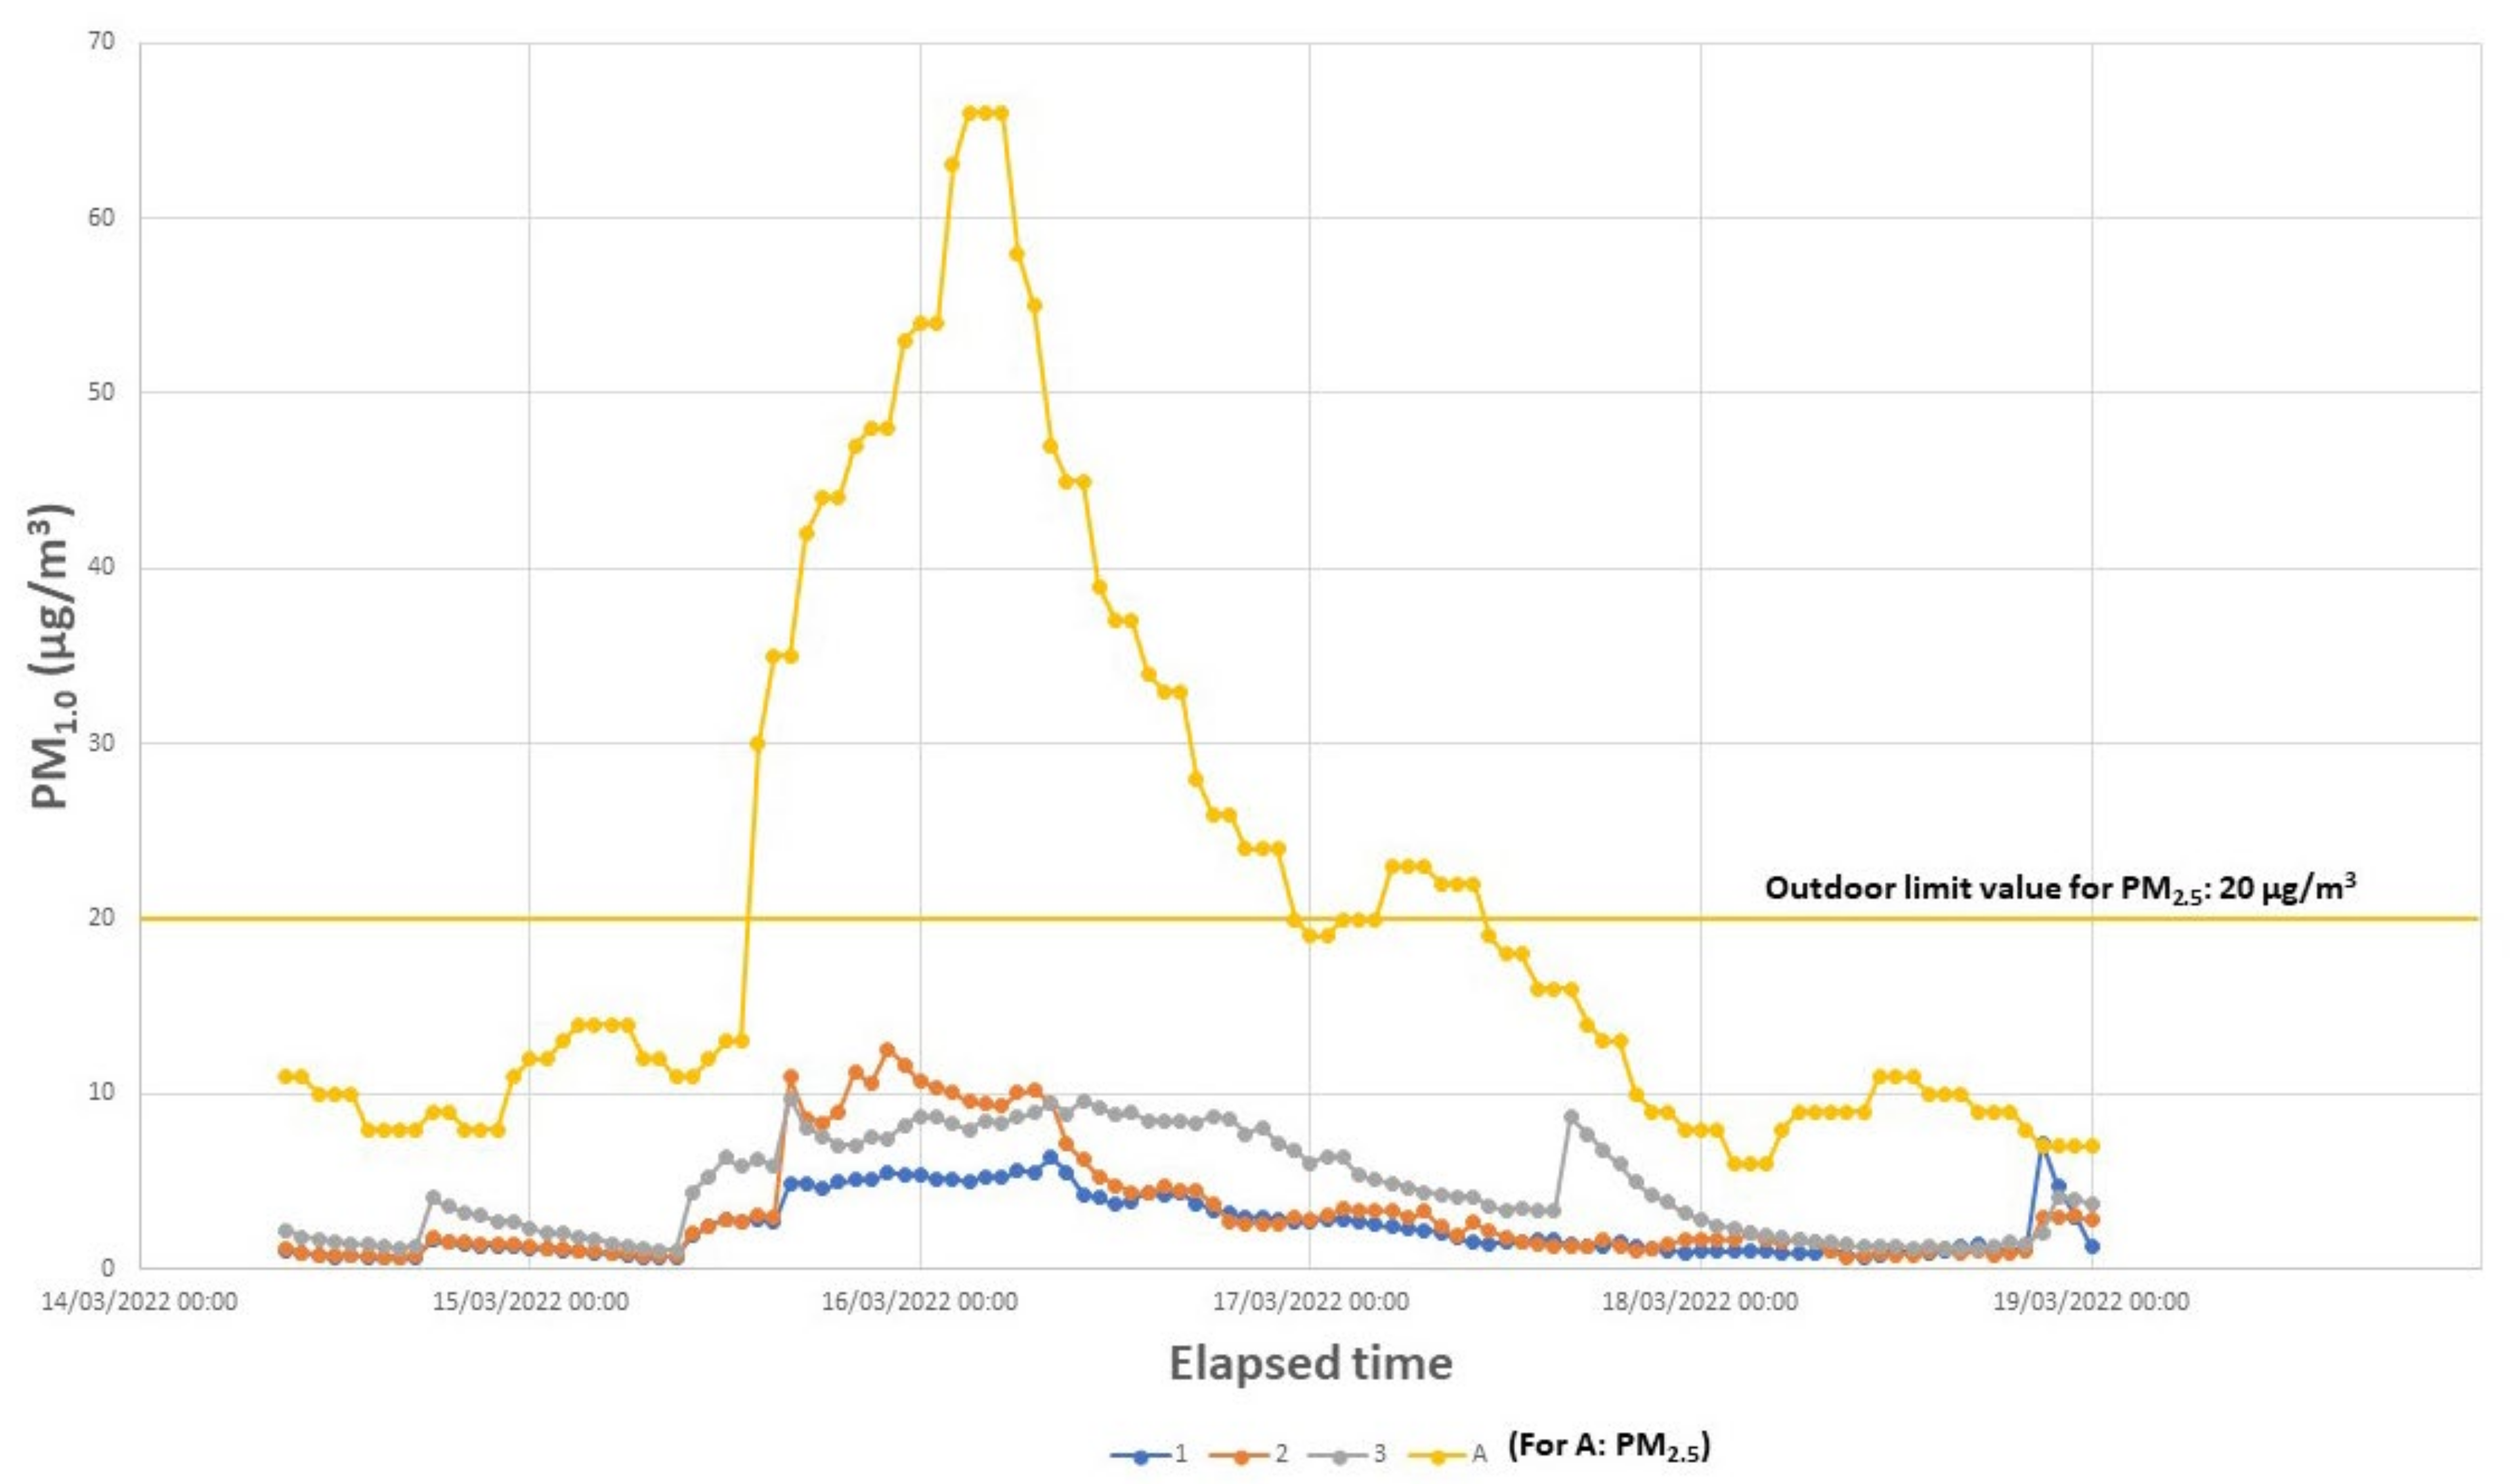
Figure 5, Figure 6 and Figure 7 show the evolution of the hourly indoor PM concentrations depicted together with the respective fraction for outdoor PM concentration in station A (note that PM1 is not measured in station A). Figure 5 clearly shows the measured indoor PM10 values exceeding the Portuguese limit value in building 2, but not for buildings 1 and 3. Regarding PM2.5 (Figure 6), the Portuguese limit value is again exceeded for building 2, but not for the other two buildings. Figure 7 shows lower increases over the usual trendlines but still some increase on the measured indoor PM1, while the outdoor PM concentration increases.
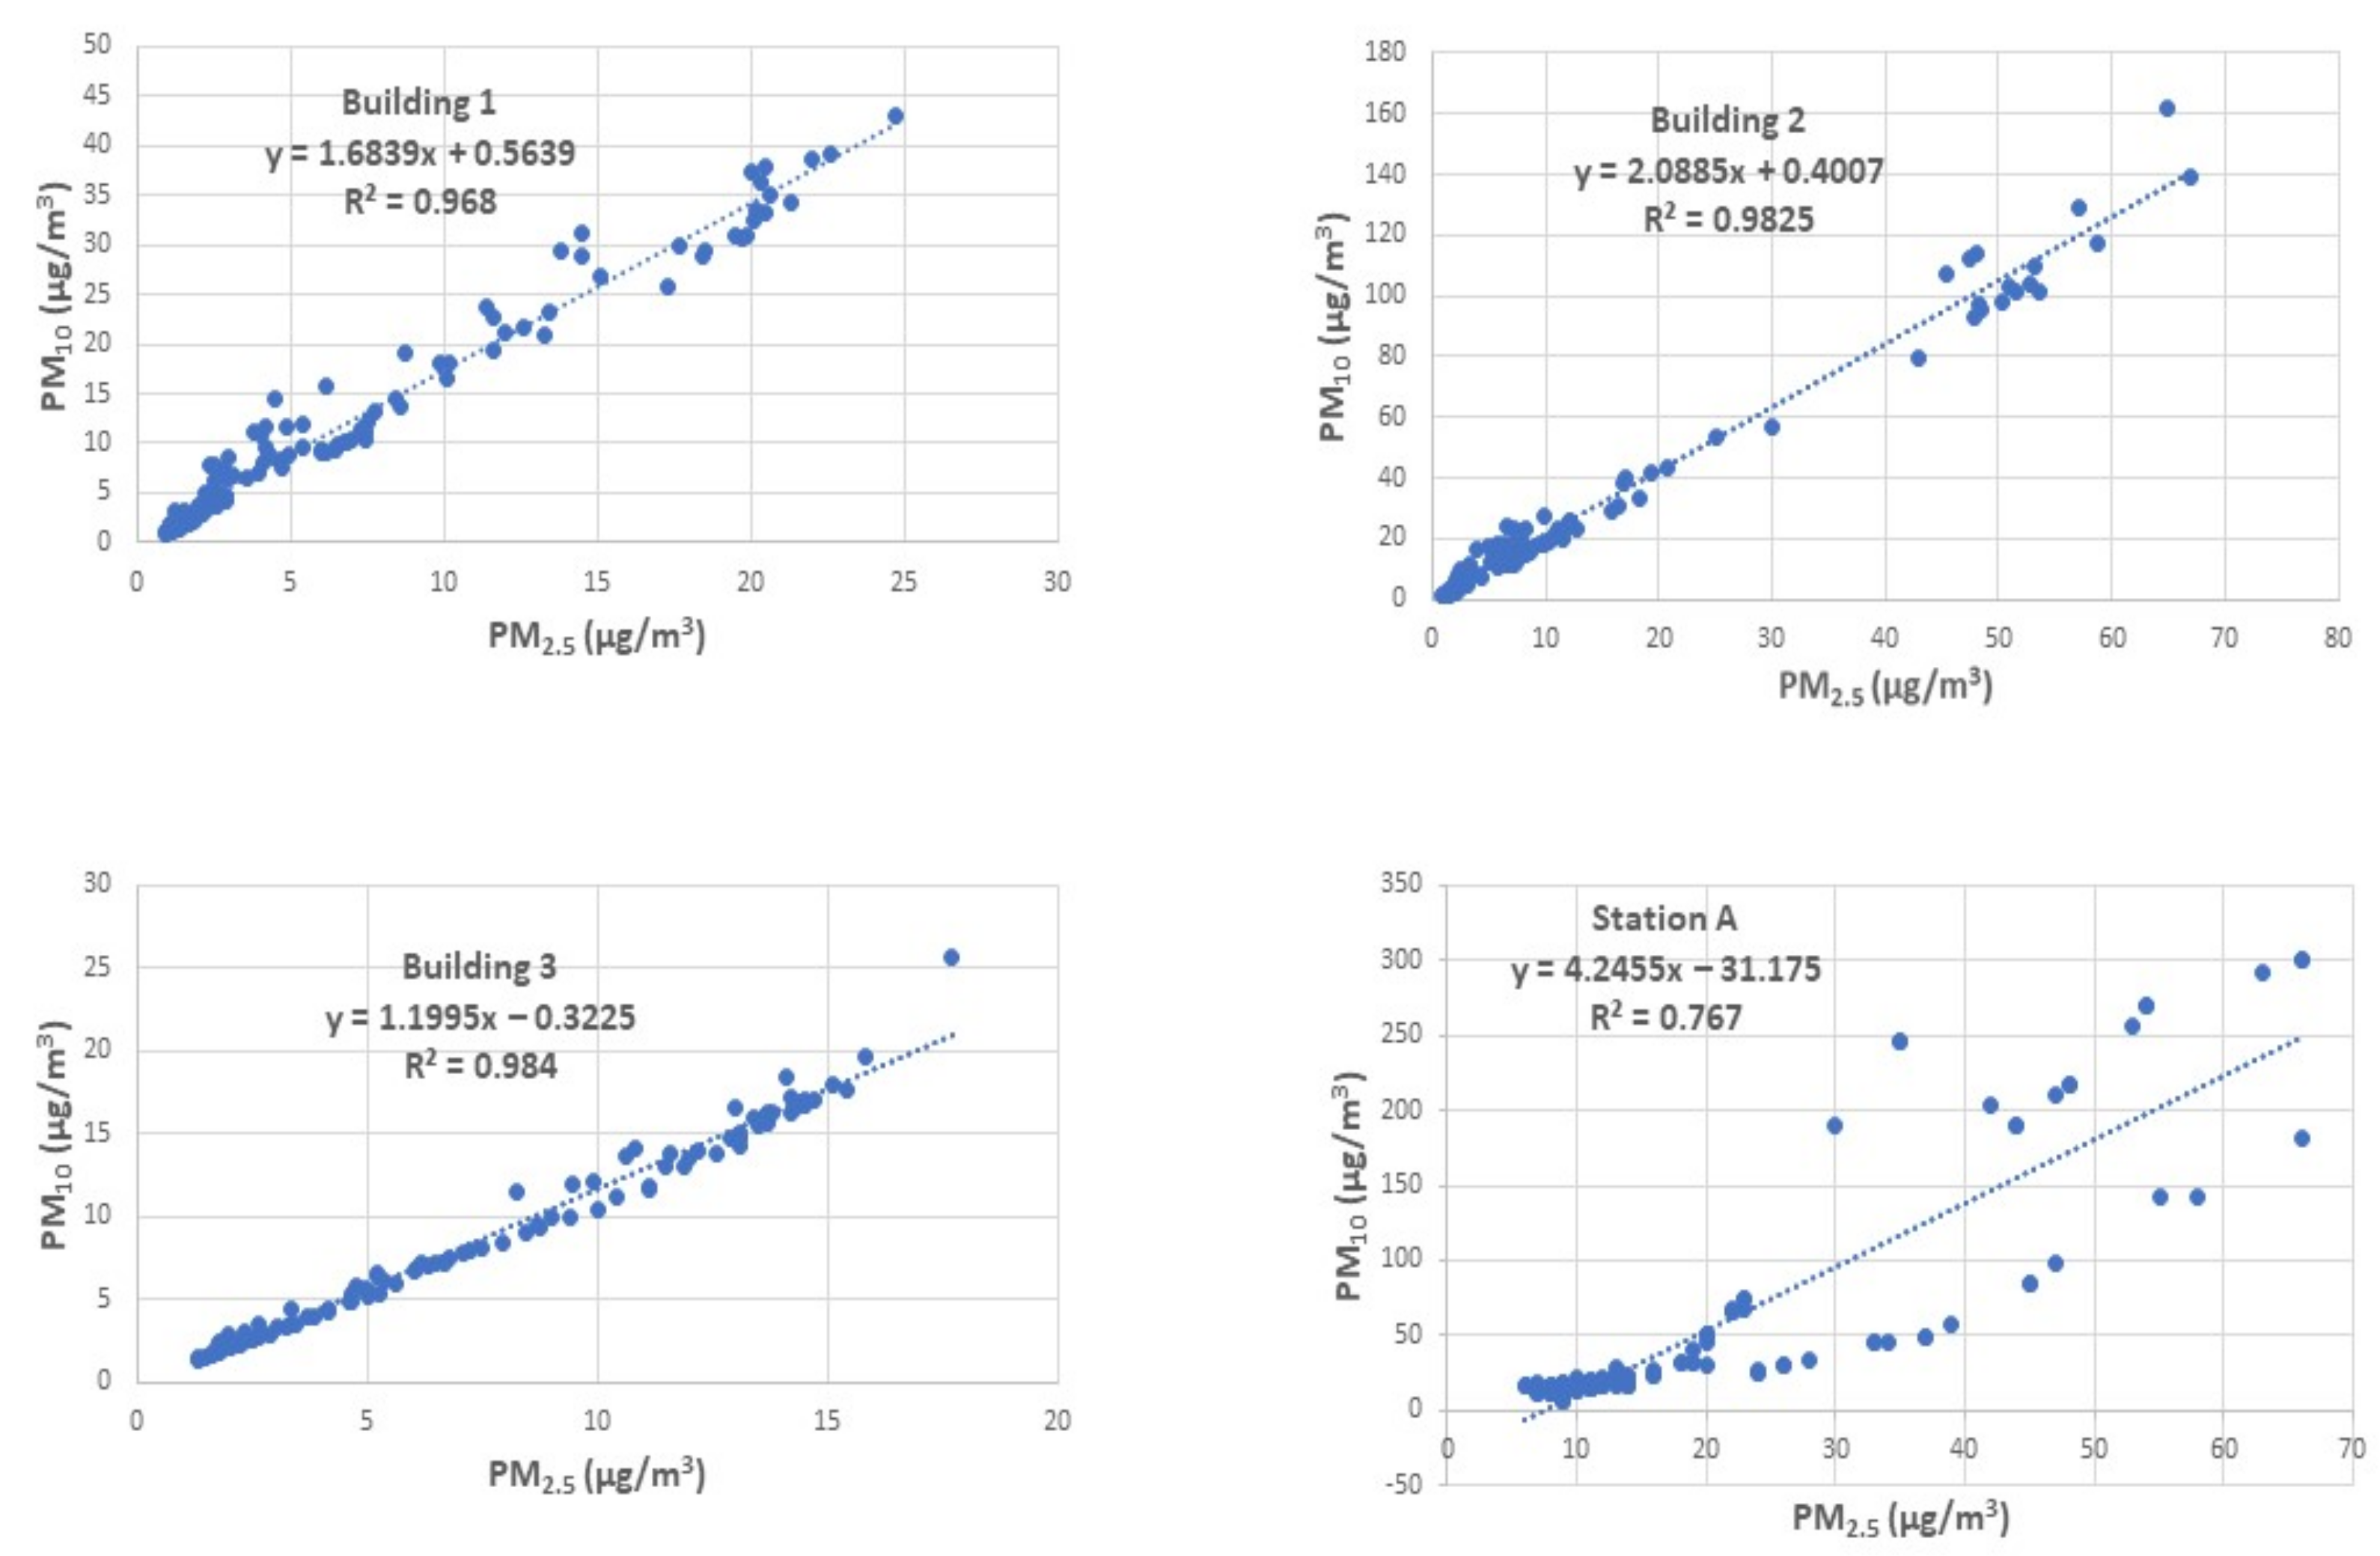
The measured results allowed for the calculation of PM2.5/PM10 ratios, which are important to assess the proportion of PM10 composed of fine particles. As expected, this showed a predominance of the coarse fraction during the dust event, ranging from 0.20 to 0.50, both for indoor and outdoor values, and this is the tendency usually observed for outdoor situations in several cities [28,29]. These ratios were calculated for the three studied buildings and also for outdoor measured values at station A, showing somewhat different profiles as shown in Figure 8.
The indoor/outdoor ratios were not calculated, as the only available outdoor measurements were taken at station A–Ervedeira, which is about 50 km distant from D–Fátima, where the analyzed buildings were located.

4. Discussion

It should be noticed, as shown in Figure 5, that outdoor PM10 concentration is considerably higher than measured indoor PM10 concentrations, in any of the three buildings. However, PM10 inside buildings 1 and 3 seem to be not particularly affected by the increase in outdoor PM concentrations, which can be due to the fact that building 2 has a mechanical extraction system and air enters by the door which is frequently open while building 3 had an AC system functioning, and in building 1, the AC system was turned off most of the time. AC system filtering system thus provided some PM retention, which is more noticeable in building 1 with the AC system operating all the time.
On the other hand, building 2 indoor PM concentrations are greatly affected by the outdoor PM concentrations, which follow a somewhat similar evolution pattern, and highlight the existence of no filtering system and PM intrusion into the building itself.
Concerning fraction PM2.5, as shown in Figure 6, part of the previously mentioned tendency is still observed, but PM2.5 concentration inside buildings 1 and 3 follows, a bit more closely, the same pattern observed outdoors, which is more evident for building 1 and not so much for building 3. PM2.5 concentration inside building 2 is much more affected by outdoor concentrations, which are even higher than the measured PM2.5 outdoor concentrations, at the beginning of the event. However, for the remaining part of the event, all PM2.5 concentrations are lower than outdoor levels, as expected.
As the PM1 fraction is not measured in Portuguese outdoor monitoring stations, the outdoor pattern for this fraction is unknown. However, evolution pattern differences were observed between building 3 and the other two buildings: PM1 concentration, in this building, seems much more unstable, and higher than for the other two buildings.
It can be expected that, for this smaller fraction, filtering efficiency regarding outdoor air is much lower, which can result in observing evolution patterns different from the other size fractions. Nevertheless, the highest concentration is generally observed for building 2, possibly more influenced by the outdoor PM1 concentrations, as already noticed for the other size fractions.
The calculated PM2.5/PM10 ratios clearly show that the major proportion of PM10 is composed of coarse particles, especially during the event, as expected and previously reported in the literature [28,29]. Nevertheless, the plots of PM10 versus PM2.5, shown in Figure 8, resulted in different patterns for all studied buildings, which can be easily justified by the existence of differences in their ventilation conditions. Additionally, the obtained patterns are quite different from the one observed for outdoor air in station A, which could be explained by the existence of outdoor wind in the latter situation, and also by the fact that station A is about 50 km distant from the location of the buildings. Additionally, according to the literature [1,2,5], the Sahara dust events (and natural sources, as well) affect mainly the coarse fraction of PM, while the fine and ultrafine fractions are contributed by anthropogenic sources instead. For this reason, it can be expected that the PM1 profile does not follow entirely the profiles of the other size fractions.
As previously referred to, I/O ratios were not presented due to the distance of the available outdoor concentrations from the indoor ones. However, it is known [26] that, as a general rule, a clear positive relationship between indoor and outdoor PM can be assumed under high ventilation conditions, but not when the ventilation rate is low. Typically, I/O ratios for PM vary from 0.7 to 1.5 [26]. If assuming the limitation of the distance, the I/O ratios were to be calculated, we would obtain, for the majority of cases, values ranging from 0.10 to 0.90, which do not clearly fit within the values to be expected.

5. Conclusions

This paper presents a quantitative description of how an extreme Saharan dust event that took place in March 2022 [29] affected the West Region of Portugal and was noticed not only by the outdoor air quality monitoring stations measuring PM2.5 and PM10 but also by indoor air monitoring systems in Fatima, central Portugal. The observed particulate matter concentrations clearly show the influence that such an event has on the indoor air quality inside buildings and that the magnitude of that influence is also dependent on the specific characteristics of the buildings, mainly the ventilation conditions, as should be expected.
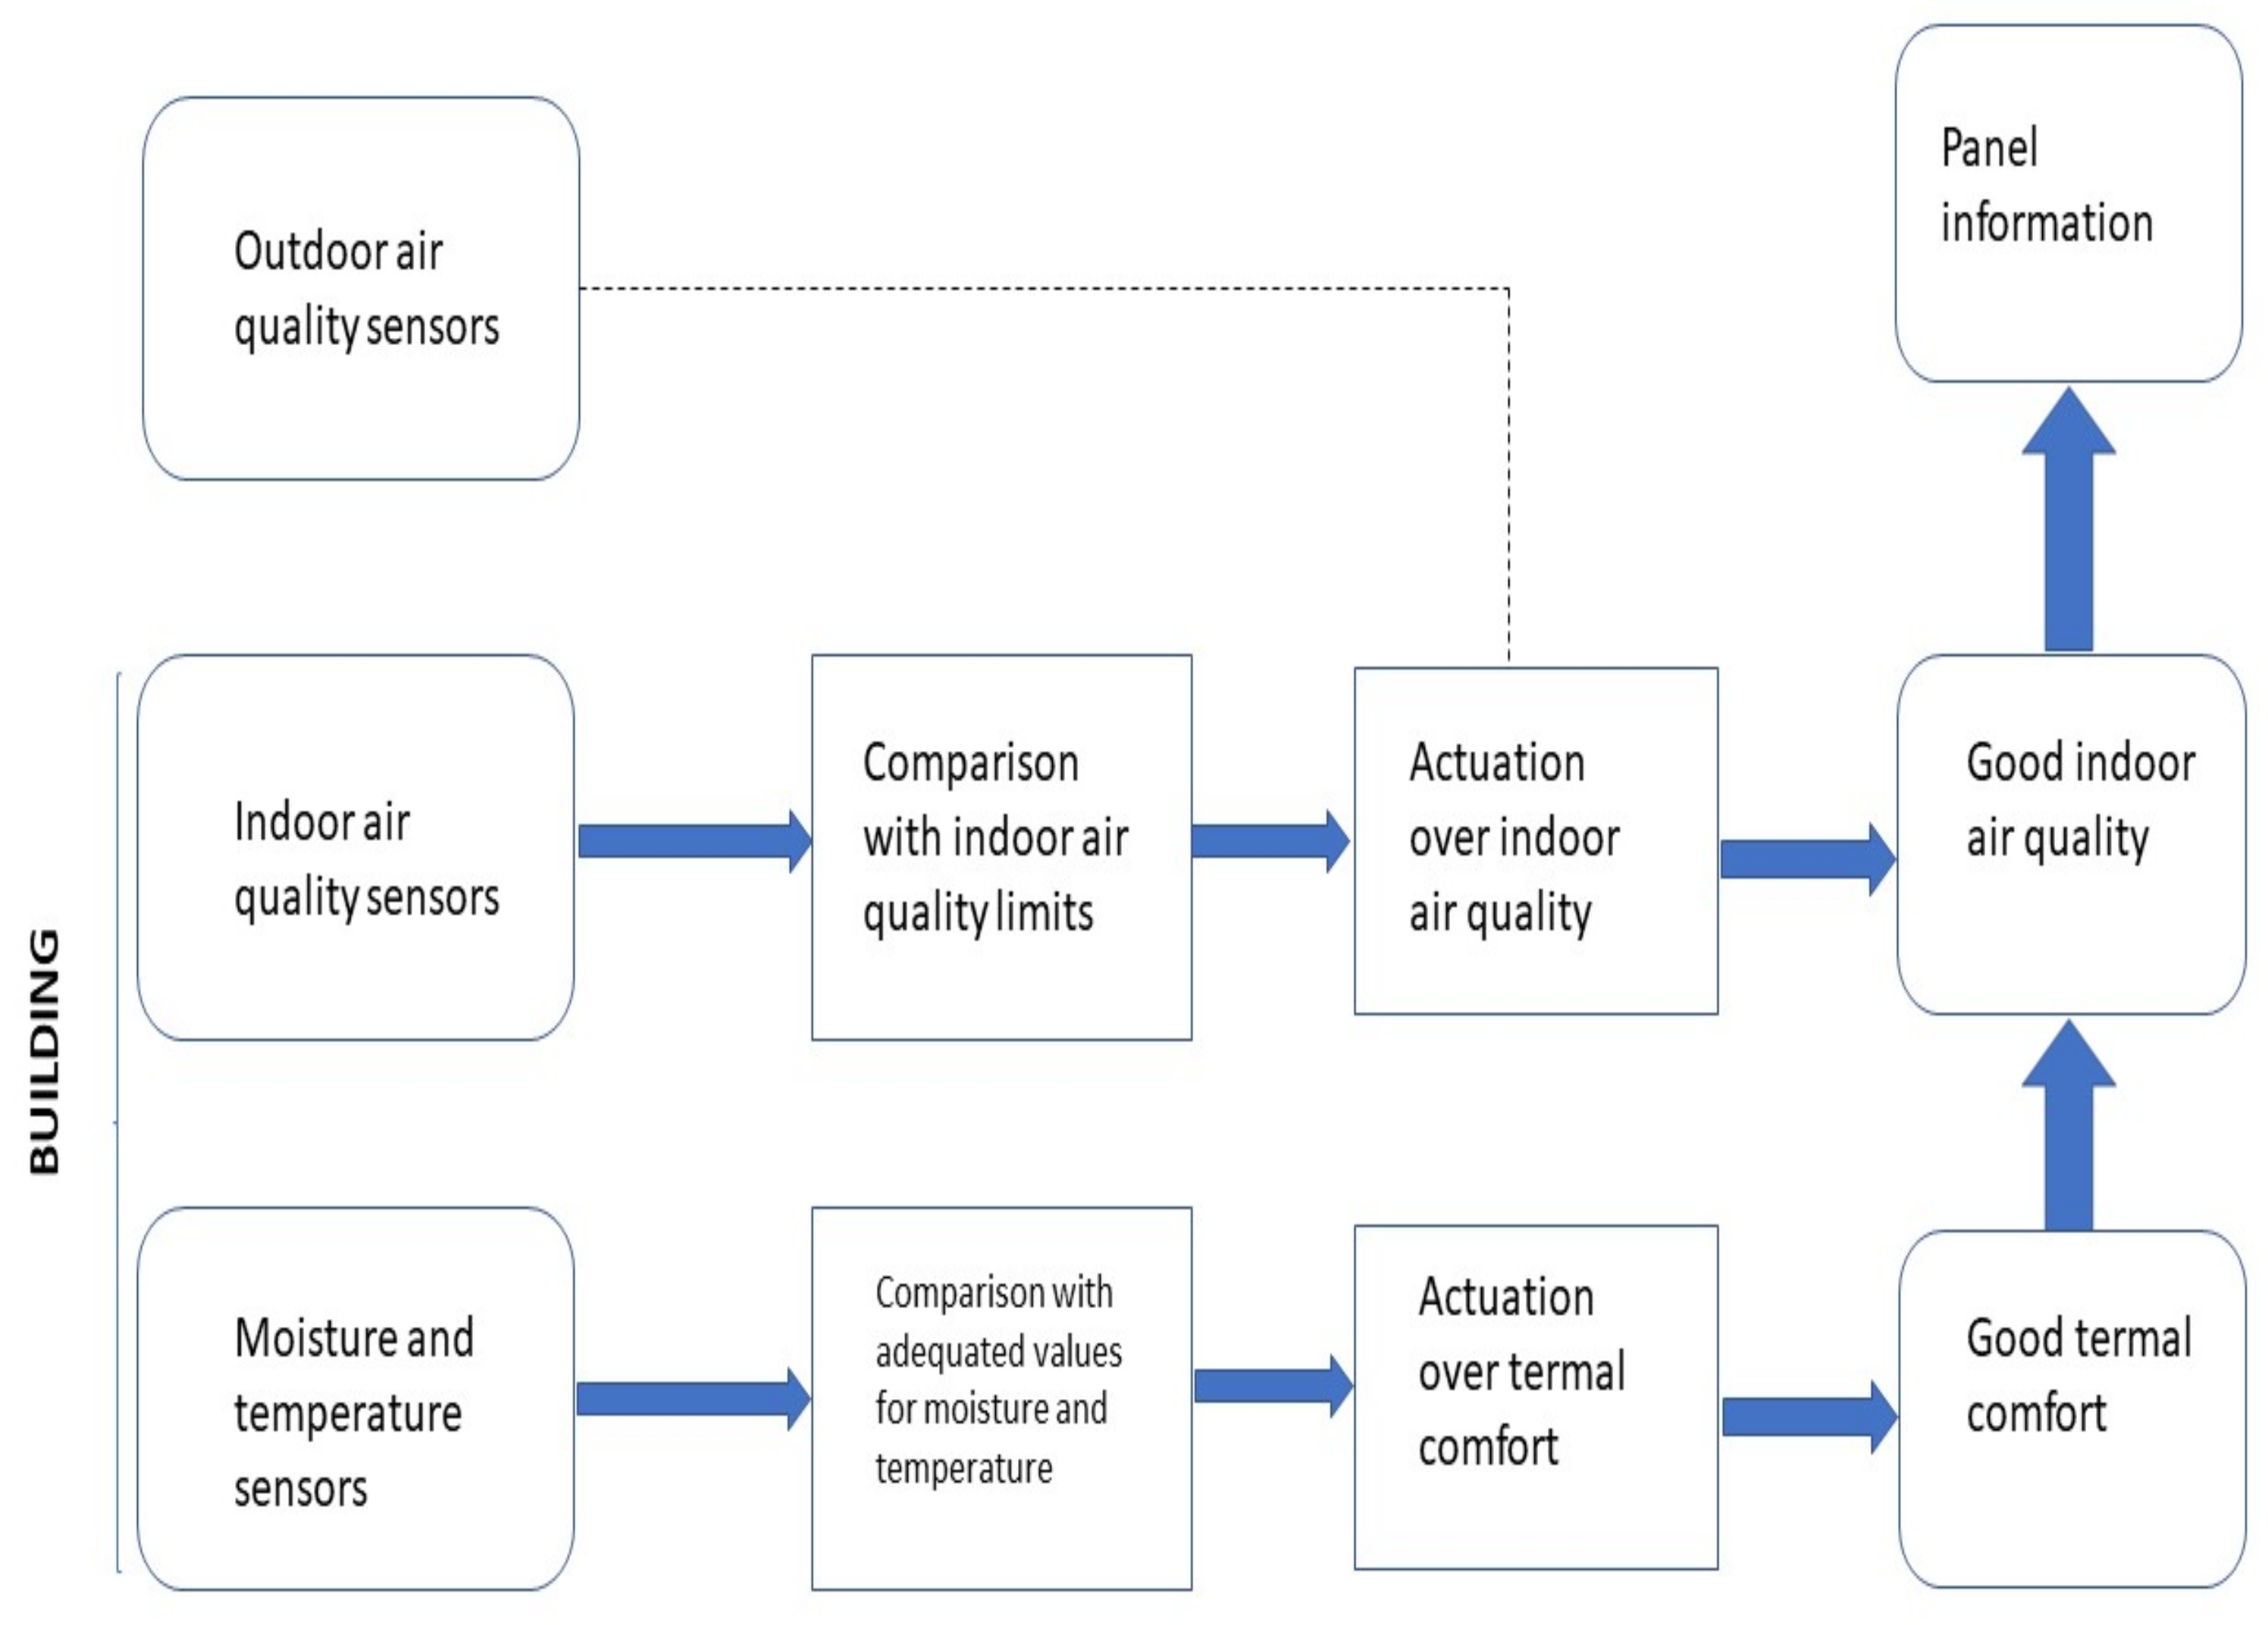
This study also highlights the importance of performing continuous indoor air monitoring. Monitoring is one primary task from a set of actions such as data acquisition by an interactive system that can compare measured values to applicable limit values, and thus generate instructions to regulate and control the indoor air quality by simple actions such as the admission of more or less fresh air coming from outside. Such measures can guarantee that building occupants are not subjected to excessive concentrations of pollutants. It should be noted that this proposed procedure is already adopted in the control of air conditioning systems, but it is not generally used for indoor air quality systems. Such systems require the use of continuous monitoring sensors interactively connected as an upgrade to actual air conditioning control systems used for controlling characteristics such as temperature and moisture. A proposal for a possible architecture of an integrated system for controlling both indoor air quality and thermal comfort is shown in Figure 9.

Author Contributions

Conceptualization, J.G. and L.R.; methodology, J.G. and L.R.; investigation, H.E.; writing—review and editing, J.G., L.R. and H.E. All authors have read and agreed to the published version of the manuscript.

Funding

This research received no external funding.

Institutional Review Board Statement

Not applicable.

Informed Consent Statement

Not applicable.

Data Availability Statement

Not applicable.

Conflicts of Interest

The authors declare no conflict of interest.

References

  1. Fernandez, A.; Sicard, M.; Costa, M.J.; Guerrero-Rascado, J.L.; Gómez-Amo, J.L.; Molero, F.; Barragán, R.; Basart, S.; Bortoli, D.; Bedoya-Velásquez, A.E.; et al. Extreme, wintertime Saharan dust intrusion in the Iberian Peninsula: Lidar monitoring and evaluation of dust forecast models during the February 2017 event. Atmos. Res. 2019, 228, 223–241. [Google Scholar] [CrossRef]
  2. Santos, D.; Costa, M.J.; Silva, A.M.; Salgado, R. Modeling Saharan desert dust radiative effects on clouds. Atmos. Res. 2013, 127, 178–194. [Google Scholar] [CrossRef]
  3. Andreae, M. Climate effects of changing atmospheric aerosol levels. In World Survey of Climatology, 16, Future Climate of the World; Henderson-Sellers, A., Ed.; Elsevier: New York, NY, USA, 1995; pp. 341–392. [Google Scholar]
  4. IPCC. Climate Change 2001: Impacts, Adaptation and Vulnerability, Contribution of Working Group II to the Third Assessment Report of the Intergovernmental Panel on Climate Change; McCarthy, J.J., Canziani, O.F., Leary, N.A., Dokken, D.J., White, K.S., Eds.; Cambridge University Press: Cambridge, UK; New York, NY, USA, 2001; p. 1032. ISBN 0-521-01500-6. [Google Scholar]
  5. Salvador, P.; Alonso-Perez, S.; Pey, J.; Artinano, B.; de Bustos, J.; Alastuey, A.; Querol, X. African dust outbreaks over the western Mediterranean Basin: 11-year characterization of atmospheric circulation patterns and dust source areas. Atmos. Chem. Phys. 2014, 14, 6759–6775. [Google Scholar] [CrossRef] [Green Version]
  6. Prospero, J.; Ginoux, P.; Torres, O.; Nicholson, S.; Gill, T. Environmental characterization of global sources of atmospheric soil dust identified with the Nimbus 7 Total Ozone Mapping Spectrometer (TOMS) absorbing aerosol product. Rev. Geophys. 2002, 40, 2-1–2-31. [Google Scholar] [CrossRef]
  7. Mahowald, N.; Baker, A.; Bergametti, G.; Brooks, N.; Duce, R.; Jickells, T.; Kubilay, N.; Prospero, J.; Tegen, I. Atmospheric global dust cycle and iron inputs to the ocean. Glob. Biogeochem. Cycles 2005, 19, GB4025. [Google Scholar] [CrossRef]
  8. Wagner, F.; Bortoli, D.; Pereira, S.; Costa, M.J.; Silva, A.; Weinzierl, B.; Esselborn, M.; Petzold, A.; Rasp, K.; Heinold, B. Properties of dust aerosol particles transported to Portugal from the Sahara desert. Tellus B 2009, 61, 297–306. [Google Scholar] [CrossRef] [Green Version]
  9. Salvador, P.; Almeida, S.M.; Cardoso, J.; Almeida-Silva, M.; Nunes, T.; Cerqueira, M.; Alves, C.; Reis, M.A.; Chaves, P.C.; Artinano, B.; et al. Composition and origin of PM10 in Cape Verde: Characterization of long-range transport episodes. Atmos. Environ. 2016, 127, 326–339. [Google Scholar] [CrossRef]
  10. Lafontaine, C.; Bryson, R.; Wendland, W. Airstream regions of North-Africa and the Mediterranean. J. Clim. 1990, 3, 366–372. [Google Scholar] [CrossRef] [Green Version]
  11. Obregón, M.; Pereira, S.; Salgueiro, V.; Costa, M.J.; Silva, A.M.; Serrano, A.; Bortoli, D. Aerosol radiative effects during two desert dust events in August 2012 over the Southwestern Iberian Peninsula. Atmos. Res. 2015, 153, 404–415. [Google Scholar] [CrossRef] [Green Version]
  12. Khan, B.; Stenchikov, G.; Weinzierl, B.; Kalenderski, S.; Osipov, S. Dust plume formation in the free troposphere and aerosol size distribution during the Saharan Mineral Dust Experiment in North Africa. Tellus B Chem. Phys. Meteorol. 2015, 67, 1–22. [Google Scholar] [CrossRef] [Green Version]
  13. Cuevas, E.; Gómez-Peláez, A.J.; Rodríguez, S.; Terradellas, E.; Basart, S.; Garcia, R.D.; Garcia, O.E.; Alonso-Perez, S. The pulsating nature of large-scale Saharan dust transport as a result of interplays between mid-latitude Rossby waves and the North African Dipole Intensity. Atmos. Environ. 2017, 167, 586–602. [Google Scholar] [CrossRef] [Green Version]
  14. Pey, J.; Querol, X.; Alastuey, A.; Forastiere, F.; Stafoggia, M. African dust outbreaks over the Mediterranean Basin during 2001–2011: PM 10 concentrations, phenomenology and trends, and its relation with synoptic and mesoscale meteorology. Atmos. Chem. Phys. 2013, 13, 1395–1410. [Google Scholar] [CrossRef] [Green Version]
  15. Directive 2008/50/EC of the European Parliament and of the Council of 21 May 2008 on ambient air quality and cleaner air for Europe. Available online: https://eur-lex.europa.eu/legal-content/en/ALL/?uri=CELEX%3A32008L0050 (accessed on 23 June 2022).
  16. Querol, X.; Pey, J.; Pandolfi, M.; Alastuey, A.; Cusack, M.; Pérez, N.; Moreno, T.; Viana, M.; Mihalopoulos, N.; Kallos, G. African dust contributions to mean ambient PM10 mass-levels across the Mediterranean Basin. Atmos. Environ. 2009, 43, 4266–4277. [Google Scholar] [CrossRef]
  17. Salvador, P.; Artíñano, B.; Molero, F.; Viana, M.; Pey, J.; Alastuey, A.; Querol, X. African dust contribution to ambient aerosol levels across central Spain: Characterization of long-range transport episodes of desert dust. Atmos. Res. 2013, 127, 117–129. [Google Scholar] [CrossRef]
  18. Agência Portuguesa do Ambiente, 2022 (in Portuguese). Available online: http://www.arsalentejo.min-saude.pt/arsalentejo/novidades/Documents/PREVISAO_EN_2022_03_15.pdf (accessed on 23 June 2022).
  19. Diapouli, E.; Manousakas, M.I.; Vratolis, S.; Vasilatou, V.; Pateraki, S.; Bairachtari, K.A.; Querol, X.; Amato, F.; Alastuey, A.; Karanasiou, A.A.; et al. AIRUSE-LIFE+: Estimation of natural source contributions to urban ambient air PM10 and PM2.5 concentrations in sourthern Europe—Implications to compliance with limit values. Atmos. Chem. Phys. 2017, 17, 3673–3685. [Google Scholar] [CrossRef] [Green Version]
  20. Basart, S.; Peréz, C.; Nickovic, S.; Cuevas, E.; Baldasano, J. Development and evolution of the BSC-DREAM8b dust regional model over Northern Africa, the Mediterranean and the Middle East. Tellus B 2012, 64, 18539. [Google Scholar] [CrossRef] [Green Version]
  21. Almeida, S.; Freitas, M.; Pio, C. Neutron activation analysis for identification of African mineral dust transport. J. Radionuclid Chem. 2008, 276, 161–165. [Google Scholar] [CrossRef]
  22. Guerrero-Rascado, J. Extreme Saharan dust event over the Southern Iberian Peninsula in September 2007: Active and passive remote sensing from surface and satellite. Atmos. Chem. Phys. 2009, 9, 8453–8469. [Google Scholar] [CrossRef] [Green Version]
  23. Wyche, K.; Ricketts, H.; Brolly, M.; Smallbone, K. Emerging investigator series: The red sky: Investigating the hurricane Ophelia Saharan dust and biomass burning aerosol event. Environ. Sci. Atmos. 2022, 2, 165–181. [Google Scholar] [CrossRef]
  24. World Health Organization. WHO Global Air Quality Guidelines: Particulate Matter (Pm2.5 and Pm10), Ozone, Nitrogen Dioxide, Sulfur Dioxide, and Carbon Monoxide; World Health Organization: Geneva, Switzerland, 2021. [Google Scholar]
  25. Duarte, R.; Gomes, J.F.P.; Querol, X.; Cattaneo, A.; Bergmans, B.; Saraga, D.; Maggos, T.; Di Gilio, A.; Rovelli, S.; Villanueva, F. Advanced instrumental approaches for chemical characterization of indoor particulate matter. Appl. Spectrosc. Rev. 2021. [Google Scholar] [CrossRef]
  26. Bergmans, B.; Cattaneo, A.; Duarte, R.M.B.O.; Gomes, J.F.P.; Saraga, D.; García, M.R.; Querol, X.; Liotta, L.F.; Safell, J.; Spinazzé, A.; et al. Particulate matter indoors: A strategy to sample and monitor size-selective fractions. Appl. Spectrosc. Rev. 2022. [Google Scholar] [CrossRef]
  27. Portaria 353-A/2013—Regulamento de desempenho energético dos edifícios de comércio e serviços (RECS): Requisitos de ventilação e qualidade do ar interior. Diário da República, 1ª série, 235: 4/12/2013 (In Portuguese). Available online: https://dre.pt/dre/detalhe/portaria/353-a-2013-331868 (accessed on 23 June 2022).
  28. Munir, S. Analyzing temporal trends in the ratios of PM2.5/PM10 in the UK. Aerosol Air Qual. Res. 2017, 17, 34–48. [Google Scholar] [CrossRef]
  29. Zha, H.; Wang, R.; Feng, X.; An, C.; Qeian, J. Spatial characteristics of the PM2.5/PM10 ratio and its indicative significance regarding air pollution in Hebei Province, China. Environ. Monit. Assess. 2021, 193, 486. [Google Scholar] [CrossRef]
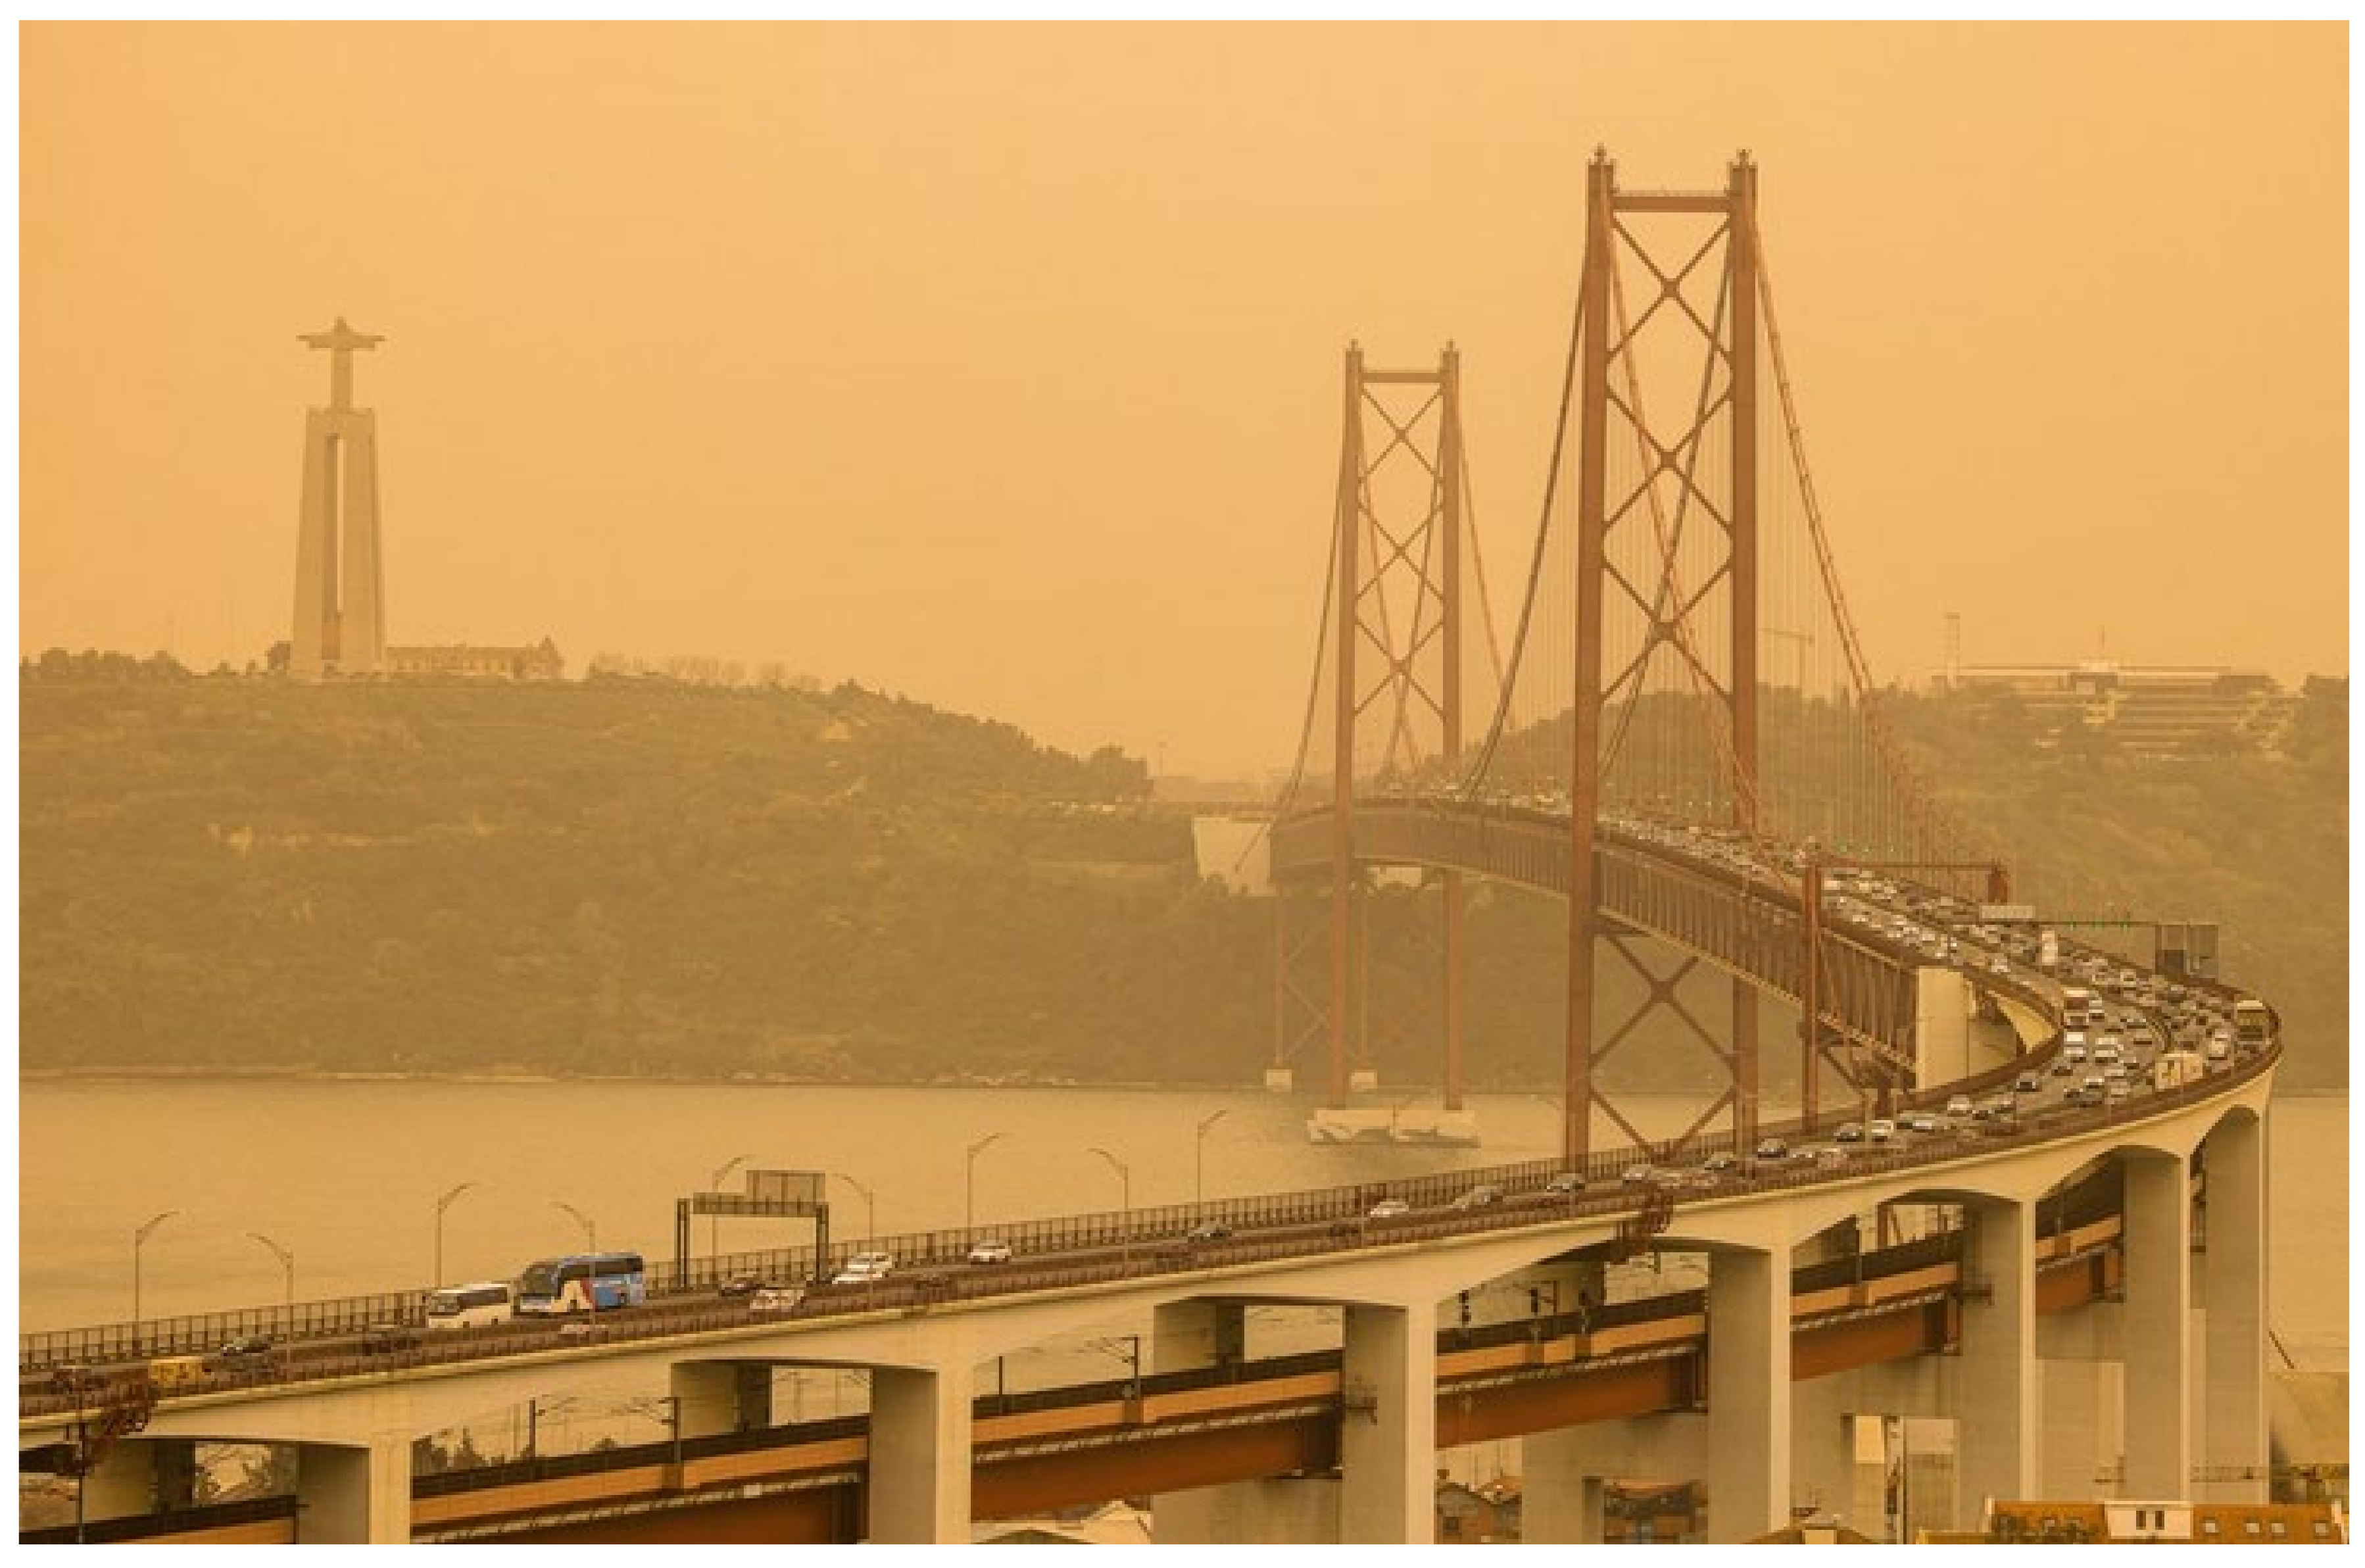
Figure 1. Overview of 25 April bridge, linking Lisbon to Almada, on 16 March 2022, where an “orange” sky can clearly be seen, around 12:00 GMT.
Gases 02 00005 g001
Figure 2. Forecast of movement of dust from Sahara over Europe on 15 to 16 March 2022. Source: Copernicus Atmospheric Monitoring Service (https://atmosphere.copernicus.eu accessed on 23 June 2022).
Gases 02 00005 g002
Figure 3. Map of Portugal showing the localization of outdoor air quality monitoring stations: A (Ervedeira), B (Chamusca), and C (Lourinhã) of the National Air Quality Monitoring Network, operated by the Portuguese Environment Agency (APA, Amadora, Portugal), and D (Fátima). Source: https://qualar.apambiente.pt (accessed on 23 June 2022).
Gases 02 00005 g003
Figure 4. Graphical results of outdoor PM2.5 and PM10 concentration on Ervedeira station (A) from 15 to 17 March 2022. Limit values according to European legislation [15]. Source: https://qualar.apambiente.pt (accessed on 23 June 2022).
Gases 02 00005 g004
Figure 5. Indoor PM10 concentrations measured in three buildings (1, 2, and 3), and station A (outdoor) from 14 to 19 March 2022. Outdoor limit value according to European legislation [15] and indoor limit value according to Portuguese legislation [27].
Gases 02 00005 g005
Figure 6. Recorded indoor PM2.5 concentrations in buildings 1, 2, and 3, and station A (outdoor) from 14 to 19 March 2022.
Gases 02 00005 g006
Figure 7. Recorded indoor PM1 concentrations in buildings 1, 2, and 3, and station A (PM2.5, outdoor) from 14 to 19 March 2022. Outdoor limit value according to European legislation [15].
Gases 02 00005 g007
Figure 8. PM10 plotted versus PM2.5 for the three buildings (1, 2, and 3) and station A.
Gases 02 00005 g008
Figure 9. Architecture of an integrated system for controlling both indoor air quality and thermal comfort.
Gases 02 00005 g009
Table 1. PM2.5 and PM10 daily and monthly mean observed concentrations (µg/m3) in stations A, B, and C. Source: https://qualar.apambiente.pt (accessed on 23 June 2022).
PM Stations
FractionTime FrameABC
2.5Average 2021866
Average March 2021989
14 March 20221014
15 March 2022253232
16 March 2022415433
17 March 2022171916
18 March 2022956
10Average 2021171214
Average March 2021191820
14 March 20221689
15 March 202210123290
16 March 202211120388
17 March 2022406143
18 March 2022141617
Publisher’s Note: MDPI stays neutral with regard to jurisdictional claims in published maps and institutional affiliations.