Simple Summary
FLASH radiotherapy uses radiation at ultra-high dose rates to achieve normal tissue sparing compared to radiation at conventional dose rates. However, the spatiotemporal variation in dose delivery for proton pencil-beam scanning treatments presents a challenge in terms of defining and achieving high dose rates. This article describes a model that can be used to examine possible FLASH effects in pencil-beam scanning using a mechanistic approach. The mechanism of radiolytic oxygen depletion is the focus of this study, however the approach can be applied more widely.
Abstract
FLASH radiotherapy is a rapidly developing field which promises improved normal tissue protection compared to conventional irradiation and no compromise on tumour control. The transient hypoxic state induced by the depletion of oxygen at high dose rates provides one possible explanation. However, studies have mostly focused on uniform fields of dose and there is a lack of investigation into the spatial and temporal variation of dose from proton pencil-beam scanning (PBS). A model of oxygen reaction and diffusion in tissue has been extended to simulate proton PBS delivery and its impact on oxygen levels. This provides a tool to predict oxygen effects from various PBS treatments, and explore potential delivery strategies. Here we present a number of case applications to demonstrate the use of this tool for FLASH-related investigations. We show that levels of oxygen depletion could vary significantly across a large parameter space for PBS treatments, and highlight the need for in silico models such as this to aid in the development and optimisation of FLASH radiotherapy.
1. Introduction
The development of proton pencil-beam scanning (PBS) was a major breakthrough in particle therapy [1]. The use of tightly focused pencil beams, scanned over a target volume, allows for unique sparing of normal tissue proximal to the tumour and improved efficiency compared to passive scattering techniques. Currently, the field of particle therapy could be facing its next major breakthrough—FLASH radiotherapy [2]. The exploration of ultra-high dose rates during the 1970s and 1980s led to promising results demonstrating improved sparing of normal tissue compared to conventional dose rates [3,4]. This was attributed to a depletion of molecular oxygen, at a rate too fast for cells to be re-oxygenated via diffusion of oxygen from nearby blood vessels, thus resulting in a state of transient hypoxia to produce the apparent sparing effect [5,6]. The issue of a potential reduction in tumour control that existed, and the resultant reluctance to develop the technique further, has been addressed more recently since the resurgence of interest in ultra-high dose rate irradiation in 2014 for FLASH sparing [2,7]. Despite the major advantages of each of these breakthrough treatment modalities, the avenue that exists from combining the techniques remains under-explored.
A number of studies have demonstrated the FLASH effect in various in vitro and in vivo systems [3,4]. Although some recent studies have shown that the radiolytic depletion of oxygen may not provide a full explanation for the observed sparing [8,9], it has been demonstrated that depletion takes place to some extent (which may be amplified in some biological systems [10]). Moreover, many studies have shown the FLASH effect to be an oxygen-dependent process [11,12], with other proposed mechanisms involving the production and reaction of reactive oxygen species [13,14]. Here we present a tool that is able to investigate oxygen effects from radiation, and which can be expanded to include additional oxygen-related mechanisms as they are elucidated.
Various radiation modalities have been investigated for FLASH, however relatively few have focused on proton spot scanning. The unique spatial and temporal variations of dose deposition in PBS presents a challenge in terms of defining and meeting a dose rate threshold. Studies by van Marlen et al. [15] and van de Water et al. [16] have each looked at spatial dose rate distributions for various PBS treatment plans and deliveries, to determine how FLASH dose rates could be achieved. A framework for defining dose rates during PBS treatments has since been developed by Folkerts et al. [17]. More recently, Zou et al. [18] have used clinical and FLASH proton PBS plans to determine the effective field dose rate and its dependence on various delivery parameters. By considering a FLASH dose rate threshold of 40 Gy/s, they found FLASH could only be achieved for single-layer plans with minimal energy switching and time between spots. In this paper, we present a model that is able to investigate the impact of similar delivery parameters using a more biological perspective, looking specifically at the effects of radiation-induced oxygen depletion. By applying the dose-time structures of PBS delivery to a model of oxygen depletion, we can investigate the possibility of FLASH sparing based on changes in oxygen-enhanced radioprotection as opposed to a dose rate threshold. Furthermore, this model is able to explore the possibility of FLASH sparing from successive high-dose-rate spots, regardless of a high overall dose rate for the treatment.
It was shown in our previous work that defining a threshold solely in dose rate is an oversimplified approach to parameterising the FLASH effect [19]. Instead, FLASH sparing exists within a complex parameter space involving the dose, dose rate, radiolytic depletion parameters, as well as biological parameters which determine the initial oxygen tension before irradiation and the rate of recovery. Instantaneous dose rates in PBS can be high, but although dose rates in each proton spot may be above the supposed FLASH threshold, limitations in the dose (usually only ∼2 Gy per fraction) or other parameters could explain why we do not see a FLASH effect in individual spots for current spot scanning treatments [20]. Our previous work showed the impact of each of these parameters, and the criteria necessary to achieve sparing, using a model of oxygen diffusion and reaction in tissue irradiated at varying dose rates. This reaction-diffusion model provides a framework for FLASH-related investigations, and is the basis of this work in which we superimpose a spot scanning model to demonstrate how oxygen depletion effects in proton treatment plans could be explored.
The spot scanning model introduces a new set of parameters and timing characteristics. During a PBS treatment, the monoenergetic beam is scanned across the cross-sectional area of the target and spots of the dose are delivered one after another [21]. The depth of irradiation is determined by the energy of the beam. After a single layer is scanned, the beam energy is reduced to paint the next layer. For treatments with multiple fields, the process is repeated at different beam angles. Although a given treatment plan provides a three-dimensional map of the dose within the patient, the time characteristics of the dose delivery are not described. The scanning implementation is generally optimised based on the efficiency of delivery. The model demonstrated here could be used to explore the impact of different delivery patterns on oxygen depletion effects and a potential shift in the way these scanning parameters are optimised, based on exploiting any possible oxygen-depletion-induced sparing of normal tissue.
A further point of interest is the concept of transmission compared to Bragg peak FLASH for proton spot scanning. Transmission FLASH uses a monoenergetic beam of higher energy that passes through the patient, delivering the dose from the entrance plateau rather than the Bragg peak. This has mostly been looked into so far [15], since it is better able to replicate electron delivery conditions from recent FLASH studies [7]. Bragg peak FLASH makes use of reduced dose downstream of the target, combining the dose conformality of PBS with the normal tissue sparing of FLASH. However, maintaining high dose rates is more complex due to the degrading of the beam energy and proton losses [18]. Comparison of transmission and Bragg peak FLASH, and their respective impact on oxygen depletion, presents another area that can be investigated using this model. Furthermore, the spatiotemporal features of this model are not limited to spot scanning techniques; a further area to study is the potentially synergistic combination of FLASH and minibeam radiation therapy using protons [22]. In this report, we outline the main workings of the model and provide a number of case examples to demonstrate its possible application, followed by a discussion on the further opportunities for investigation using this framework.
2. Materials and Methods
2.1. Oxygen Reaction-Diffusion Model
The basis of this work is a one-dimensional model of oxygen diffusion and reaction in tissue, which combines Fickian diffusion with terms to describe the metabolic and radiation-induced consumption of oxygen, as described previously [19]. The model is as follows:
where x is the position (in metres), t is time (in seconds), C is oxygen concentration (in mol/m) and is the effective diffusivity (in m/s). The rate of reaction terms, and , describe the metabolic and radiation-induced consumption of oxygen respectively (in mol/m/s). Both are defined as positive for destruction. A schematic diagram is shown in Figure 1.
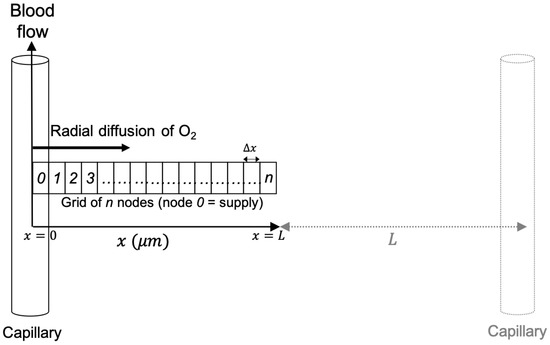
Figure 1.
Schematic diagram of the oxygen diffusion-reaction model, showing radial diffusion from a capillary along an orthogonal grid of nodes. An adjacent capillary is shown, where the distance between two capillaries is . A node width of 1 and system length of 50 was used for all simulations. The figure is reproduced from Rothwell et al. [19].
The metabolic consumption of oxygen is modelled using Michaelis-Menten style kinetics to approximate the metabolic dependency on oxygen concentration for any availability:
where k is the metabolic rate constant (in mol/m/s), which describes the maximum rate of metabolic consumption, and is the saturation constant (in mol/m), which describes the concentration at which the rate of consumption saturates. Here, the kinetics become zero-order when (as ), and become first-order when (as ).
The radiolytic consumption of oxygen is modelled using a two-stage lumped reaction. First, the interaction of radiation with cells produces radiolytic species A at a rate given by:
where is the dose rate (in Gy/s), is the reaction rate constant (mol/m/Gy), and gives the concentration of radiolytic species A. Second, intracellular oxygen reacts with A resulting in its depletion [23], at a rate given by:
where is the reaction rate constants for the second stage (in m/mol/s).
The solution technique is a cellular automaton [24]. A grid of nodes is supplied with oxygen via a capillary at . A series of time-steps are applied to simulate diffusion of oxygen across the nodes from the capillary, metabolic consumption of oxygen inside the nodes, and radiation-induced consumption during irradiation.
The state of each node is characterised by its concentration of oxygen. Dissolved oxygen concentrations (in mol/m) can be converted into partial pressure values (in mmHg or % O) using Henry’s Law [25]. To evaluate the change in relative radiosensitivity, this work has used the dependence of the oxygen enhancement ratio (OER) on oxygen tension as given by the Grimes & Partridge model [26], which fits well with the experimental data:
where p is the oxygen partial pressure (in mmHg), and values of 1.6 and 0.26 mmHg have been established for and respectively. Using this parameterisation, the maximum OER (under aerated conditions) is 2.6 and minimum OER (under anoxic conditions) is 1.0, giving a maximum OER shift of 1.6.
The effects of varying each parameter involved in the model were shown previously [19]. For the purposes of this study, the parameters in the oxygen reaction-diffusion model were kept constant for all the following simulations to solely demonstrate delivery effects on the oxygen levels. However, these can be altered to match tissue-specific characteristics of the site under investigation if the data are available. The parameter values used in the following case studies were based on normal tissue literature values, and were generally chosen to sit in the middle of the range of literature values. The parameters in the model and the values used in the following examples are summarised in Table 1.

Table 1.
Parameter definitions and values used in simulations.
2.2. Spot Scanning Model
The spatial and timing information for each spot in a treatment plan can be contained in an influence matrix, which is a two-dimensional array showing the contribution of each spot to each voxel in the treatment volume. The influence matrix is derived using scripting to calculate and export the dose from each pencil beam individually. The dose is calculated using a treatment planning system, Eclipse (Varian Medical Systems, Palo Alto, CA, USA), with a clinically-used analytical beam model. The example given in Figure 2 shows a clinical base of skull plan with four beams and a prescription dose of 70.2 Gy delivered in 39 fractions of 1.8 Gy. A section of the influence matrix for this plan is shown in Figure 2b. The full array contains a column for each voxel in the dose distribution and a row for each spot in the plan. The three-dimensional voxel array is reshaped into a one-dimensional list of voxel numbers (generally in order of increasing z, then by increasing x, then by increasing y) to form the columns. Spot numbers are assigned to each spot in the plan in the order they are delivered, to form the rows. By using the timing of each spot along the vertical axis, the temporal distribution of dose delivery to a given voxel can be visualised by reading down the column for that voxel.
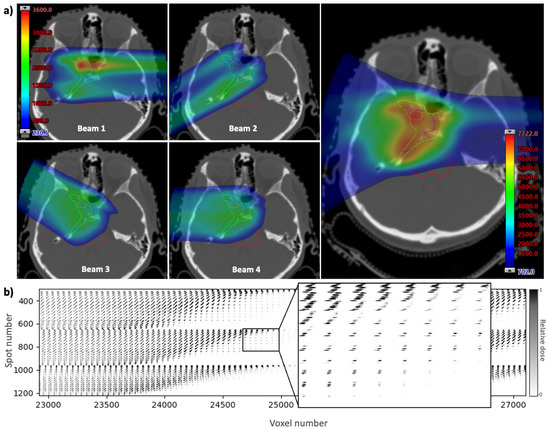
Figure 2.
(a) A clinical base of skull treatment plan showing the contribution of dose from four beams (left) and the full dose map (right) overlayed onto a CT slice. Dose distributions are generated using Eclipse (Varian Medical Systems, Palo Alto, CA, USA). (b) Extract from the corresponding influence matrix showing the contribution of each spot to each voxel in the treatment volume. Each voxel in the three-dimensional treatment plan is reshaped into a one-dimensional list by assigning a number (in order of increasing z, then by increasing x, then by increasing y) to form the columns of the influence matrix. The list of spots, in the order they are delivered, make up the rows.
To simulate these unique timing characteristics, the model considers four main contributions to time:
- Time to deliver the dose at the spot location i, (∼1–10 ms);
- Time to move from spot i to spot j, (∼1–2 ms, or approximated using the distance between spots and a scanner speed of ∼10 m/s [21]);
- Time to change the energy layer, (highly variable for different systems [1], values from 50 ms up to 1 s were tested here);
- Time taken to change the beam position to irradiate the next field, (dependent on many treatment factors).
For the latter beam changing time, since the time taken for the nodes to recover back to a steady state of oxygen tension is on a much shorter timescale, this can be assumed to remain fixed at a value sufficiently large to allow for the full recovery of the nodes. Computational effort can be saved by discontinuing a further simulation once the steady state is reached, and so a beam change time of 10 s was used here. These timings accumulate throughout the simulation, i.e., etc. Each spot is assigned a time-point to start irradiating, at which point the nodes begin to receive the calculated dose from that spot for its delivery duration.
For each simulation, the oxygen reaction-diffusion model is superimposed onto the model of spot scanning. However, as proton spot size is on the order of millimetres [21], and oxygen diffusion in tissue is on a scale of micrometres [35,36], this presents a multi-scale computational challenge. This can be overcome by placing the system of nodes at different locations within the spot scanning model to investigate the oxygen depletion effects in different cases under different spot conditions. The timescales of each model should also be taken into account, as the time structure of the reaction-diffusion model is limited by its time-step size. The spot scanning simulation can operate with a time structure down to the order of milliseconds, so a time-step size of at least an order of magnitude smaller than this is required to ensure numerical stability. This parameter can be adjusted as appropriate.
The grid of nodes receives the dose from a number of proton spots, calculated using the influence matrix, at their assigned timepoints. For a given spot with the centre sufficiently close to the node position in the x-y plane, if the spot is in the same energy layer as the grid of nodes, the dose received by the nodes will be within the spot’s Bragg peak. If the spot is at a greater depth than the nodes it will contribute part of its entrance dose, while if the spot is at a shallower depth the nodes will experience almost no dose from the spot. During a simulation, the nodes at a fixed position will receive a proportion of the dose from each spot, depending on their relative distance in the x-y plane and are further scaled by whether this is an entrance dose, peak dose, or if the nodes are past the distal edge of the spot. This dose information is contained within the influence matrix.
By altering the position of the nodes within the three-dimensional spot map, we can investigate oxygen depletion effects in different areas of the treatment, such as within the tumour target volume, at shallower depths occupied by normal tissue, or at the distal edge of a beam where an organ at risk may be situated. Examples of different representative positions were simulated. An interface has also been developed to allow the user to view the CT slices and dose maps of the treatment plan (for both the total dose and from each individual beam), specify structures to contour, then select a point in the plan for which to generate oxygen depletion data. This allows the user to investigate the depletion effects in specific structures or regions in the plan.
2.3. Case Applications
Example applications of the model have been provided to demonstrate its use as a tool for FLASH-related investigations. The clinical plan in Figure 2 was used to highlight some of these. Non-clinical abdominal plans were also generated for the same treatment site to show how the model can be used to investigate different delivery methods for FLASH using either transmission beams or multiple layers of Bragg peaks. Each of these plans was optimised to reduce dose to normal tissue. A prescription dose of 40 Gy delivered in 5 fractions of 8 Gy each was used. The transmission delivery used three beams (each with a single energy layer of 245 MeV and ∼180 spots), and the Bragg peak delivery used two beams (with energies ranging ∼130–180 MeV and up to ∼100 spots per layer). Influence matrices from both plans were input into the model to show how various delivery parameters could be investigated.
Another use of this model is to explore the concept of delivery optimisation based on oxygen depletion. A typical spot scanning pattern, delivered row-by-row in the x-y plane before changing energy to paint the next energy layer, is generally optimised for efficiency. However different patterns and delivery techniques may be more optimal for inducing oxygen depletion. Various methods and parameters were investigated here to demonstrate the capabilities of the model, such as changing the order in which the spots are delivered, changing the timing parameters, or the use of single vs. multiple beams.
The timing characteristics of dose delivered to a single voxel can be determined from each column of the influence matrix. The rows can be reordered to ensure the dose is delivered consecutively to maximise oxygen depletion, allowing minimal time for recovery. However, while this can easily be achieved for a single voxel, optimising the dose delivery for multiple voxels across the plan is not straightforward. Furthermore, constraints from the delivery parameters, such as the time to change energy layer, must also be considered. Various optimisation strategies can be used and their impact on the oxygen depletion can be tested using this model.
A useful approach to compare the outcome for different delivery strategies in the model is to plot a dose-OER histogram (DOH) which shows the cumulative dose delivered at each OER. The area under a DOH curve gives an indication of the overall decrease in radiosensitivity during the treatment. For a conventional plan, it is expected that the full dose is delivered at approximately the same OER, while for a FLASH delivery with oxygen depleting characteristics, the dose would be delivered at different OER values. A lower DOH area therefore suggests improved sparing. These histograms can be produced for a specific node or by averaging over the nodes. Corresponding values of OER (for that node) and dose at each timepoint are ordered by decreasing OER, then the cumulative dose is calculated. Examples are given in the following section.
3. Results
3.1. Clinical Plan—Oxygen Depletion in Different Regions
Oxygen depletion in three positions of the treatment plan in Figure 2a were simulated: within the target volume, in the entrance region of one of the beams, and in the brainstem at the distal edge of one of the beams. Plots for OER as a function of time are shown in Figure 3 for an example the node position at 25 from the capillary. Nodes at a distance of approximately 20– 30 were found to undergo the greatest reduction in OER in this example; this is roughly expected from the quasi-hyperbolic variation of OER with oxygen tension [26], where there exists an initial tension at which a maximum change in OER is achieved for a given depletion. The peaks and troughs in OER show that the timescales for the spot delivery and reaction-diffusion models are relevant to each other.

Figure 3.
Dose distribution (left) for the clinical base of skull plan in Figure 2 annotated to show three points where OER data were simulated. The plots (right) show the change in OER and the cumulative dose over the duration of the simulated treatment for the three points in the plan: (a) within the GTV, (b) in a beam entrance, or (c) in the brainstem. The blue line shows OER as a function of time for the node position at 25 from the capillary in the oxygen diffusion model. The black lines show the cumulative dose at that point over the course of the treatment.
As expected from the four beams in the treatment simulation, there is a gross structure in the OER curves consisting of four troughs where the nodes, particularly in the cases of the GTV and brainstem, experience prolonged oxygen depletion from consecutive spots. The width of these overall troughs is comparable to the duration of the beam-on time, suggesting that suppression of oxygen enhancement could be maintained for a significant proportion of the treatment. The fine structure shows some large drops in OER, corresponding to spots delivered relatively close to the nodes and in the same energy layer. Smaller peaks may correspond to spots in the same layer delivered further away in the x-y plane, or be due to the entrance dose of spots delivered distal to the node position.
From the three examples shown in Figure 3, the greatest OER change over the treatment is in the GTV, while there is significantly less change in the beam entrance. However, even these maximum OER shifts remain over a small scale of ∼0.01, as expected for a clinical treatment. The shift in OER from steady state can be measured using the model for every time point over the treatment, for each node. The maximum or average shift over the treatment duration (for each node) can also be determined.
3.2. FLASH Plans—Transmission and Bragg Peak
Example dose-OER histograms are given in Figure 4 for the transmission and Bragg peak plans. These were measured in the PTV of each plan using a scan time of 1 ms and a layer change time of 1 s, for the node at 25 from the capillary. The model can output the area under the DOH curve; for these examples using a total dose of 8 Gy per fraction, the areas were 17.5 and 17.9 Gy for the transmission and Bragg peak plans, respectively.
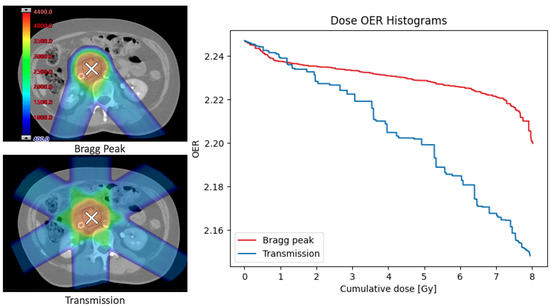
Figure 4.
Non-clinical dose distributions (left) generated to deliver 8 Gy per fraction to the same abdominal treatment site using either multiple layers of Bragg peaks (top left) or 245 MeV transmission beams (bottom left). Example dose-OER histograms (right) were calculated for a single point in the PTV of both plans, to show the OER as as a function of cumulative dose at that point. The area under the OER curve gives an indication of the overall decrease in radiosensitivity during the plan. Results were generated for the node 25 from the capillary.
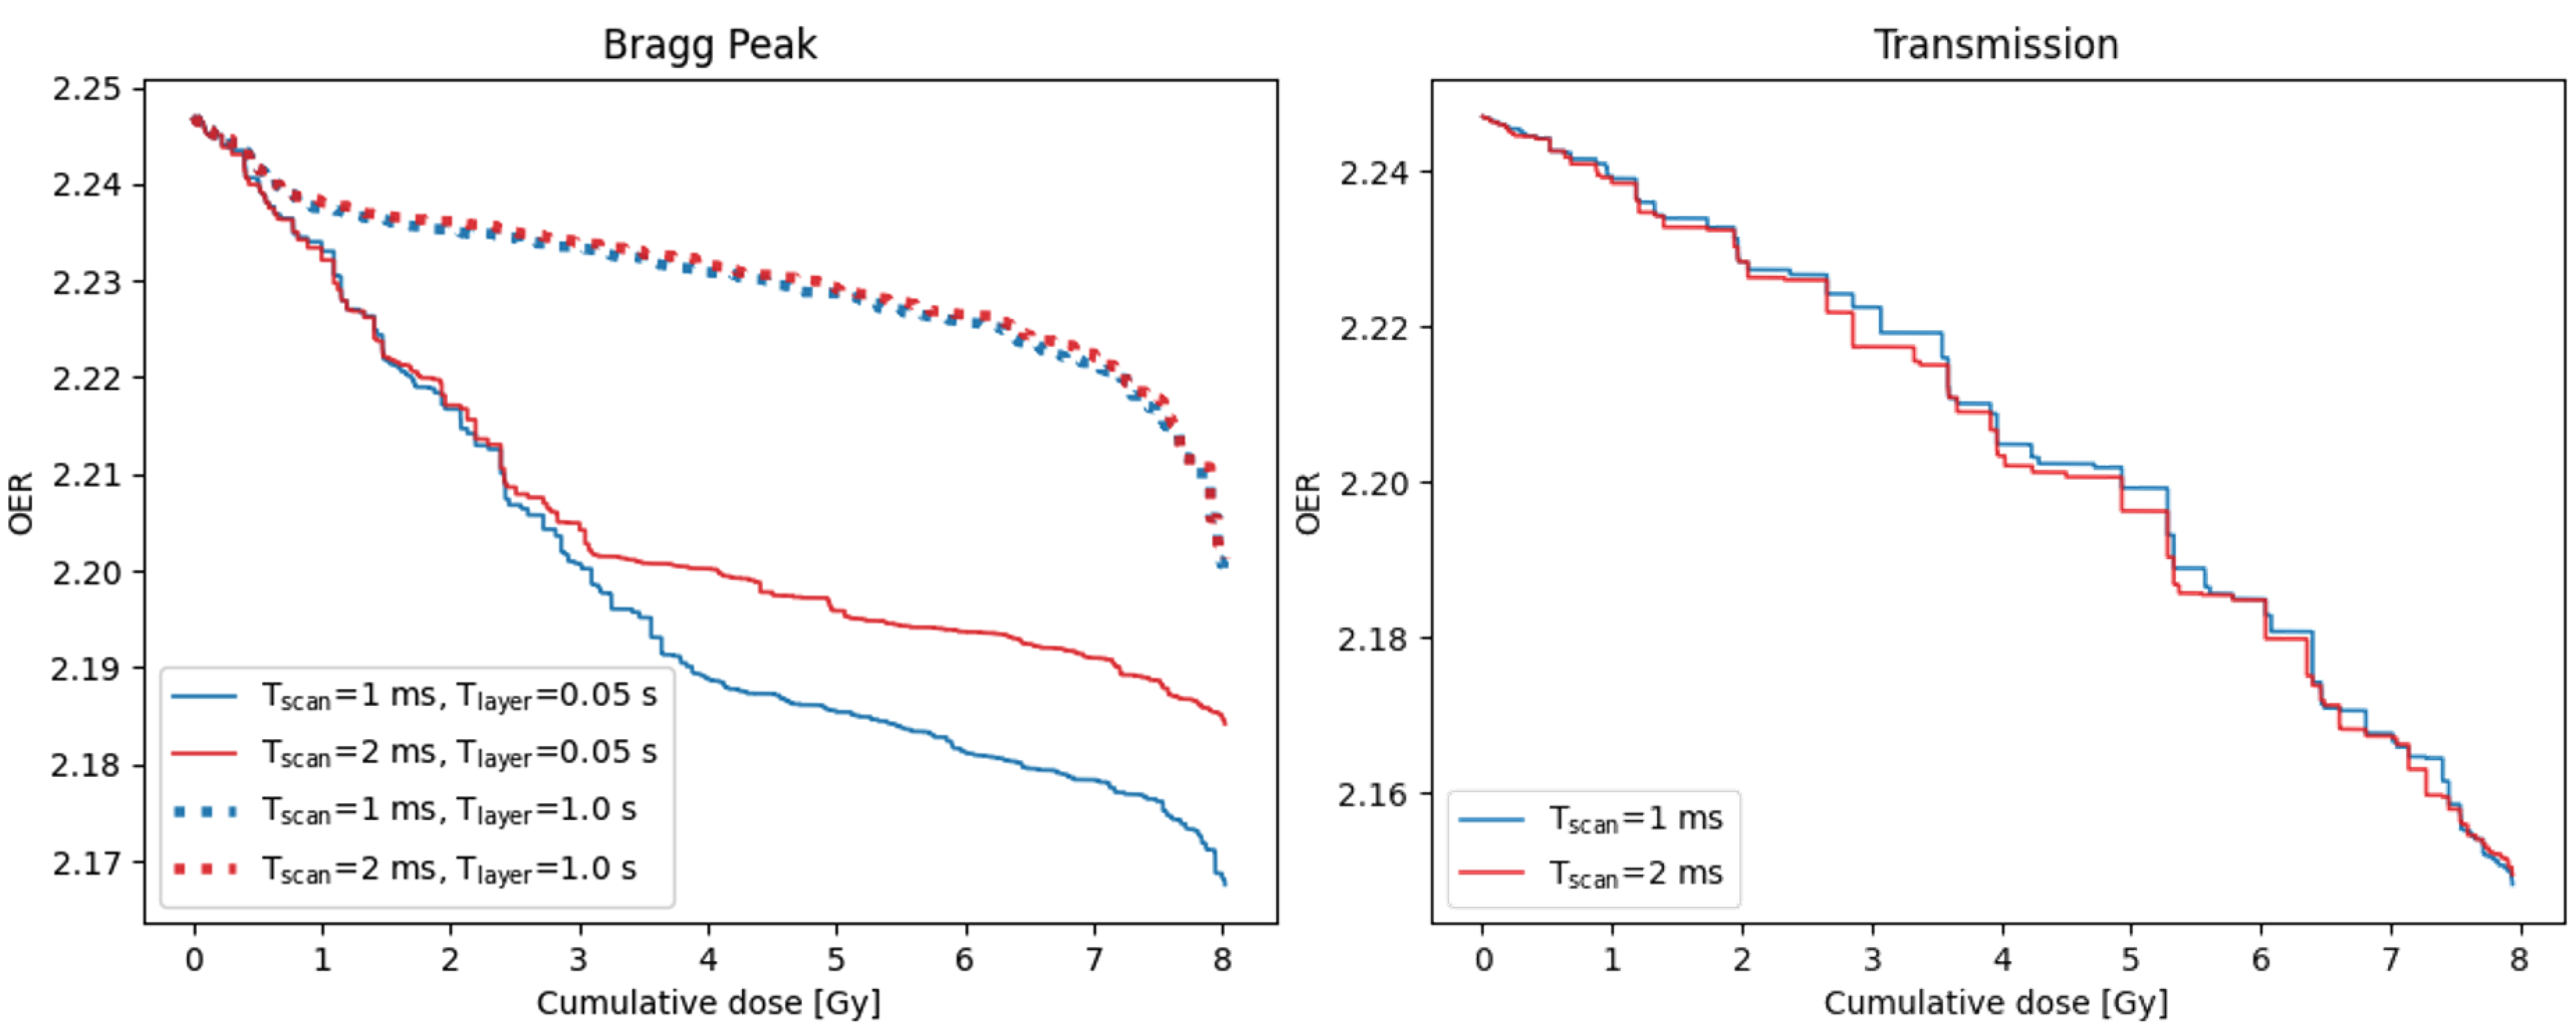
Dose-OER histograms can be used to quantify the impact of varying delivery parameters, such as the time to scan from one spot to the next, T, or the time to change energy layer, T. Examples are shown in Figure 5. For the Bragg peak plan, the smallest DOH area was obtained using the lowest values of both the scan time and layer change time. The area increases with either of these times, however increasing the scan time by 1 ms causes a much larger increase in area for a layer change time of 0.05 s than for 1 s. In contrast, for the transmission plan, the effect of increasing the scan time by 1 ms is insignificant.
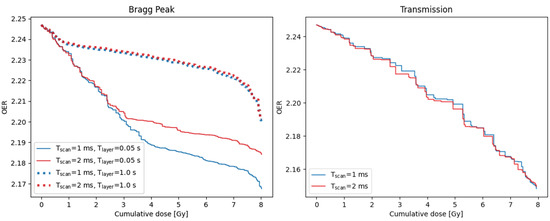
Figure 5.
Dose-OER histograms calculated for a single point in the PTV of the Bragg peak (left) and transmission (right) plans shown in Figure 4, using different values of the time taken to scan between consecutive spots, T, and the time taken to change the energy layer, T. Different layer change times were not simulated for the single-layer transmission plan. Results were generated for the node 25 from the capillary.
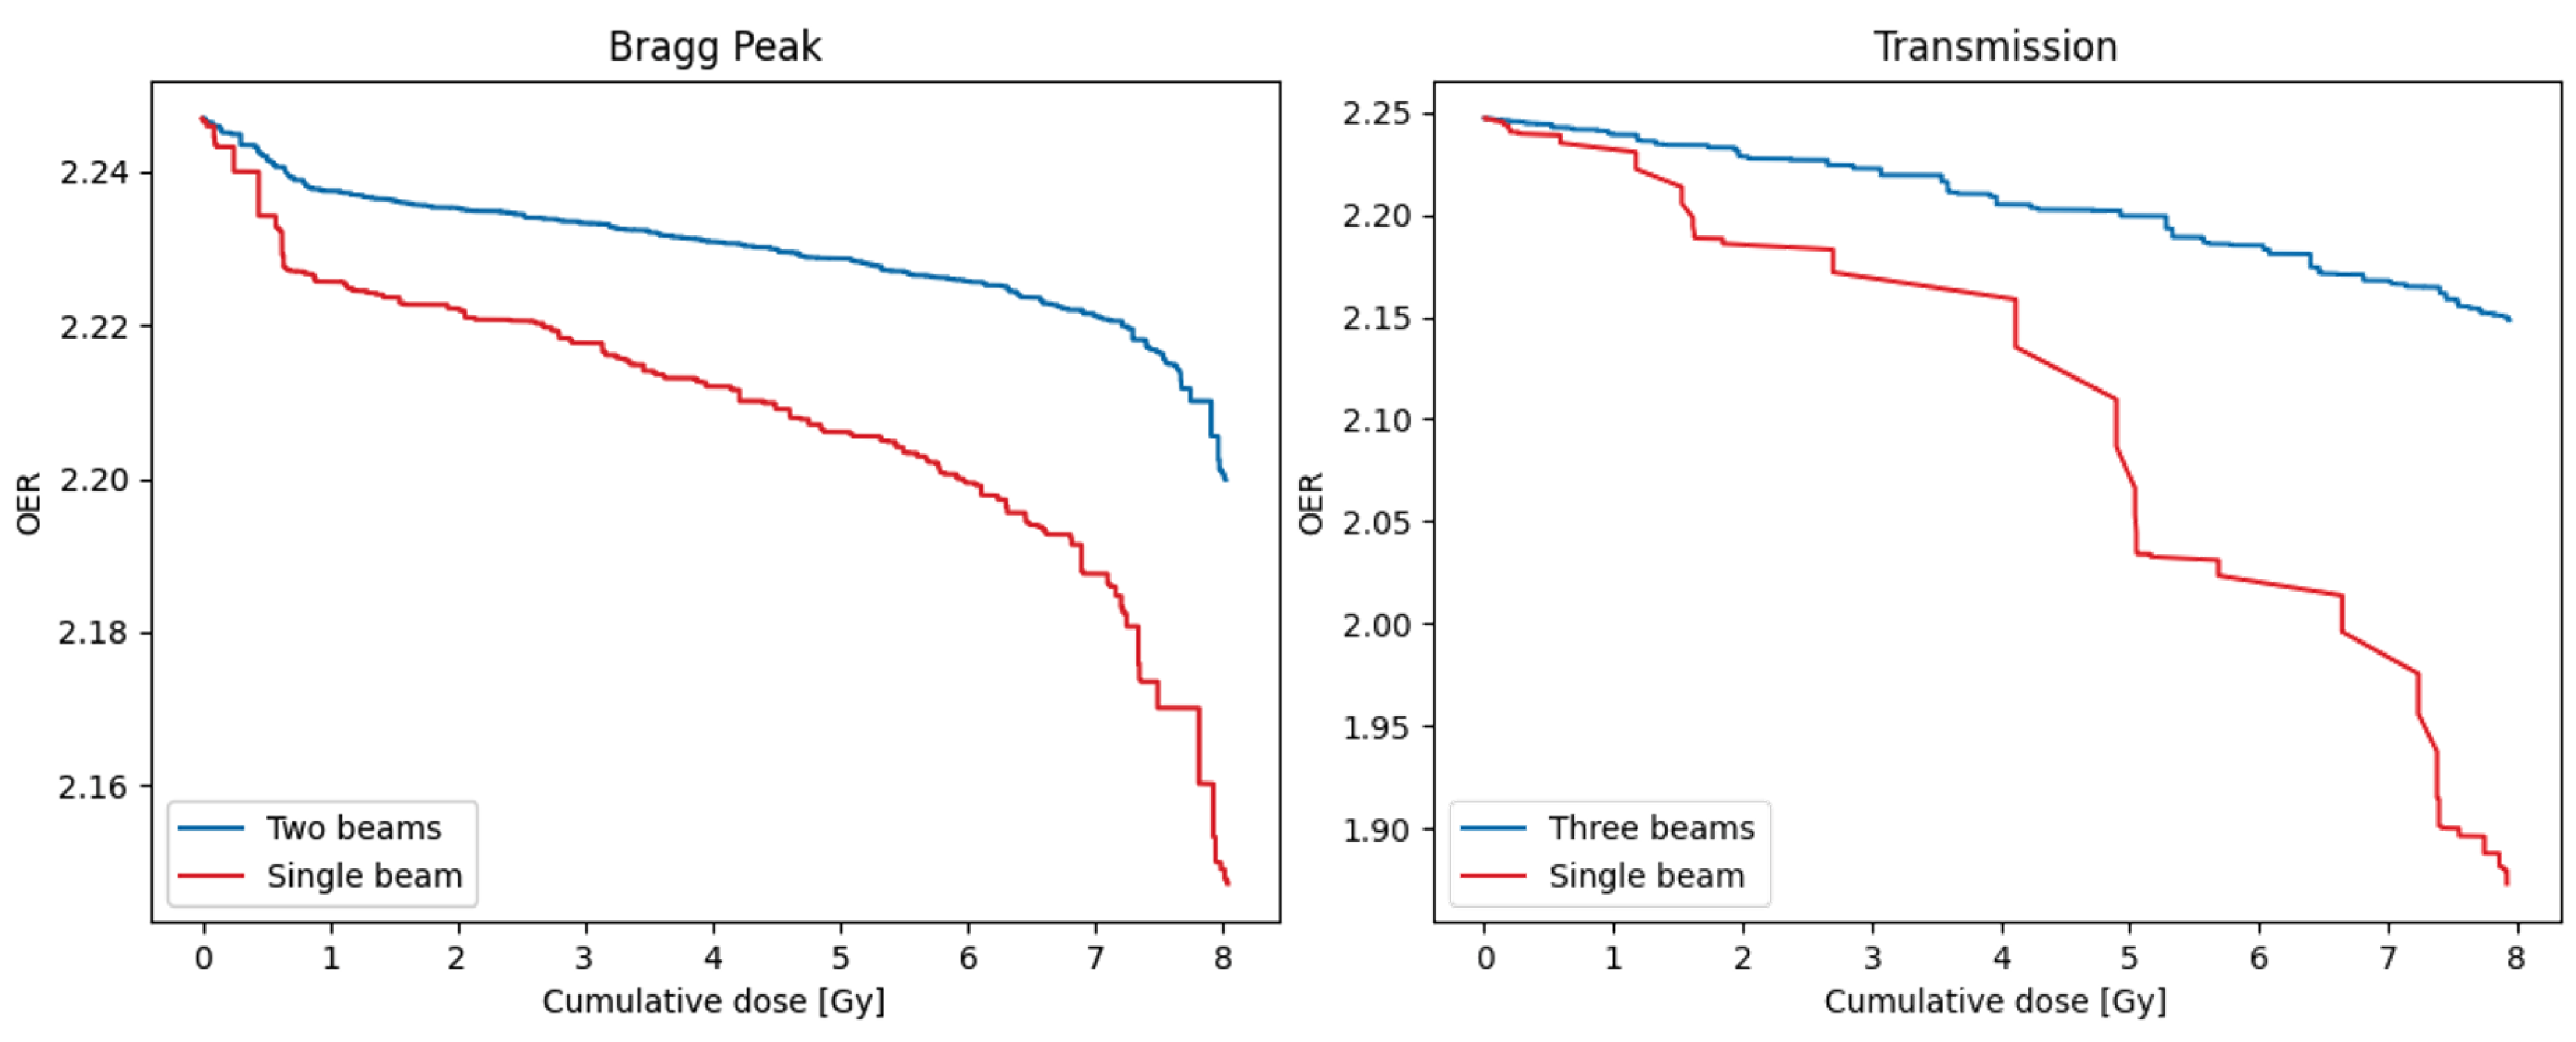
The use of multiple beams may have implications for achieving FLASH sparing [37], and so the model can be used to investigate the impact of using different numbers of beams. Example DOHs for both FLASH plans are shown in Figure 6, comparing the use of one of the beams delivering the full 8 Gy fraction dose, with the delivery from all beams. As expected, for both plans the reduction in overall treatment time for the single-beam approach means that more dose is delivered at a reduced OER, resulting in a significantly reduced DOH area. Similar investigations into the effect of single- or hypo-fractionation dose delivery can also be performed by adjusting the fraction size in the model [37].
Figure 6.
Dose-OER histograms calculated for a single point in the PTV of the Bragg peak (left) and transmission (right) plans shown in Figure 4, using either the original number of beams (two for the Bragg peak plan, three for the transmission plan), or a single beam from the plan delivering the full 8 Gy dose per fraction. Results were generated for the node 25 from the capillary.
3.3. Delivery Reordering
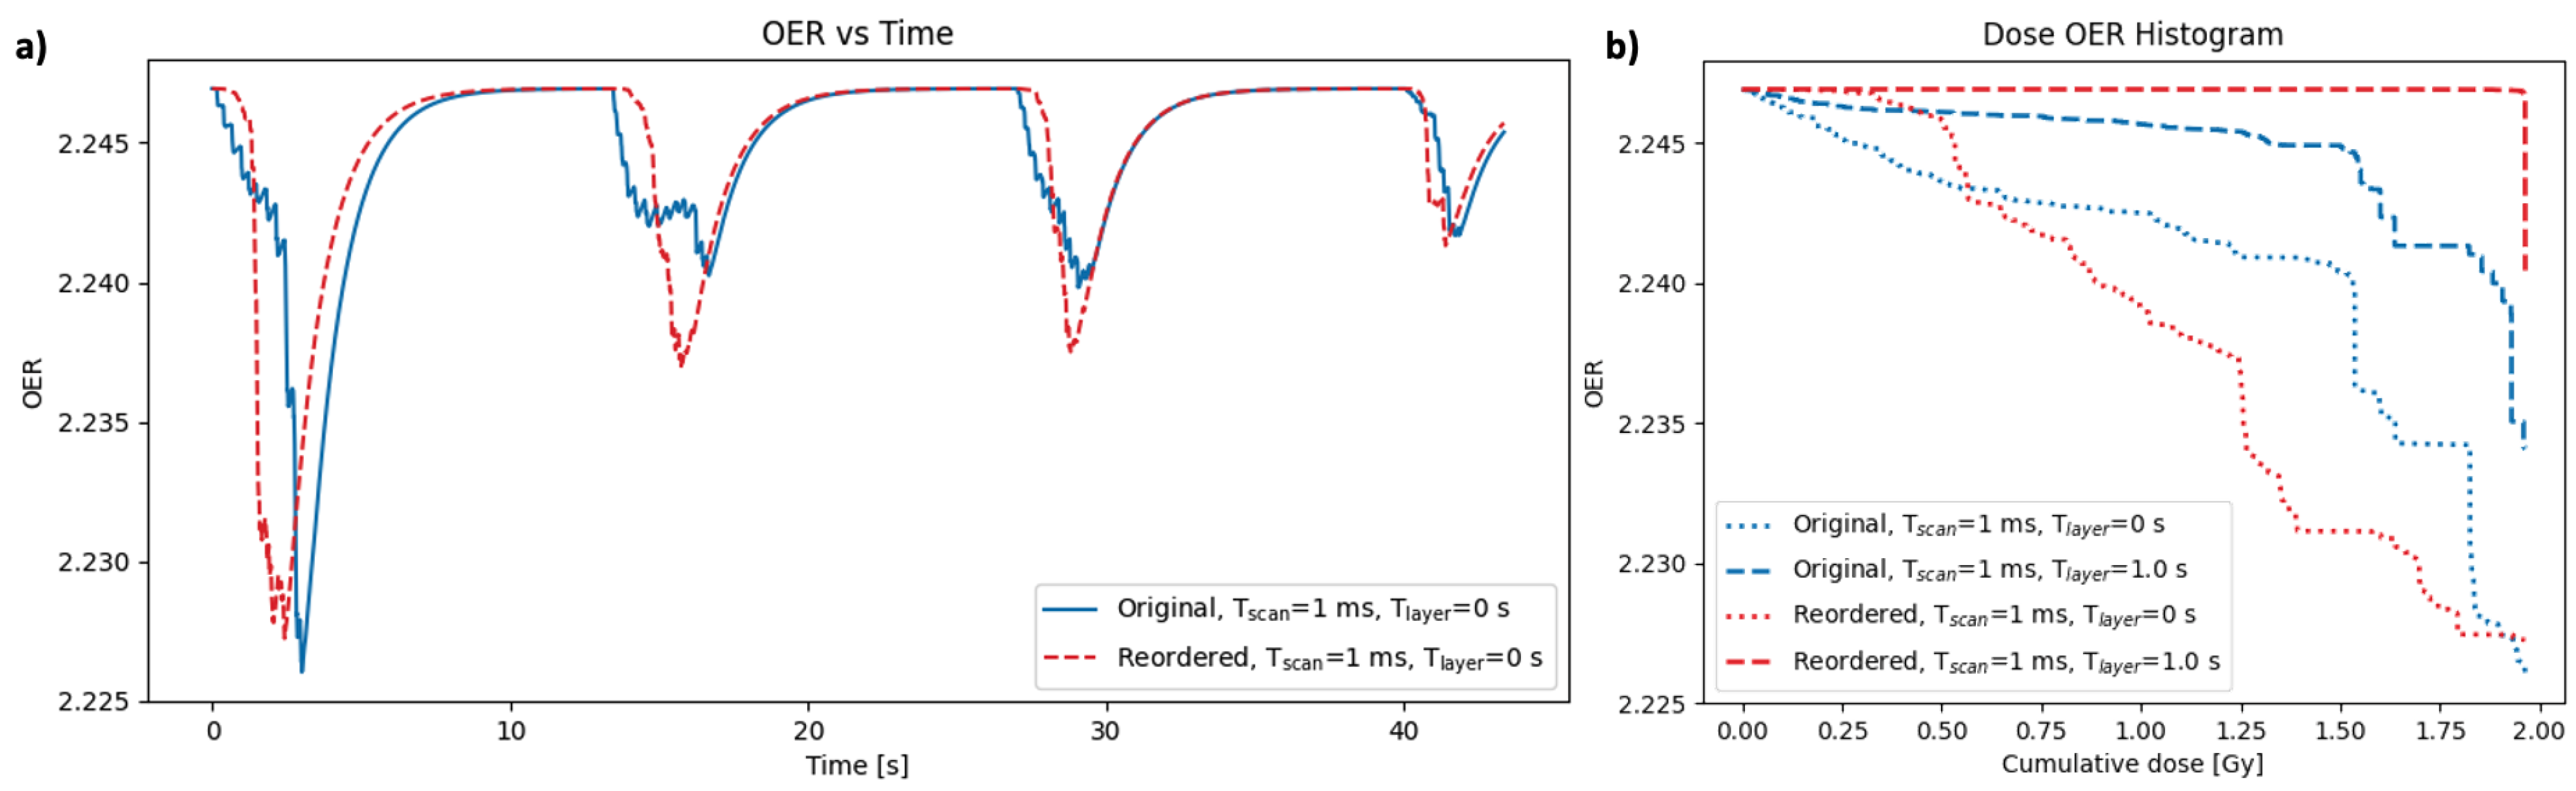
Various re-delivery strategies were tested using this model to investigate the effects of delivering the same set of spots (and therefore the same dose distribution) in a different order. The results in Figure 7 show an example case of reordering the delivery of the spots used in the clinical base of skull plan. The original order was the default delivery generated by the delivery system (scanning row-by-row in the x-y plane for a single layer, then changing the energy layer and scanning row-by-row again in the next). The method of reordering tested here was to order all of the spots row-by-row in the x-y plane across all energy layers (within each beam), such that energy changes were introduced between consecutive spots. Both orders were tested for layer change times of 0 and 1 s, while keeping the scan time between spots constant at 1 ms. The results in Figure 7 were generated for a point in the GTV of the plan, and for the node 25 from the capillary. Figure 7a shows the change in OER over the course of the treatment for both delivery orders, using a layer change time of 0 s. Figure 7b shows dose-OER histogram results for each of the layer change times tested, for both orders of delivery.

Figure 7.
(a) OER as a function of time for a single point in the GTV for the base of skull plan (point a in Figure 3). The OER profile is shown for two different methods of delivering the same set of spots: original results (blue) were generated by scanning spots layer-by-layer; reordered results (red) were generated by scanning all spots row-by-row in the x-y plane regardless of energy layer. (b) Dose-OER histograms for the original (blue) and reordered (red) orders of delivery, using different values of the time taken to scan between consecutive spots, T, and the time taken to change energy layer, T. All results were generated for the node 25 from the capillary. Note that the overall dose distribution in each case is identical, as it is only the temporal delivery that is altered.
For a layer change time of 1 s, the original order gave a lower DOH area, as expected for a more efficient delivery with minimal layer changes. However, for a layer change time of 0 s, the reordered DOH area was lower than the original. In this case, the OER profile for the reordered delivery in Figure 7a shows smoother peaks (from the four beams) compared to the original delivery with a greater micro-structure within each peak. For the reordered delivery, with a layer change time of 0 s, all spots within the vicinity of the node position in the plan are delivered consecutively, whereas the original delivery sequence results in a full layer being scanned before coming back around to the node position in the next layer. Nodes therefore have less time to recover between spots in the reordered case, resulting in the reduced micro-structure. However, introducing a layer change time of 1 s creates longer gaps between consecutive spots where the nodes are able to recover significantly between spots.
4. Discussion
We have presented a method for exploring oxygen depletion effects of proton spot scanning using a model of oxygen diffusion and reaction in tissue. The model was developed with the aim of exploring one of the most predominant hypotheses behind the FLASH sparing effect. However, it can also be used to understand the extent of any oxygen depletion effects that may exist in current treatments to ensure we have a benchmark to compare FLASH-related discoveries against. This is particularly important for proton spot scanning, where the spatial and timing characteristics make it unique compared to other modalities generally investigated for the purposes of FLASH. The framework can also be expanded to investigate other oxygen-dependent mechanisms that may contribute to the FLASH sparing effect.
By solving the multi-physics problem of oxygen diffusion and consumption (on the order of ) combined with the proton spot irradiation (on the order of mm), we have shown that the timescales of these two models are relevant in the context of oxygen depletion, and that the potential biological impact predicted from the former model may not be negligible in a typical spot scanning treatment. The model can be used to identify cases where the extent of depletion may lead to suppression of the OER for a significant duration of the treatment, where a potential biological impact might be worth investigating.
Previous studies have investigated dose rate distributions of proton PBS treatments and used the assumption that a defined average dose rate must exceed a FLASH threshold (usually 40 Gy/s) to produce a sparing effect—e.g., using the dose-averaged dose rate [15], the dose rate distribution in a beam [15], or the effective field dose rate [18]. While obtaining high average dose rates should be a priority for FLASH, particularly with the use of standardised dose rate measurements to compare with different radiation modalities [17], to our knowledge, this is the first model that can also investigate possible sparing from successive high-dose-rate spots causing suppression of oxygen levels, even without the average dose rate surpassing a supposed FLASH threshold. By adopting a more mechanistic approach for FLASH sparing, our model is able to analyse the impact of different dose rate distributions and work towards defining the conditions under which FLASH sparing could be achieved.
We have provided case-study applications to demonstrate differences in oxygen depletion effects at different points in a clinical treatment plan, for hypothetical FLASH plans, and examples of how results can be quantified. It should be emphasised that all results provided are the outcome of a specific set of parameters tested (see Table 1) and for specific treatment scenarios; the model can be used to simulate various delivery regimes and measure the effect of varying any of the model parameters, perhaps to investigate effects for different regions of the body with different compositions, or to cover the full range of biological uncertainty for each parameter. For many of the examples, results were given for positions within the treatment volume to demonstrate oxygen effects at points with the greatest dose, and at the intersection of multiple beams, to highlight the temporal effects. For investigations with the purpose of inducing the greatest OER shifts, it may be more relevant to use points within organs at risk or other normal tissue sites.
The example results given here showed most significant shifts at 20– 30 from the nearest capillary. Although variation in OER was over a very small scale for these results, even at this capillary distance, this is to be expected for the conventional delivery regime simulated using 1.8 Gy per fraction delivered using four beams. The results here therefore provide a benchmark to compare any FLASH-related investigations against. The model can be used to investigate non-conventional delivery regimes which may cause a greater shift in OER. However, these should always be weighed up against dose conformality and other treatment considerations in radiotherapy.
Currently, the delivery of PBS treatments is generally optimised based on efficiency. Here, we highlight the novel concept of optimising delivery based on oxygen effects and present a tool to explore this. In the example provided in Figure 7, the plan was reordered such that all spots were scanned row-by-row in the x-y plane, regardless of energy layer, therefore resulting in a large number of energy changes. Using the hypothetical assumption that energy switching can be performed instantaneously, this could result in a large variation in OER effects over the treatment. It should be noted that this is a single example of a number of ways the delivery could be reordered to produce a similar, or greater, OER variation, and is simply used for illustrative purposes. Furthermore, the effects are only shown for a single point in the target volume (to compare against the most significant OER variation from the results in Figure 3). Optimisation strategies could be used to investigate this further across larger sites, and determine the extent to which OER variation is feasible from delivery reordering.
Although short delivery times are generally optimal for patient comfort and reduction of movement, the beam-on time only makes up a small proportion of the total treatment time, and so this could be a compromise worth making given sufficient evidence for a new way of optimising. Furthermore, the technical procedures required to alter the delivery sequences from the default settings may be difficult to achieve and were only simulated in this work. However, if there is sufficient evidence for improved outcome, the practical applications of delivery optimisation could be looked into. We have provided examples of how different methods of delivering the same plan result in different oxygen depletion levels. The model provides a tool to explore this concept further.
The model applications are not limited to the example case studies given here. For example, by altering the reaction-diffusion parameters to obtain varying levels of tissue oxygenation or metabolism, the effects of different tissue types or conditions can be investigated. Using the contoured treatment plan interface, by selecting a structure of interest it is possible to generate oxygen depletion data using tissue-specific parameters for that site. Given the availability of normal tissue and tumour specific data for each parameter, these could be input into the model to investigate differential effects.
The ability of the model to incorporate spatial and temporal characteristics of the dose means that non-conventional spot scanning techniques can also be simulated. The use of minibeams, and particularly the combination of FLASH and minibeam radiotherapy, is a further area of current interest [22]. Influence matrices showing spatial fractionation of a dose across a treatment plan can be generated and passed onto the model to determine oxygen levels at different points in the treatment, within the peaks or valleys of the microbeam array. Moreover, the model could be used in a similar way to explore the biological impact of spot-reduction techniques—another active area of research in proton therapy, either for the purpose of increasing the dose rate to achieve FLASH sparing, or to shorten treatment times [16,18].
The current challenge of Bragg peak vs. transmission FLASH can also be investigated using comparable treatment plans for each case. While transmission beams are expected to lead to greater sparing by maintaining a higher dose rate, the examples provided here suggest that the best approach may not be as clear when oxygen depletion is measured. Differences in biological effect as a result of different LET distributions from each technique should also be considered.
The model relies on a number of assumptions outlined in Rothwell et al. [19], as well as the assumption that the concepts included, such as the OER model, can be applied to protons. Validation of these using experimental results remains crucial. A particular limitation of this work is the one-dimensional nature of the oxygen model, which neglects the three-dimensional diffusion effects from complex networks of blood vessels. However, even in one dimension, parameters can be adjusted to imitate oxygen levels and recovery rates at certain points within a three-dimensional system. Furthermore, the simplicity of the model reduces the number of model parameters required, and acts as an initial guide for possible oxygen depletion effects. A simplistic model can identify particular areas of further investigation, for which complexity of relevant aspects can be incorporated.
This work is also limited by the lack of a direct link between changes in oxygen concentration on a sub-voxel scale and subsequent biological response. Although models exist to relate cellular oxygen tension to their relative radiosensitivity [26,38], the translation of this to a patient level is poorly characterised. This allows only predictions to be made in terms of the patient outcome for different levels of oxygen depletion during treatment. It is crucial to establish the translation to patient outcome using in vivo and, ultimately, patient data.
5. Conclusions
The model presented provides a tool to investigate oxygen depletion effects from proton spot scanning. A number of case applications using clinical and non-clinical (FLASH) treatment plans have been provided to demonstrate its use in measuring oxygen enhancement for different delivery scenarios. The variation in results from these examples emphasises the importance of in silico investigations over a large parameter space to establish both the conditions needed for a FLASH effect and a benchmark to compare FLASH-related discoveries against.
Author Contributions
Conceptualization, B.C.R., M.L., N.F.K., M.J.M., A.L.C., R.I.M. and K.J.K.; methodology, B.C.R. and M.L.; software, B.C.R. and M.L.; validation, B.C.R. and M.L.; formal analysis, B.C.R.; investigation, B.C.R.; resources, B.C.R. and M.L.; data curation, B.C.R.; writing—original draft preparation, B.C.R.; writing—review and editing, M.L., N.F.K., M.J.M., A.L.C., R.I.M., J.H.H. and K.J.K.; visualization, B.C.R. and M.L.; supervision, M.L., N.F.K., M.J.M., A.L.C., R.I.M., J.H.H. and K.J.K.; project administration, K.J.K.; funding acquisition, K.J.K. All authors have read and agreed to the published version of the manuscript.
Funding
This research was funded by Cancer Research UK Manchester Centre and is supported by the NIHR Manchester Biomedical Research Centre [BRC-1215-20007], Cancer Research UK RadNet Manchester [C1994/A28701], and the European Union’s H2020 Research and Innovation Programme under Grant Agreement No. 730983.
Institutional Review Board Statement
Not applicable.
Informed Consent Statement
Not applicable.
Data Availability Statement
No applicable.
Acknowledgments
We gratefully acknowledge the Varian FlashForwardTM consortium.
Conflicts of Interest
The authors declare no conflict of interest.
References
- Han, Y. Current status of proton therapy techniques for lung cancer. Radiat. Oncol. J. 2019, 37, 232–248. [Google Scholar] [CrossRef] [PubMed]
- Favaudon, V.; Caplier, L.; Monceau, V.; Pouzoulet, F.; Sayarath, M.; Fouillade, C.; Poupon, M.F.; Brito, I.; Hupé, P.; Bourhis, J.; et al. Ultrahigh dose-rate FLASH irradiation increases the differential response between normal and tumor tissue in mice. Sci. Transl. Med. 2014, 6, 1–10. [Google Scholar] [CrossRef] [PubMed]
- Vozenin, M.C.; Hendry, J.H.; Limoli, C.L. Biological benefits of ultra-high dose rate FLASH radiotherapy: Sleeping beauty awoken. Clin. Oncol. 2019, 31, 407–415. [Google Scholar] [CrossRef] [PubMed]
- Hendry, J. Taking Care with FLASH Radiation Therapy. Int. J. Radiat. Oncol. Biol. Phys. 2020, 107, 232–242. [Google Scholar] [CrossRef]
- Berry, R.J.; Stedeford, J.B.H. Reproductive survival of mammalian cells after irradiation at ultra-high dose-rates: Further observations and their importance for radiotherapy. Br. J. Radiol. 1972, 45, 171–177. [Google Scholar] [CrossRef]
- Nias, A.H.W.; Swallow, A.J.; Keene, J.P.; Hodgson, B.W. Effects of pulses of radiation on the survival of mammalian cells. Br. J. Radiol. 1969, 42, 553. [Google Scholar] [CrossRef]
- Vozenin, M.C.; De Fornel, P.; Petersson, K.; Favaudon, V.; Jaccard, M.; Germond, J.F.; Petit, B.; Burki, M.; Ferrand, G.; Patin, D.; et al. The advantage of FLASH radiotherapy confirmed in mini-pig and cat-cancer patients. Clin. Cancer Res. 2018, 25, 35–42. [Google Scholar] [CrossRef] [Green Version]
- Jansen, J.; Knoll, J.; Beyreuther, E.; Pawelke, J.; Skuza, R.; Hanley, R.; Brons, S.; Pagliari, F.; Joao, S. Does FLASH deplete oxygen? Experimental evaluation for photons, protons and carbon ions. Med. Phys. 2021, 48, 3982–3990. [Google Scholar] [CrossRef]
- Cao, X.; Zhang, R.; Esipova, T.V.; Allu, S.R.; Ashraf, R.; Rahman, M.; Gunn, J.R.; Bruza, P.; Gladstone, D.J.; Williams, B.B.; et al. Quantification of Oxygen Depletion During FLASH Irradiation In Vitro and In Vivo. Int. J. Radiat. Oncol. Biol. Phys. 2021, 111, 240–248. [Google Scholar] [CrossRef]
- Spitz, D.R.; Buettner, G.R.; Petronek, M.S.; St-Aubin, J.J.; Flynn, R.T.; Waldron, T.J.; Limoli, C.L. An integrated physico-chemical approach for explaining the differential impact of FLASH versus conventional dose rate irradiation on cancer and normal tissue responses. Radiother. Oncol. 2019, 139, 23–27. [Google Scholar] [CrossRef]
- Adrian, G.; Konradsson, E.; Lempart, M.; Bäck, S.; Ceberg, C.; Petersson, K. The FLASH effect depends on oxygen concentration. Br. J. Radiol. 2020, 93, 20190702. [Google Scholar] [CrossRef] [PubMed]
- Montay-Gruel, P.; Acharya, M.M.; Petersson, K.; Alikhani, L.; Yakkala, C. Long-term neurocognitive benefits of FLASH radiotherapy driven by reduced reactive oxygen species. Proc. Natl. Acad. Sci. USA 2019, 116, 10943–10951. [Google Scholar] [CrossRef] [PubMed] [Green Version]
- Abolfath, R.; Grosshans, D.; Mohan, R. Oxygen depletion in FLASH ultra-high-dose-rate radiotherapy: A molecular dynamics simulation. Med. Phys. 2020, 47, 6551–6561. [Google Scholar] [CrossRef] [PubMed]
- Labarbe, R.; Hotoiu, L.; Barbier, J.; Favaudon, V. A physicochemical model of reaction kinetics supports peroxyl radical recombination as the main determinant of the FLASH effect. Radiother. Oncol. 2020, 153, 303–310. [Google Scholar] [CrossRef] [PubMed]
- van Marlen, P.; Dahele, M.; Folkerts, M.; Abel, E.; Slotman, B.; Verbakel, W. Bringing FLASH to the clinic: Treatment planning considerations for ultrahigh dose-rate proton beams. Int. J. Radiat. Oncol. Biol. Phys. 2019, 106, 621–629. [Google Scholar] [CrossRef]
- van de Water, S.; Safai, S.; Schippers, J.M.; Weber, D.C.; Lomax, A.J. Towards FLASH proton therapy: The impact of treatment planning and machine characteristics on achievable dose rates. Acta Oncol. 2019, 58, 1463–1469. [Google Scholar] [CrossRef]
- Folkerts, M.M.; Abel, E.; Busold, S.; Perez, J.R.; Krishnamurthi, V.; Ling, C.C. A framework for defining FLASH dose rate for pencil beam scanning. Med. Phys. 2020, 47, 6396–6404. [Google Scholar] [CrossRef]
- Zou, W.; Diffenderfer, E.S.; Cengel, K.A.; Kim, M.M.; Avery, S.; Konzer, J.; Cai, Y.; Boisseu, P.; Ota, K.; Yin, L.; et al. Current delivery limitations of proton PBS for FLASH. Radiother. Oncol. 2021, 155, 212–218. [Google Scholar] [CrossRef]
- Rothwell, B.C.; Kirkby, N.F.; Merchant, M.J.; Chadwick, A.L.; Lowe, M.; Mackay, R.I.; Hendry, J.H.; Kirkby, K.J. Determining the parameter space for effective oxygen depletion for FLASH radiation therapy. Phys. Med. Biol. 2021, 66, 055020. [Google Scholar] [CrossRef]
- Doyen, J.; Sunyach, M.P.; Almairac, F.; Bourg, V.; Naghavi, A.O.; Duhil de Bénazé, G.; Claren, A.; Padovani, L.; Benezery, K.; Noël, G.; et al. Early Toxicities After High Dose Rate Proton Therapy in Cancer Treatments. Front. Oncol. 2021, 10, 613089. [Google Scholar] [CrossRef]
- Paganetti, H. Proton Therapy Physics; Taylor & Francis: Hoboken, NJ, USA, 2011. [Google Scholar]
- Mazal, A.; Prezado, Y.; Ares, C.; de Marzi, L.; Patriarca, A.; Miralbell, R.; Favaudon, V. FLASH and minibeams in radiation therapy: The effect of microstructures on time and space and their potential application to protontherapy. Br. J. Radiol. 2020, 93, 20190807. [Google Scholar] [CrossRef] [PubMed]
- Draganic, I.G.; Draganic, Z.D. The Radiation Chemistry of Water, 1st ed.; Academic Press Inc.: New York, NY, USA, 1971. [Google Scholar]
- Richard, M.; Kirkby, K.J.; Webb, R.P.; Kirkby, N.F. Cellular automaton model of cell response to targeted radiation. Appl. Radiat. Isot. 2009, 67, 443–446. [Google Scholar] [CrossRef] [PubMed]
- Blanch, H.W.; Clark, D.S. Biochemical Engineering; Marcel Dekker: New York, NY, USA, 1997. [Google Scholar]
- Grimes, D.R.; Partridge, M. A mechanistic investigation of the oxygen fixation hypothesis and oxygen enhancement ratio. Biomed. Phys. Eng. Express 2015, 1, 045209. [Google Scholar] [CrossRef] [PubMed]
- Cussler, E.L. Diffusion: Mass Transfer in Fluid Systems, 2nd ed.; Cambridge University Press: New York, NY, USA, 1997. [Google Scholar]
- Curcio, E.; Salerno, S.; Barbieri, G.; De Bartolo, L.; Drioli, E.; Bader, A. Mass transfer and metabolic reactions in hepatocyte spheroids cultured in rotating wall gas-permeable membrane system. Biomaterials 2007, 28, 5487–5497. [Google Scholar] [CrossRef] [PubMed]
- Hrabe, J.; Hrabětová, S.; Segeth, K. A model of effective diffusion and tortuosity in the extracellular space of the brain. Biophys. J. 2004, 87, 1606–1617. [Google Scholar] [CrossRef] [PubMed] [Green Version]
- McKeown, S.R. Defining normoxia, physoxia and hypoxia in tumours—Implications for treatment response. Br. J. Radiol. 2014, 87, 1–12. [Google Scholar] [CrossRef] [Green Version]
- Skeldon, A.C.; Chaffey, G.; Lloyd, D.J.; Mohan, V.; Bradley, D.A.; Nisbet, A. Modelling and detecting tumour oxygenation levels. PLoS ONE 2012, 7, e38597. [Google Scholar] [CrossRef] [Green Version]
- Weiss, H.; Epp, E.R.; Heslin, J.M.; Ling, C.C.; Santomasso, A. Oxygen depletion in cells irradiated at ultra-high dose-rates and at conventional dose-rates. Int. J. Radiat. Biol. 1974, 26, 17–29. [Google Scholar] [CrossRef]
- Michaels, H.B. Oxygen depletion in irradiated aqueous solutions containing electron affinic hypoxic cell radiosensitizers. Int. J. Radiat. Oncol. Biol. Phys. 1986, 12, 1055–1058. [Google Scholar] [CrossRef]
- Whillans, D.W.; Rauth, A.M. An experimental and analytical study of oxygen depletion in stirred cell suspensions. Radiat. Res. 1980, 84, 97–114. [Google Scholar] [CrossRef]
- Freitas, R.A. Nanomedicine Volume 1: Basic Capabilities, 1st ed.; Landes Bioscience: Austin, TX, USA, 1999. [Google Scholar]
- Thomlinson, R.H.; Gray, L.H. The histological structure of some human lung cancers and the possible implications for radiotherapy. Br. J. Cancer 1955, 9, 539–549. [Google Scholar] [CrossRef] [PubMed] [Green Version]
- MacKay, R.; Burnet, N.; Lowe, M.; Rothwell, B.; Kirkby, N.; Kirkby, K.; Hendry, J. FLASH radiotherapy: Considerations for multibeam and hypofractionation dose delivery. Radiother. Oncol. 2021, 164, 122–127. [Google Scholar] [CrossRef] [PubMed]
- Alper, T.; Howard-Flanders, P. Role of oxygen in modifying the radiosensitivity of E. coli B. Nature 1956, 178, 978–979. [Google Scholar] [CrossRef] [PubMed]

Publisher’s Note: MDPI stays neutral with regard to jurisdictional claims in published maps and institutional affiliations. |
© 2021 by the authors. Licensee MDPI, Basel, Switzerland. This article is an open access article distributed under the terms and conditions of the Creative Commons Attribution (CC BY) license (https://creativecommons.org/licenses/by/4.0/).