Article

Balancing Performance and Portability: A Study on CsI(Tl) Crystal Sizes for Real-Time Gamma-Ray Spectrum and Dose Monitoring

Division of Sustainable Energy and Environmental Engineering, Graduate School of Engineering, Osaka University, Yamadaoka 2-1, Suita 565-0871, Osaka, Japan
*
Authors to whom correspondence should be addressed.
Radiation 2024, 4(3), 213-223; https://doi.org/10.3390/radiation4030016
Submission received: 27 May 2024 / Revised: 20 June 2024 / Accepted: 21 June 2024 / Published: 3 July 2024

Abstract

:

Simple Summary

Proper exposure monitoring of medical radiation workers is a crucial issue. This study focuses on optimizing a portable prototype monitor that provides accurate real-time gamma-ray energy spectrum and dose-rate measurements simultaneously. By comparing different sizes of CsI(Tl) scintillators, we aim to balance measurement accuracy and device portability. Our findings show that a crystal size of 2.6 × 2.6 × 1.3 cm3 offers a practical combination of detection efficiency and energy resolution while significantly reducing the overall weight and size of the monitor. This advancement marks a significant step in the development of this monitor and can also aid in the development of more efficient radiation-monitoring devices for medical radiation workers.

Abstract

Current radiation dosimeters sometimes face accuracy limitations or provide only cumulative doses over long periods. To contribute to this area, we developed a portable monitor that measures the energy spectrum and dose of gamma rays in real time. To achieve this, we used an improved sequential Bayesian estimation algorithm. The dose rate was then derived from the energy spectrum by applying a flux-to-dose conversion coefficient. The monitor consists mainly of a CsI(Tl) scintillator and a multi-pixel photon counter (MPPC). In developing this device, we focused on striking a balance between measurement accuracy, ease of use, and portability. As an essential aspect of the research, we investigated the influence of the CsI(Tl) crystal size on the performance of the monitor to determine an optimal size. This was accomplished by calculating the detection efficiency and energy resolution through experimental measurements using standard gamma-ray sources and simulations using MCNP5. Within the scope of the research, detector response functions were created for each crystal size for an energy range of 10 keV to 3 MeV. Considering an optimal balance of detection efficiency and energy resolution alongside a compact size suitable for portable applications, the crystal measuring 2.6 × 2.6 × 1.3 cm3 was deemed preferable.

1. Introduction

Radiation plays a major role in the medical field, both in diagnosis (PET, CT, X-rays, and radiopharmaceuticals) and treatment (radiation therapies) [1]. Consequently, proper solutions to measure the radiation field, training, and monitoring the exposure of patients and staff are essential [2,3,4]. Current devices can measure the dose rate or display the pulse-height distribution of gamma rays or provide a cumulative dose measurement over an extended period (1–3 months). However, there are reports regarding inaccuracies of measurements [5] and overestimations or underestimations due to calibration [6,7,8,9]. Results of evaluations like those conducted by the International Atomic Energy Agency (IAEA) have indicated that there is room for improvement in terms of accuracy, such as in the case of whole-body dosimeters [9]. Medical radiation workers sometimes misuse dosimeters or fail to wear them consistently, highlighting the need for devices that are easy to use and make their exposure apparent [10,11,12,13,14]. Improvements in radiation protection, even when doses are within acceptable limits, are necessary [15]. Additionally, the IAEA suggests increasing the use of active dosimeters because passive types are more common [14]. Increasing the understanding of medical professionals who are not knowledgeable in radiation is also highly desirable [14]. Real-time visual information regarding dose exposure has been shown to raise awareness among medical staff and help create a safer working environment [16]. Considering the above, an easy-to-use device that shows the spectrum of gamma rays and the dose received in real time can be beneficial to this aspect.
Despite their wide application, currently available radiation dosimeters have various limitations, such as measurement accuracy (dose underestimation and poor energy response at low energies below 100 keV) [5]. Underestimations of personal dose equivalents and inaccuracies in dose-rate measurements at very low or high energies are known issues [14] Radiation badges, for example, are lightweight but only measure total doses over a certain, usually month-long, period, thus providing no real-time information [17]. Larger-scale reviews have revealed issues such as insensitivity to higher than background dose rates, unstable readings, and display saturation. Some dosimeters have been deemed inadequate for use or nearly unsuitable for their intended applications [18]. Devices like NaI(Tl) survey meters can provide real-time dose rates but are not wearable. As they are calibrated to a single energy point, like the 662 keV of 137Cs, measurements of energies far from that value lead to overestimations or underestimations of the dose rate [7]. Even lighter devices (90–300 g) like the DMC 3000 or RDS 30 (Mirion Technologies, Atlanta, GA, USA) can exhibit high deviations at energies far from the usual calibration point of 0.662 MeV (137Cs). Devices capable of displaying both the pulse-height spectrum of gamma rays and the dose rate, such as the RayMon10 (Kromek, Durham, UK), typically weigh over 1 kg.
To address these issues, we designed a prototype gamma-ray spectrum and dose-rate monitor that combines the best features of both dosimeters and spectrometers. It consists of a thallium-doped cesium iodide (CsI(Tl)), a crystal, a multi-pixel photon counter (MPPC), an amplifier, and a multi-channel analyzer (MCA). In addition to using the flux-to-dose conversion coefficient for accurate dose estimations across a wide range of gamma rays, our monitor can display the unfolded (or “deconvoluted”) energy spectrum of gamma rays in real time, which is a feature that is not present in commercial monitors. Viewing the unfolded gamma-ray energy spectrum (and not just the pulse-height distribution) is helpful for the identification of different gamma-ray sources as performing the unfolding of gamma-ray spectra removes various distortions and artifacts, restoring the true spectral shape [19]. We aimed for the final configuration to be similar to a modern smartphone in terms of compactness, wearability, and weight (~250 g).
The prototype monitor was tested up to a gamma-ray energy limit of around 3 MeV, a common value for medical applications and commercial dosimeters like the RDS 30 (Mirion Technologies, Atlanta, GA, USA), Radeaglet-R (ORTEC, Oak Ridge, TN, USA), and DKG-09D (SPC Doza, Moscow, Russia) [20]. So far, we have investigated the applicability of the prototype monitor used in this study and performed detection efficiency and energy resolution investigations for crystals of sizes 3 × 3 × 3 cm3 [21] and 2.6 × 2.6 × 2.6 cm3 [7]. We have determined the detection efficiency and energy resolution, and compared the detection efficiency with simulation results using MCNP5 (Monte Carlo N-Particle transport code) [21,22]. Different types of evaluation experiments have been conducted using standard gamma-ray sources (133Ba, 137Cs, 22Na, and 60Co) and background radiation levels (0.07–0.08 μSv/h) [7]. These experiments verified the accuracy of the dose-rate results by comparing them with theoretical values. With the 2.6 × 2.6 × 2.6 cm3 crystal, dose rates from standard gamma-ray sources (137Cs, 22Na, and 60Co) could be immediately estimated. Additionally, the dose rate in background radiation conditions could be estimated in 20 s. The results also demonstrated that our measurements were more accurate compared with those obtained using a NaI survey meter. In that research, this was confirmed through comparisons with theoretical dose rates. Measurements in front of a nuclear fuel storage room (2 μSv/h) confirmed that the unfolding process could be successfully performed in real time, even in more complex environments with a continuous spectrum and various gamma-ray peaks [7]. A detailed description of the in-house programs utilized, as well as screenshots of the monitor’s display, can be found in Voulgaris et al. [23]. We are currently supporting the company EMF Japan to develop and commercialize the device.
This study focused on reducing the size and weight of the prototype monitor to enhance portability and usability and to reduce developmental costs. The results are useful for the overall development of similar devices. For scintillators like CsI(Tl), larger crystal sizes—and, by extension, a larger total volume—generally improve the detection efficiency and energy resolution of the detector [1,24,25,26,27]. Our goal was to find an optimal balance between weight, volume, and performance. We conducted experiments and simulations to calculate the detection efficiency and energy resolution and to create response functions of the monitor for various CsI(Tl) crystal sizes. Additionally, measurements of the dose rate were obtained, with a particular focus on how quickly the dose rate converged to a stable value, even in very low dose-rate (background) conditions.

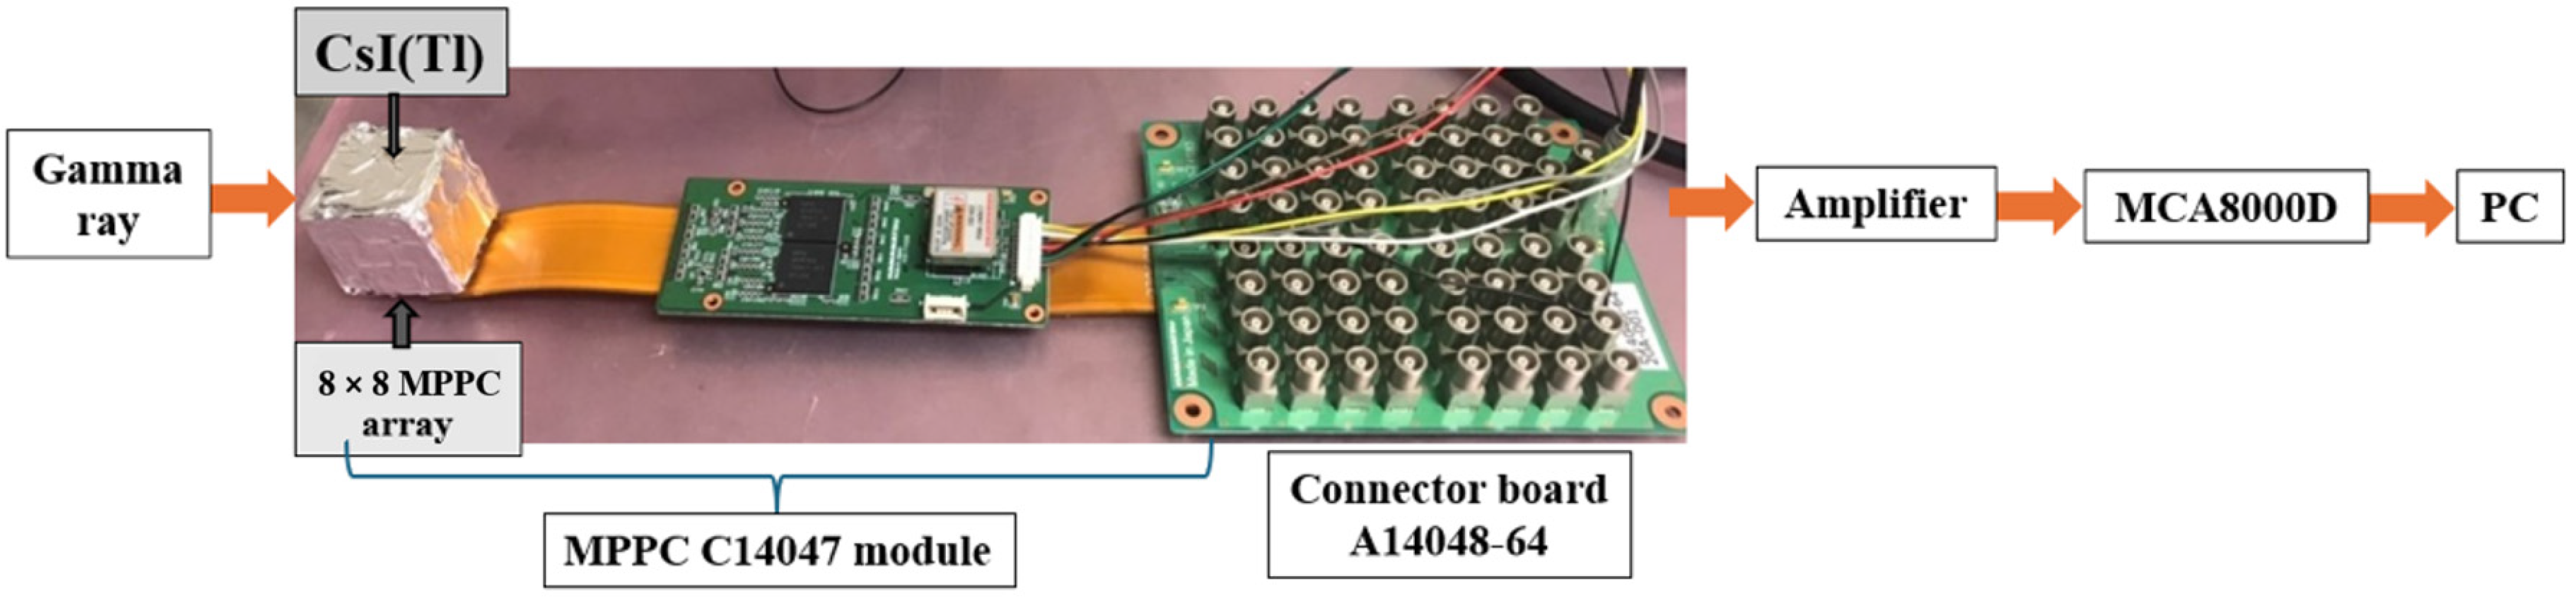
2. Materials and Methods

Scintillation detectors have been extensively characterized and tested for their mechanical properties and applications [28]. CsI(Tl), which has been thoroughly studied, was chosen for its low hygroscopicity, reliability in gamma-ray detection, and maximum emission wavelength, which makes it suitable for use with an MPPC [1,29,30,31,32]. The materials used in this study included a C14047-9956 MPPC (Hamamatsu photonics, Hamamatsu, Japan) [33], an ORTEC575A amplifier (ORTEC/AMETEK, Oak Ridge, TN, USA) [34], and an MCA8000D multi-channel analyzer (AMETEK, Oak Ridge, TN, USA) [35]. In a feasibility study by Kobayashi et al. [21], a 3 × 3 × 3 cm3 crystal was utilized. Recent research followed this with the use of a crystal 2.6 × 2.6 × 2.6 cm3 in size (80 g weight and 17.5 cm3 volume) [7,23].
To create a wearable final product, we investigated smaller crystals to reduce the size and weight. We evaluated 2.6 × 2.6 × 1.3 cm3 (39.6 g weight and 8.8 cm3 volume) and 2 × 2 × 2 cm3 (36.1 g weight and 8 cm3 volume) crystals. The weight difference between the smaller and larger crystals was significant as we intended that the final device should be similar in size to a modern smartphone and wearable, with a predicted total weight of around 250 g. Thus, it was important to investigate the performance of smaller and lighter crystals.
The protocol of covering a crystal with Teflon tape, vinyl tape, and aluminum tape is well established [26,36,37], as described by Kobayashi et al. [21] and used in subsequent research by Nishimura et al. [7]. Figure 1 shows a schematic diagram of the main components of the monitor, primarily the MPPC and CsI(Tl) crystal connection. The setup was completely shielded from ambient room light [1] with a black cloth.
In the following sections, we describe the methods of energy-spectrum and dose-rate estimations as well as the response-function creation process. Before the experiment, we examined how the detection efficiency changed with crystal thickness using Monte Carlo calculations and MCNP5. In this investigation, we calculated the full-energy peak efficiency (or simply, the peak efficiency), which only accounts for the interactions that deposit the full energy of incident radiation. It is defined as the ratio of the number of counts in the full-energy peak (photopeak), divided by the number of gamma rays emitted by the source [1,38]. Throughout this work, the pulse-height spectra of measurements were compared with those calculated using MCNP5 to ensure agreement [24].

2.1. Sequential Bayesian Estimation and Energy-Spectrum Unfolding

When gamma rays are incident on a detector crystal, they interact with the material, leading to the emission of scintillation photons. These photons are detected by the MPPC and converted into electrical signals [39]. After amplification, the signal is fed to the MCA8000D. The obtained pulse-height spectrum can then be viewed on a PC. To estimate the energy spectrum in real time from the measured pulse-height spectrum, a process known as unfolding or spectral deconvolution is performed. Unfolding can be achieved by solving the inverse problem linking the pulse-height spectrum, the energy spectrum, and the response function of the detector, as described by Equation (1) [1,7,19,40].
y i = j = 1 n R i j φ j
where y i is the pulse-height spectrum of incident gamma rays, R i j is the detector response function, and φ j is the energy spectrum of incident gamma rays.
The principle of the sequential Bayesian estimation and its application in radiation measurements have been described in detail in previous publications [7,21,23]. Our research group improved upon the existing sequential Bayesian estimation method (α method), the application of which has been established in radiation measurements by Iwasaki [41] and Nauchi et al. [42].
The posterior probability of the energy spectrum is estimated whenever a new signal is counted. The posterior probability becomes the next prior probability used in the sequential Bayesian estimation. In a normal Bayesian estimation, according to the Bayes theorem, the posterior probability is described by Equation (2).
φ j N + 1 = R i j φ j N o = 1 l R i o φ o N
where φ j N + 1 is the energy spectrum revised by the latest detected count, φ j N is the estimated energy spectrum before the last count (prior probability), and N is the count number.
As the count rate affects convergence, and the original method’s convergence of the estimation was very slow, a sequential Bayesian estimation (or α method) was developed, described by Equation (3). We made an improvement by introducing a parameter k that changed depending on the count rate, thus naming it the k-α method [7,23]. Specifically for the k-α method, the energy spectrum is derived from Equations (3) and (4).
φ j N + 1 = 1 α φ j N + α R i j φ j N o = 1 l R i o φ o N
α = 1 + k N N
where α is an index related to the effect of prior to posterior probability, φ j N + 1 is the energy spectrum revised by the latest detected count, φ j N is the estimated energy spectrum before the last count (prior probability), and N is the count number. A revision is conducted with each count (each pulse-height signal at channel i). By assigning the posterior probability as a prior probability for the new data, successive estimations are possible. With this k-α method, the energy spectrum is estimated in real time for each count during the measurement. The dose rate is then derived by applying a dose conversion coefficient to the estimated energy spectrum.

2.2. Dose-Rate Calculation

To calculate the dose rate from the estimated pulse-height spectrum, the flux-to-dose conversion coefficient is used [43]. The formula is as follows:
D = j = 1 n d j · C j S T ,
where D represents the dose rate (μSv/h), j indicates the energy bin, d j is the effective dose rate per unit fluence [(μSv/h)/( c m 2 · s 1 )] (this is the flux-to-dose conversion coefficient) [18], Cj is the number of counts in energy bin j of the spectrum, S is the surface area of the detector (cm2), and T is the measurement time (seconds). This approach allows for higher accuracy in dose-rate estimations compared with methods calibrated against a single reference point, such as 137Cs for NaI survey meters [6,7,44].

2.3. Response-Function Creation

To solve the unfolding problem and apply the sequential Bayesian estimation method, creating a response function is necessary [44,45]. The process includes the following:
  • Using MCNP5 to model the experimental setup and perform simulations to create an initial response function for the measured energies;
  • Using standard gamma-ray sources (137Cs, 22Na, and 60Co) to measure the full width at half maximum (FWHM) of energy peaks;
  • Establishing a relationship between the measured FWHM and energy peaks to calculate the standard deviation (σ) for the Gaussian distribution, modelling the detector’s energy resolution;
  • Applying the Gaussian distribution to blur (or “smear”) the MCNP5-derived response functions according to the detector’s energy resolution, accurately reflecting its response to gamma rays;
  • Verifying the adjusted response functions against actual measurements for validation, then computing the response functions across the required energy range to form a comprehensive response matrix, which is used for the real-time unfolding of the gamma-ray energy spectrum according to Equation (1).
Obtaining the response function of a detector through measurements is challenging, so Monte Carlo methods are commonly utilized for the creation of accurate response functions [46,47,48] and MCNP is one of the many established Monte Carlo methods [21,45]. The response function of a detector for monoenergetic gamma rays exhibits a Gaussian distribution with a standard deviation σ. This is a common practice in scintillation detector applications [1,48,49,50]. To simulate the response function, Monte Carlo calculations were performed using monoenergetic gamma rays up to 3 MeV. Due to electronic interference, crystal impurities, and other parameters, accurately creating the response function requires the “smearing” of the MCNP5-calculated response function, with a Gaussian distribution according to the energy resolution of the detector [1,51,52]. This process adjusts the response function to reflect the detector’s actual performance. Experimental measurements are necessary for verification.
We connected each crystal to the MPPC and performed measurements using standard sources of 137Cs, 22Na, and 60Co. The detector-to-source distance was 10 cm. From the pulse-height spectra, we obtained the FWHM of each peak of 137Cs (662 keV), 22Na (511 and 1274 keV), and 60Co (1173 and 1332 keV) as well as the relationship between H0 (median peak) and the FWHM. This relationship allowed the calculation of σ for each H0, from which the Gaussian distribution formula was derived. For verification, we compared the measurement results of the standard sources with the results of MCNP5. After confirming a good agreement between the experimental value and the calculated value, the necessary response functions from 10 keV to 3000 keV were created.
We compared the performance of the following three different crystal sizes: 2.6 × 2.6 × 2.6 cm3, 2 × 2 × 2 cm3, and 2.6 × 2.6 × 1.3 cm3. This comparison focused on the detection efficiency and energy resolution. This assessment helped us to determine the acceptable performance levels for the application and evaluated the practicality of the prototype monitor. Additionally, as portability was important, we investigated if a very small crystal could estimate the dose rate in under a minute when measuring in the lowest dose field, the background. As mentioned in Section 1, with a 2.6 × 2.6 × 2.6 cm3 crystal, the background dose was estimated in 20 s [7]. The experimental setup of the standard sources and detector for the 2.6 × 2.6 × 1.3 cm3 crystal can be seen in Figure 2.

3. Results

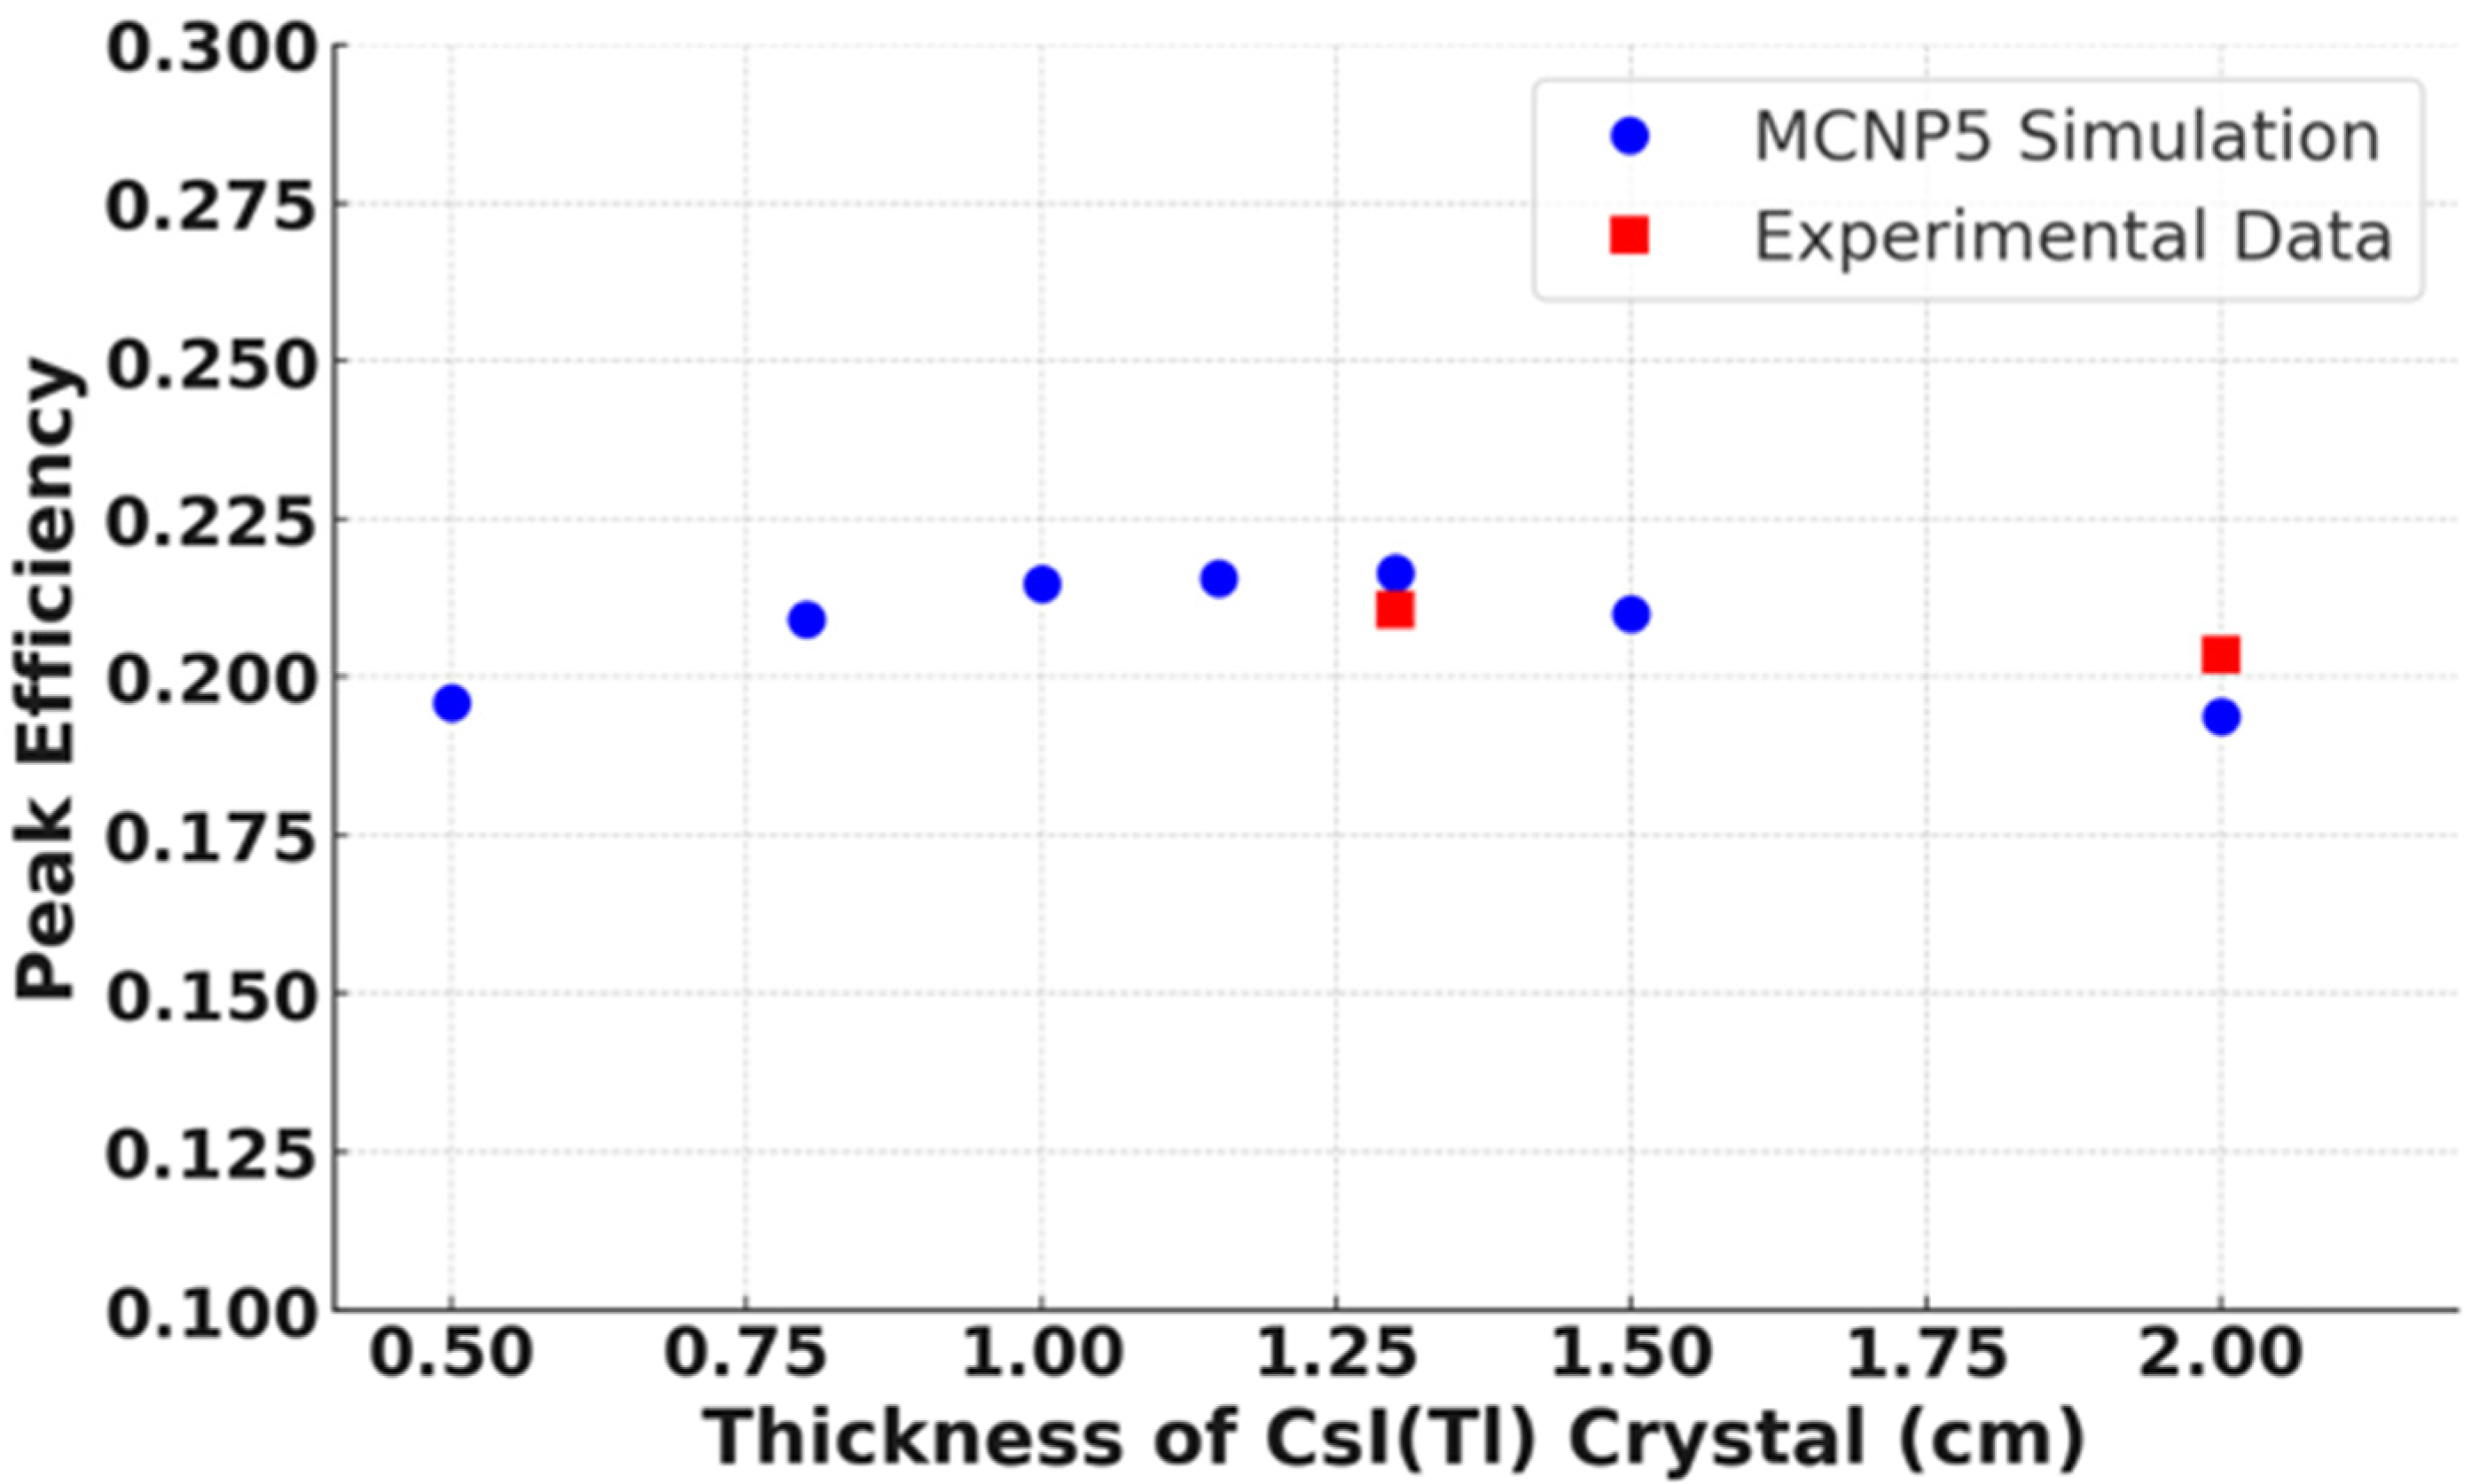
3.1. Detection Efficiency

As mentioned in Section 2, we investigated the peak efficiency, which counted the interactions forming the full-energy peak in the pulse-height spectrum. Figure 3 displays the simulation results of the peak efficiency for CsI(Tl) crystals with the same volume but varying thicknesses. For this simulation, a point source of 137Cs positioned 10 cm away from the surface of the CsI(Tl) crystals was used. The results showed that the crystals with a thickness of approximately 1–1.3 cm exhibited a slightly higher detection efficiency.

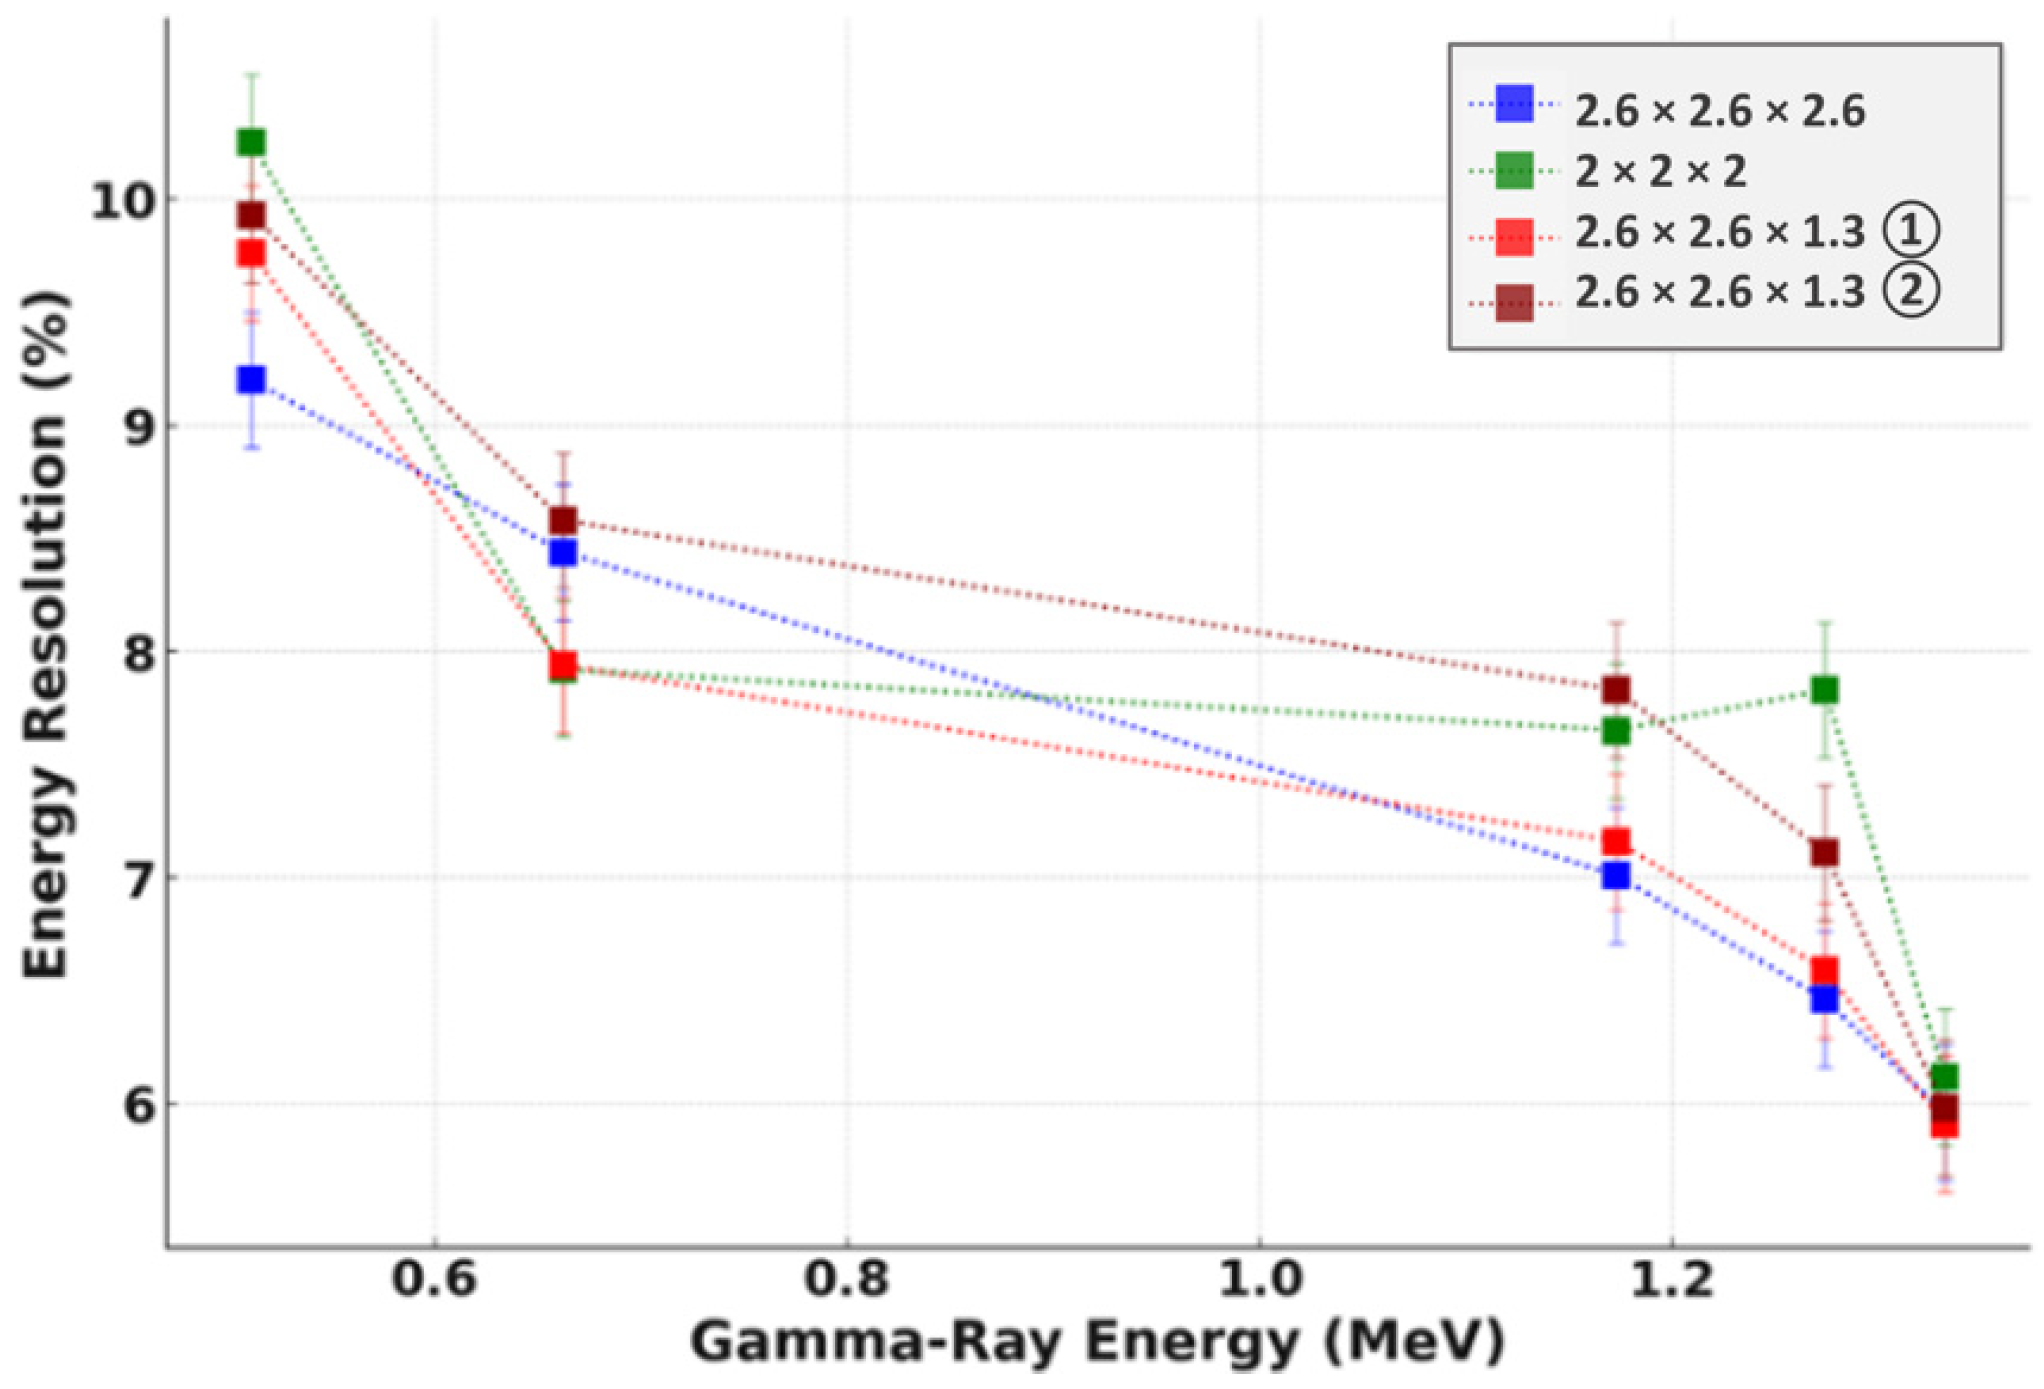
3.2. Energy Resolution

To assess the impact of the CsI(Tl) crystal dimensions on energy resolution, the results for three different sizes were compiled, as demonstrated in Figure 4. In the 2.6 × 2.6 × 1.3 cm3 crystal, the light-receiving unit of the MPPC was always mounted on the wide surface (2.6 × 2.6 cm2); ① and ② denote the gamma-ray incident surfaces (wide and thin, respectively).

3.3. Pulse-Height Spectra Comparison

Figure 5a,b show the comparison between the measured pulse-height spectra and the results calculated using MCNP5 for a 22Na source positioned 1 m from the CsI(Tl) crystal. Both figures show matching trends, particularly in the photopeaks, demonstrating good agreement.

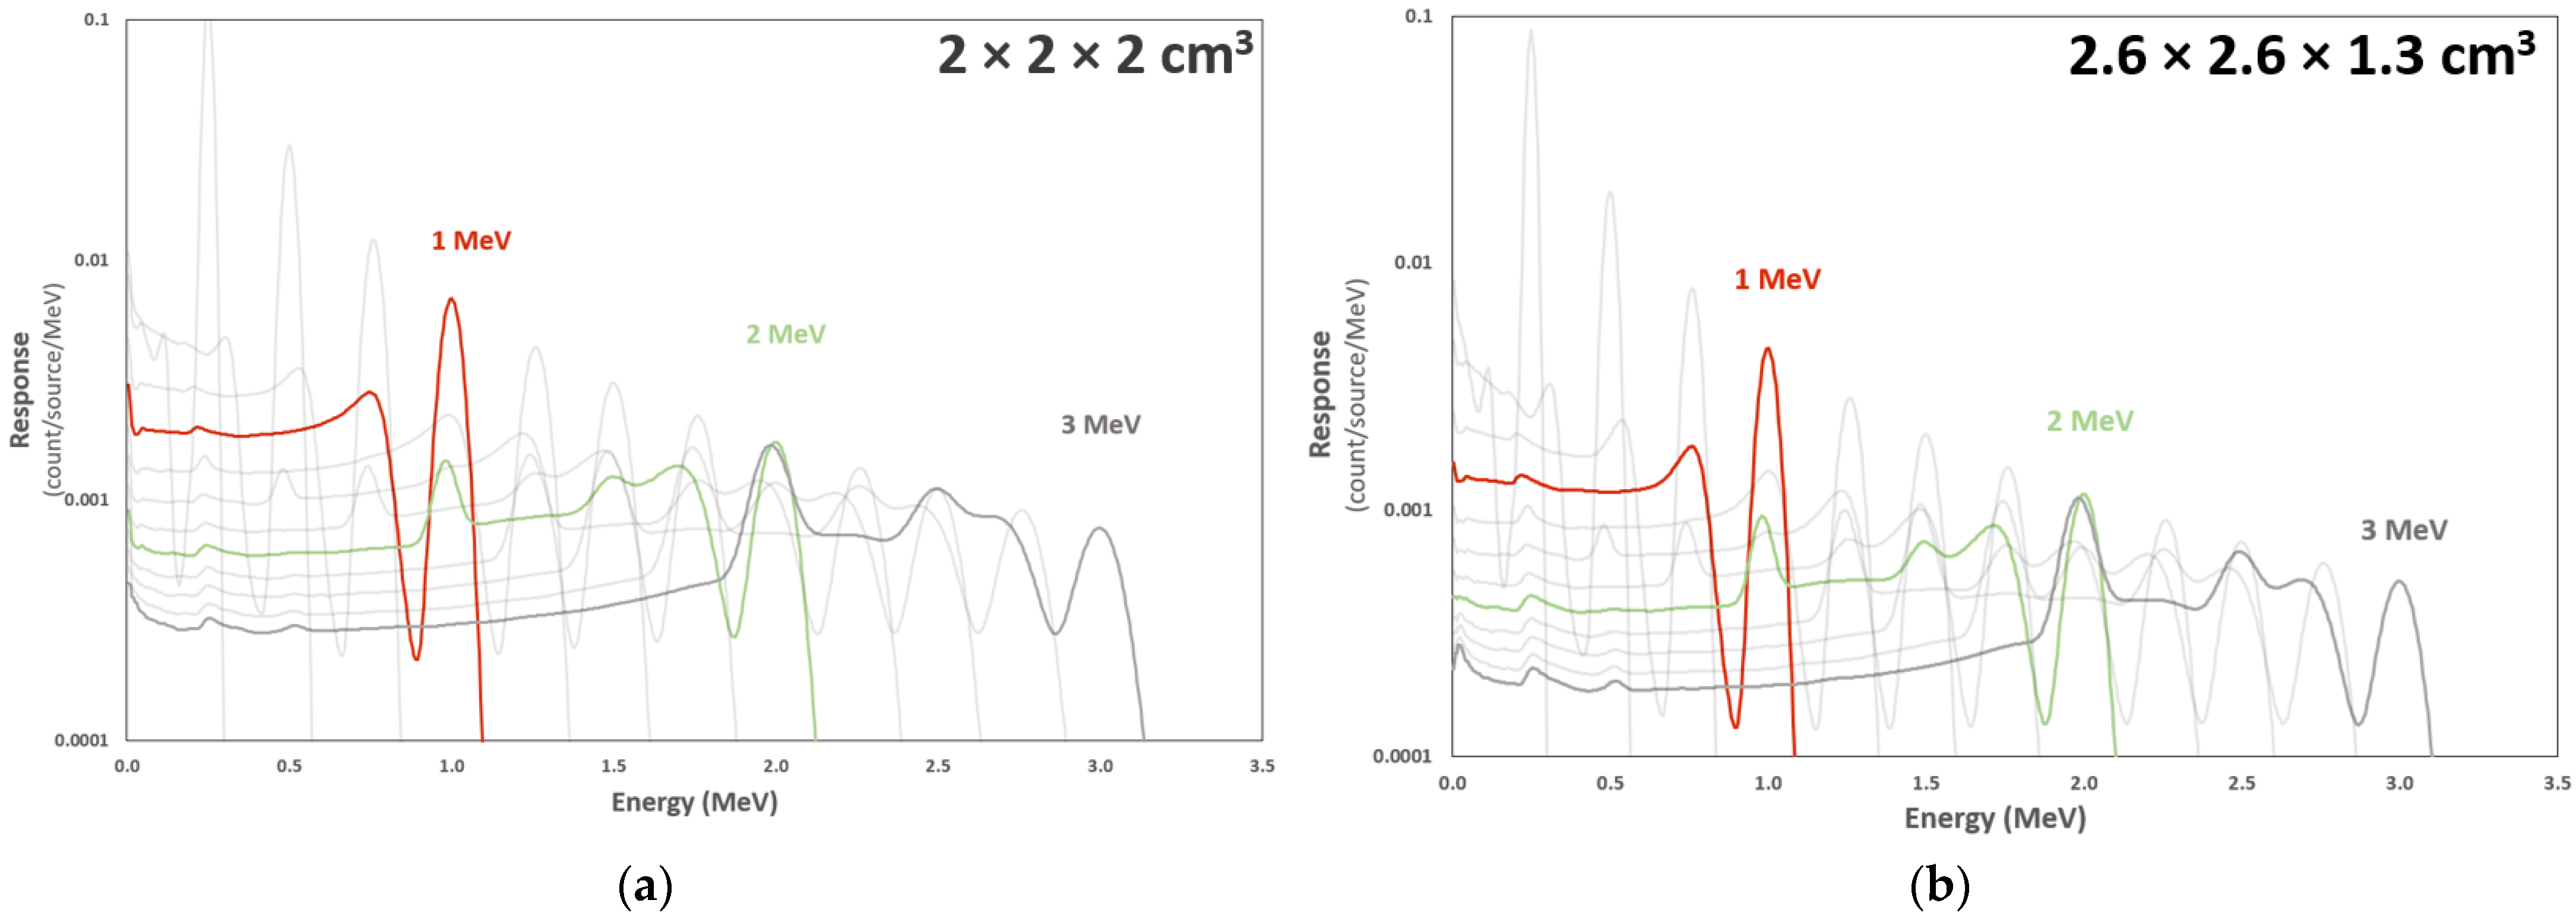
3.4. Response Functions

Following the process described in Section 2.3, we created response functions for both crystal sizes over an energy range from 10 keV up to 3 MeV. Some of the created response functions with a step of 0.5 MeV are shown in Figure 6a,b. In these figures, the response-function curves of 1, 2, and 3 MeV are highlighted to differentiate between the energy levels and make apparent how the response changed with higher energies. Specifically, the response-function curve for 1 MeV is shown in red, 2 MeV is shown in green, and 3 MeV is shown in bold grey.

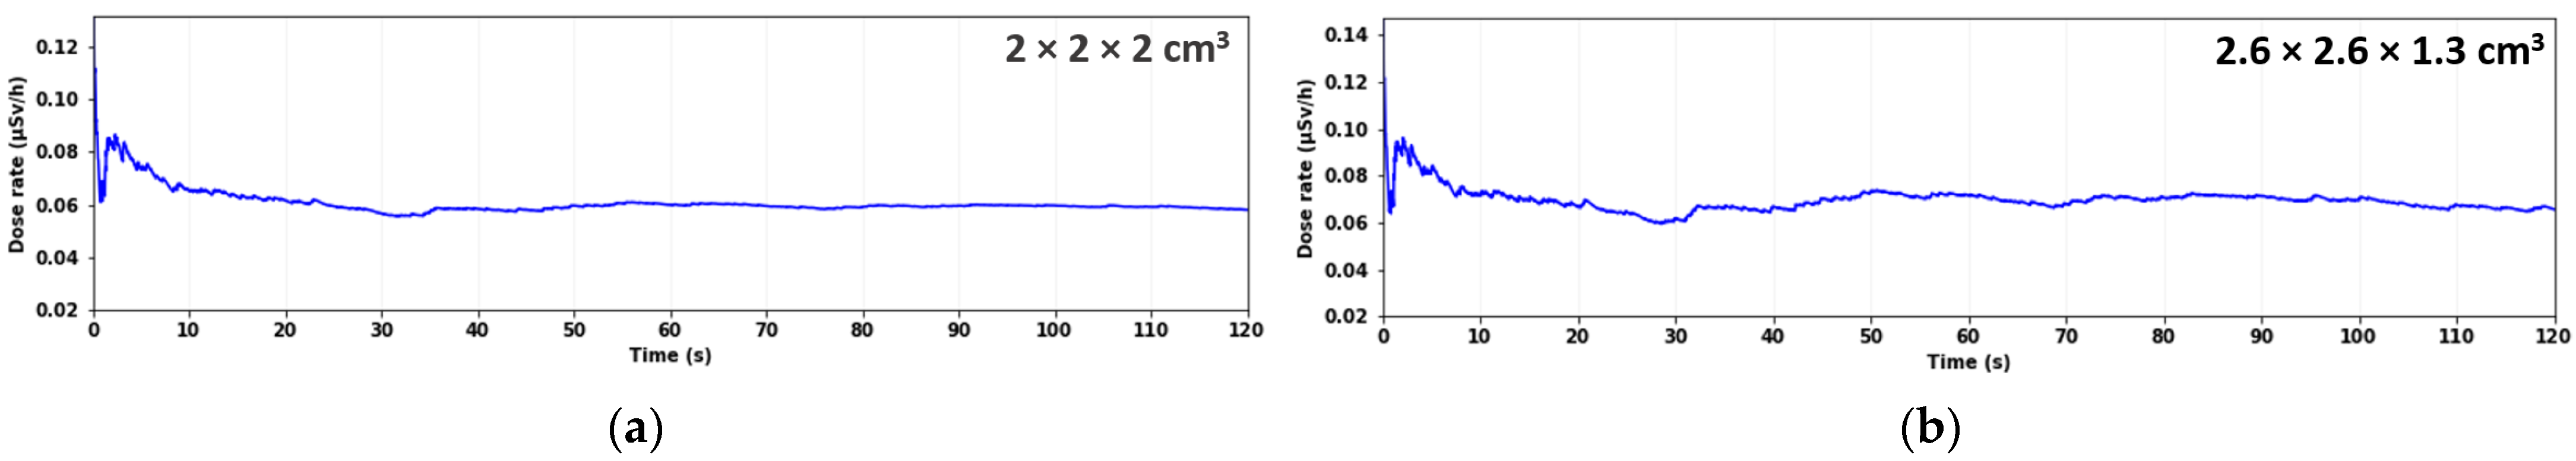
3.5. Dose-Rate Estimation in the Background

To evaluate the dose results in the lowest radiation field (background), Figure 7a,b show that accurate estimations could be achieved in just 35 s, even with crystals of half the original volume. For comparison, the dose rate with the 2.6 × 2.6 × 2.6 cm3 crystal was estimated in 20 s.

4. Discussion

This study investigated the effects of different sizes of CsI(Tl) crystals in a prototype gamma-ray monitor to enhance its portability. Response functions were created for each crystal size and the detection efficiency and energy resolution were compared across different configurations. In terms of detection efficiency, a slight improvement was observed for crystal thicknesses of around 1–1.3 cm (Figure 3). For energy resolution, using various standard sources up to 1.3 MeV, the 2.6 × 2.6 × 1.3 cm3 (with the wide gamma-ray incident surface) and the 2.6 × 2.6 × 2.6 cm3 crystals showed slightly better performances compared with the 2.6 × 2.6 × 1.3 cm3 (with the thin gamma-ray incident surface) and the 2 × 2 × 2 cm3 ones (Figure 4).
The dose rate immediately converges when measuring standard gamma-ray sources. To ensure the prototype monitor’s usability in low radiation fields such as background conditions, we evaluated its performance in these settings. With the 2.6 × 2.6 × 2.6 cm3 crystal, the dose converged in 20 s, while in both the 2 × 2 × 2 cm3 and 2.6 × 2.6 × 1.3 cm3 crystals, the dose rate converged in 35 s. This convergence time was acceptable, especially given the smaller size and nearly half the weight, which enhanced the monitor’s portability and ease of use. Specifically, the volume and weight of the smaller crystals were about half of the 2.6 × 2.6 × 2.6 cm3 crystal (17.6 cm3 and 80 g), and 8.8 cm3 and 39.6 g and 8 cm3 and 36.1 g for the 2.6 × 2.6 × 1.3 cm3 and 2 × 2 × 2 cm3 crystals, respectively.
The similar volumes of the 2.6 × 2.6 × 1.3 cm3 and 2 × 2 × 2 cm3 crystals indicated that increasing the surface area—resulting in thinner crystals due to the constant volume—shortened the distance that the scintillation light had to travel to the photodetector. This reduction in travel distance decreased the chance of photon absorption and scattering within the crystal, thereby increasing the likelihood of photons reaching the photodetector. As mentioned in Section 1, it is well established that larger scintillator crystals lead to better performance. Consequently, thinner crystals (shorter optical path) can enhance light-collection efficiency for events nearer to a photodetecting surface. Previous studies have reported light output losses in thicker crystals [53] and deteriorated timing resolutions [54]. To determine the optimal size of a CsI(Tl) crystal, it is necessary to consider the practical application of the prototype monitor, including the performance, measurable energy range, and portability.
Considering the aspects of size and weight as well as the performance evaluation results, along with a background dose-estimation time that was significantly under a minute and instantaneous for standard sources, the 2.6 × 2.6 × 1.3 cm³ crystal size was preferred. It offered superior detection efficiency and energy resolution compared with the 2 × 2 × 2 cm3 alternative while being smaller and lighter than the 2.6 × 2.6 × 2.6 cm3 one. This progress represented a major milestone in the evolution of our monitor and contributes to the creation of more effective radiation-monitoring devices for medical radiation workers. Concurrent studies have successfully completed experimental verifications at around 3 MeV. We are currently extending the prototype monitor’s application to energies up to 10 MeV and investigating performance solutions in mixed fields of neutron and gamma rays. This enables its use not only in standard medical accelerator facilities, but also in environments such as boron neutron capture therapy (BNCT) facilities, where up to 10 MeV gamma rays may be present.

Author Contributions

Conceptualization, N.V., H.N. and I.M.; methodology, N.V., H.N. and I.M.; software, N.V., H.N. and S.T.; validation, N.V., H.N., S.T. and I.M.; formal analysis, N.V. and H.N.; investigation, N.V., H.N. and I.M.; resources, S.T., S.K. and I.M.; data curation, N.V. and H.N.; writing—original draft preparation, N.V. and H.N.; writing—review and editing, N.V., S.K. and I.M.; visualization, N.V. and H.N.; supervision, I.M.; project administration, I.M. All authors have read and agreed to the published version of the manuscript.

Funding

This research received no external funding.

Institutional Review Board Statement

Not applicable.

Informed Consent Statement

Not applicable.

Data Availability Statement

The data that support the findings of this study are available from the corresponding author upon request.

Conflicts of Interest

The authors declare no conflicts of interest.

References

  1. Knoll, G.F. Radiation Detection and Measurement, 4th ed.; John Wiley: Hoboken, NJ, USA, 2010; ISBN 978-0-470-13148-0. [Google Scholar]
  2. ICRP. General Principles for the Radiation Protection of Workers, 1st ed.; ICRP Publication Radiation Protection; Pergamon Press: Oxford, UK, 1997; ISBN 978-0-08-042741-6. [Google Scholar]
  3. Tamam, N.; Salah, H.; Almogren, K.S.; Mahgoub, O.; Saeed, M.K.; Abdullah, Y.; Thanh Tai, D.; Omer, H.; Sulieman, A.; Bradley, D.A. Evaluation of Patients’ and Occupational Radiation Risk Dose during Conventional and Interventional Radiology Procedures. Radiat. Phys. Chem. 2023, 207, 110818. [Google Scholar] [CrossRef]
  4. Feng, C.-J.; Wu, C.-H.; Huang, Y.-H.; Chu, C.-H.; Lien, K.-Y.; Wang, Y.-C.; Lee, S.-H.; Hsu, S.-M. Results of the Performance Test for Quality Assessment of Personal Radiation Dosimetry Services Including the Influence of the Dosimeter Readout Frequency. Sci. Rep. 2022, 12, 20133. [Google Scholar] [CrossRef] [PubMed]
  5. Ortega, X.; Ginjaume, M. Advantages and Limitations of Electronic Devices for Primary Occupational Dosimetry. In Proceedings of the International ISOE Symposia, Tarragona, Spain, 5–7 April 2000; ISOE: Tarragona, Spain, 2000. [Google Scholar]
  6. Meier, J.; Kappadath, S.C. Characterization of the Energy Response and Backscatter Contribution for Two Electronic Personal Dosimeter Models. J. Appl. Clin. Med. Phys. 2015, 16, 423–434. [Google Scholar] [CrossRef] [PubMed]
  7. Nishimura, H.; Shinohara, M.; Miyoshi, T.; Voulgaris, N.; Kusaka, S.; Tamaki, S.; Sato, F.; Murata, I. Experimental Verification of Real-Time Gamma-Ray Energy Spectrum and Dose Monitor. Appl. Radiat. Isot. 2022, 185, 110226. [Google Scholar] [CrossRef] [PubMed]
  8. Radiation Solutions. Available online: https://www.radiationsolutionsonline.com/what-are-the-area-radiation-survey-and-radiation-survey-meter-requirements-for-fixed-gauges/ (accessed on 17 April 2024).
  9. Rizk, C.; Long, S.; Okyar, H.B.; Baradaran, S.; Al Fares, E.; Sangau, J.K.; Shah, B.R. Results of the joint Iaea/Arpansa intercomparison exercise on whole body dosemeters for photons in Asia and the Pacific Region. Radiat. Prot. Dosimetry 2019, 187, 418–425. [Google Scholar] [CrossRef] [PubMed]
  10. Qureshi, F.; Ramprasad, A.; Derylo, B. Radiation Monitoring Using Personal Dosimeter Devices in Terms of Long-Term Compliance and Creating a Culture of Safety. Cureus 2022, 14, e27999. [Google Scholar] [CrossRef] [PubMed]
  11. Lee, W.J.; Jang, E.J.; Kim, K.S.; Bang, Y.J. Underestimation of Radiation Doses by Compliance of Wearing Dosimeters among Fluoroscopically-Guided Interventional Medical Workers in Korea. Int. J. Environ. Res. Public Health 2022, 19, 8393. [Google Scholar] [CrossRef] [PubMed]
  12. Piotrowski, I.; Dawid, A.; Kulcenty, K.; Suchorska, W.M. Use of Biological Dosimetry for Monitoring Medical Workers Occupationally Exposed to Ionizing Radiation. Radiation 2021, 1, 95–115. [Google Scholar] [CrossRef]
  13. Borrego, D.; Kitahara, C.M.; Balter, S.; Yoder, C. Occupational Doses to Medical Staff Performing or Assisting with Fluoroscopically Guided Interventional Procedures. Radiology 2020, 294, 353–359. [Google Scholar] [CrossRef]
  14. International Atomic Energy Agency. Occupational Radiation Protection; Proceedings Series; International Atomic Energy Agency: Vienna, Austria, 2022; ISBN 978-92-0-122522-1. [Google Scholar]
  15. Elshami, W.; Erdemir, R.U.; Abuzaid, M.M.; Cavli, B.; Issa, B.; Tekin, H.O. Occupational Radiation Dose Assessment for Nuclear Medicine Workers in Turkey: A Comprehensive Investigation. J. King Saud Univ. Sci. 2022, 34, 102005. [Google Scholar] [CrossRef]
  16. Koch, V.; Conrades, L.M.; Gruenewald, L.D.; Eichler, K.; Martin, S.S.; Booz, C.; D’Angelo, T.; Yel, I.; Bernatz, S.; Mahmoudi, S.; et al. Reduction of Radiation Dose Using Real-time Visual Feedback Dosimetry during Angiographic Interventions. J. Appl. Clin. Med. Phys. 2023, 24, e13860. [Google Scholar] [CrossRef]
  17. Hattori, K.; Inaba, Y.; Kato, T.; Fujisawa, M.; Yasuno, H.; Yamada, A.; Haga, Y.; Suzuki, M.; Zuguchi, M.; Chida, K. Evaluation of a New Real-Time Dosimeter Sensor for Interventional Radiology Staff. Sensors 2023, 23, 512. [Google Scholar] [CrossRef]
  18. Akber, A.A.; Wiggins, M.B. A Review of Dose Rate Meters as First Responders to Ionising Radiation. J. Radiat. Prot. Res. 2019, 44, 97–102. [Google Scholar] [CrossRef]
  19. Sarzi Amadè, N.; Bettelli, M.; Zambelli, N.; Zanettini, S.; Benassi, G.; Zappettini, A. Gamma-Ray Spectral Unfolding of CdZnTe-Based Detectors Using a Genetic Algorithm. Sensors 2020, 20, 7316. [Google Scholar] [CrossRef]
  20. Buzhan, P.; Karakash, A.; Teverovskiy, Y. Silicon Photomultiplier and CsI(Tl) Scintillator in Application to Portable H*(10) Dosimeter. Nucl. Instrum. Methods Phys. Res. Sect. Accel. Spectrometers Detect. Assoc. Equip. 2018, 912, 245–247. [Google Scholar] [CrossRef]
  21. Kobayashi, M.; Sato, F.; Kusaka, S.; Murata, I. Feasibility Study on Real-Time γ-Ray Spectrum/Dose Measurement System. EPJ Web Conf. 2017, 153, 07014. [Google Scholar] [CrossRef]
  22. Brown, F.B.; Kiedrowski, B.C.; Bull, J.S. MCNP5-1.60 Release Notes; Los Alamos National Laboratory Tech. Rep; Los Alamos National Laboratory: Los Alamos, NM, USA, 2010. [Google Scholar]
  23. Voulgaris, N.; Miyoshi, T.; Tamaki, S.; Kusaka, S.; Murata, I. Development of real-time gamma-ray spectrum and dose monitor: Investigation of true real-time convergence. In Proceedings of the 37th Workshop on Radiation Detectors and Their Uses, High Energy Accelerator Research Organization (KEK). Tsukuba, Japan, 25–27 January 2023; pp. 30–42. Available online: https://www.i-repository.net/il/meta_pub/G0000128Lib_202325001 (accessed on 20 May 2024).
  24. Singh, I.; Singh, B.; Sandhu, B.S.; Sabharwal, A.D. Comparative Study for Intermediate Crystal Size of NaI(Tl) Scintillation Detector. Rev. Sci. Instrum. 2020, 91, 073105. [Google Scholar] [CrossRef] [PubMed]
  25. El Hamli, A.; Bazza, A.; Moussa, A.; Hamal, M.; Zerfaoui, M.; Ouchrif, M. Data and Simulation Studies on the Influence of Scintillation Crystal Dimensions on Spectrometric Parameters. Appl. Radiat. Isot. 2022, 181, 110053. [Google Scholar] [CrossRef] [PubMed]
  26. Wagner, A.; Tan, W.P.; Chalut, K.; Charity, R.J.; Davin, B.; Larochelle, Y.; Lennek, M.D.; Liu, T.X.; Liu, X.D.; Lynch, W.G.; et al. Energy Resolution and Energy–Light Response of CsI(Tl) Scintillators for Charged Particle Detection. Nucl. Instrum. Methods Phys. Res. Sect. Accel. Spectrometers Detect. Assoc. Equip. 2001, 456, 290–299. [Google Scholar] [CrossRef]
  27. Jeong, M.; Van, B.; Wells, B.T.; D’Aries, L.J.; Hammig, M.D. Comparison between Pixelated Scintillators: CsI(Tl), LaCl 3(Ce) and LYSO(Ce) When Coupled to a Silicon Photomultipliers Array. Nucl. Instrum. Methods Phys. Res. Sect. Accel. Spectrometers Detect. Assoc. Equip. 2018, 893, 75–83. [Google Scholar] [CrossRef]
  28. Wernick, M.N.; Aarsvold, J.N. Emission Tomography: The Fundamentals of PET and SPECT; Elsevier Academic Press: Amsterdam, The Netherlands; Boston, MA, USA, 2004; ISBN 978-0-12-744482-6. [Google Scholar]
  29. Mikhailik, V.B.; Kapustyanyk, V.; Tsybulskyi, V.; Rudyk, V.; Kraus, H. Luminescence and Scintillation Properties of CsI: A Potential Cryogenic Scintillator. Phys. Status Solidi B 2015, 252, 804–810. [Google Scholar] [CrossRef]
  30. Hawrami, R.; Ariesanti, E.; Farsoni, A.; Szydel, D.; Sabet, H. Growth and Evaluation of Improved CsI:Tl and NaI:Tl Scintillators. Crystals 2022, 12, 1517. [Google Scholar] [CrossRef]
  31. Yanagida, T. Inorganic Scintillating Materials and Scintillation Detectors. Proc. Jpn. Acad. Ser. B 2018, 94, 75–97. [Google Scholar] [CrossRef] [PubMed]
  32. Jasni, A.A.; Yap, Y.; Hashim, I.H.; Ahmad, N.E.; Ramlee, N. Two Dimensional Array of MPPC and CsI(Tl) for Radiation Monitoring Prototype. IOP Conf. Ser. Mater. Sci. Eng. 2021, 1106, 012028. [Google Scholar] [CrossRef]
  33. Hamamatsu Photonics MPPC Array Module Documentation. Available online: https://www.hamamatsu.com/jp/en/product/optical-sensors/mppc/mppc_mppc-array/related_documents.html (accessed on 20 June 2024).
  34. ORTEC/AMETEK Nuclear Instrumentation, Nuclear Analysis Software, Radiation Detectors 575A Amplifier. Available online: https://www.ortec-online.com/products/electronic-instruments/amplifiers/575a (accessed on 20 June 2024).
  35. ORTEC/AMETEK MCA8000D Multichannel Analyzer. Available online: https://www.amptek.com/products/multichannel-analyzers/mca-8000d-digital-multichannel-analyzer (accessed on 20 June 2024).
  36. Gramuglia, F.; Frasca, S.; Ripiccini, E.; Venialgo, E.; Gâté, V.; Kadiri, H.; Descharmes, N.; Turover, D.; Charbon, E.; Bruschini, C. Light Extraction Enhancement Techniques for Inorganic Scintillators. Crystals 2021, 11, 362. [Google Scholar] [CrossRef]
  37. Vincent, K.N.; Mahapatra, S.; Poddar, I.; Verma, S. Improving the Resolution and Light Yield in CsI(Tl) Scintillators. Nucl. Instrum. Methods Phys. Res. Sect. Accel. Spectrometers Detect. Assoc. Equip. 2023, 1056, 168624. [Google Scholar] [CrossRef]
  38. L’Annunziata, M.F. Handbook of Radioactivity Analysis, 2nd ed.; Academic Press: San Diego, CA, USA, 2003; ISBN 978-0-12-436603-9. [Google Scholar]
  39. Meyers, R.A. Encyclopedia of Physical Science and Technology, 3rd ed.; Academic Press: San Diego, CA, USA, 2002; ISBN 978-0-12-227410-7. [Google Scholar]
  40. Hussein, E.M.A. The Physical and Mathematical Aspects of Inverse Problems in Radiation Detection and Applications. Appl. Radiat. Isot. 2012, 70, 1131–1135. [Google Scholar] [CrossRef] [PubMed]
  41. Iwasaki, S. A New Approach for Unfolding PHA Problems Based Only on the Bayes Theorem. In Proceedings of the 9th International Symposium on Reactor Dosimetry, Prague, Czech Republic, 2–6 September 1996; Hamid, A., Bohumil, O., Eds.; American Society for Testing and Materials Euratom Working Group on Reactor Dosimetry & E.N. Society World Scientific: Prague, Czech Republic, 1996; pp. 245–252. [Google Scholar]
  42. Nauchi, Y.; Iwasaki, S. Convergence of Unfolded Spectrum with Response Function for Single Radiation Based on Bayes’ Theorem. Nucl. Instrum. Methods Phys. Res. Sect. Accel. Spectrometers Detect. Assoc. Equip. 2014, 735, 437–443. [Google Scholar] [CrossRef]
  43. ICRP. Conversion Coefficients for Use in Radiological Protection against External Radiation, 1st ed.; ICRP Publication Radiation Protection; Pergamon Press: Oxford, UK, 1997; ISBN 978-0-08-042739-3. [Google Scholar]
  44. Nuclear Regulation Authority. Method for Measurement of Environmental Gamma-Rays with a Continuous Monitor, “Environmental Radioactivity and Radiation in Japan.”; The Series of Environmental Radioactivity Measuring Methods; Radiation Monitoring Division Radiation Monitoring Department Nuclear Regulation Authority: Tokyo, Japan, 2017. [Google Scholar]
  45. Moriuchi, S.; Tsutsumi, M.; Saito, K. Construction of Response Matrices for Various Cylindrical and Spherical NaI(Tl) Scintillation Detectors for Gamma Rays and the Test Results. Jpn. J. Health Phys. 2009, 44, 122–133. [Google Scholar] [CrossRef]
  46. Wang, J.; Wang, Z.; Peeples, J.; Yu, H.; Gardner, R.P. Development of a Simple Detector Response Function Generation Program: The CEARDRFs Code. Appl. Radiat. Isot. 2012, 70, 1166–1174. [Google Scholar] [CrossRef]
  47. Hajheidari, M.T.; Safari, M.J.; Afarideh, H.; Rouhi, H. Experimental Validation of Response Function of a NaI(Tl) Detector Modeled with Monte Carlo Codes. J. Instrum. 2016, 11, P06011. [Google Scholar] [CrossRef]
  48. Mouhti, I.; Elanique, A.; Messous, M.Y.; Benahmed, A.; McFee, J.E.; Elgoub, Y.; Griffith, P. Characterization of CsI(Tl) and LYSO(Ce) Scintillator Detectors by Measurements and Monte Carlo Simulations. Appl. Radiat. Isot. 2019, 154, 108878. [Google Scholar] [CrossRef]
  49. Moszynski, M. Energy Resolution and Non-Proportionality of Scintillation Detectors. MRS Proc. 2007, 1038, 1038-O07-02. [Google Scholar] [CrossRef]
  50. Ferrulli, F.; Labalme, M.; Silari, M. Investigation of CLYC-6 for Thermal Neutron Detection and CLYC-7 for Fast Neutron Spectrometry. Nucl. Instrum. Methods Phys. Res. Sect. Accel. Spectrometers Detect. Assoc. Equip. 2022, 1029, 166460. [Google Scholar] [CrossRef]
  51. Cheng, J.-H.; Wang, Z.; Lebanowski, L.; Lin, G.-L.; Chen, S. Determination of the Total Absorption Peak in an Electromagnetic Calorimeter. Nucl. Instrum. Methods Phys. Res. Sect. Accel. Spectrometers Detect. Assoc. Equip. 2016, 827, 165–170. [Google Scholar] [CrossRef]
  52. Grozdanov, D.N.; Fedorov, N.A.; Bystritski, V.M.; Kopach, Y.N.; Ruskov, I.N.; Skoy, V.R.; Tretyakova, T.Y.; Zamyatin, N.I.; Wang, D.; Aliev, F.A.; et al. Measurement of Angular Distributions of Gamma Rays from the Inelastic Scattering of 14.1-MeV Neutrons by Carbon and Oxygen Nuclei. Phys. At. Nucl. 2018, 81, 588–594. [Google Scholar] [CrossRef]
  53. Pani, R.; Cinti, M.N.; De Notaristefani, F.; Pellegrini, R.; Bennati, P.; Betti, M.; Trotta, G.; Karimian, A.; Mattioli, M.; Garibaldi, F.; et al. Imaging Performances of LaCl/Sub 3/:Ce Scintillation Crystals in SPECT. In Proceedings of the IEEE Symposium Conference Record Nuclear Science 2004, Rome, Italy, 16–22 October 2004; IEEE: Rome, Italy, 2004; Volume 4, pp. 2283–2287. [Google Scholar]
  54. Moses, W.W.; Choong, W.-S.; Derenzo, S.E. Modeling Time Dispersion Due to Optical Path Length Differences in Scintillation Detectors. Acta Phys. Pol. B Proc. Suppl. 2014, 7, 725. [Google Scholar] [CrossRef]
Figure 1. Schematic diagram of the prototype monitor featuring a photograph of the 2.6 × 2.6 × 2.6 cm3 CsI(Tl) crystal and the connection to the MPPC array, module, and connector board.
Radiation 04 00016 g001
Figure 2. Experimental setup using the 2.6 × 2.6 × 1.3 cm3 CsI(Tl) crystal.
Radiation 04 00016 g002
Figure 3. Full-energy peak efficiency of CsI(Tl) crystals with fixed volumes and varying thicknesses. Source: 137Cs at a distance of 10 cm. Statistical error: <1%.
Radiation 04 00016 g003
Figure 4. Energy resolution by size of CsI(Tl) crystal. For the 2.6 × 2.6 × 1.3 cm3 crystal, the MPPC was mounted on the wide surface (2.6 × 2.6 cm2). ① and ② denote the incident gamma-ray surfaces (wide and thin, respectively). Sources: 137Cs, 22Na, and 60Co at a 10 cm distance.
Radiation 04 00016 g004
Figure 5. Comparison of measured pulse-height spectra of 22Na at a 1 m distance and MCNP5 simulation results for 2 × 2 × 2 cm3 (a) and 2.6 × 2.6 × 1.3 cm3 (b) CsI(Tl) crystals. Statistical error: <1%.
Radiation 04 00016 g005
Figure 6. Response functions of the prototype gamma-ray monitor up to 3 MeV using 2 × 2 × 2 cm3 (a) and 2.6 × 2.6 × 1.3 cm3 (b) CsI(Tl) crystals.
Radiation 04 00016 g006
Figure 7. Dose rate estimation results in the background (blue line) for 2 × 2 × 2 cm3 (a) and 2.6 × 2.6 × 1.3 cm3 (b) CsI(Tl) crystals. Convergence achieved around 35 s.
Radiation 04 00016 g007
Disclaimer/Publisher’s Note: The statements, opinions and data contained in all publications are solely those of the individual author(s) and contributor(s) and not of MDPI and/or the editor(s). MDPI and/or the editor(s) disclaim responsibility for any injury to people or property resulting from any ideas, methods, instructions or products referred to in the content.

