Article

Dynamic Patterns of Sex Chromosome Evolution in Neognath Birds: Many Independent Barriers to Recombination at the ATP5F1A Locus

by
Rebecca T. Kimball
* and
Edward L. Braun
*
Department of Biology, University of Florida, Gainesville, FL 32611, USA
*
Authors to whom correspondence should be addressed.
Birds 2022, 3(1), 51-70; https://doi.org/10.3390/birds3010004
Submission received: 1 December 2021 / Revised: 26 January 2022 / Accepted: 27 January 2022 / Published: 30 January 2022
(This article belongs to the Special Issue Feature Papers of Birds 2021)

Abstract

:

Simple Summary

The evolution of distinct sex chromosomes, such as the X and Y chromosomes of humans, has long been of interest. Unlike most chromosomes, sex chromosomes do not fully recombine during meiosis. The non-recombining region is typically small early in their evolution, but additional regions stop recombining over time. Avian sex chromosomes, where males are ZZ and females ZW, show several evolutionary strata. Previous studies have demonstrated variation in barriers to recombination among bird species in the youngest strata. However, previous studies have sampled relatively few avian orders. Here, we examine one locus (ATP5F1A) from species in 22 different avian orders. Our results indicate that this locus has stopped recombining in almost all orders sampled. However, our results also show that the recombination stopped independently in each order of birds, highlighting the dynamic nature of avian sex chromosome evolution. The cessation of recombination is thought to have functional consequences because it is expected to weaken natural selection. We compared the proteins encoded by the recombining Z chromosome with those on the W chromosome. Most W chromosome proteins appeared to be functional, but they also appeared to be subject to weaker selection than the Z chromosome proteins.

Abstract

Avian sex chromosomes evolved after the divergence of birds and crocodilians from their common ancestor, so they are younger than the better-studied chromosomes of mammals. It has long been recognized that there may have been several stages to the evolution of avian sex chromosomes. For example, the CHD1 undergoes recombination in paleognaths but not neognaths. Genome assemblies have suggested that there may be variation in the timing of barriers to recombination among Neognathae, but there remains little understanding of the extent of this variability. Here, we look at partial sequences of ATP5F1A, which is on the avian Z and W chromosomes. It is known that recombination of this gene has independently ceased in Galliformes, Anseriformes, and at least five neoavian orders, but whether there are other independent cessations of recombination among Neoaves is not understood. We analyzed a combination of data extracted from published chromosomal-level genomes with data collected using PCR and cloning to identify Z and W copies in 22 orders. Our results suggest that there may be at least 19 independent cessations of recombination within Neognathae, and 3 clades that may still be undergoing recombination (or have only recently ceased recombination). Analyses of ATP5F1A protein sequences revealed an increased amino acid substitution rate for W chromosome gametologs, suggesting relaxed purifying selection on the W chromosome. Supporting this hypothesis, we found that the increased substitution rate was particularly pronounced for buried residues, which are expected to be more strongly constrained by purifying selection. This highlights the dynamic nature of avian sex chromosomes, and that this level of variation among clades means they should be a good system to understand sex chromosome evolution.

1. Introduction

Sex chromosomes have evolved independently in many different organisms, including birds, which are characterized by a ZW (males ZZ and females ZW) sex determination system. More generally, there have been many different origins of partially non-recombining chromosome pairs, called XY, ZW, and UV, depending on their distribution in the sexes [1]. The general hypothesis regarding sex chromosome evolution (e.g., Rice [2] and Charlesworth et al. [3]; but see Ponnikas et al. [4], Furman et al. [5] and Jeffries et al. [6]) begins with a pair of autosomes that undergo recombination but include a sex-determining locus (Figure 1, left hand side). When a gene with a sex-specific function is gained, sexual antagonism favors a barrier to recombination. Over time, the non-recombining region may expand so a large portion of the chromosome does not undergo recombination, and thus parts of the chromosomes begin to evolve independently (Figure 1, purple segments). The gene content of sex chromosomes can be dynamic, with both losses of genes (particularly on the Y or W chromosomes [7,8]) and gains of genes [9,10]. Due to the need to pair during meiosis, there is not a complete cessation of recombination along the entire length of the chromosome. Instead, recombination continues on at least a small region, referred to as the pseudoautosomal region or PAR [11].
Birds may be an excellent group in which to study the evolution of sex chromosomes. Avian sex chromosomes are thought to have evolved largely independently of those in mammals [12,13], likely from an ancestor that had temperature-dependent sex determination [14]. Studies suggest at least four strata in the evolution of avian sex chromosomes [15,16,17]. After an initial barrier to recombination prior to the divergence of Palaeognathae and Neognathae, there was a second stage in neognaths prior to the divergence between the Galloanserae and Neoaves (reviewed in Zhou et al. [16]). This included cessation of recombination at the CHD1 (chromohelicase domain 1) locus, which is commonly used for sexing in birds [18]. This led to the origin of independently evolving CHD1-Z and CHD1-W loci that arose by the cessation of recombination, a relationship called gametology [19]. Within neognaths, examination of genes known to be present on both the Z and W chromosomes have demonstrated multiple independent barriers to recombination at the same loci across different avian clades [16,20,21,22]. That sex chromosomes among neognath birds are changing independently is further reinforced by the variable size of the W chromosome [23] and variation in the size of the PAR [16]. Furthermore, in some orders, there appear to have been the formation of a neo-sex chromosome by fusion of part of an autosome with the sex chromosomes [24,25,26,27]. Thus, avian sex chromosomes are highly dynamic and variable across taxa.
The cessation of recombination in the region surrounding any sex-linked gene should have a number of consequences. First, the rate of neutral site evolution should increase for one gametolog (either the Y or Z, depending on the sex chromosome system) due to the “male-driven molecular evolution” effect, in which the larger number of cell divisions in the male germ line leads to a larger number of mutations and, consequently, a larger number of neutral substitutions [28]. Second, the fast-X/Z effect reflects the increased efficiency of selection for beneficial recessive substitutions when the sex chromosome is in a hemizygous state [29,30], which should lead to increased non-synonymous substitutions on the X or Z chromosome. However, there is evidence both for increased positive selection and for increased negative selection on the human X chromosome [31], and it seems reasonable to expect this to be the case for avian Z chromosomes as well. There is also evidence that drift plays a major role in avian Z chromosome evolution [32] due to the reduced effective population size of the Z chromosome relative to autosomes. The consequences for the W chromosome are likely to be driven by the absence of recombination and reduced efficiency of selection (see Charlesworth and Charlesworth [7] for a description of this effect on Y chromosomes). In fact, the linkages of the W chromosome and mitogenome in birds are likely to further exacerbate this effect [33,34,35,36]. The relaxed purifying selection of W-linked loci is likely to lead to an elevated rate of non-synonymous changes [37], especially classes of non-synonymous substitutions that are likely to be deleterious, and it may also be correlated with the accumulation of transposable elements and other repetitive DNA [17,36,38,39].
One sex-linked locus that has been the focus of several studies is ATP5F1A (also known as ATP5A1), which encodes the α subunit of the mitochondrial ATPase [40]. This locus is in the youngest of the four identified evolutionary strata in avian sex chromosomes (e.g., Nam and Ellegren [15], Zhou et al. [16], and Xu et al. [17]), which is the stratum closest to the PAR. Carmichael et al. [41] identified at least three independent cessations of recombination at the avian ATP5F1A locus—one in each of the three orders included in their study (Galliformes, Anseriformes and Charadriiformes). Suh et al. [22] built on that study, identifying three additional orders that had independently ceased recombining at this locus (Podicipediformes, Ciconiiformes and Passeriformes). That many different avian groups are undergoing independent trajectories in sex chromosome evolution is supported by data suggesting that the PAR is quite variable in size among species [16]. In addition, the size of the W chromosome is also quite variable, even among relatively closely related species (e.g., Takagi and Sasaki [42] and Belterman and de Boer [43]), and appears to have changed in distinct ways across taxa [44,45].
However, understanding these processes can be challenging. Studies such as those by Carmichael et al. [41] and Suh et al. [22] used PCR amplification in females to isolate loci of interest, followed by cloning to obtain each gametolog. However, this may be misleading due to several possible problems. First, there may be biases in amplification (e.g., amplifying one gametolog but not the other), cloning (both gametologs amplified but only one gametolog is cloned) or sequencing (both gametologs cloned, but clones of only one gametolog are sequenced). This could lead to assumptions that some taxa are recombining (since only one gametolog identified) when that may not be correct. Since PCR amplification and cloning can result in erroneous differences among amplicons [46], which are fixed in clones, identifying what differences may be due to error versus substitutions that differentiate gametologs can be hard to sort out.
Alternatively, data can be extracted from whole-genome sequences from heterogametic individuals (e.g., females in birds). However, in these cases, coverage of the sex chromosomes is half that of the autosomes, meaning that the quality of assembly is lower for these chromosomes. In addition, W chromosomes appear to accumulate high levels of repetitive DNA [36,39], which can further confound assembly. For example, in the whole-genome study of Zhou et al. [16], genomes of six neognathous birds were examined for presence of 14 loci hypothesized to be on the W chromosome (see Table S3 in Zhou et al. [16]). They only identified 10% of loci expected to be on the avian W chromosome across the six samples (8 loci were present of 84 possible). Thus, while using whole genomes should in theory be a better strategy for understanding sex chromosome evolution, many challenges still remain.
High-quality, chromosome-level genome assemblies (e.g., Peona et al. [47]) for female individuals are likely to provide sufficient information to examine the evolution of Z- and W-linked loci in detail [48]. At this point, there are very few assemblies of this quality, so it is likely to be necessary to combine genomic data with PCR data. Here, we focused on the ATP5F1A locus to gain greater insights into its evolution across birds. We used a combination of traditional PCR and cloning, and also extracted data from chromosomal-level assemblies. Using data from 49 species representing 22 avian orders allowed us to better assess the number of independent barriers to recombination at the ATP5F1A locus. Because the cessation of recombination is expected to lead to different selective pressures on proteins encoded on the Z and W chromosomes, we complemented this analysis by examining the molecular evolution of ATP5A1Z and ATP5A1W protein sequences from 13 taxa with genome assemblies and annotations of sufficient quality. Finally, we discuss some insights into the sources of errors and the effectiveness of each method for studying sex chromosome evolution that were revealed by our combined approach.

2. Materials and Methods

2.1. DNA Extraction, PCR Amplification, Cloning and Sequencing

For our initial sampling, we used frozen tissues from 31 avian species in 20 orders, based on the IOC world bird list v. 11.2 [49]. No live birds were collected or sampled for this research (see Supplementary File S1 for sample information including museum voucher numbers). DNA extraction was performed using the Gentra Puregene Kit (Qiagen, Hilden, Germany) following manufacturer’s protocols. Samples were identified as female on a museum tag and/or must have been identified as female by amplification of CHD1 [18]. Only samples that were clearly genetically female were given further consideration.
PCR amplification of ATP5F1A intron 3 was performed using primers ATP5A1_208mod (5′ GTCCAAGCAGAAGAAATGGTTGA 3′; modified from Carmichael et al. [41] and ATP5A1_ex4R (5′ AACTAGAACATCCACAATGGCACC 3′). PCR products were cleaned using an equal volume of PEG:NaCl (20%:2.5 M) for precipitation, followed by washing with 70% EtOH. Cloning was performed using pGEM-T-Easy vector (Promega Corp., Madison, WI, USA), and clones were screened using PCR amplification of whole cells with universal primers (T7 and SP6). After screening, PCR products from clones with appropriate inserts were cleaned using a PEG-NaCl precipitation [50]. To be 95% certain that both gametologs (or alleles, if not recombining) were sampled (assuming both gametologs were amplified and cloned in equal frequencies), a minimum of 5 clones should be sampled, so we targeted multiple plasmids per sample.
Sequencing was performed using ABI BigDye Terminator 3.1. Manufacturer’s recommendations were followed, except that reaction volumes were cut to ¼–⅙ of recommended reagent volume. Sequences were analyzed on an ABI Prism 3100-Avant genetic analyzer (PE Applied Biosystems). Sequencing was initially performed using universal primers (SP6 and T7). In some cases, internal primers were designed for specific taxa and used for sequencing to result in double-stranded sequencing.
Sequences were trimmed of vector, and examined by eye in Sequencher™ 4.1 (Gene Codes Corp. Ann Arbor, MI, USA). Care was taken to assess when two distinct gametologs might be present. In cases where there were two divergent sets of sequences for a species, these were split into two separate contigs for assembly. In cases where there were not two clear gametologs, a challenge was to assess whether differences among sequences represented PCR error or might represent different, possibly recombining, alleles. To be retained in our dataset, we required at least two differences be identified, and that each of those differences had to be present in at least two clones. We felt that most PCR errors would likely be in a single sequenced amplicon, and the differences present in two amplicons were more likely to represent biological differences. This may have led to the exclusion of data for species still undergoing recombination at this locus, and where we sampled a homozygous individual (or where there was only a single difference between alleles). However, we felt that falsely inferring recombination was worse than reducing the number of species sampled. Since this approach did not allow determination of whether a gametolog was the Z or W version, we labeled the two variants with A and B.

2.2. Extraction of Data from Genome Assemblies

To identify genomes with assemblies of the W chromosome, we used the NCBI Genome Browser and restricted consideration to those genomes that included the number of assembled chromosomes available on 30 August 2021. Of the 59 chromosomal-level assemblies, only 33 included an assembly of the W chromosome. For each of these 33 genomes (see Supplementary File S2), we identified the region of interest using genome BLAST (blastn). Our BLAST query was the chicken (Gallus gallus) Z chromosome segment that included exons 3 and 4, plus the intervening intron 3 of the ATP5F1A gene. The flanking exons were used as they were expected to be conserved between both gametologs, and so maximized identification of the appropriate regions. We only retained data in which the BLAST results included two good hits that covered most or all of intron 3. We labeled these sequences as being Z, W or unplaced based on the BLAST results.
To obtain protein sequences, we conducted tblastn searches of the genomes identified for intron 3. For landbirds, we used Zebra Finch (Taeniopygia guttata) ATP5F1AW sequence as the query, while for non-landbirds we used the chicken ATP5F1AW sequence. From the GenBank record identified using tblastn, we identified the protein accession and obtained the sequence for both the Z and W copies. Based on the existence of two in-frame stop codons and a frameshift, Budgerigar (Melopsittacus undulatus) ATP5F1AW sequence appears to be a pseudogene (similar to several other parrots [51]). Therefore, we adjusted the inferred amino acid sequence in the alignment, recoding the stop codons as ambiguous (X). In a number of cases, the genome assemblies lacked annotations, and so we did not obtain the protein sequences for those taxa.

2.3. Identification of Transposable Element Insertions

All sequences were submitted to the RepBase database using the CENSOR tool [52] to identify long transposable element (TE) insertions. Since long insertions in one or a few taxa can make alignment challenging, we used the output from CENSOR to identify boundaries and then excluded the TE insertions from our analyzed data. We noted where and when this occurred to explore and understand the frequency and distribution of TE insertions.

2.4. Sequence Alignment and Phylogenetic Analyses

We combined our intron data (PCR-amplified and from genomes) with published ATP5F1A sequences from Carmichael et al. [41] and Suh et al. [22]. The Abyssinian Ground Hornbill (Bucorvus abyssinicus) was sampled both by our PCR approach as well as from a whole genome. These were aligned in Mafft v. 7, using the online server [53]. The final alignment was trimmed to just include the intron 3 region (see Supplementary File S3 for the alignment). This was analyzed in IQ-TREE 1.6.12 [54] as implemented in the W-IQ-TREE web server [55]. For this, we had IQ-TREE identify the best-fitting model [56], allowing free rate models, and then estimated the maximum likelihood tree and 1000 ultrafast bootstrap replicates [57].
For the amino acid data, we aligned sequences as we had done for the nucleotides (see Supplementary File S4 for the alignment). Using the alignment, we evaluated the fit of three model sets to the aligned ATP5F1A protein sequences: (1) the models included in IQ-TREE; (2) the clade-specific models described by Pandey and Braun [58] and Minh et al. [59]; and (3) the clade-specific structural mixture models described by Pandey and Braun [58]. We used the fit_XBmixture_models.pl program, available from github (https://github.com/ebraun68/clade_specific_prot_models; accessed on 24 November 2021) to evaluate the fit of the clade-specific structural mixture models. In all cases, we used the corrected Akaike information criterion (AICc) to evaluate model fit. As described above, we conducted the tree searches and used 1000 ultrafast bootstrap replicates to assess support. We divided sites into solvent exposed and buried subsets using the site mixture probabilities (obtained using the -wspm option); sites where the contribution of the buried mixture class was >0.5 were classified as buried and those with ≤0.5 were classified as solvent exposed. We used PAUP* 4.0a169 [60] to count numbers of amino acid substitutions using the maximum parsimony (using ACCTRAN [61] reconstructions to assign changes to specific branches).

2.5. Expectations

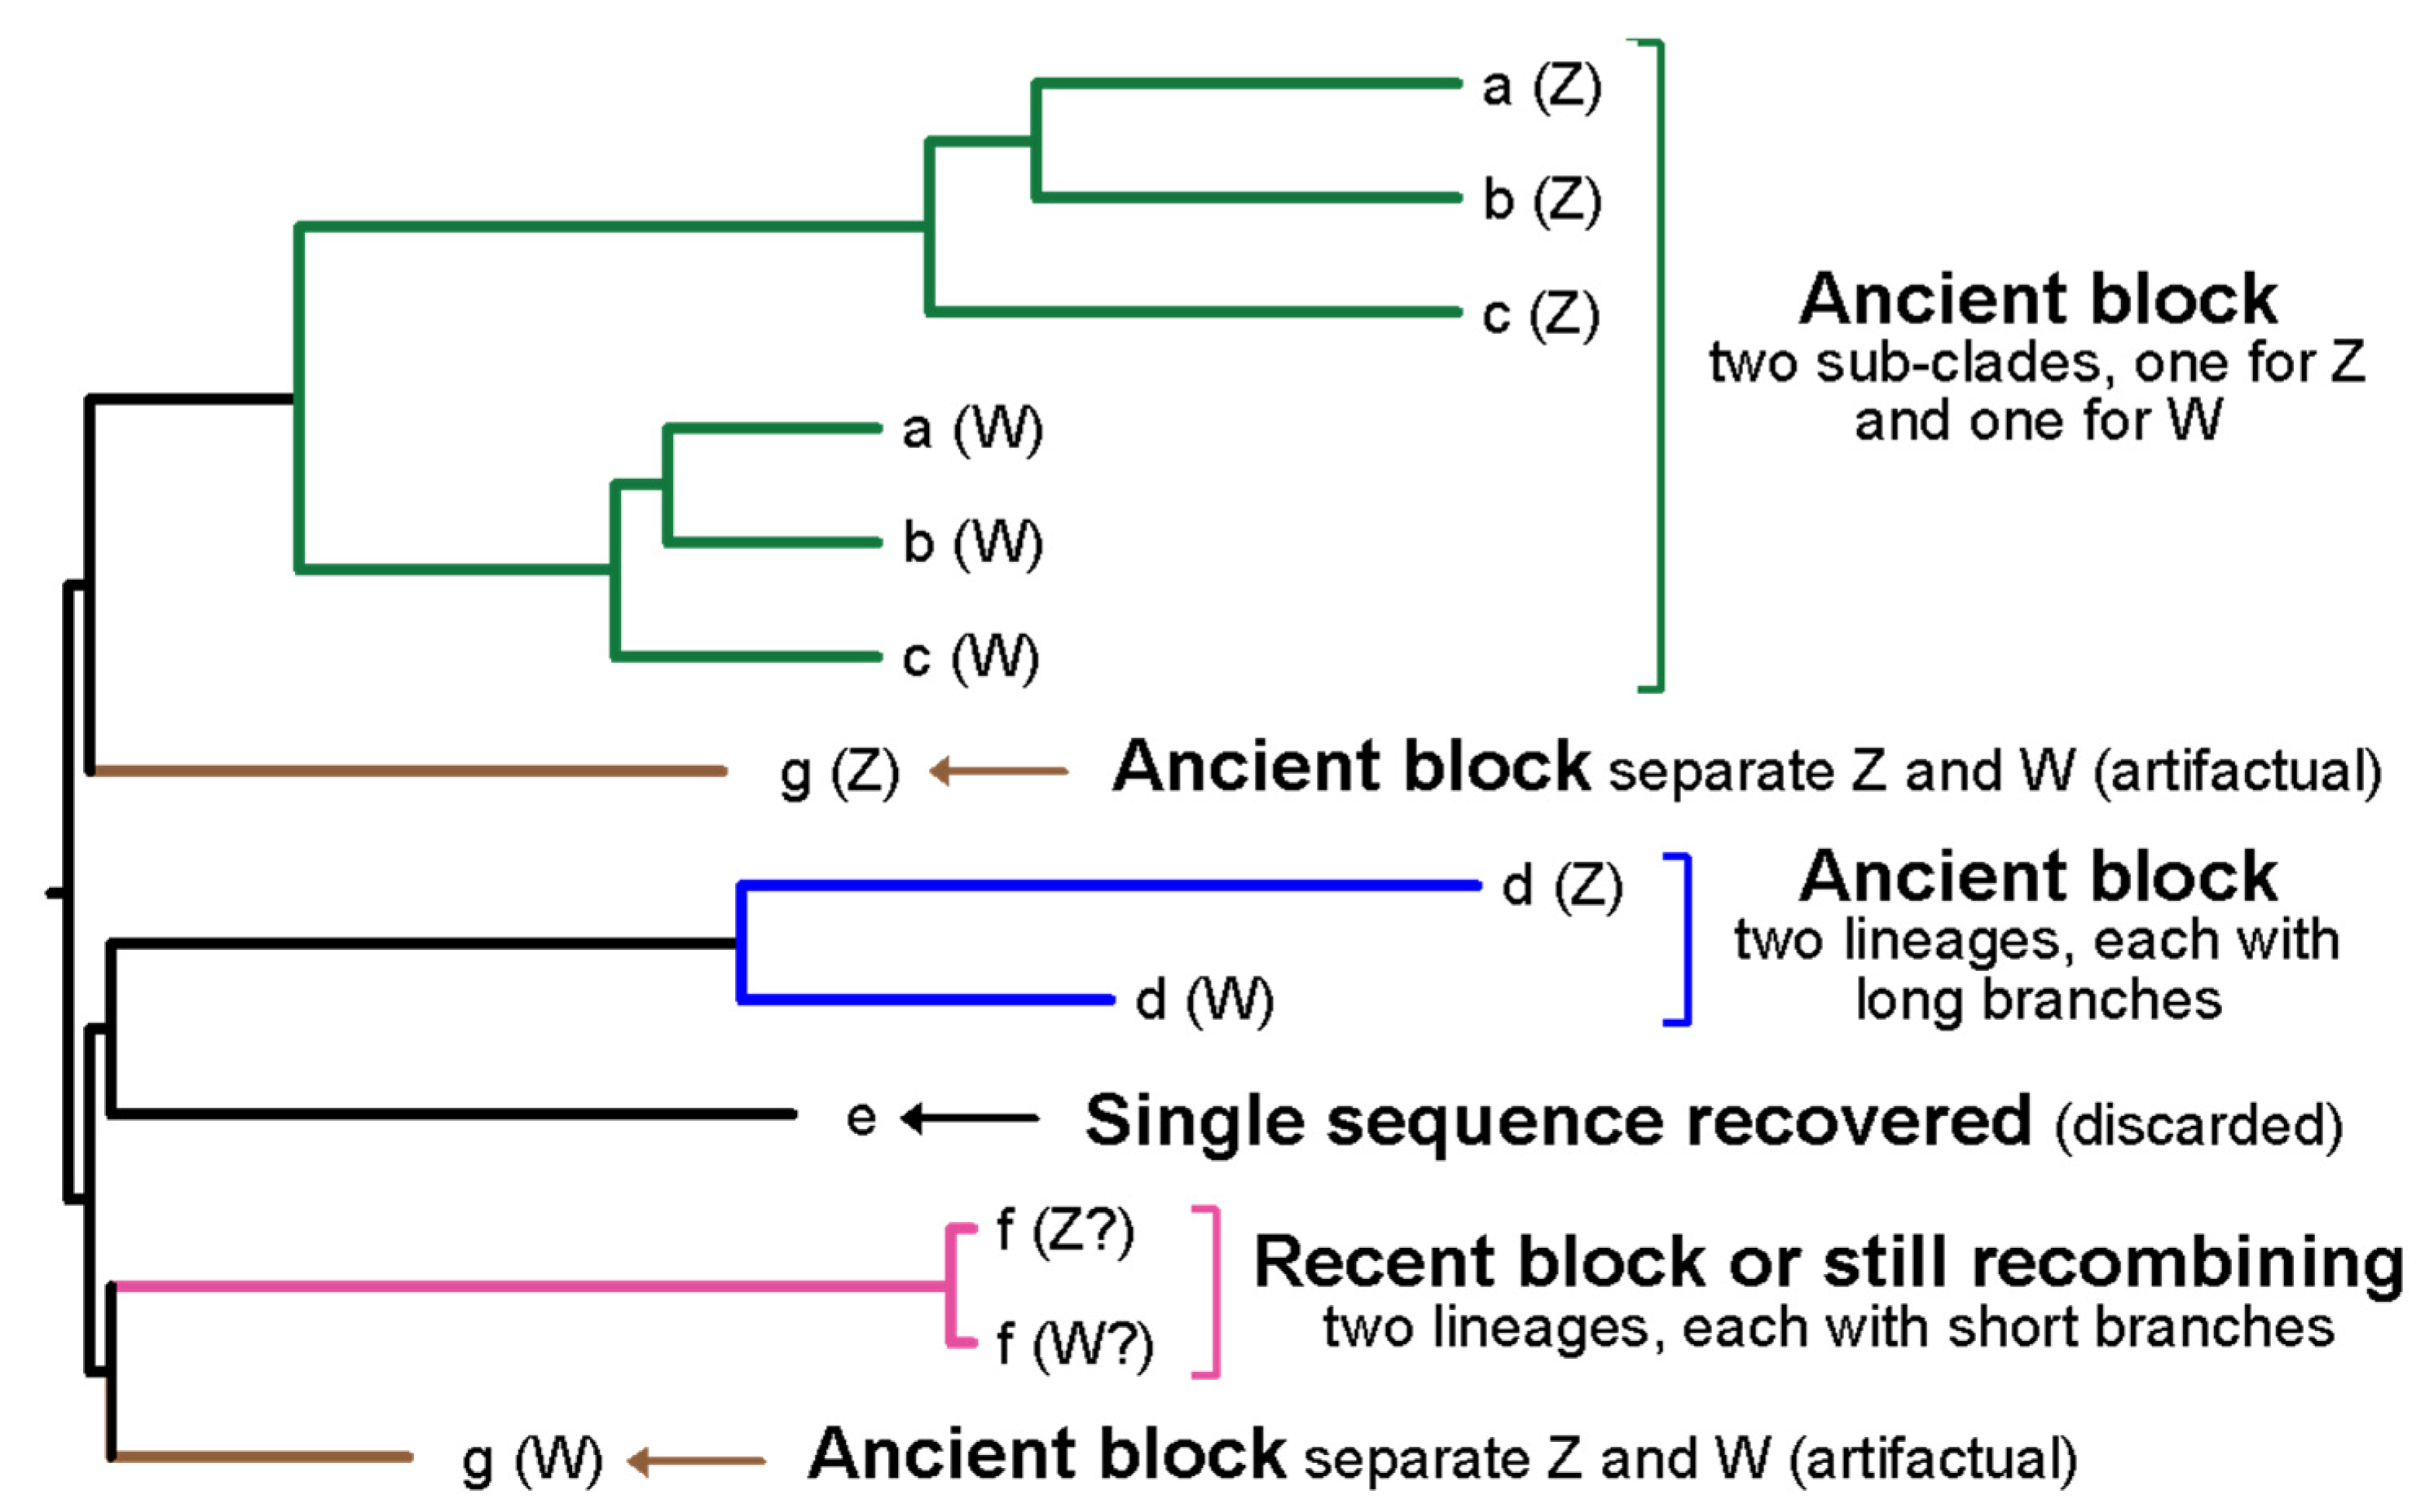
Phylogenetic analyses of the sequence data should allow identification of likely barriers to recombination (Figure 2). Several different patterns represent evidence for ancient barriers to recombination. First, cases where the same gametolog from multiple species cluster together to the exclusion of the second gametolog (green clade in Figure 2) suggest that the barrier to recombination occurred prior to divergence of those taxa. Depending on the taxa sampled it might be possible for a deep divergence to be limited to the two gametologs of the same species (blue clade in Figure 2). Due to the relatively short sequence for intron 3 of ATP5F1A (under 1 kb), it may be expected that, in some cases, the phylogenetic tree obtained using the ATP5F1A sequences may not have the power to recover relationships among avian orders that reflect likely divergence patterns among orders within Neoaves [62]. However, if we observe the gametologs of the same species in very different positions (e.g., brown branches in Figure 2), this would also reflect a case where there is an ancient barrier to recombination.
In contrast to the case for ancient barriers to recombination, it is difficult to distinguish between recent barriers to recombination and cases where recombination is occurring, because they are expected to result in few differences between gametologs (pink clade, Figure 2). Suh et al. [22] concluded that recombination had ceased in Turkey Vulture (Cathartes aura) and Great Crested Grebe (Podiceps cristatus). Based on our p-distances, we estimate that the differences between gametologs for these two taxa were 0.015 and 0.005. Given this, we decided to classify any gametologs with a p-distance of at least 0.005 as having ceased recombining, and values below this as cases of ongoing recombination. In principle, cases where only a single sequence was obtained (rather than two gametologs or alleles, sequence e in Figure 2) could reflect continued recombination or even a very recent barrier to recombination. However, they can also reflect failure to amplify one of the two gametologs. Therefore, we discarded those sequences (see above).
Since we examined ATP5F1A intronic sequences, we expect them to behave in a manner consistent with male-driven molecular evolution (i.e., the Z chromosome gametologs will typically have longer branches; Figure 2). Although the introns in the W chromosome gametologs are expected to exhibit fewer substitutions, they are also expected to harbor a larger number of transposable element insertions [17,36,39].
In contrast to the intronic sequences, coding sequences are expected to exhibit a distinct set of patterns. Coding regions in recombining regions such as the PAR or Z chromosome are likely to be subject to relatively strong purifying selection and, therefore, trees generated with those sequences are likely to have shorter branches when the lengths are measured in amino acid substitutions. On the other hand, coding sequences in non-recombining regions of the W chromosome, are expected to exhibit evidence of relaxed purifying selection, likely due to Hill–Robertson interference [63] involving other W-linked loci and/or the mitogenome [33,34,35,36]. In the extreme, this might lead to pseudogenization and/or complete loss of W-linked coding regions. However, even if the gene remains functional, the simplest expectation is a higher rate of non-synonymous substitution for W gametologs (e.g., Berlin and Ellegren [37]), although the signature might be more subtle (i.e., a higher proportion of non-synonymous substitutions that are likely to reduce fitness). Sassi et al. [64] reported that comparing numbers of amino acid substitutions in buried versus solvent exposed structural environments was a very sensitive way to differentiate between pseudogenes and functional genes; we propose that this metric can serve as a way to assess the relaxation of purifying selection on the W chromosome.

3. Results

3.1. Success in Identifying Both Gametologs

We obtained between 4 and 15 clones for 31 species (all but one species was sampled for at least 5 clones), with an average of 8.9 clones per species (Supplementary File S1). We could clearly identify two gametologs or alleles in only 17 species (Table 1). Species where two gametologs were identified were sampled at about the same level (an average of 9.2 clones per species, with a range of 4–15) as those where only one gametolog was clearly identified (an average of 8.7 clones, with a range of 5–15).
For the sequences obtained from genomes, we found two good hits in 25 of 32 (Table 1) genomes with an assembly of the W chromosome (Supplementary File S2). For 21 of these 25, BLAST identified a match on both the Z and W chromosomes. In five cases the match was to the Z chromosome and an unplaced scaffold, while in one case both sequences were identified as unplaced. In other cases, either there were no matches (two cases), or a match to one chromosome (three cases) or where too little data were present for one gametolog to include in analyses (one case).
The novel data we collected using PCR and cloning were congruent with data extracted from genomes. For example, for the Abyssinian Ground Hornbill, where data were obtained using both methods (PCR/cloning as well as extracted from a genome), the sequences were virtually identical. In other cases, where sampling included taxa that were related, our data clustered as expected with genome data. Thus, it appears that both methods (once potentially problematic samples were excluded) yielded biologically relevant data.

3.2. Transposable Elements

For the sequences we obtained via PCR, there were no TE insertions in any samples. For the genomes, there were TE insertions in eight sequences (Figure 3). One TE insertion was shared among the W-chromosome sequence of three duck species (Ruddy Duck [Oxyura jamaicensis], Freckled Duck [Stictonetta naevosa], and Black-headed Duck [Heteronetta atricapilla]). The other five sequences were from unrelated taxa and none of the TE insertions were shared. Of these five sequences, four were W-chromosome sequences (Great Potoo [Nyctibius grandis], Kakapo [Strigops habroptila], Monk Parakeet [Myiopsitta monachus], Lance-tailed Manakin [Chiroxiphia lanceolata]) and just one was a Z-chromosome sequence (European Nightjar [Caprimulgus europaeus]). In some cases, multiple TE insertions were present in the same sequence (the Monk Parakeet had four TE insertions on the W chromosome (this species is known to be rich in repetitive sequences [65]), one of which prevented identification of the 3′ end of the intron).

3.3. Barriers to Recombination

Phylogenetic analyses of the ATP5F1A intron yielded a tree consistent with reciprocal monophyly of Galloanserae and Neognathae (Figure 3). Moreover, many orders that had multiple samples were recovered as monophyletic. However, a few orders (e.g., Apodiformes and Bucerotiformes) were not recovered as monophyletic. This is likely to reflect the fact that a single, relatively short segment of DNA is expected to fail to recover expected relationships in many cases [62]. However, the tree topology was able to provide information that was sufficient to identify the positions of barriers to recombination. The estimated phylogenetic tree makes it clear that there were a large number of independent barriers to recombination across Neognathae (Figure 3).
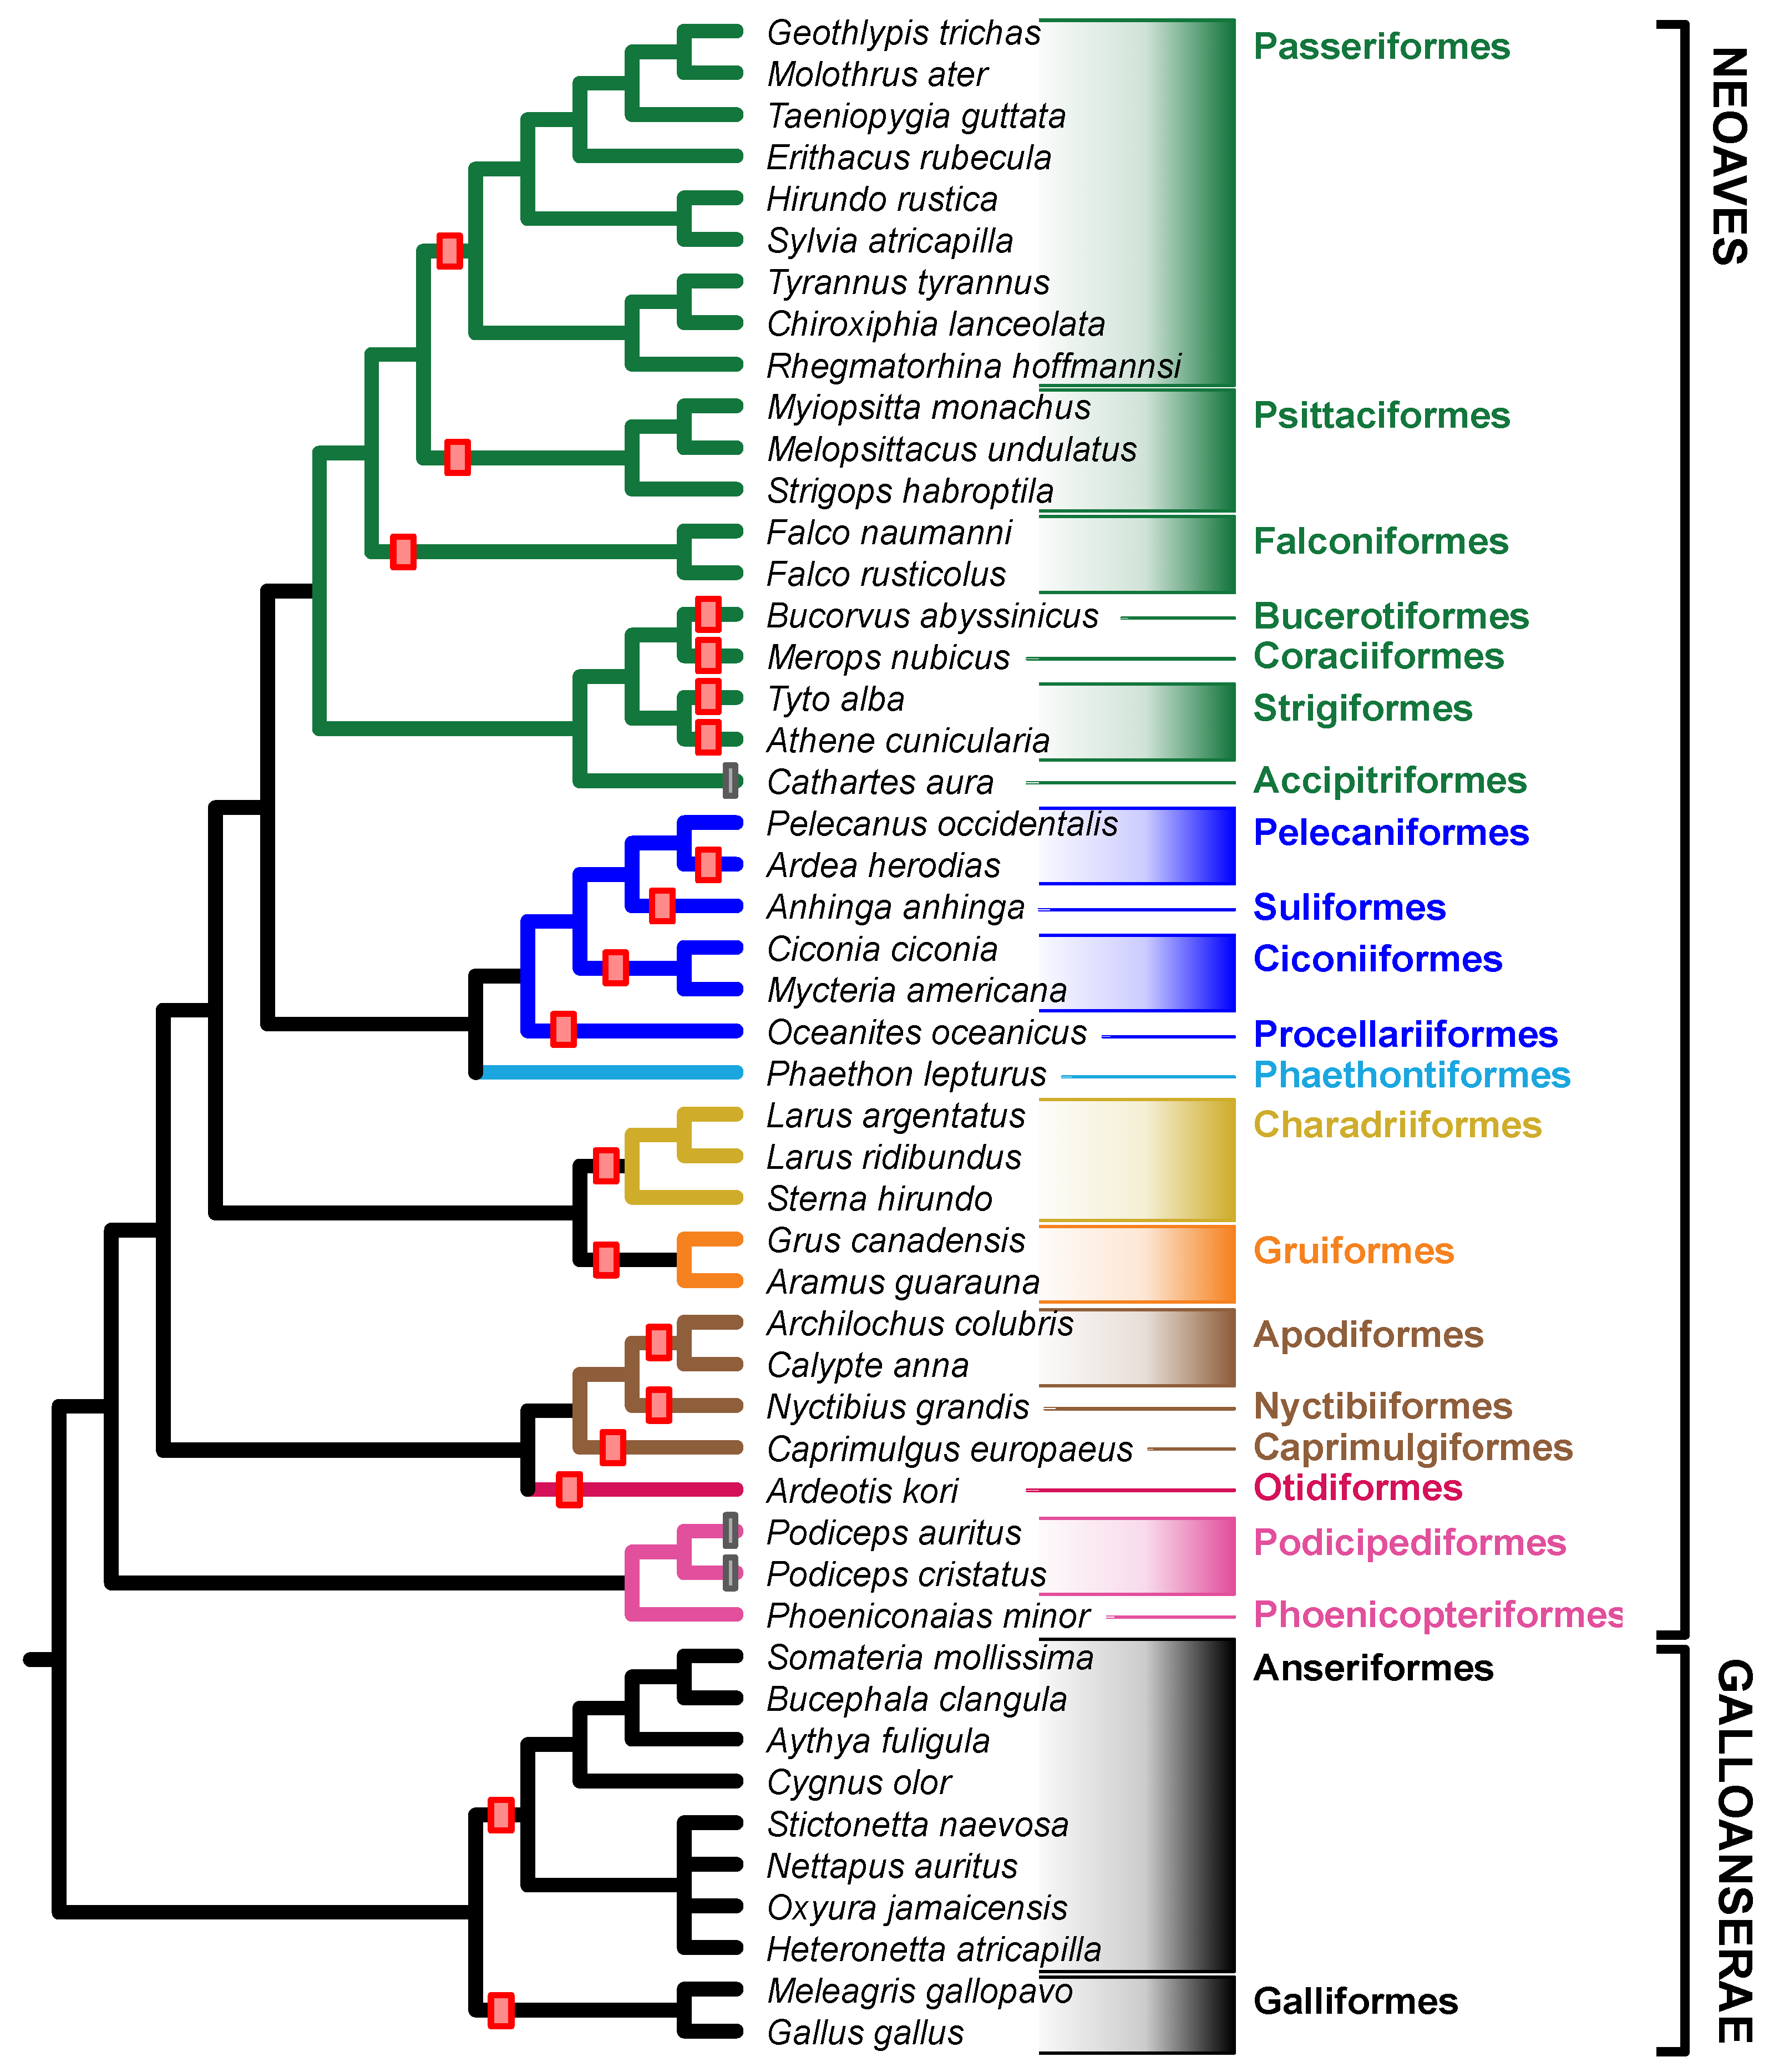
Based on these results, we estimate at least 19 cessations of recombination at the ATP5F1A locus (Figure 4, red bars) based on either deep divergences within a species, or else evidence of cessation to recombination prior to speciation events. While the best interpretation of our results (Figure 3) suggested independent cessations to recombination in Tyto alba (Western Barn Owl) and Athene cunicularia (Burrowing Owl), the short internode and limited bootstrap support between these taxa make it possible that instead there was a single barrier prior to the divergence of Tytonidae and Strigidae.
There were six species where the gametologs within a species were very similar (Figure 3), some of which may represent cases of alleles of ATP5F1A present in a region that is still undergoing recombination. The p-distances between sequences within a species for these six taxa was low ( x _ ¯ = 0.006, range 0.000–0.015; the value of 0 was in White-tailed Tropicbird where the only differences were indels, which are considered as missing data in p-distance calculations). In contrast, for the other 44 species, the differences were much greater ( x _   ¯ = 0.166, range 0.044–0.306). If we consider a p-distance of 0.005 as the minimum difference to define cessation of recombination (see methods), then there are three additional barriers to recombination (Figure 4, gray bars), for a likely total of 22 independent cessations of recombination. That leaves three species (White-tailed Tropicbird, Lesser Flamingo, and Brown Pelican) that may still be undergoing recombination.

3.4. Purifying Selection on ATP5F1A Proteins

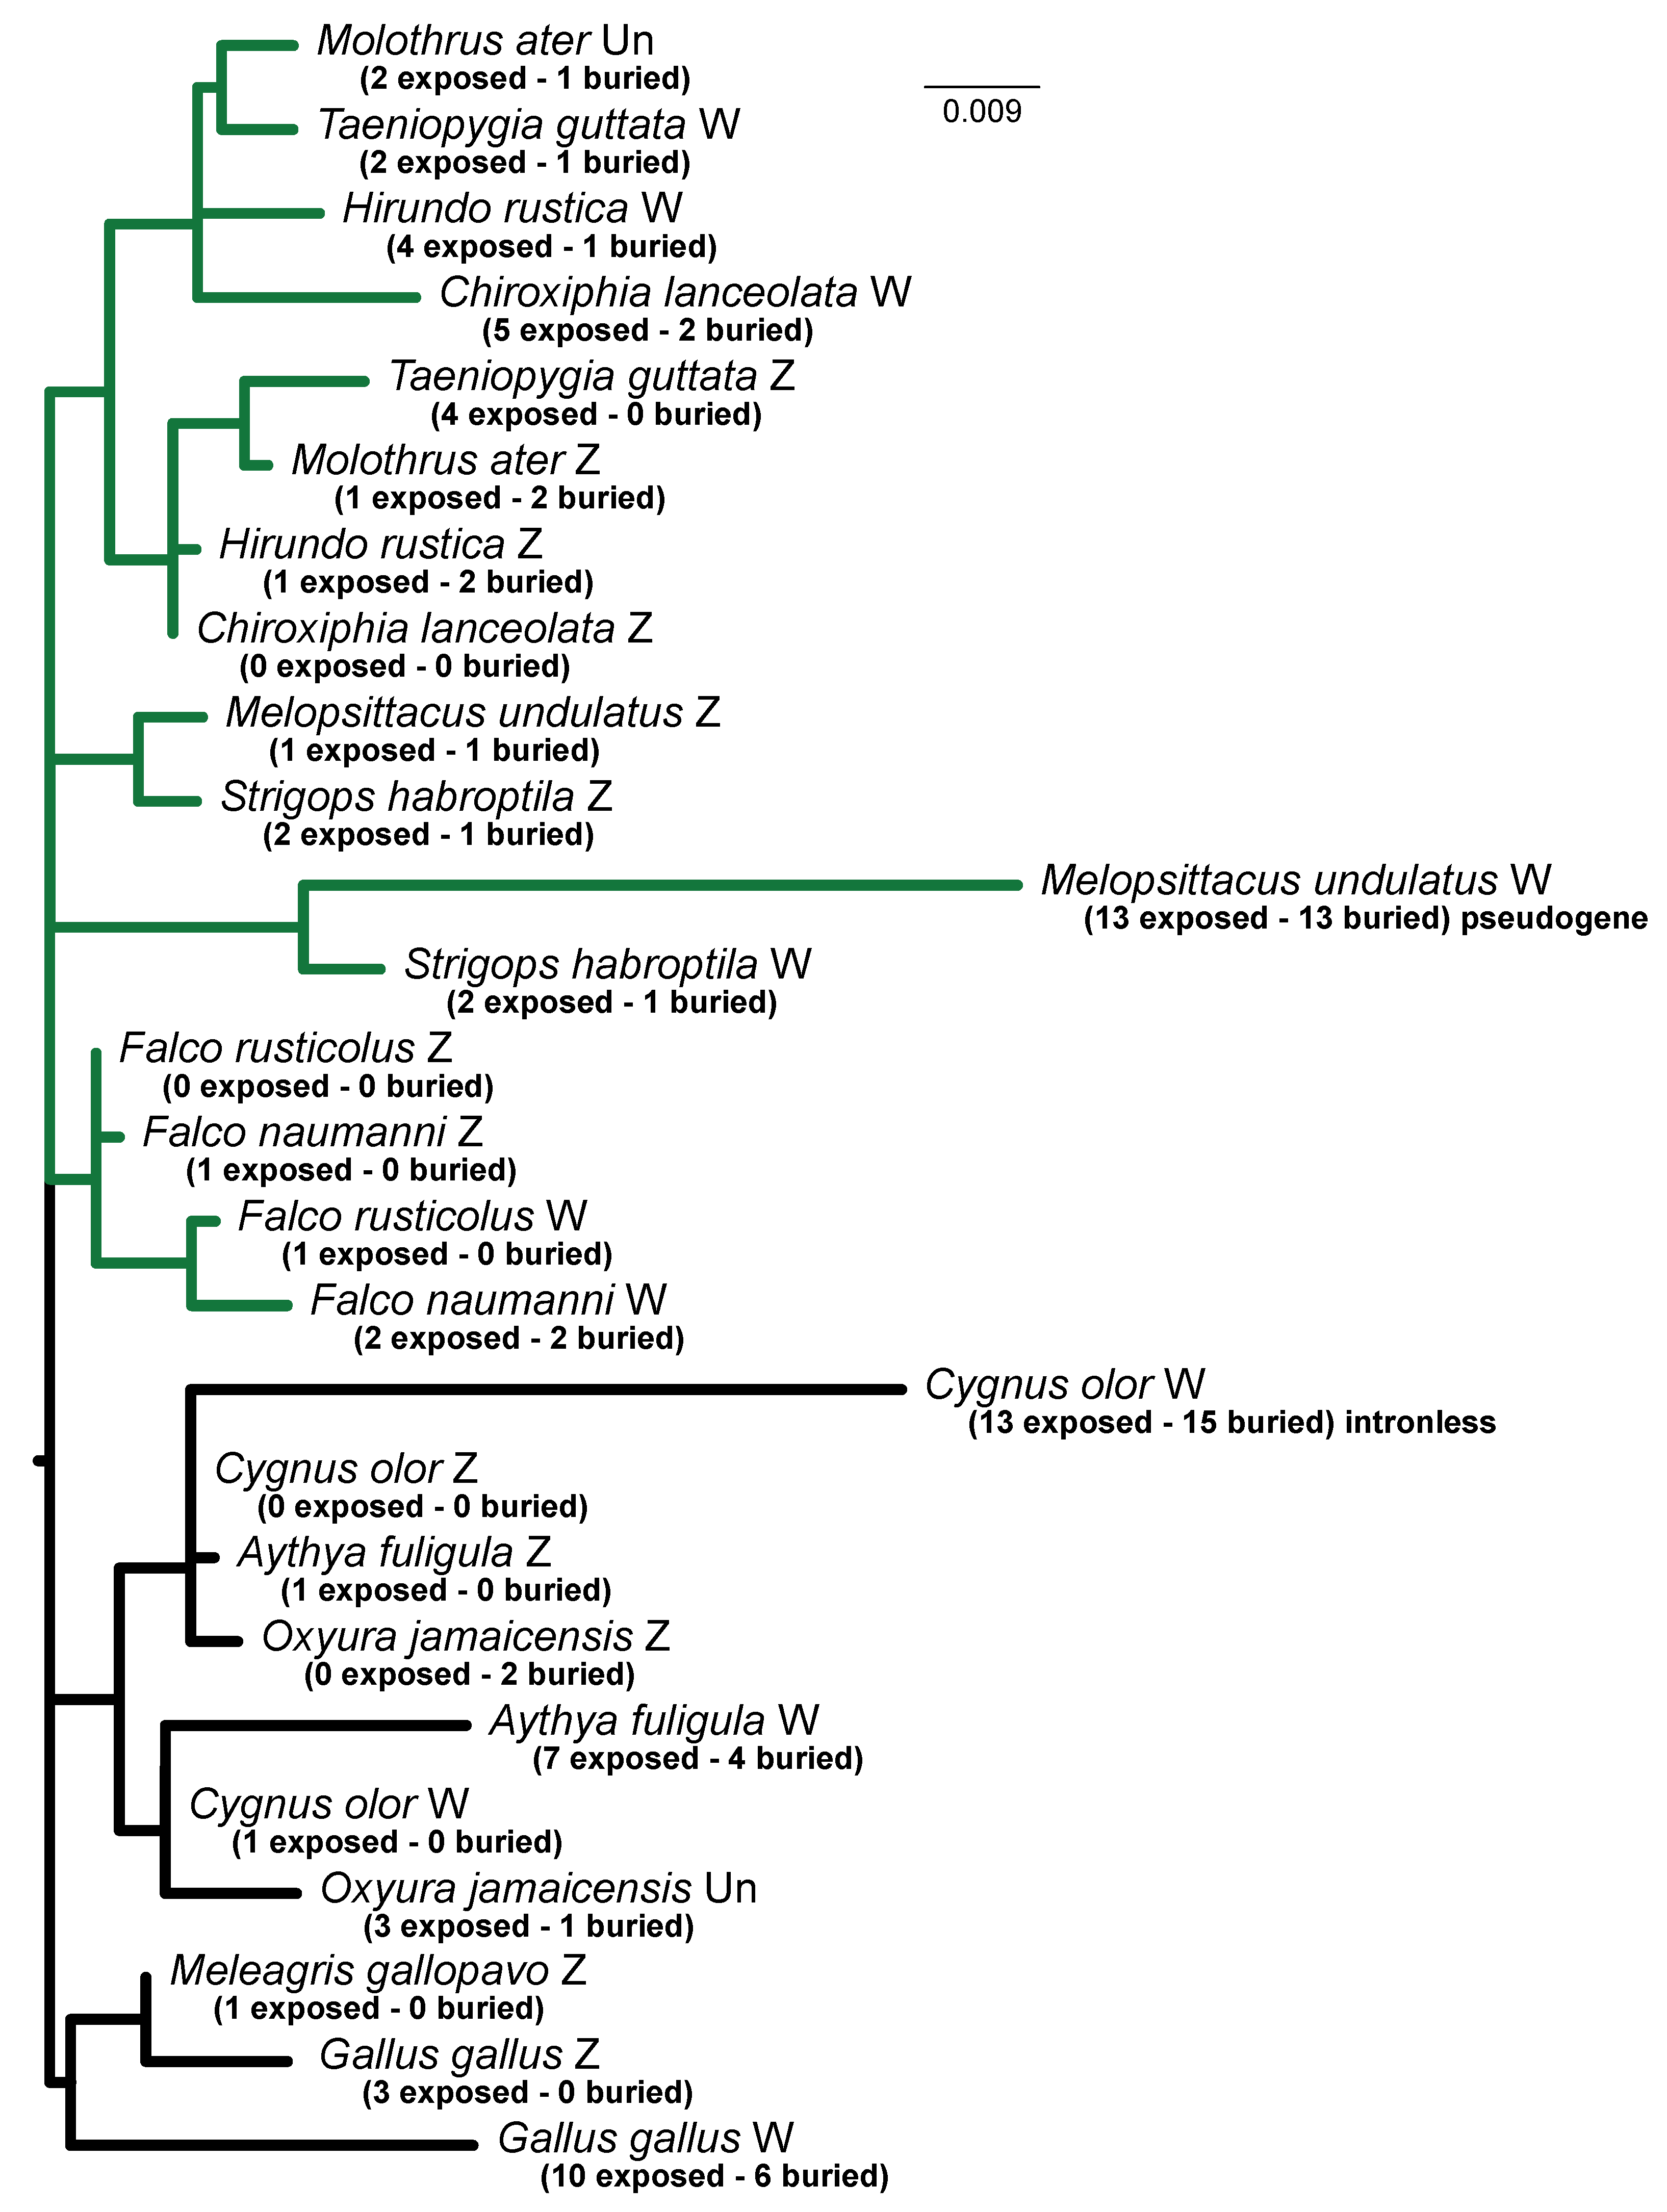
Many estimated branch lengths for protein sequences obtained from available chromosome-level genome assemblies with annotations were quite heterogeneous (Figure 5 and Supplementary Figure S1), with the W gametologs generally being associated with longer branches than the Z gametologs, indicating increased amino acid substitutions for W gametologs. In addition to the evidence for increased amino acid substitutions in W gametologs, we found evidence for a disproportionate increase in the rate of amino acid substitution for the buried residues (numbers of exposed and buried substitutions for all terminal branches are presented in Figure 5). The ratio of the numbers of buried to exposed substitutions (normalized for the number of sites in each category) was 0.171 for Z gametologs and 0.463 for W gametologs (Supplementary File S5).
The two longest branches appeared to be pseudogenes; the W gametolog in Budgerigar is a clear pseudogene with two in-frame stop codons and a frameshift and one of two W chromosome sequences in the Mute Swan (Cygnus olor) is an intronless sequence. The likely processed pseudogene from the Mute Swan also has a substitution in a putative nucleotide binding site (the conserved QGQ sequence is RGQ in the conceptual translation of the mute swan pseudogene; see Supplementary File S4). The Mute Swan processed pseudogene is sister to the anseriform Z chromosome gametologs and support for this relationship is relatively high (89% ultrafast bootstrap support; Supplementary Figure S1). The two pseudogene branches had an especially elevated buried to exposed rate ratio (0.689; see Figure 5 and Supplementary File S5), as would be expected for non-functional sequences. Excluding the pseudogenes does not alter the conclusion that the W gametologs have an elevated buried to exposed rate ratio (0.3; see Figure 5 and Supplementary File S5) that is elevated relative to the Z gametologs, emphasizing the relaxed purifying selection on the W chromosome.

4. Discussion

4.1. Avian Sex Chromosome Evolution Is Highly Dynamic

Our results further highlight the dynamic nature of sex chromosomes in birds. We did not identify any orders that were united with another order by an ancient cessation of recombination, indicating that the ATP5F1A locus has independent evolutionary trajectories in each order. The three taxa that our data suggest may still be undergoing recombination are all in different orders, and the three cases where recombination may have ceased recently are in two different orders (and within Podicipediformes, if recombination has stopped at ATP5F1A, then both species in the genus Podiceps have independently ceased recombining). While we sampled the majority of neognath orders (we analyzed data from 22 of 35 orders), our taxon sampling within orders was often too limited to assess the exact timing of when barriers to recombination occurred. Nevertheless, it is clear that recombination ceased early in some orders (e.g., Passeriformes and Anseriformes), though likely later in others. For example, within Strigiformes it is most likely that recombination ceased separately in each family. Furthermore, within Pelecaniformes our data suggest that some taxa may have ceased recombination while the Brown Pelican may still be undergoing recombination.
It is likely that the ATP5F1A remains in the PAR in some cases (still recombining), and outside of the PAR in others (and so has stopped recombining). For many species, ATP5F1A is located near the end of the Z chromosome (Supplementary File S6), where the PAR is located [16,17]. Studies comparing gene order of the Z chromosomes have found that while gene content is similar across taxa, there are rearrangements of gene order on the Z chromosome [68,69,70]. Such rearrangements may explain why ATP5F1A is located far from the PAR in a few taxa (e.g., some oscine passerines; Supplementary File S6), and may explain some of the variation observed in the evolution of barriers to recombination that we observed.
Although we did not identify the Z and W gametologs for data we collected using PCR, the expectation is that the Z gametolog will be evolving more rapidly (Figure 2). When looking at the data extracted from genomes, this appears to be largely true (Figure 3); longer branches were almost always associated with the Z gametolog. However, there may be some exceptions to this rule. For example, within falcons, the W gametolog of the Gyrfalcon (F. rusticolus) has a longer branch than the Z gametolog, and the total divergence within the Lesser Kestrel (F. naumanii) appears to be approximately similar for the two gametologs. Whether this is a biological difference (perhaps Falconiformes exhibit less striking patterns of male-driven molecular evolution) or it reflects a simple stochastic effect (e.g., it is possible most neutral regions on the falconiform Z chromosome would have longer branches than the gametologous region on the W but the region we sampled for this study did not) remains to be determined.
We also observed variation among orders when we analyzed protein sequences extracted from annotated genome assemblies. Even with the limited taxon sampling for proteins, we observed pseudogene formation in one order (Psittaciformes), whereas the other orders exhibited intact (and presumably functional) W gametologs. That there is high variation at the ATP5F1AW locus within Psittaciformes has been observed [51], with not only pseudogene formation but in at least one case, the apparent loss of the W gametolog. The protein analyses also highlighted a duplication within one order (Anseriformes). As more data become available, it is likely more such variation will likely be observed.

4.2. Cessation of Recombination and Relaxed Purifying Selection

Many of the changes in patterns of evolution for W chromosomes (and Y chromosomes in XY systems) can be explained by the increased strength of Hill–Robertson interference [63] after the cessation of recombination. This includes increases in the rate of non-synonymous substitution [37], instances of gene loss [17,32,71], and the accumulation of transposable elements and other repetitive DNA [17,36,38,39]. Although it is tempting to view all of these as simple consequences of the weaker purifying selection in the non-recombining region of the W, it is possible that the transposable element insertions are actually causal, initiating the cessation of recombination rather than being a consequence of other mechanisms that suppress recombination [17]. Moreover, the strength of these effects is expected to vary over time; for example, it is generally thought that the strength of Hill–Robertson interference is likely to decrease [72] as gene loss proceeds. However, we note that the potential for Hill–Robertson interference between the W chromosome and mitogenome [35] might alter this expectation for W chromosomes.
Our findings were consistent with all of these expectations despite our narrow focus on the ATP5F1A locus. We observed the accumulation of transposable elements (Figure 3), although our focus on a single locus made it impossible to examine overall rates of insertion. We also observed a higher rate of amino acid substitution in W gametologs (Figure 5). Finally, we observed pseudogenization of one W gametolog and even found evidence for a processed pseudogene in the Mute Swan that likely arose from the Z gametolog of ATP5F1A. The Mute Swan pseudogene is especially striking because processed pseudogenes appear to be rare in birds [73]; perhaps the W chromosome will prove to have a disproportionately large number of these genomic features as well.
To complement our observation that the ATP5F1A coding sequences from high-quality genome assemblies had a higher rate of amino acid substitution, we examined the ratio of buried to solvent exposed substitution rates. This analysis revealed clear evidence of relaxed purifying selection. Specifically, we observed three buried to exposed rate ratios: one for Z gametologs, a second for the apparently functional W gametologs (almost twice the value for Z gametologs), and a third, even higher value, for pseudogenes. Improved taxon sampling might refine that finding further by providing information about fine-scale variation in the buried to exposed rate ratio.
We found the observation that the buried to exposed rate ratio for ATP5F1AW gametologs is intermediate between Z gametologs and pseudogenes to be somewhat surprising. The very high buried to exposed rate ratio for pseudogenes is straightforward to explain based on their loss of function, but the intermediate rate ratio implies the maintenance of function combined with substitutions that likely reduce fitness. ATP5F1A encodes the α subunit of the F1 portion of the mitochondrial ATPase. This raises a number of issues, all related to the question of whether female birds with a non-recombining W chromosome segment that contains the ATP5F1A have reduced mitochondrial ATPase function. F1-ATPase comprises three α and three β subunits [74], implying that female birds are likely to have mixed ATPase complexes with both Z-encoded and W-encoded subunits, unless there is some reason that the Z-linked (and presumably higher fitness) subunits will tend to dominate the functional enzyme complexes. One way this could be accomplished is lower expression of ATP5F1AW. Smeds et al. [36] examined the Collared Flycatcher (Ficedula albicollis) RNA-seq data from Uebbing et al. [75], finding lower expression of ATP5F1AW in muscle (a tissue with high ATP requirements) but not in other tissues. Xu and Zhou [71] reanalyzed that data, finding generally lower expression of ATP5F1AW. Xu and Zhou [71] also analyzed chicken RNA-seq data, also finding lower expression of ATP5F1AW in multiple tissues. Another possibility is that the inclusion of at least one protein encoded by the presumably higher fitness Z gametolog in the α3β3 structure will yield a fully functional ATPase complex. Regardless of the details, if the Z-linked gametolog is sufficient for function (and for males, this is critical), why has ATP5F1AW apparently maintained function in so many lineages? Additional sequencing of the ATP5F1A region of avian W chromosomes, along with other studies focused on transcriptional activity and protein function, is likely to yield additional insights, both into the narrow issue of ATPase function and into the broader issues of W chromosome evolution.

4.3. Challenges in Studying Sex Chromosome Evolution

Our results also highlight the challenges of examining sex chromosome evolution. One reason we may have failed to identify two gametologs is that, in some cases, insertions of transposable elements may have led to much larger fragments for one gametolog than the other. Larger fragments may not amplify as robustly (and so may be in low abundance in a pool of amplicons) and/or may not clone as efficiently. PCR amplicons of vastly different sizes than expected were also not selected as likely clones, so we may have inadvertently excluded actual gametologs when selecting clones for sequencing. Given that our results suggest that the majority of transposable element insertions are on the W chromosome (as expected [17,36,39]), this would bias us towards sequencing only the Z gametolog. Another factor that may prevent sampling both gametologs is that the primers may not bind (or may bind less efficiently) to one gametolog as compared with the other. That may lead to a pool of amplicons enriched for just one gametolog. Given that the Z chromosome evolves more rapidly in birds (e.g., Berlin and Ellegren [37] and Wang et al. [32]), it is most likely this would lead to amplification of the more conserved W gametolog.
We failed to amplify two gametologs in six species from four orders where we expected very divergent gametologs, and where there was a chromosomal-level genome that sampled both the Z and W gametologs for ATP5F1A. Using BLAST to a genome in the same order, we found our PCR/cloning results led to sequencing the Z gametolog in three species from two orders (Bucerotiformes and Psittaciiformes), and the W gametolog in three species from two orders (Caprimulgiformes and Passeriformes). This suggests that our failure to identify both gametologs may have arisen from multiple causes (though transposable element insertions may occur on the Z chromosome as well and the primers may have failed to bind to the W chromosome in some cases).
In at least some cases, an examination of our results suggests that our conservative approach was likely justified. For example, we sampled one species of Passeriformes (African Paradise Flycatcher, Terpsiphone viridis) where our single sampled gametolog might have suggested ongoing recombination, yet where sampling in other passerines suggests that we should have found very divergent gametologs. At the sequence level, passeriforms are among the most rapidly evolving avian order (see Wang et al. [76] and Berv and Field [77] for avian rate comparisons). This could make it even more challenging to amplify the Z gametolog, which would be consistent with our only sequencing the W gametolog in that case.
It also remains possible that our PCR and cloning results were correct for some or all of the data we excluded. Given the dynamic nature of sex chromosomes overall [10], and particularly the variation in W chromosomes across birds [17,23,44], our results could also reflect cases where one gametolog (most likely the W) may have been lost in some species. Similar to the passerine example in the previous paragraph, we also sampled a single gametolog in two parrots, Grey Parrot (Psittacus erithacus) and Coconut Lorikeet (Trichoglossus haematodus) where our results from genomes also suggest that we should have found two gametologs. However, Southern blots of ATP5F1A suggest that the W gametolog has been lost in the Grey Parrot [51]. Thus, our results (at least those where we sequenced the Z gametolog) could reflect biology (loss of the W gametolog) rather than a failure of our methods.
In other cases, we excluded data that may represent true cases where recombination is occurring. Based on data from Suh et al. [22], the Turkey Vulture (Cathartes aura), a New World vulture, likely ceased recombining very recently. We sampled a different New World vulture, the Black Vulture (Coragyps atratus), and failed to find clear gametologs. It may be that recombination is still occurring in some New World vultures, or that an independent cessation has recently occurred within the Black Vulture but the gametologs are sufficiently similar to each other that we classified this as a single gametolog sampled. We also sampled two other Accipitriformes from a different family (Red-tailed Hawk, Buteo jamaicensis and Snail Kite. Rostrhamus sociabilis) and could not identify two clear gametologs, which might be consistent if recombination is ongoing (or recently stopped) throughout this order.
Although our success rate at identifying both gametologs was much higher using the chromosomal-level genomes, there were still some cases where we did not identify both gametologs in samples that included an assembly of the W chromosome. Additionally, in some cases, it appeared that both gametologs were present, though not necessarily assigned to the sex chromosomes (typically not to the W chromosome). However, as the cost and ease of obtaining chromosome-level assemblies make them more common, and likely improvements to assemblies will leave fewer unassigned fragments (particularly from regions likely on the W chromosome), this should become a more and more valuable resource for studying sex chromosome evolution [48]. Loss of genes on the W chromosome, however, will remain challenging to identify as analysis of genomes may not allow teasing apart true gene loss versus failure to sequence or assemble the W gametolog. In such cases, it may be necessary to incorporate other approaches (including older methods such as Southern blots) to better understand the true dynamic nature of avian sex chromosomes

Supplementary Materials

The following supporting information can be downloaded at: https://www.mdpi.com/article/10.3390/birds3010004/s1, Figure S1: Phylogenetic analyses of protein data, File S1: Sample information for new sequences, File S2: Information on genome sequences, File S3: Alignment of intron sequences, File S4: Alignment of protein sequences, File S5: Data on buried and exposed amino acid residues, File S6: Location of ATP5F1A in avian genomes.

Author Contributions

Conceptualization, R.T.K. and E.L.B.; methodology, R.T.K. and E.L.B.; formal analysis, R.T.K. and E.L.B.; investigation, R.T.K. and E.L.B.; data curation, R.T.K. and E.L.B.; writing—original draft preparation, R.T.K.; writing—review and editing, R.T.K. and E.L.B.; visualization, E.L.B.; project administration, R.T.K.; funding acquisition, R.T.K. and E.L.B. All authors have read and agreed to the published version of the manuscript.

Funding

This research was funded by the US National Science Foundation, grant number DEB-1655683 to R.T.K. and E.L.B.

Institutional Review Board Statement

Not applicable because all tissues used were from already available museum specimens. Additional sequences analyzed were from published genomes.

Data Availability Statement

Newly collected sequence data have been deposited in GenBank, accession numbers OM249731–OM249764.

Acknowledgments

We thank five anonymous reviewers and the Kimball-Braun lab for helpful comments on earlier versions of this manuscript. Samples for this study came from the Florida Museum of Natural History and the Field Museum of Natural History.

Conflicts of Interest

The authors declare no conflict of interest.

References

  1. Bachtrog, D.; Kirkpatrick, M.; Mank, J.E.; McDaniel, S.F.; Pires, J.C.; Rice, W.; Valenzuela, N. Are all sex chromosomes created equal? Trends Genet. 2011, 27, 350–357. [Google Scholar] [CrossRef] [PubMed]
  2. Rice, W.R. The accumulation of sexually antagonistic genes as a selective agent promoting the evolution of reduced recombination between primitive sex chromosomes. Evolution 1987, 41, 911–914. [Google Scholar] [CrossRef] [PubMed]
  3. Charlesworth, D.; Charlesworth, B.; Marais, G. Steps in the evolution of heteromorphic sex chromosomes. Heredity 2005, 95, 118–128. [Google Scholar] [CrossRef] [PubMed] [Green Version]
  4. Ponnikas, S.; Sigeman, H.; Abbott, J.K.; Hansson, B. Why do sex chromosomes stop recombining? Trends Genet. 2018, 34, 492–503. [Google Scholar] [CrossRef] [PubMed]
  5. Furman, B.L.S.; Metzger, D.C.H.; Darolti, I.; Wright, A.E.; Sandkam, B.A.; Almeida, P.; Shu, J.J.; Mank, J.E. Sex chromosome evolution: So many exceptions to the rules. Genome Biol. Evol. 2020, 12, 750–763. [Google Scholar] [CrossRef] [PubMed]
  6. Jeffries, D.L.; Gerchen, J.F.; Scharmann, M.; Pannell, J.R. A neutral model for the loss of recombination on sex chromosomes. Philos. Trans. R. Soc. Lond. B Biol. Sci. 2021, 376, 20200096. [Google Scholar] [CrossRef] [PubMed]
  7. Charlesworth, B.; Charlesworth, D. The degeneration of Y chromosomes. Philos. Trans. R. Soc. Lond. B Biol. Sci. 2000, 355, 1563–1572. [Google Scholar] [CrossRef] [PubMed] [Green Version]
  8. Mank, J.E.; Ellegren, H. Parallel divergence and degradation of the avian W sex chromosome. Trends Ecol. Evol. 2007, 22, 389–391. [Google Scholar] [CrossRef]
  9. Bellott, D.W.; Skaletsky, H.; Pyntikova, T.; Mardis, E.R.; Graves, T.; Kremitzki, C.; Brown, L.G.; Rozen, S.; Warren, W.C.; Wilson, R.K.; et al. Convergent evolution of chicken Z and human X chromosomes by expansion and gene acquisition. Nature 2010, 466, 612–616. [Google Scholar] [CrossRef] [Green Version]
  10. Bachtrog, D. A dynamic view of sex chromosome evolution. Curr. Opin. Genet. Dev. 2006, 16, 578–585. [Google Scholar] [CrossRef]
  11. Otto, S.P.; Pannell, J.R.; Peichel, C.L.; Ashman, T.-L.; Charlesworth, D.; Chippindale, A.K.; Delph, L.F.; Guerrero, R.F.; Scarpino, S.V.; McAllister, B.F. About PAR: The distinct evolutionary dynamics of the pseudoautosomal region. Trends Genet. 2011, 27, 358–367. [Google Scholar] [CrossRef] [PubMed]
  12. Fridolfsson, A.K.; Cheng, H.; Copeland, N.G.; Jenkins, N.A.; Liu, H.C.; Raudsepp, T.; Woodage, T.; Chowdhary, B.; Halverson, J.; Ellegren, H. Evolution of the avian sex chromosomes from an ancestral pair of autosomes. Proc. Natl. Acad. Sci. USA 1998, 95, 8147–8152. [Google Scholar] [CrossRef] [PubMed] [Green Version]
  13. Kratochvíl, L.; Gamble, T.; Rovatsos, M. Sex chromosome evolution among amniotes: Is the origin of sex chromosomes non-random? Philos. Trans. R. Soc. Lond. B Biol. Sci. 2021, 376, 20200108. [Google Scholar] [CrossRef] [PubMed]
  14. Johnson Pokorná, M.; Kratochvíl, L. What was the ancestral sex-determining mechanism in amniote vertebrates? Biol. Rev. Camb. Philos. Soc. 2016, 91, 1–12. [Google Scholar] [CrossRef]
  15. Nam, K.; Ellegren, H. The chicken (Gallus gallus) Z chromosome contains at least three nonlinear evolutionary strata. Genetics 2008, 180, 1131–1136. [Google Scholar] [CrossRef] [Green Version]
  16. Zhou, Q.; Zhang, J.; Bachtrog, D.; An, N.; Huang, Q.; Jarvis, E.D.; Gilbert, M.T.P.; Zhang, G. Complex evolutionary trajectories of sex chromosomes across bird taxa. Science 2014, 346, 1246338. [Google Scholar] [CrossRef] [Green Version]
  17. Xu, L.; Auer, G.; Peona, V.; Suh, A.; Deng, Y.; Feng, S.; Zhang, G.; Blom, M.P.K.; Christidis, L.; Prost, S.; et al. Dynamic evolutionary history and gene content of sex chromosomes across diverse songbirds. Nat. Ecol. Evol. 2019, 3, 834–844. [Google Scholar] [CrossRef]
  18. Fridolfsson, A.-K.; Ellegren, H. A Simple and Universal Method for Molecular Sexing of Non-Ratite Birds. J. Avian Biol. 1999, 30, 116. [Google Scholar] [CrossRef]
  19. García-Moreno, J.; Mindell, D.P. Rooting a phylogeny with homologous genes on opposite sex chromosomes (gametologs): A case study using avian CHD. Mol. Biol. Evol. 2000, 17, 1826–1832. [Google Scholar] [CrossRef]
  20. Ellegren, H.; Carmichael, A. Multiple and independent cessation of recombination between avian sex chromosomes. Genetics 2001, 158, 325–331. [Google Scholar] [CrossRef]
  21. Handley, L.-J.L.; Ceplitis, H.; Ellegren, H. Evolutionary strata on the chicken Z chromosome: Implications for sex chromosome evolution. Genetics 2004, 167, 367–376. [Google Scholar] [CrossRef] [PubMed] [Green Version]
  22. Suh, A.; Kriegs, J.O.; Brosius, J.; Schmitz, J. Retroposon insertions and the chronology of avian sex chromosome evolution. Mol. Biol. Evol. 2011, 28, 2993–2997. [Google Scholar] [CrossRef] [PubMed] [Green Version]
  23. Rutkowska, J.; Lagisz, M.; Nakagawa, S. The long and the short of avian W chromosomes: No evidence for gradual W shortening. Biol. Lett. 2012, 8, 636–638. [Google Scholar] [CrossRef] [PubMed] [Green Version]
  24. Pala, I.; Hasselquist, D.; Bensch, S.; Hansson, B. Patterns of molecular evolution of an avian neo-sex chromosome. Mol. Biol. Evol. 2012, 29, 3741–3754. [Google Scholar] [CrossRef] [Green Version]
  25. Sigeman, H.; Strandh, M.; Proux-Wéra, E.; Kutschera, V.E.; Ponnikas, S.; Zhang, H.; Lundberg, M.; Soler, L.; Bunikis, I.; Tarka, M.; et al. Avian neo-sex chromosomes reveal dynamics of recombination suppression and W degeneration. Mol. Biol. Evol. 2021, 38, 5275–5291. [Google Scholar] [CrossRef]
  26. Kretschmer, R.; Gunski, R.J.; Garnero, A.D.V.; de Freitas, T.R.O.; Toma, G.A.; de Cioffi, M.B.; de Oliveira, E.H.C.; O’Connor, R.E.; Griffin, D.K. Chromosomal Analysis in Crotophaga ani (Aves, Cuculiformes) Reveals Extensive Genomic Reorganization and an Unusual Z-Autosome Robertsonian Translocation. Cells 2020, 10, 4. [Google Scholar] [CrossRef]
  27. Huang, Z.; Furo, I.; Peona, V.; Liu, J.; Gomes, A.J.B.; Cen, W.; Huang, H.; Zhang, Y.; Chen, D.; Ting, X.; et al. Recurrent chromosome reshuffling and the evolution of neo-sex chromosomes in parrots. bioRxiv 2021. [Google Scholar] [CrossRef]
  28. Li, W.H.; Yi, S.; Makova, K. Male-driven evolution. Curr. Opin. Genet. Dev. 2002, 12, 650–656. [Google Scholar] [CrossRef]
  29. Charlesworth, B.; Coyne, J.A.; Barton, N.H. The relative rates of evolution of sex chromosomes and autosomes. Am. Nat. 1987, 130, 113–146. [Google Scholar] [CrossRef]
  30. Mank, J.E.; Axelsson, E.; Ellegren, H. Fast-X on the Z: Rapid evolution of sex-linked genes in birds. Genome Res. 2007, 17, 618–624. [Google Scholar] [CrossRef] [Green Version]
  31. Veeramah, K.R.; Gutenkunst, R.N.; Woerner, A.E.; Watkins, J.C.; Hammer, M.F. Evidence for increased levels of positive and negative selection on the X chromosome versus autosomes in humans. Mol. Biol. Evol. 2014, 31, 2267–2282. [Google Scholar] [CrossRef] [PubMed] [Green Version]
  32. Wang, Z.; Zhang, J.; Yang, W.; An, N.; Zhang, P.; Zhang, G.; Zhou, Q. Temporal genomic evolution of bird sex chromosomes. BMC Evol. Biol. 2014, 14, 250. [Google Scholar] [CrossRef] [PubMed] [Green Version]
  33. Berlin, S.; Tomaras, D.; Charlesworth, B. Low mitochondrial variability in birds may indicate Hill-Robertson effects on the W chromosome. Heredity 2007, 99, 389–396. [Google Scholar] [CrossRef] [PubMed] [Green Version]
  34. Hickey, A.J.R. Avian mtDNA diversity? An alternate explanation for low mtDNA diversity in birds: An age-old solution? Heredity 2008, 100, 443. [Google Scholar] [CrossRef] [PubMed]
  35. Lane, N. Mitochondria and the W chromosome: Low variability on the W chromosome in birds is more likely to indicate selection on mitochondrial genes. Heredity 2008, 100, 444–445. [Google Scholar] [CrossRef] [PubMed]
  36. Smeds, L.; Warmuth, V.; Bolivar, P.; Uebbing, S.; Burri, R.; Suh, A.; Nater, A.; Bureš, S.; Garamszegi, L.Z.; Hogner, S.; et al. Evolutionary analysis of the female-specific avian W chromosome. Nat. Commun. 2015, 6, 7330. [Google Scholar] [CrossRef] [Green Version]
  37. Berlin, S.; Ellegren, H. Fast accumulation of nonsynonymous mutations on the female-specific W chromosome in birds. J. Mol. Evol. 2006, 62, 66–72. [Google Scholar] [CrossRef]
  38. de Souza, M.S.; Kretschmer, R.; Barcellos, S.A.; Costa, A.L.; de Cioffi, M.B.; de Oliveira, E.H.C.; Garnero, A.D.V.; Gunski, R.J. Repeat sequence mapping shows different W chromosome evolutionary pathways in two caprimulgiformes families. Birds 2020, 1, 4. [Google Scholar] [CrossRef]
  39. Peona, V.; Palacios-Gimenez, O.M.; Blommaert, J.; Liu, J.; Haryoko, T.; Jønsson, K.A.; Irestedt, M.; Zhou, Q.; Jern, P.; Suh, A. The avian W chromosome is a refugium for endogenous retroviruses with likely effects on female-biased mutational load and genetic incompatibilities. Philos. Trans. R. Soc. Lond. B Biol. Sci. 2021, 376, 20200186. [Google Scholar] [CrossRef] [PubMed]
  40. Kataoka, H.; Chitra, B. Nucleotide sequence of a cDNA for the α subunit of human mitochondrial ATP synthase. Biochim. Biophys. Acta (BBA)—Gene Struct. Expr. 1991, 1089, 393–395. [Google Scholar] [CrossRef]
  41. Carmichael, A.N.; Fridolfsson, A.K.; Halverson, J.; Ellegren, H. Male-biased mutation rates revealed from Z and W chromosome-linked ATP synthase alpha-subunit (ATP5A1) sequences in birds. J. Mol. Evol. 2000, 50, 443–447. [Google Scholar] [CrossRef] [PubMed]
  42. Takagi, N.; Sasaki, M. A phylogenetic study of bird karyotypes. Chromosoma 1974, 46, 91–120. [Google Scholar] [CrossRef] [PubMed]
  43. Belterman, R.H.R.; De Boer, L.E.M. A karyological study of 55 species of birds, including karyotypes of 39 species new to cytology. Genetica 1984, 65, 39–82. [Google Scholar] [CrossRef]
  44. Yazdi, H.P.; Silva, W.T.A.F.; Suh, A. Why do some sex chromosomes degenerate more slowly than others? the odd case of ratite sex chromosomes. Genes 2020, 11, 1153. [Google Scholar] [CrossRef]
  45. Wang, Z.; Zhang, J.; Xu, X.; Witt, C.; Deng, Y.; Chenc, G.; Meng, G.; Feng, S.; Xu, L.; Szekely, T.; et al. Phylogeny and sex chromosome evolution of palaeognathae. J. Genet. Genom. 2021; in press. [Google Scholar] [CrossRef]
  46. Cummings, S.M.; McMullan, M.; Joyce, D.A.; van Oosterhout, C. Solutions for PCR, cloning and sequencing errors in population genetic analysis. Conserv. Genet. 2010, 11, 1095–1097. [Google Scholar] [CrossRef]
  47. Peona, V.; Blom, M.P.K.; Xu, L.; Burri, R.; Sullivan, S.; Bunikis, I.; Liachko, I.; Haryoko, T.; Jønsson, K.A.; Zhou, Q.; et al. Identifying the causes and consequences of assembly gaps using a multiplatform genome assembly of a bird-of-paradise. Mol. Ecol. Resour. 2021, 21, 263–286. [Google Scholar] [CrossRef]
  48. Yazdi, H.P.; Ellegren, H. A genetic map of ostrich Z chromosome and the role of inversions in avian sex chromosome evolution. Genome Biol. Evol. 2018, 10, 2049–2060. [Google Scholar] [CrossRef]
  49. Gill, F.; Donsker, D.; Rasmussen, P. IOC World Bird List (v11.2). Available online: https://www.worldbirdnames.org/new/ (accessed on 26 November 2021).
  50. Kimball, R.T.; Crawford, D.J.; Smith, E.B. Evolutionary processes in the genus Coreocarpus: Insights from molecular phylogenetics. Evolution 2003, 57, 52–61. [Google Scholar] [CrossRef]
  51. De Kloet, S.R. Loss of the gene for the alpha subunit of ATP synthase (ATP5A1) from the W chromosome in the African grey parrot (Psittacus erithacus). J. Mol. Evol. 2001, 53, 135–143. [Google Scholar] [CrossRef]
  52. Kohany, O.; Gentles, A.J.; Hankus, L.; Jurka, J. Annotation, submission and screening of repetitive elements in Repbase: RepbaseSubmitter and Censor. BMC Bioinform. 2006, 7, 474. [Google Scholar] [CrossRef] [PubMed] [Green Version]
  53. Katoh, K.; Rozewicki, J.; Yamada, K.D. MAFFT online service: Multiple sequence alignment, interactive sequence choice and visualization. Brief. Bioinform. 2017, 20, 1160–1166. [Google Scholar] [CrossRef] [PubMed] [Green Version]
  54. Nguyen, L.-T.; Schmidt, H.A.; von Haeseler, A.; Minh, B.Q. IQ-TREE: A fast and effective stochastic algorithm for estimating maximum-likelihood phylogenies. Mol. Biol. Evol. 2015, 32, 268–274. [Google Scholar] [CrossRef] [PubMed]
  55. Trifinopoulos, J.; Nguyen, L.-T.; von Haeseler, A.; Minh, B.Q. W-IQ-TREE: A fast online phylogenetic tool for maximum likelihood analysis. Nucleic Acids Res. 2016, 44, W232-5. [Google Scholar] [CrossRef] [PubMed] [Green Version]
  56. Kalyaanamoorthy, S.; Minh, B.Q.; Wong, T.K.F.; von Haeseler, A.; Jermiin, L.S. ModelFinder: Fast model selection for accurate phylogenetic estimates. Nat. Methods 2017, 14, 587–589. [Google Scholar] [CrossRef] [PubMed] [Green Version]
  57. Hoang, D.T.; Chernomor, O.; von Haeseler, A.; Minh, B.Q.; Vinh, L.S. Ufboot2: Improving the ultrafast bootstrap approximation. Mol. Biol. Evol. 2018, 35, 518–522. [Google Scholar] [CrossRef] [PubMed]
  58. Pandey, A.; Braun, E.L. Protein evolution is structure dependent and non-homogeneous across the tree of life. In Proceedings of the 11th ACM International Conference on Bioinformatics, Computational Biology and Health Informatics, Virtual Event, 21–24 September 2020; ACM: New York, NY, USA, 2020; pp. 1–11. [Google Scholar]
  59. Minh, B.Q.; Dang, C.C.; Vinh, L.S.; Lanfear, R. Qmaker: Fast and accurate method to estimate empirical models of protein evolution. Syst. Biol. 2021, 70, 1046–1060. [Google Scholar] [CrossRef] [PubMed]
  60. Swofford, D.L. PAUP*. Phylogenetic Analysis Using Parsimony (*and Other Methods); Sinauer Associates: Sunderland, MA, USA, 2003. [Google Scholar]
  61. Swofford, D.L.; Maddison, W.P. Reconstructing ancestral character states under Wagner parsimony. Math. Biosci. 1987, 87, 199–229. [Google Scholar] [CrossRef]
  62. Chojnowski, J.L.; Kimball, R.T.; Braun, E.L. Introns outperform exons in analyses of basal avian phylogeny using clathrin heavy chain genes. Gene 2008, 410, 89–96. [Google Scholar] [CrossRef]
  63. Hill, W.G.; Robertson, A. The effect of linkage on limits to artificial selection. Genet. Res. 1966, 8, 269. [Google Scholar] [CrossRef] [PubMed]
  64. Sassi, S.O.; Braun, E.L.; Benner, S.A. The evolution of seminal ribonuclease: Pseudogene reactivation or multiple gene inactivation events? Mol. Biol. Evol. 2007, 24, 1012–1024. [Google Scholar] [CrossRef] [PubMed] [Green Version]
  65. De Oliveira Furo, I.; Kretschmer, R.; Dos Santos, M.S.; de Lima Carvalho, C.A.; Gunski, R.J.; O’Brien, P.C.M.; Ferguson-Smith, M.A.; Cioffi, M.B.; de Oliveira, E.H.C. Chromosomal Mapping of Repetitive DNAs in Myiopsitta monachus and Amazona aestiva (Psittaciformes, Psittacidae) with Emphasis on the Sex Chromosomes. Cytogenet. Genome Res. 2017, 151, 151–160. [Google Scholar] [CrossRef] [PubMed]
  66. Braun, E.L.; Kimball, R.T. Data types and the phylogeny of neoaves. Birds 2021, 2, 1. [Google Scholar] [CrossRef]
  67. Kimball, R.T.; Oliveros, C.H.; Wang, N.; White, N.D.; Barker, F.K.; Field, D.J.; Ksepka, D.T.; Chesser, R.T.; Moyle, R.G.; Braun, M.J.; et al. A phylogenomic supertree of birds. Diversity 2019, 11, 109. [Google Scholar] [CrossRef] [Green Version]
  68. Backström, N.; Brandström, M.; Gustafsson, L.; Qvarnström, A.; Cheng, H.; Ellegren, H. Genetic mapping in a natural population of collared flycatchers (Ficedula albicollis): Conserved synteny but gene order rearrangements on the avian Z chromosome. Genetics 2006, 174, 377–386. [Google Scholar] [CrossRef] [PubMed] [Green Version]
  69. Itoh, Y.; Kampf, K.; Arnold, A.P. Comparison of the chicken and zebra finch Z chromosomes shows evolutionary rearrangements. Chromosome Res. 2006, 14, 805–815. [Google Scholar] [CrossRef]
  70. Nanda, I.; Schmid, M. Conservation of avian Z chromosomes as revealed by comparative mapping of the Z-linked aldolase B gene. Cytogenet. Genome Res. 2002, 96, 176–178. [Google Scholar] [CrossRef]
  71. Xu, L.; Zhou, Q. The Female-Specific W Chromosomes of Birds Have Conserved Gene Contents but Are Not Feminized. Genes 2020, 11, 1126. [Google Scholar] [CrossRef]
  72. Bachtrog, D. The temporal dynamics of processes underlying Y chromosome degeneration. Genetics 2008, 179, 1513–1525. [Google Scholar] [CrossRef] [Green Version]
  73. Suh, A. The specific requirements for CR1 retrotransposition explain the scarcity of retrogenes in birds. J. Mol. Evol. 2015, 81, 18–20. [Google Scholar] [CrossRef]
  74. Abrahams, J.P.; Leslie, A.G.; Lutter, R.; Walker, J.E. Structure at 2.8 A resolution of F1-ATPase from bovine heart mitochondria. Nature 1994, 370, 621–628. [Google Scholar] [CrossRef] [PubMed]
  75. Uebbing, S.; Künstner, A.; Mäkinen, H.; Ellegren, H. Transcriptome sequencing reveals the character of incomplete dosage compensation across multiple tissues in flycatchers. Genome Biol. Evol. 2013, 5, 1555–1566. [Google Scholar] [CrossRef] [PubMed] [Green Version]
  76. Wang, N.; Braun, E.L.; Kimball, R.T. Testing hypotheses about the sister group of the passeriformes using an independent 30-locus data set. Mol. Biol. Evol. 2012, 29, 737–750. [Google Scholar] [CrossRef] [PubMed] [Green Version]
  77. Berv, J.S.; Field, D.J. Genomic Signature of an Avian Lilliput Effect across the K-Pg Extinction. Syst. Biol. 2018, 67, 1–13. [Google Scholar] [CrossRef] [Green Version]
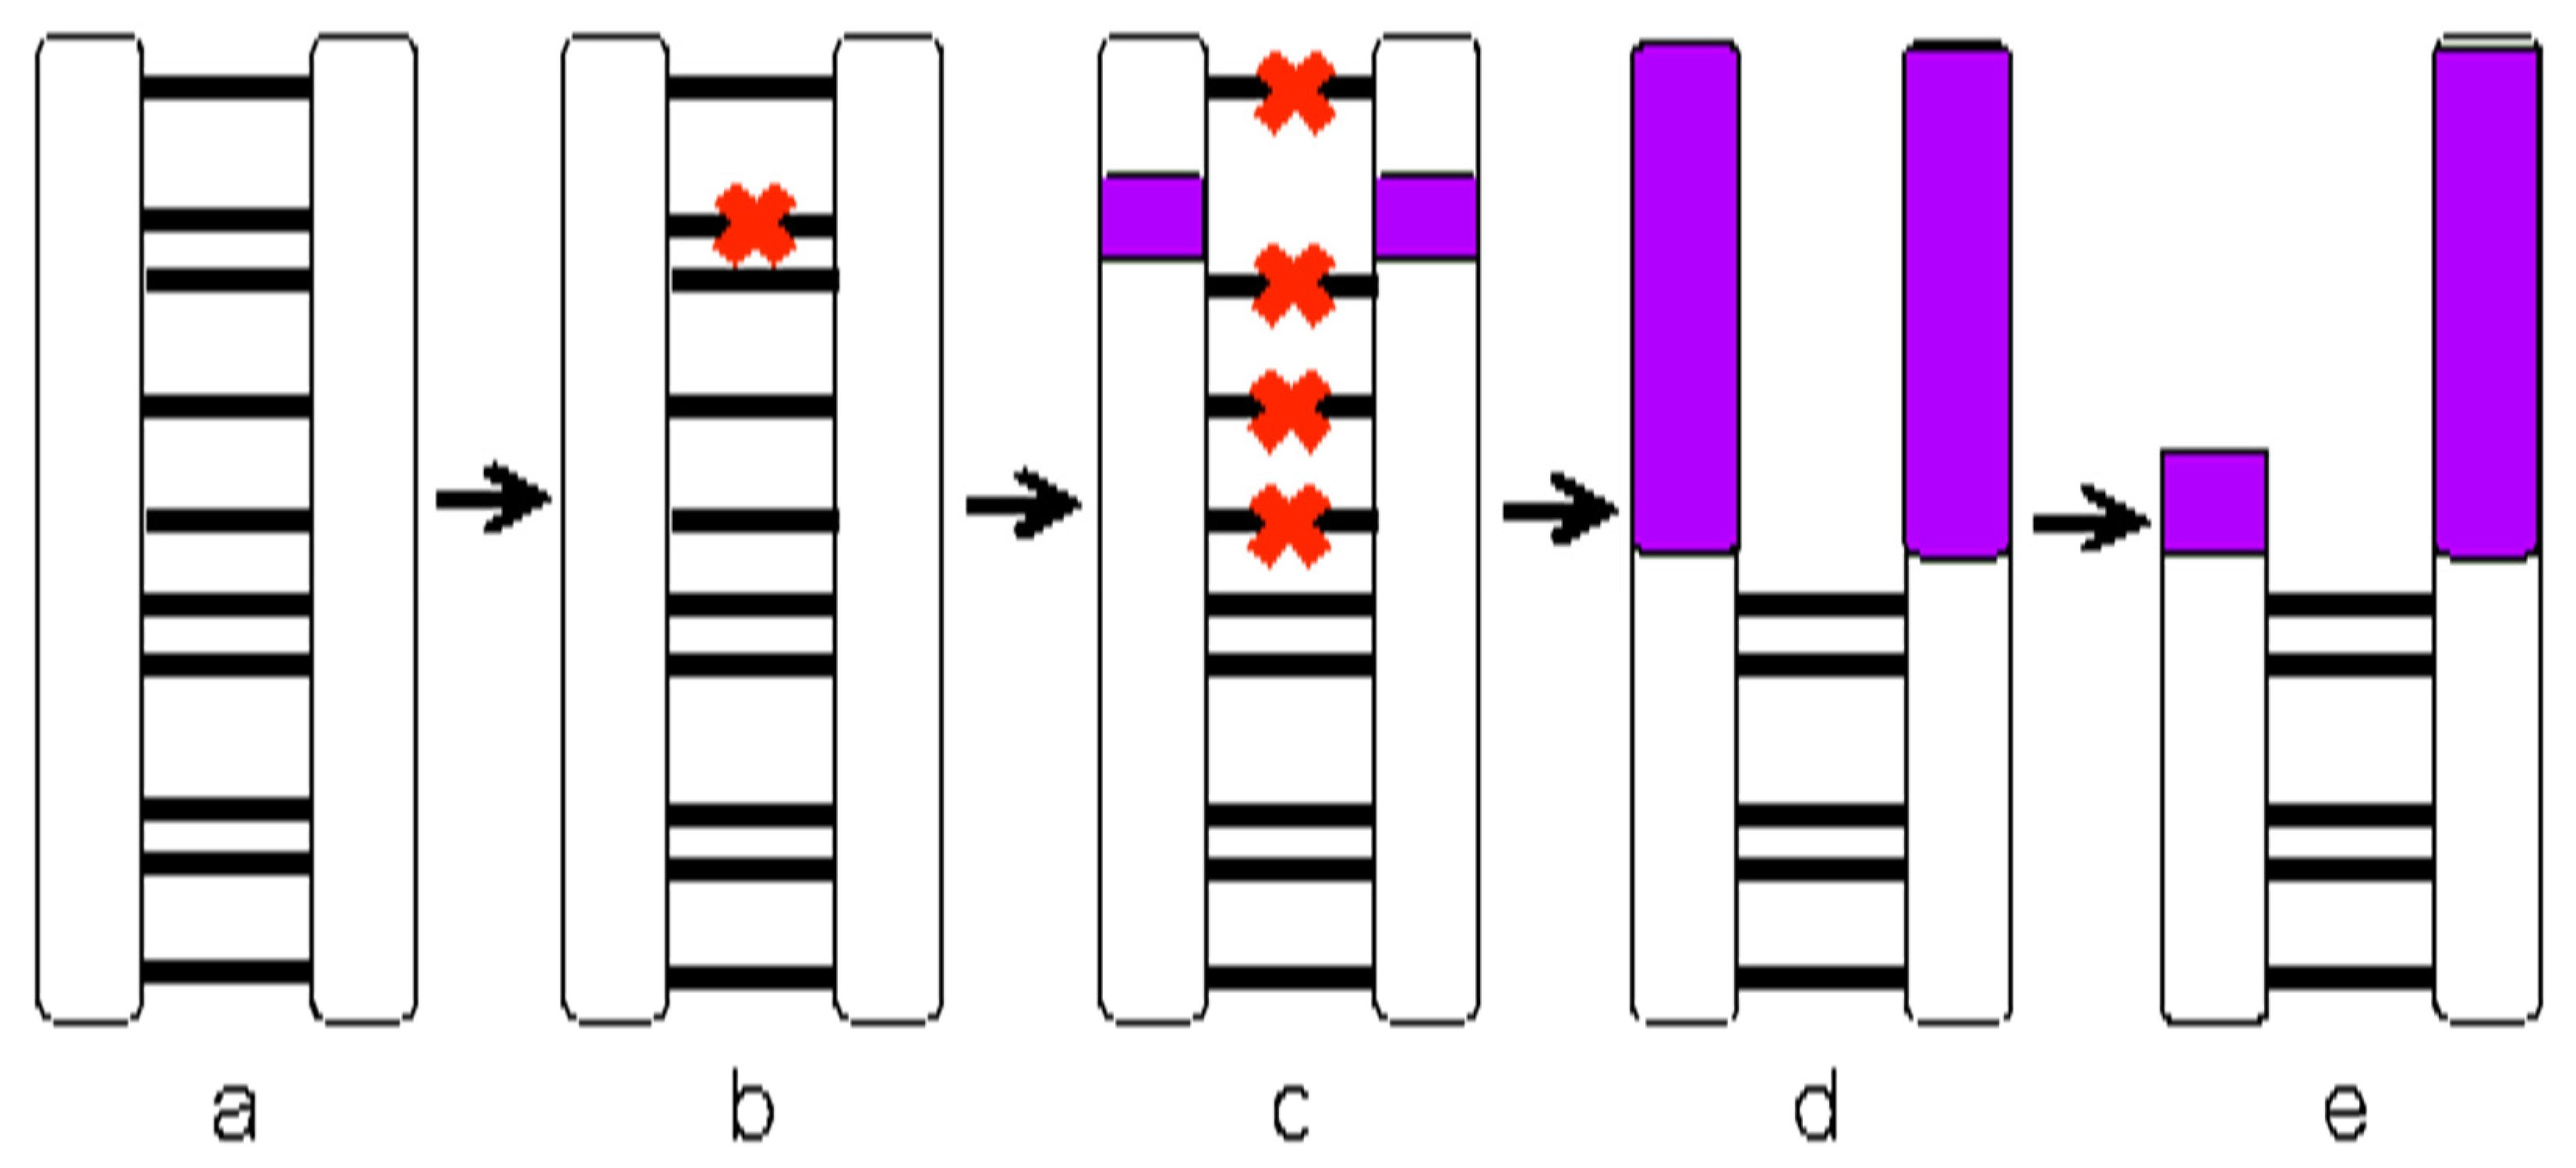
Figure 1. Steps in the evolution of heteromorphic sex chromosomes. White segments of chromosomes indicate that recombination is occurring, while purple areas have ceased recombination and the chromosomal segments are evolving independently. (a) Autosomes that fully recombine, (b) recombination at a locus (red X) is selected against, (c) leading to a loss of recombination, (d) over time, additional loss of recombination may occur, possibly with changes in gene content and structure, and (e) finally there may be potential loss of some genetic material from one chromosome. At all steps, part of the chromosome continues to recombine to allow pairing during meiosis.
Birds 03 00004 g001
Figure 2. Interpretation of results to assess when there have been barriers to recombination. For taxa a, b, and c, there was a barrier to recombination prior to the divergence of these three taxa. For taxon d, there has been a barrier to recombination but it is not shared with other taxa. For taxon e, only one sequence was identified, so sample not included in final analyses. For taxon f, it is not clear if there has been a recent barrier to recombination, or if alleles are still recombining, so the assignment to the Z and W chromosome is uncertain (noted by the “?” following the Z or W). For taxon g, the limited analyzed data have been unable to reconstruct this as a clade, but the divergence between gametologs suggests that recombination has also ceased in the history of that species.
Birds 03 00004 g002
Figure 3. Maximum likelihood estimate of the ATP5F1A gene tree from 50 samples (representing 49 species based on the IOC world bird list v. 11.2 [49]). Samples collected using PCR and cloning as part of this study have A or B following the species name (since we could not a priori assign gametologs to the Z or W chromosome). Species names followed by “chr” and then Z, W, or Un are from the chromosomal-level genome with the designation (Z, W, or unplaced) based on annotation in NCBI. If this is followed by “TE” the sequence contained a transposable element insertion. Species names followed by Z or W and then either Carmichael et al. [41] and Suh et al. [22] are from those published studies with the Z and W designation determined by those authors. Colors identify major clades, and are those used in Braun and Kimball [66]. (a) Sequences from many species in Neoaves, including all Passeriformes; (b) remaining Neoaves and all Galloanserae.
Birds 03 00004 g003aBirds 03 00004 g003b
Figure 4. Avian phylogenetic relationships among Neognathae (based on Kimball et al. [67] and using the IOC world bird list v. 11.2 [49]) showing estimated barriers to recombination at the ATP5F1A locus. Red bars on branches indicate cases where gametologs are clearly distinct. Gray bars are cases where gametologs are similar, but based on Suh et al. [22] may have ceased recombining. For three species (White-tailed Tropicbird, Phaethon lepturus, Lesser Flamingo, Phoeniconaias minor and Brown Pelican, Pelecanus occidentalis), we suggest that recombination may be occurring. Colors identify major clades and are those used in Braun and Kimball [66].
Birds 03 00004 g004
Figure 5. Maximum likelihood branch length estimates of ATP5F1A protein sequences using a topology that maximizes congruence with the best estimate of the species tree [67] (using the IOC world bird list v. 11.2 [49]) and places the recombination blocks in positions compatible with the intronic tree. These branch lengths were estimated using the MamXB model and numbers of exposed and buried substitutions on each terminal branch are presented to the right of each taxon. Colors identify major clades, and are those used in Braun and Kimball [66]. The maximum likelihood topology with ultrafast bootstrap support is presented in Supplementary Figure S1.
Birds 03 00004 g005
Table 1. Numbers of samples and orders examined for each data method. Total refers to all samples considered, “Included” are those used in analyses and “Excluded” are those where it was not clear whether two gametologs had been identified, and so these were not included in the analyses. See Supplementary Files S1 and S2 for full data. “PCR/cloning” refers to samples we amplified using PCR and cloned to identify gametologs. “Genomes” refers to chromosomal-level assemblies of females that were examined for presence of Z and W sequences. “Published” refers to sequences from Carmichael et al. [41] and Suh et al. [22] that were downloaded from GenBank.
TotalIncludedExcluded
Method# Orders# Species# Orders# Species# Orders# Species
PCR/cloning203014171013
Genomes1332102557
Published686800
Combined2569 12249 11320
1 One species was sampled using both PCR/cloning and from a genome.
Publisher’s Note: MDPI stays neutral with regard to jurisdictional claims in published maps and institutional affiliations.