Article

Bird Assemblages in a Peri-Urban Landscape in Eastern India

by
Ratnesh Karjee
1,
Himanshu Shekhar Palei
2,*,
Abhijit Konwar
1,
Anshuman Gogoi
1 and
Rabindra Kumar Mishra
1
1
Department of Wildlife and Biodiversity Conservation, Maharaja Sriram Chandra Bhanjadeo University, Baripada PIN-757003, Odisha, India
2
Aranya Foundation, Plot No-625/12, Bhubaneswar PIN-751019, Odisha, India
*
Author to whom correspondence should be addressed.
Birds 2022, 3(4), 383-401; https://doi.org/10.3390/birds3040026
Submission received: 20 September 2022 / Revised: 11 November 2022 / Accepted: 12 November 2022 / Published: 18 November 2022
(This article belongs to the Special Issue Feature Papers of Birds 2022–2023)

Abstract

:

Simple Summary

Globally, biodiversity is adversely affected by urbanization. To explore the effect of urbanization on bird diversity in the peri-urban landscape, we surveyed four different habitats and three seasons in Baripada, Odisha, India, using point counts along the transects between February 2018 to January 2019. During the survey, 117 bird species with a total of 6963 individuals were found in the study area, belonging to 48 families and 98 genera, with cropland areas showing the most avian diversity. Among seasons, we observed the highest bird species richness in winter and the highest similarity of species richness in monsoon and summer. Finally, our research found that agricultural landscapes play important roles in preserving bird diversity in urban landscapes. Our study can help local governments with urban planning and habitat management while preserving local biodiversity, including birds.

Abstract

Urbanization plays an important role in biodiversity loss across the globe due to natural habitat loss in the form of landscape conversion and habitat fragmentation on which species depend. To study the bird diversity in the peri-urban landscape, we surveyed four habitats—residential areas, cropland, water bodies, and sal forest; three seasons—monsoon, winter, and summer in Baripada, Odisha, India. We surveyed from February 2018 to January 2019 using point counts set along line transects; 8 transects were established with a replication of 18 each. During the survey, 6963 individuals of 117 bird species belonged to 48 families and 98 genera in the study area, whereas cropland showed rich avian diversity. Based on the non-parametric multidimensional scale (NMDS) and one-way ANOVA, bird richness and abundance differed significantly among the habitats. Cropland showed higher species richness than other habitats; however, water bodies showed more abundance than others. The similarity of bird assemblage was greater between residential areas and cropland than forest and water bodies based on similarity indices. Among seasons, we observed the highest bird species richness in winter and the highest similarity of species richness in monsoon and summer. In conclusion, our study reported that agricultural and degraded landscapes like cropland play important roles in conserving bird diversity in peri-urban landscapes. Our findings highlighted and identified the problems that affect the local biodiversity (e.g., birds) in the peri-urban landscape. It can assist the local government in urban planning and habitat management without affecting the local biodiversity, including birds.

1. Introduction

Across the tropics, one of the most significant human impacts on natural and rural areas is urbanization [1]. Urban growth may result in habitat loss and fragmentation, isolating native species genetically or demographically and reducing biodiversity [2]. Species abundance and composition can be affected by modifying the structure and function of urban space due to the continuous growth of the urban habitat [3]. Urbanization and biodiversity showed an inverse relationship, i.e., more green space encouraged high biodiversity and vice-versa [4]. The complexity of physical, ecological, and social elements in urban areas increases the challenge of conserving and managing biodiversity [5]. Birds have long been considered bioindicators of urbanization’s effects on biodiversity among wildlife groups [6,7]. As a result of replacing natural habitats with built-up areas, urbanization has led to the extinction of birds [8,9]. There has been evidence that urbanization causes an increase in exotic species and a reduction in native species diversity [8,10]. However, urban areas are also inhabited by threatened plant and animal species [11]. Various studies have found that the size of urban green spaces contributes significantly to the richness, density, and variety of bird species in urban habitats [12,13].
Habitat destruction and human disturbances decrease avian species’ diversity and force them to inhibit in urban areas [14,15]. In India, the wild lands are facing tremendous anthropogenic pressure [16], which significantly impacts the structure of the avian community [17,18], as they use seeds, plants, insects, and other vertebrates or invertebrates in their diet [19]. However, the overall community structure of birds in any landscape can be assessed by monitoring the species richness and abundance on a spatio-temporal scale [14]. Such management practices may explain the role of environmental limiting parameters and anthropogenic factors’ interaction in determining the diversity and density of avifauna [20]. Habitat loss and fragmentation due to anthropogenic pressures are primary drivers of global biodiversity decline [21,22]. Forest fragmentation occurs when large, continuous forests are divided into smaller blocks by roads, clearing for agriculture, urbanization, and other human activities. Urban development for residential, commercial, and industrial properties’ was undeniably the most damaging, persistent, and rapidly expanding form of anthropogenic pressure [23,24].
There is a critical relationship between bird diversity and various environmental factors. Many studies discovered the mixture of bird diversity in various habitats like urban and rural habitats, farmland, and forest habitats [25,26,27,28,29,30]. It is predicted that by the year 2050, most of the global population of birds will inhabit the urban landscape [31]. Farmland, pastureland, and urban areas are important bird habitats as they hold much wildlife outside the protected areas [28,30]. Urban habitats encourage bird populations in cities and their surroundings; however, the urbanization process, like landscape conversion, is a great threat to the bird population [15,32]. The growing human population and rapid landscape transformation for urban uses threaten biodiversity [33].
We aimed to study the effect of urbanization on bird species diversity and richness in the peri-urban landscape of Baripada, Odisha, India. The study also examined the effect of different habitats, viz. residential areas, cropland, water bodies, and forest area, and seasons on avian diversity and richness. We hypothesized that habitat heterogeneity describes significant differences in species diversity and richness. Because of the presence of more microhabitats and away from the urban center, we predicted that the variety of bird assemblages might be higher in cropland habitats than in other habitats.

2. Materials and Methods

2.1. Study Area

This study was carried out in Baripada, which lies between 21.90°–21.96° N and 86.71°–86.78° E. It is located in the Chotanagpur Plateau Region of Odisha, Eastern India, with an altitude of 45 m a.s.l (Figure 1). It has a tropical climatic condition that experiences an extremely hot and humid summer (45 °C) followed by a humid monsoon (30 °C) and chilling winter (10 °C) with an annual temperature of 30 °C. The winter season is observed between November to February. After that, summer continues from March to June, followed by the monsoon season from July to October, with an annual mean rainfall of 1800 mm. The city area is spread over approximately 30 km2, with a population of 116,874 (Census of India 2011). The study area consists of diverse habitats, such as highly urbanized residential and commercial complexes, agricultural lands, and woodlands. The dominant vegetation in urban and suburban areas include Ficus benghalensis, Ficus religiosa, Magnifera indica, Azadirachta indica, Aegle marmelos, Tamarindus indica, etc. In forest areas, the vegetation is dominated by Shorea robusta, Terminalia bellirica, Cassia fistula, Suzygium cumini, Bombax ceiba, etc. Invasive shrubs such as Chromolaena odorata and Lantana camara are spread in natural vegetation patches as well as urban green spaces. The agricultural lands present in this area are used only once a year to cultivate paddy, i.e., from July to December, and the rest of the year, it remains abandoned. Our study focused on Baripada and its outskirts surrounded by woodlands and agricultural lands with human interference [34].
We selected four habitat types for bird sampling in a peri-urban landscape of Baripada, two transects in residential areas (RA), two in water bodies (WB), two in Sal (Shorea robusta) forest habitats (SF), and two in cropland habitats (CL) (Figure 1 and Figure 2, Table 1).

2.2. Field Survey and Avifaunal Sampling

We studied bird diversity and abundance from February 2018 to January 2019 in the study area using point counts set along line transects [35], following an approach comparable to that used in other large-scale bird surveys [36]. A total of 8 transects (2 transects in each habitat) were established, with 18 replications in each transect to obtain a spatially homogenous distribution (Figure 1 and Figure 2, Table 1). The total length of all transects was 5 km (0.62 mean; SD ± 0.20 km, 0.40–1.1 km range) long (Figure 2, Table 1). They were demarcated before surveys using 1:25,000 topo maps, aiming to obtain a sufficient length route as linear and continuous as possible. Within each transect at each habitat, we established permanent sampling points (Number of sampling points depending upon the length of the transect) for the bird count. In each transect, the first sampling point coincided with the beginning of the transect; all the other points were set 200 m apart. This spacing was considered sufficient to avoid double counts [37]. In all, 25 sampling points were established in the study area, with 6 being in residential areas, 8 near water bodies, 5 in cropland, and 6 in sal forest habitat. In the water body habitat, the line transects, and sampling points were established at the edge of the reservoir. Waterbird ground counts are conducted in accordance with generally accepted standards in the field [3]. Bird species detectability may differ between species and habitats; therefore, we recorded birds within a circle of a 50 m radius around the observer for a specific period (10 min) at each sampling point [38,39,40]. We did not count birds observed between sampling points. Birds earlier recorded in the sampling points were not included in other sampling points of the transect. Overflying birds were not included, as they could only be moving through or above the surveyed habitat. Birds were counted only if they showed evidence of using the habitat. The counting of avian species was conducted during the bird’s peak activity (up to 3 h after sunrise) and in the early morning after the sun rises [38,39]. Two observers with similar training levels walked along the transects and recorded birds in sampling points. Observations of birds were not made in adverse weather conditions. Every month we established two counts in each transect at each site except for the month of January, May, June, July, August, and November (only a single count for each site and transect).

2.3. Nonparametric Richness Estimation

Bird diversity was assessed in terms of species richness and total abundance, considering the total number of species observed per site. We plotted a species accumulation curve to evaluate whether the number of bird species sampled was representative of the bird community. Individual-based rarefaction curves were used to compare species richness at the habitat and season levels.

2.4. Species Richness, Diversity, and Abundance

Species richness is estimated as the number of bird species present in a particular habitat and season.
Shannon’s diversity index (H′) was calculated by multiplying the proportion of each species by their natural log as:
H′ = Σpilog(ln)pi
Here pi is the proportion (n/N) of individuals of a particular species found (n) divided by the total number of individuals recorded (N), ln is the natural log, and Σ is the sum of the calculations.
Similarly, to understand the dominant species within the community, the Simpson diversity index (D) was calculated by using the formula:
D = 1 − Σn (n − 1)/N (N − 1)
Here n is the total number of birds of a particular species and N is the total number of birds of all species.
The evenness of bird species compares the similarity of the population size of each species. Evenness Index (J′) was calculated using the ratio of observed diversity to maximum diversity using the equation [41].
J′ = H′/Hmax
Here, H′ is the Shannon–Wiener Diversity index, and Hmax is the natural log of the total number of species. Rank abundance plots were constructed to investigate species abundance distributions between habitats.
Bird abundance was obtained by ranking the species according to their frequencies, and then the proportions of each species were obtained using the equation:
Species abundance = Sn/N
Here, Sn = number of the bird in the reference species and N = Total number of birds.

2.5. Bird Assemblage and Similarity

Four similarity indices were calculated to estimate shared species richness between habitats and different seasons. These included qualitative similarity estimates using the Euclidian distance, Jaccard index, and Morisita–Horn index [41,42].
Moreover, bird richness and diversity similarity were determined using Bray–Curtis similarity or distance index, which is formulated as
BCij = 1 − (2Cij/Si + Sj)
Here i and j are the two habitats, Si and Sj are the total numbers of birds counted on ith and jth and Cij is the only lesser count for each bird species counted in both habitats. In the Bray–Curtis similarity index, a value nearer to 0 means the communities have the same species composition, and a value closer to 1 means no share of any species.
To examine changes in bird functional diversity among different habitats, we classified birds into various guilds based on their diets: carnivorous (C), frugivorous (F), granivorous (G), omnivorous (O), insectivorous (I), and nectarivorous (N). A heat map has been produced to understand the spatio-temporal assemblage of birds’ feeding guild. Although Indian birds have mixed food habits, a simplified food guild based on the predominant food habits of each bird species was followed in this study. The classification of feeding guilds is followed from previous studies [43,44].

2.6. Statistical Analysis

The non-parametric multidimensional scale (NMDS) test was performed to check the significant variation of bird community among the habitats and seasons using the permutation test (999 permutations). After that, a one-way ANOVA test was run to check the variation of birds’ richness and abundance in the study area. Before the ANOVA test, data normality was checked by the Shapiro–Wilk normality test. Again, a multiple comparison Tukey’s test was performed to quantify variation among the habitats and seasons. The statistical analyses were performed in R 4.0.2 statistical data processing packages [45]. Species accumulation curves, diversity indices, rank abundance plots, habitat share Venn diagram, and heatmap were calculated using “BiodiversityR” [46], “VennDiagram” [47], and “superheat” [48] packages.

3. Results

3.1. Species Richness and Diversity

During the survey, 6963 individuals of 117 bird species were recorded belonging to 48 families and 98 genera within the four different habitats (Appendix A). Of these, 85.83% are the resident species (103 bird species), while 9.17% (11 bird species) are winter migrants and the rest are summer visitors (three bird species). The highest bird richness was observed in CL (64 species; evenness J′ = 0.91), followed by RA (56 species; evenness J′ = 0.90) and SF (54 species; evenness J′ = 0.88) (Figure 2). The WB represents the lowest species richness (37 species; evenness J′ = 0.78). The individual-based rarefied richness curve of bird species reached an asymptote for all habitats, indicating that the sampling effort was sufficient (Figure 3). The maximum value of the Shannon–Wiener Index was recorded in CL (H′ = 3.79), followed by RA (H′ = 3.63), SF (H′ = 3.51), and lowest in WB (H′ = 2.84). The value of Simpson’s index of CL scored highest (D = 0.97), followed by RA (D = 0.96), SF (D = 0.95), and WB (D = 0.90).
Seasonally, winter harbored the highest richness (111 bird species; J = 0.85), followed by summer (106 bird species; J = 0.88) and monsoon (94 bird species; J = 0.88). However, summer exhibited maximum diversity (H′ = 4.10), followed by winter (H′ = 4.02) and monsoon (H′ = 4.02). Moreover, we found that summer and winter shared equal values of the Simpson index (D = 0.97), while winter showed lower values (D = 0.96).
The NMDS results (non-metric fit, R2 = 0.936, linear fit, R2 = 0.695, stress = 0.252) showed that bird communities were significantly varied among habitats (MAST, F = 17.50, DF = 3, R2 = 0.272, p = 0.001) (Figure 4). In addition, one-way ANOVA suggested that there was a significant variation in bird richness (F = 14.23, DF = 3, p < 0.001; F = 9.26, DF = 2, p < 0.001) and abundance (F = 6.58, DF = 3, p < 0.001; F = 16, DF = 2, p < 0.001) among habitats and seasons, respectively (Figure 5a,b and Table 2). Similarly, Tukey’s HSD test for multiple comparisons also showed significant variation in bird richness and abundance among habitat and season, which are available in Table 2.

3.2. Bird Rank-Abundance

A total of 6963 individual birds were counted, including 1992 in WB (28.61%), 1912 in RA (27.46%), 1760 in CL (25.28%), and 1299 in SF (18.66%) (Figure 6). Lesser Whistling Duck (Dendrocygna javanica), Rock Dove (Columba livia), Cattle Egret (Bubulcus ibis), and Chestnut-tailed Starling (Sturnia malabarica) were the dominating species for WB, RA, CL, and SF, respectively (Figure 6). Bird abundance was higher in winter, with 2957 individuals, followed by summer (2026 individuals) and monsoon (1980 individuals). Moreover, Lesser-whistling Duck was the most dominant individual in winter (364 individuals), followed by Cattle Egret in both summer (127 individuals) and monsoon (118 individuals).

3.3. Similarity and Shared Species Richness

In our study, we recorded nine bird species Asian Pied Starling (Gracupica contra), Black Drongo (Dicrurus macrocercus), Common Myna (Acridotheres tristis), Citrine Wagtail (Motacilla citreola), Green Bee-eater (Merops orientalis), Red-vented Bulbul (Pycnonotus cafer), Red-whiskered Bulbul (Pycnonotus jocosus), Shikra (Accipiter badius), and Spotted Dove (Spilopelia chinensis) which are found in all habitats. The highest bird richness was shared between RA and CL, with a total of 39 species, followed by CL and SF, with 25 species. SF and WB shared very low bird species (S = 13) (Figure 7). Bray–Curtis (BC) and Jaccard Indices (JI) suggested that there were higher dissimilarities between WB and SF (BC = 0.87) and higher similarities between RA and CL (JI = 0.42). Morisita–Horn Index (MH) also revealed that the compositional similarity of birds is higher between RA and CL (MH = 0.73), followed by RA and SF (MH = 0.57), and SF and CL (MH = 0.52). The Euclidian distance index (EU) also suggested a higher similarity between RA and CL (EU = 256), followed by CL and SF (EU = 258). In contrast, RA and WB exhibited higher dissimilarity (EU = 687), followed by WB and SF (Table 3). Among seasons, the highest similarity of species richness was observed in monsoon and summer (EU = 121.30, BC = 0.18, MH = 0.94, JI = 0.87), followed by winter and summer (EU = 362.92, BC = 0.27, MH = 0.75, JI = 0.86), and winter and monsoon (EU = 376.30, BC = 0.29, MH = 0.72, JI = 0.83).

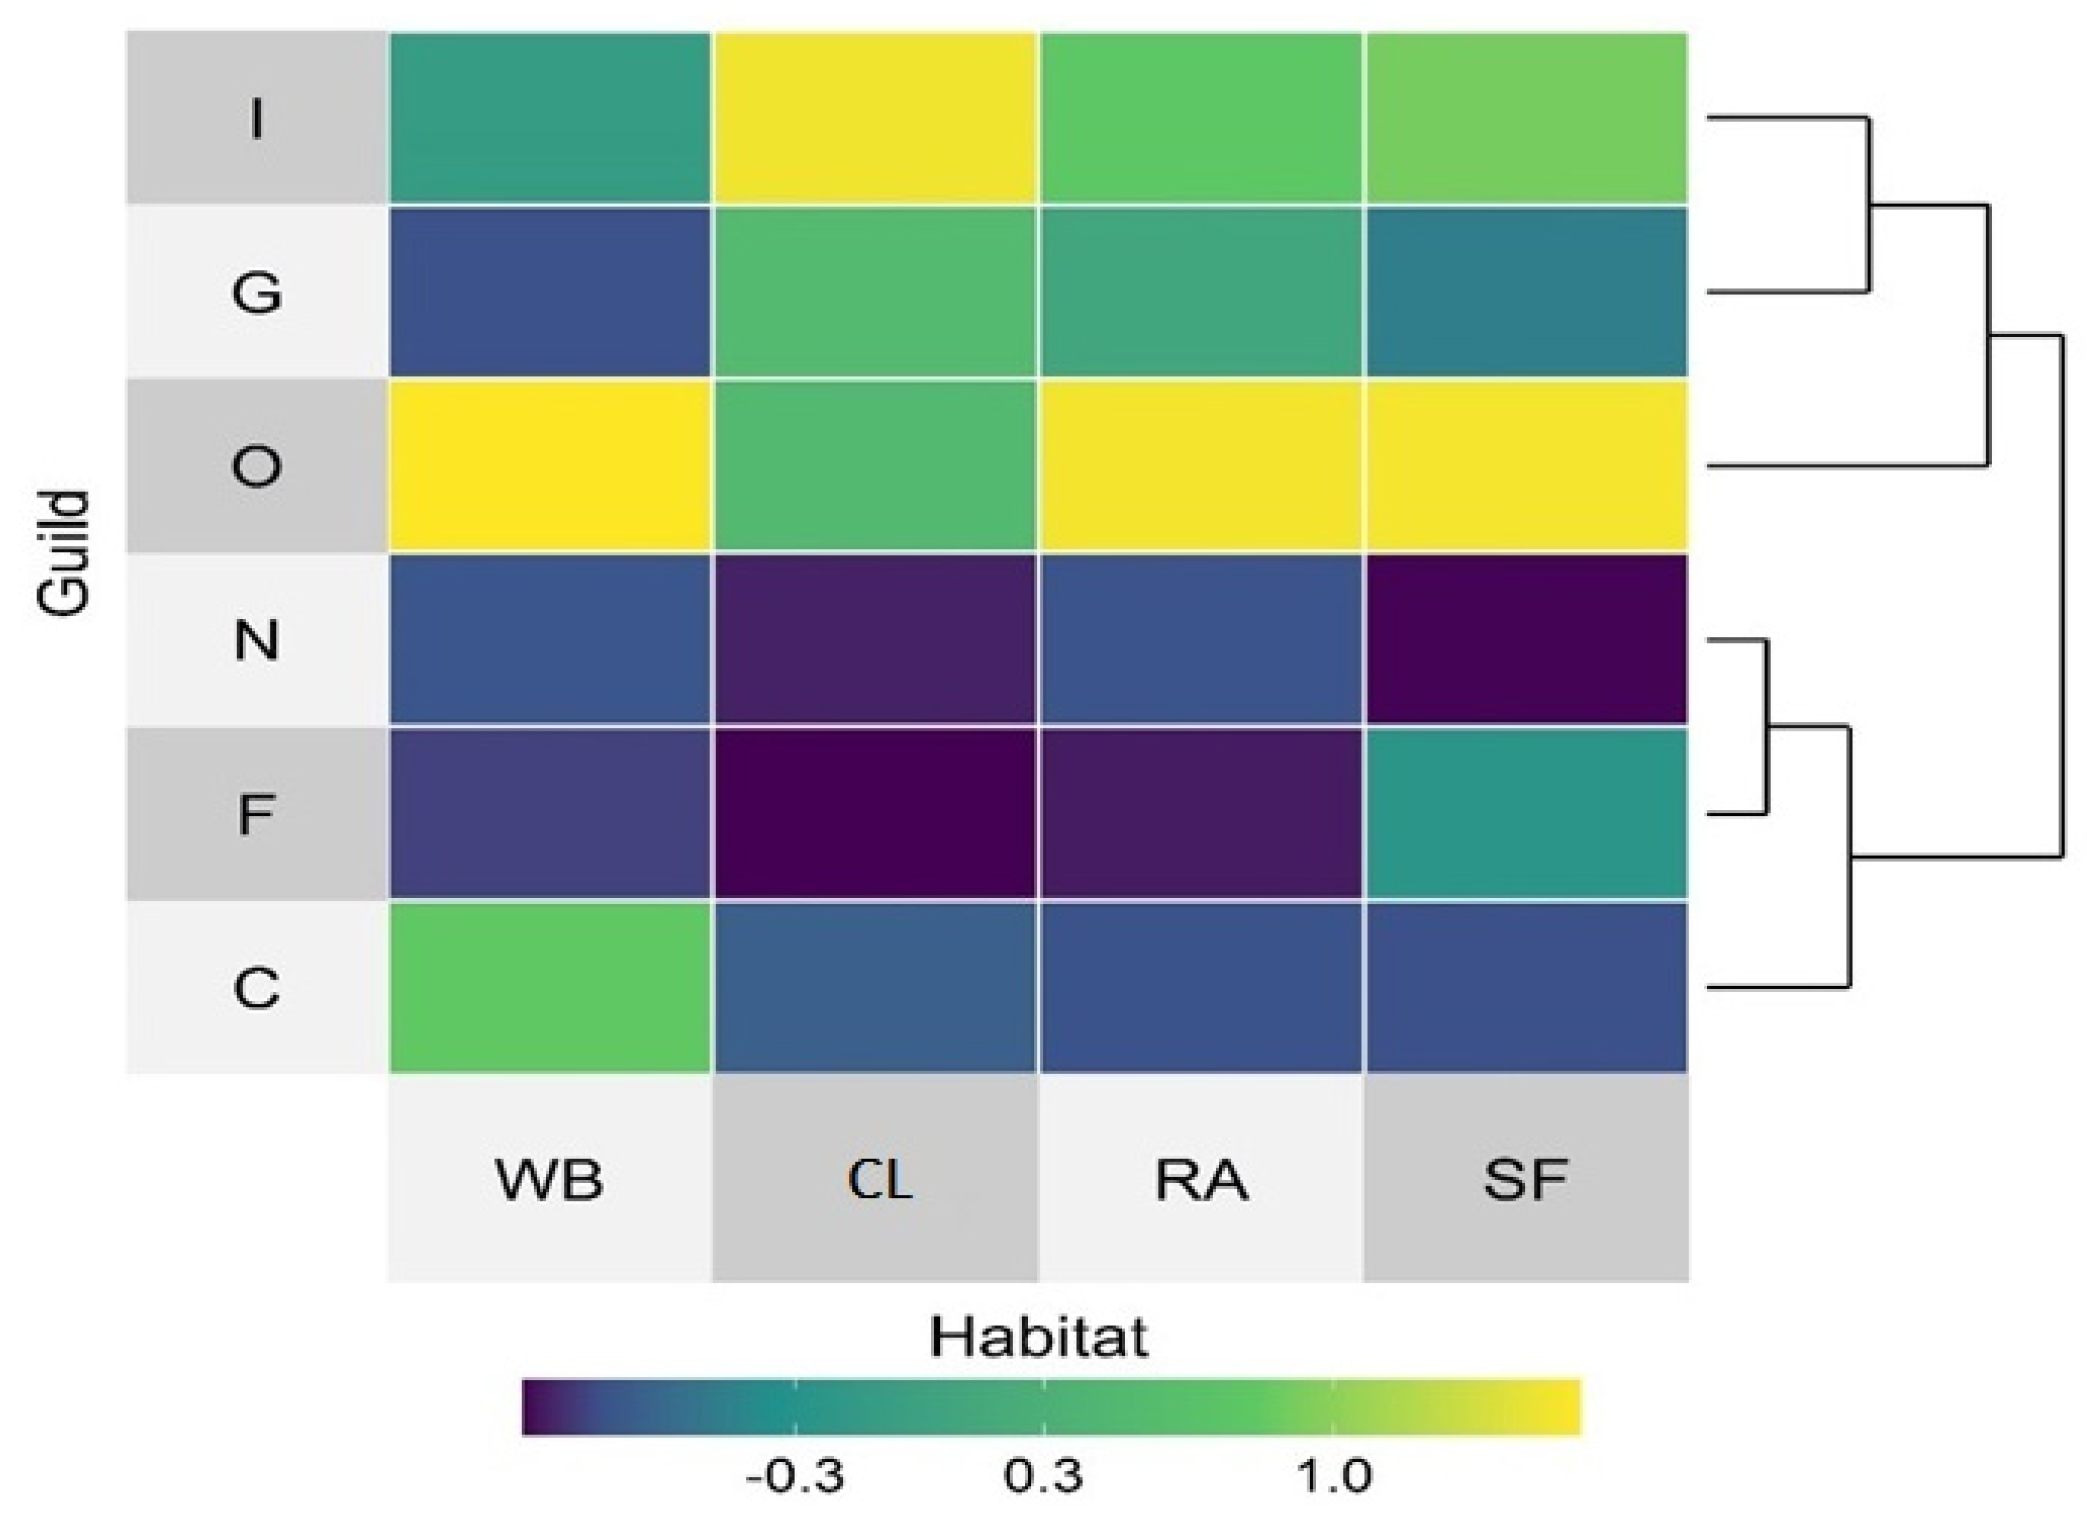
3.4. Feeding Guilds and Functional Diversity

Out of a total of six feeding guilds of birds observed, the richness of insectivores (49 species; 41.9%) dominates the others, followed by omnivorous (27 species; 23.1%), carnivorous (22 bird species; 18.8%), granivorous (10 bird species; 8.5%) and frugivorous (7 bird species; 6%) (Figure 8). Only two species of nectarivorous feeding birds (Purple Sunbird Cinnyris asiaticus; Purple-rumped Sunbird, Leptocoma zeylonica) were observed. However, the individual counting of each feeding guild shows that O represents the highest numbers (38.82%), followed by I (27.69%), C (13.54%), G (12.80%), F (4.09%), and N (3.06%), respectively. A hierarchical dendrogram cluster exhibited similarity between the guild and guild composition in our study area (Figure 9).

4. Discussion

Our findings confirm our prediction that cropland supports the high diversity and richness of bird species. Worldwide, it is accepted that certain bird species favor cropland habitats considering that about one-third of the world’s bird population occasionally stays in such a habitat [49,50]. For example, good management of crop fields and mosaic of micro-landscape provides food resources to promote higher bird richness [25] and agricultural habitat harboring a significant proportion of the birds’ community [51]. Studies found that cropland is used as a stopover habitat by migratory bird species [52,53]. A study from Poland reported that bird density and richness depend on the heterogeneity of the agricultural landscape [54]. In addition, some non-crops patches between the cropland support large bird numbers compared to land use diversity [55]. Furthermore, a report from Southern China suggested that bird richness significantly increased when herbaceous vegetation covers grew primarily in farmland [56]. However, in some cases, intensified agricultural production may affect farmland biodiversity. For example, after receiving new membership in the European Union, farmland bird diversity declined due to intensified agricultural activities in some European countries [57].
We found that bird richness and abundance significantly varied across the season. The change in richness and abundance of birds depends on the presence of abundant species that visit the area in different seasons [58]. Several studies argued that variations in rainfall and temperature affect the availability of food resources for birds and influence bird populations [58,59,60]. Sometimes, the numbers of migratory birds are maximum compared to resident birds during the migratory season affecting the bird richness and abundance [61,62]. In our study, we observed that the bird abundance was higher in winter, probably, due to the large gathering of numerous local migratory birds (e.g., Lesser-whistling Duck). Additionally, omnivorous birds were the most abundant guild compared to other guilds across the season due to their flexibility in utilizing natural resources and food [63].
Avian species shared the highest similarities among cropland and residential areas. Many bird species could be found supporting different feeding guilds in these two habitats because of the abundant food sources, accompanied by several insect prey species attracted to the crops [64,65,66]. Residential areas shared the similarity in abundance with cropland, which implies the component of generalist birds in the study area. The mosaic of a variety of tree covers, small water bodies, bamboo grooves, and grasses around cropland areas makes a more productive heterogeneous landscape that allows it to sustain various bird species [67,68]. However, a comparison between residential areas and forest areas showed that the diversity and richness are higher in residential areas, possibly due to habitat loss in forest areas which forced the bird species to inhibit in residential areas [14]. It is likely that well-vegetated urbanization provides bird species with refuge, nesting sites, and food sources. Studies have shown that species numbers decline with urbanization, and highly abundant species dominate the remaining species group [69,70,71,72]. In monoculture, sal-dominated forest habitats may have low fruit and flowering trees, while residential areas have parks and roadside fruit trees like banyan (F. benghalensis), peepal (F. religiosa), and jamun (Syzygium cumini), etc., in residential areas. Birds’ diversity increased with the increase in natural woodlands; however, their diversity decreased with an increase in commercial monoculture forests [56]. In our case, we also noticed that bird diversity in sal forest was less than in residential and cropland. Probably, it is due to its dominant monoculture habitat. Likewise, small and isolated forest fragments in urban areas fail to sustain a greater diversity of birds [73].
Water bodies allowed the highest number of birds, and their abundance revealed that water bodies significantly differed from other habitats in our study area. The abundance of birds was higher in water bodies because of the large number of gathering colonial water birds like Lesser Whistling Duck (Dendrocygna javanica), Indian Pygmy Goose (Nettapus coromandelianus), Asian Openbill (Anastomus oscitans), etc. Birds are abundant in this habitat because of some environmental characteristics of wetlands or water bodies, like size, depth, water level, and plant species [74]. A study from Malaysia revealed that water-bird diversity, distribution, and abundance are greatly influenced by the composition and structure of vegetation and microclimatic variables. In addition, it explained that birds are adapted to a distinct set of microhabitats and microclimatic conditions [75].
The bird richness of the residential area does not exhibit any significant differences from cropland. However, total bird counts (abundance) in this habitat significantly differ from sal forest. Certain kinds of birds (e.g., House Crow Corvus splendens, Common Myna Acridotheres tristis, House sparrow Passer domesticus) were encouraged by urban resources. Møller [76] reported several characteristics of bird species that have adapted to urban habitats, including large breeding ranges, a high tendency to disperse, a high rate of feeding innovation (new ways of acquiring food), and a short breeding cycle. In addition, they have a high adult survival rate and a short flight distance when approached by humans. They are likely to be more exploitative and aggressive and can adjust to this urban environment by taking advantage of the anthropological resources [77,78,79]. A similar pattern is found in other cities in different countries [70,71,72,80,81,82,83].
Our study observed that the insectivorous are the richest feeding guild, followed by omnivorous, carnivorous, granivorous, frugivorous, and nectarivorous. Insectivorous species richness has been found to coincide with food availability in agricultural and residential habitats [33,63,84]. Several studies have indicated that some groups of arthropods are more abundant in cropland and urban areas, including generalist ground arthropods, plant-feeding arthropods, and generalist pollinating and jumping spiders, so it may be this factor that has led to a predominance of insectivorous species [85,86,87,88,89]. However, the insectivore group did not show higher abundance in terms of the guild, which indicating reduced in their numbers, especially in residential areas, probably due to anthropogenic disturbances such as air pollution and low vegetation cover [71,90,91]. Omnivores are the second most rich-feeding guilds. Again, they have a wildly distributed guild because omnivores have an affinity to utilize natural resources and food [63]. Our study also supported that they extend themselves in urban areas with high numbers in both spatial and temporal gradients [82,92,93]. Granivorous and omnivorous tend to colonize the degraded agricultural landscape [94]. However, our study explained that only granivorous showed colonization in the mosaic landscape of cropland. In contrast, omnivores showed maximum colonization in water bodies, followed by residential and sal forest areas. The colonization of granivorous in cropland because the open habitats provide abundant seed grain [95,96]. Fruiting plants are regulated by frugivorous birds [63,97]. We observed that the abundance of frugivorous birds is higher in forest areas than in residential areas because of the high fruit plant diversity, such as Janum (Syzygium cumini), Kendu (Diospyros melanoxylon), etc., scattered in this landscape which attracted a large number of fruit-eating birds. Moreover, several studies indicated fruiting trees attract frugivorous birds in urban areas [98,99,100,101].
Nectarivores were preferably low in number compared to other guilds. They prefer open habitats and are regulated by flowering plants during the blooming season [102]. We witnessed that their numbers were comparatively higher in residential areas than in other areas because nectarivores were regulated by the blooming of banana (Musa sp.), papaya (Carica papaya), and Hibiscus sp. and Lantana camara.

5. Conclusions

We observed that the diversity in the habitat regulated the birds’ diversity. Insectivorous birds were the highest feeding guilds, followed by omnivorous and granivorous. The cropland habitat regulated bird feeding guilds and diversity. Therefore, agricultural and degraded landscapes like cropland played an important role in maintaining bird diversity. Therefore, proper urban planning is required to protect bird diversity in the human-dominated landscape.
In eastern India, it is one of the first kinds of study which relied on identifying the bird compositions and diversity across the semi-urban landscape. Our study assessing the role of habitat that influences overall bird abundance, richness, and diversity would not capture differences in environmental factors (biotic and abiotic) requirements of different species/compositions across all habitats. Therefore, adding environmental factors into consideration may help to improve the findings. Further study is required to identify the major spatial and temporal drivers of bird diversity/composition and conservation problems in such developing cities.

Author Contributions

H.S.P. conceived the study. R.K., A.K. and A.G. collected the data. R.K. and H.S.P. performed the analyses. R.K. and H.S.P. wrote the first draft of the paper. A.K., A.G. and R.K.M. revised the manuscript. All authors have read and agreed to the published version of the manuscript.

Funding

This research received no external funding.

Institutional Review Board Statement

Not applicable.

Data Availability Statement

The data presented in this study are available on request from the corresponding author.

Acknowledgments

We are thankful to the Odisha Forest department and administrative authority of Maharaja Sriram Chandra Bhanjadeo University (formerly North Orissa University) for conducting the survey. We would like to thank Russell J. Grey for his technical advice on the use of R software.

Conflicts of Interest

The authors declare no conflict of interest.

Appendix A

Table A1. Checklist and abundance of birds in the study area. NT = Near Threatened, LC = Least Concern, CL = Cropland, RA = Residential Areas, SF = Sal Forest, WB = Waterbodies, F = Frugivorous, G = Granivorous, I = Insectivorous, O = Omnivorous, C = Carnivorous.
FamilyScientific NameCommon NameAbbreviation of Common NameIUCN StatusGuildCLRASFWB
PsittacidaePsittacula eupatriaAlexandrine ParakeetapNTF032150
AlaudidaeEremopterix griseusAshy-crowned Sparrow LarkacslLCG17000
CisticolidaePrinia socialisAshy PriniaaspLCI17000
CuculidaeEudynamysscolopaceusAsian KoelakLCO01160
CiconiidaeAnastomus oscitansAsian Openbill aopLCC2400101
ApodidaeCypsiurus balasiensisAsian Palm SwiftapsLCI7428064
MonarchidaeTerpsiphone paradisiIndian Paradise-flycatcheripfcLCI0080
SturnidaeGracupica contraAsian Pied StarlingapstLCO103822759
SturnidaeAcridotheres ginginianusBank MynabmLCO05300
HirundinidaeHirundo rusticaBarn SwallowbsLCI430028
PloceidaePlocus philippinusBaya WeaverbwLCG41000
Laniidae.Lanius vittatusBay-backed ShrikebbsLCC0090
DirucadaeDicrurus macrocercusBlack DrongobdLCI40373814
EstrildidaeLonchura malaccaBlack-headed MuniabhmLCG36000
AccipitridaeMilvus migransBlack kitebkLCC41504
AccipitridaeElanus axillarisBlack-shouldered KitebskLCC6800
CampephagidaeLalage melanopteraBlack-headed CuckooshrikebhcsLCO0040
OriolidaeOriolus xanthornusBlack-hooded OriolebhoLCO0231611
OriolidaeOriolus chinensisBlack-naped OriolebnoLCO00100
PicidaeDinopium benghalenseBlack-rumped WoodpeckerbrwLCI00120
ColumbidaeColumba liviaRock DoverdLCG9019100
MegalaimidaePsilopogon asiaticaBlue-throated BarbetbtbLCF00130
MeropidaeNyctyornis athertoniBlue-bearded Bee-eaterbbbeLCI0030
TurnicidaeTurnix sylvaticusCommon ButtonquailcbqLCO26000
SturnidaeSturnia pagodarumBrahminy StarlingbstLCO1234370
DirucadaeDicrurus aeneusBronzed DrongobrdLCI313100
JacanidaeMetopidius indicusBronze-winged JacanabwjLCI00081
Laniidae.Lanius cristatusBrown ShrikebrsLCI11300
MegalaimidaePsilopogon zeylanicusBrown-headed BarbetbhbLCF00100
ArdeidaeBubulcus ibisCattle EgretceLCI147118960
MeropidaeMerops leschenaultiChestnut-headed Bee-eaterchbeLCI450240
SturnidaeSturnia malabaricaChestnut-tailed StarlingctsLCO201171210
PhylloscopidaePhylloscopus collybitaCommon ChiffchaffccLCI3700
RallidaeFulica atraCommon CootcctLCO00083
CuculidaeHierococcyx variusCommon Hawk-CuckoochcLCI0230
UpupidaeUpupa epopsEurasian HoopoeehLCI24000
AegithinidaeAegithina tiphiaCommon IoraciLCI00130
AlcedinidaeAlcedo atthisCommon KingfisherckLCC98040
RallidaeGallinula chloropusCommon MoorhencmhLCO08058
SturnidaeAcridotheres tristisCommon MynacmLCO76666457
ScolopacidaeActitis hypoleucosCommon SandpipercspLCI17000
ScolopacidaeGallinago gallinagoCommon SnipecsnLCI120013
CisticolidaeOrthotomus sutoriusCommon TailorbirdctbLCI53500
MegalaimidaeMegalaima haemacephalaCoppersmith BarbetcsbLCF018250
AnatidaeNettapus coromandelianusIndian Pygmy GooseipgLCO000166
AccipitridaeSpilornis cheelaCrested Serpent-EaglecseLCC0050
MotacillidaeMotacilla citreolaCitrine WagtailcwLCI13972
PhylloscopidaePhylloscopus fuscatusDusky WarblerdwLCI01120
ColumbidaeStreptopelia tranquebaricaRed Collared-DovercdLCG10000
ColumbidaeStreptopelia decaoctoEurasian Collared-DoveecdLCG520540
OriolidaeOriolus oriolusEurasian Golden OrioleegoLCO023186
MotacillidaeDendronanthus indicusForest WagtailfwLCI0070
PicidaeDendrocopos maceiFulvous-breasted WoodpeckerfbwLCI00100
CuculidaeCentropus sinensisGreater CoucalgcLCO7570
PicidaeChrysocolaptes guttcristatusGreater Golden-backed WoodpeckerggbwLCI00120
MeropidaeMerops orientalisGreen Bee-eatergbeLCI51816630
CuculidaePhaenicophaeus tristisGreen-billed MalkohagbmLCC0020
MotacillidaeMotacilla cinereaGrey WagtailgwLCI101070
CorvidaeCorvus splendensHouse CrowhcLCO06047
PasseridaePasser domesticusHouse SparrowhsLCG377900
ApodidaeApus nipalensisHouse SwifthswLCI05800
CaprimulgCaprimulgus asiaticusIndian NightjarinjLCI8000
ArdeidaeArdeola grayiiIndian Pond-HeronphLCC2121029
MuscicapidaeSaxicoloides fulicatusIndian RobiniroLCI00210
CoraciidaeCoracias benghalensisIndian RollerirlLCC8000
CuculidaeClamator jacobinusJacobin CuckoojcLCI4700
AccipitridaeAviceda jerdoniJerdon’s BazajbLCC0040
TimaliidaeTuroides striataJungle BabblerjbbLCO275000
SturnidaeAcridotheres fuscusJungle MynajmLCO295700
CampephagidaeCoracina javensisLarge CuckooshrikelcsLCI7900
ArdeidaeArdea albaGreat EgretgeLCC00014
AnatidaeDendrocygna javanicaLesser Whistling DucklwdLCO000461
ArdeidaeEgretta garzettaLittle EgretlegLCC00015
PodicipedidaeTachybaptus ruficollisLittle GrebelgLCC070275
MuscicapidaeCopsychus saularisOriental Magpie-RobinomrLCI02600
AlaudidaeAlauda gulgulaOriental Sky LarkoslLCG26000
ZosteropidaeZosterops palpebrosusOriental White-eyeoweLCO08440
MotacillidaeAnthus rufulusPaddyfield PipitpfpLCI32000
JacanidaeHydrophasianus chirurgusPheasant-tailed JacanaptjLCI00061
AlcedinidaeCeryle rudisPied KingfisherpkLCC0004
CisticolidaePrinia inornataPlain PriniappLCI21900
PsittacidaePsittacula cyanocephalaPulm-headed ParakeetphpLCF00220
NectariniidaeCinnyris asiaticusPurple SunbirdpsbLCN3860015
NectariniidaeLeptocoma zeylonicaPurple-rumped SunbirdprsbLCN2857015
DirucadaeDicrurus paradiseusGreater Racket-tailed DrongolrtdLCI00140
HirundininaeCecropis dauricaRed-rumped SwallowrrswLCI40000
PycnonotidaePycnonotus caferRed-vented BulbulrvbLCO20459820
PycnonotidaePycnonotus jocosusRed-whiskered BulbulrwbLCO1118527
PsittacidaePsittacula krameriRose-ringed ParakeetrrpLCF1824750
SturnidaePastor roseusRosy StarlingrsLCO366300
CorvidaeDendrocitta vagabundaRufous TreepiertpLCO0373210
PicidaeMicropternus brachyurusRufous WoodpeckerrwLCI0080
EstrildidaeLonchura punctulataScaly-breasted MuniasbmLCG471900
AccipitridaeAccipiter badiusShikraskLCC618126
AccipitridaeCircaetus gallicusShort-toed Snake EaglestseLCC0040
ColumbidaeSpilopelia chinensisSpotted DovesdLCG68515419
StrigidaeAthene bramaSpotted OwletsoLCC01763
AlcedinidaePelargopsis capensisStork-billed KingfishersbkLCC0008
DicaeidaeDicaeum agileThick-billed FlowerpeckertbfpLCO00320
MuscicapidaeFicedula albicillaTaiga FlycatchertfcLCI4000
MuscicapidaeEumyias thalassinusAsian Verditer FlycatcheravfcLCI4080
RallidaeAmaurornis phoenicurusWhite-breasted WaterhenwbwhLCO252600
AlcedinidaeHalcyon smyrnensisWhite-throated KingfisherwtkLCC1220016
MotacillidaeMotacilla albaWhite WagtailwwLCI151200
DirucadaeDicrurus caerulescensWhite-bellied DrongowbdLCI0070
ArtamidaeArtamus cyanopterusDusky WoodswallowdwsLCI04100
SylviidaeChysomma sinenseYellow-eyed BabbleryebLCI11900
ColumbidaeTreron phoenicopterusYellow-legged Green PigeonylgpLCF33000
CisticolidaeCisticola juncidisZitting CisticolazscLCI5000
CharadriidaeVanellus indicusRed-wattled lapwingrwlLCI23000
PhalacrocoracidaeMicrocarbo nigerLittle CormorentlcLCC000136
ArdeidaeArdea purpureaPurple HeronphrLCC00014
ChloropseidaeChloropsis aurifronsGolden-fonted LeafbirdgflbLCI00140
CampephagidaePericrocotus flammeusScarlet MinivetsmLCI00230
PhasianidaeFrancolinus pondicerianusGrey FrancolingfLCO26000
PittidaePitta brachyuraIndian PittaipLCI0080
ThreskiornithidaePlegadis falcinellusGlossy IbisgiLCC32000

References

  1. Leveau, L.M. Primary productivity and habitat diversity predict bird species richness and composition along urban-rural gradients of central Argentina. Urban For. Urban Green. 2019, 43, 126349. [Google Scholar] [CrossRef]
  2. Elmqvist, T.; Zipperer, W.C.; Güneralp, B. Urbanization, habitat loss and biodiversity decline: Solution pathways to break the cycle. In The Routledge Handbook of Urbanization and Global Environmental Change; Routledge: London, UK, 2015; pp. 163–175. [Google Scholar]
  3. Dowd, C. Effect of Development on Bird Species Composition of Two Urban Forested Wetlands in Staten Island, New York (Efecto del desarrollo urbano en la composición de especies de aves de dos anegados forestados urbanos en Staten Island, New York). J. Field Ornithol. 1992, 63, 455–461. [Google Scholar]
  4. Aouissi, H.A.; Petrişor, A.-I.; Ababsa, M.; Boştenaru-Dan, M.; Tourki, M.; Bouslama, Z. Influence of land use on avian diversity in North African urban environments. Land 2021, 10, 434. [Google Scholar] [CrossRef]
  5. Berkowitz, A.R.; Nilon, C.H.; Hollweg, K.S. Understanding Urban Ecosystems: A New Frontier for Science and Education; Springer: Berlin/Heidelberg, Germany, 2003. [Google Scholar]
  6. Savard, J.-P.L.; Clergeau, P.; Mennechez, G. Biodiversity concepts and urban ecosystems. Landsc. Urban Plan. 2000, 48, 131–142. [Google Scholar] [CrossRef]
  7. Fors, I.M.; Ortega-Alvarez, R.; Schondube, J.E. On the ecological quality of urban systems: An ornithological perspective. In Urban Planning in the 21st Century; Nova Science Publishers: New York, NY, USA, 2009; pp. 51–66. [Google Scholar]
  8. Marzluff, J.M. Worldwide Urbanization and Its Effects on Birds. Avian Ecology and Conservation in an Urbanizing World; Springer: Berlin/Heidelberg, Germany, 2001; pp. 19–47. [Google Scholar]
  9. Jokimäki, J.; Suhonen, J. Distribution and habitat selection of wintering birds in urban environments. Landsc. Urban Plan. 1998, 39, 253–263. [Google Scholar] [CrossRef]
  10. Turner, W.R.; Nakamura, T.; Dinetti, M. Global urbanization and the separation of humans from nature. Bioscience 2004, 54, 585–590. [Google Scholar] [CrossRef] [Green Version]
  11. Ives, C.D.; Lentini, P.E.; Threlfall, C.G.; Ikin, K.; Shanahan, D.F.; Garrard, G.E.; Bekessy, S.A.; Fuller, R.A.; Mumaw, L.; Rayner, L.; et al. Cities are hotspots for threatened species. Glob. Ecol. Biogeogr. 2016, 25, 117–126. [Google Scholar] [CrossRef]
  12. Kaushik, M.; Tiwari, S.; Manisha, K. Habitat patch size and tree species richness shape the bird community in urban green spaces of rapidly urbanizing Himalayan foothill region of India. Urban Ecosyst. 2022, 25, 423–436. [Google Scholar] [CrossRef]
  13. Matthies, S.A.; Rueter, S.; Schaarschmidt, F.; Prasse, R. Determinants of species richness within and across taxonomic groups in urban green spaces. Urban Ecosyst. 2017, 20, 897–909. [Google Scholar] [CrossRef]
  14. Sarkar, N.J.; Sultana, D.; Jaman, M.F.; Rahman, M.K. Diversity and population of avifauna of two urban sites in Dhaka, Bangladesh. Ecoprint Int. J. Ecol. 2009, 16, 1–7. [Google Scholar] [CrossRef]
  15. Wang, X.; Zhu, G.; Ma, H.; Wu, Y.; Zhang, W.; Zhang, Y.; Li, C.; de Boer, W.F. Bird communities’ responses to human-modified landscapes in the southern Anhui Mountainous Area. Avian Res. 2022, 13, 100006. [Google Scholar] [CrossRef]
  16. Prasad, S.N.; Ramachandra, T.V.; Ahalya, N.; Sengupta, T.; Kumar, A.; Tiwari, A.K.; Vijayan, V.S.; Vijayan, L. Conservation of wetlands of India-a review. Trop. Ecol. 2002, 43, 173–186. [Google Scholar]
  17. Verma, A.; Balachandran, S.; Chaturvedi, N.; Patil, V. A preliminary report on the biodiversity of Mahul Creek, Mumbai, India with special reference to avifauna. Zoos’ Print J. 2004, 19, 1599–1605. [Google Scholar] [CrossRef]
  18. Reginald, L.; Mahendran, C.; Kumar, S.; Pramod, P. Birds of Singanallur lake, Coimbatore, Tamil Nadu. Zoos’ Print J. 2007, 22, 2944–2948. [Google Scholar] [CrossRef]
  19. Hamel, P.B. Bird-Habitat Relationships on Southeastern Forest Lands; US Department of Agriculture: Washington, DC, USA; Southeastern Forest Experiment Station: Asheville, NC, USA, 1982. [Google Scholar]
  20. Terborgh, J. The role of ecotones in the distribution of Andean birds. Ecology 1985, 66, 1237–1246. [Google Scholar] [CrossRef]
  21. Garden, J.; McAlpine, C.; Peterson, A.N.N.; Jones, D.; Possingham, H. Review of the ecology of Australian urban fauna: A focus on spatially explicit processes. Austral Ecol. 2006, 31, 126–148. [Google Scholar] [CrossRef]
  22. Sodhi, N.S.; Şekercioğlu, C.H.; Barlow, J.; Robinson, S.K. Effects of habitat fragmentation on tropical birds. In Conservation of Tropical Birds, 1st ed.; Sodhi, N.S., Sekercioglu, Ç.H., Barlow, J., Robinson, S., Sodhi, N.S., Sekercioglu, Ç.H., Barlow, J., Robinson, S., Eds.; Blackwell Publishing Ltd.: Hoboken, NJ, USA, 2011; p. 159. [Google Scholar]
  23. Vitousek, P.M.; Mooney, H.A.; Lubchenco, J.; Melillo, J.M. Human domination of Earth’s ecosystems. Science 1997, 277, 494–499. [Google Scholar] [CrossRef] [Green Version]
  24. Miller, J.R.; Hobbs, R.J. Conservation where people live and work. Conserv. Biol. 2002, 16, 330–337. [Google Scholar] [CrossRef]
  25. Tu, H.-M.; Fan, M.-W.; Ko, J.C.-J. Different habitat types affect bird richness and evenness. Sci. Rep. 2020, 10, 1221. [Google Scholar] [CrossRef] [Green Version]
  26. Barth, B.J.; FitzGibbon, S.I.; Wilson, R.S. New urban developments that retain more remnant trees have greater bird diversity. Landsc. Urban Plan. 2015, 136, 122–129. [Google Scholar] [CrossRef]
  27. Fontana, S.; Sattler, T.; Bontadina, F.; Moretti, M. How to manage the urban green to improve bird diversity and community structure. Landsc. Urban Plan. 2011, 101, 278–285. [Google Scholar] [CrossRef]
  28. Beukema, H.; Danielsen, F.; Vincent, G.; Hardiwinoto, S.; van Andel, J. Plant and bird diversity in rubber agroforests in the lowlands of Sumatra, Indonesia. Agrofor. Syst. 2007, 70, 217–242. [Google Scholar] [CrossRef]
  29. Herzog, F.; Dreier, S.; Hofer, G.; Marfurt, C.; Schüpbach, B.; Spiess, M.; Walter, T. Effect of ecological compensation areas on floristic and breeding bird diversity in Swiss agricultural landscapes. Agric. Ecosyst. Environ. 2005, 108, 189–204. [Google Scholar] [CrossRef]
  30. Shoffner, A.; Wilson, A.M.; Tang, W.; Gagné, S.A. The relative effects of forest amount, forest configuration, and urban matrix quality on forest breeding birds. Sci. Rep. 2018, 8, 17140. [Google Scholar] [CrossRef] [PubMed] [Green Version]
  31. Loss, S.R.; Ruiz, M.O.; Brawn, J.D. Relationships between avian diversity, neighborhood age, income, and environmental characteristics of an urban landscape. Biol. Conserv. 2009, 142, 2578–2585. [Google Scholar] [CrossRef]
  32. Chen, Y.; Li, L.; Zhu, X.; Shen, Y.; Ma, A.; Zhang, X.; Chen, P.; Lu, C. Urban Low-Rise Residential Areas Provide Preferred Song Post Sites for a Resident Songbird. Animals 2022, 12, 2436. [Google Scholar] [CrossRef]
  33. Gatesire, T.; Nsabimana, D.; Nyiramana, A.; Seburanga, J.L.; Mirville, M.O. Bird diversity and distribution in relation to urban landscape types in Northern Rwanda. Sci. World J. 2014, 2, 157824. [Google Scholar] [CrossRef] [Green Version]
  34. Das, U.P.; Acharya, A.; Palei, H.S. The diet of Indian foxes in a peri-urban area of eastern India. Acta Ecol. Sin. 2022, 42, 679–683. [Google Scholar] [CrossRef]
  35. Bibby, C.J.; Burgess, N.D.; Hillis, D.M.; Hill, D.A.; Mustoe, S. Bird Census Techniques, 2nd ed.; Elsevier: Amsterdam, The Netherlands, 2000. [Google Scholar]
  36. Sauer, J.R.; Link, W.A.; Fallon, J.E.; Pardieck, K.L.; Ziolkowski, D.J. The North American breeding bird survey 1966–2011: Summary analysis and species accounts. N. Am. Fauna. 2013, 79, 1–32. [Google Scholar] [CrossRef] [Green Version]
  37. Dias, S.; Moreira, F.; Beja, P.; Carvalho, M.; Gordinho, L.; Reino, L.; Oliveira, V.; Rego, F. Landscape effects on large scale abundance patterns of turtle doves Streptopelia turtur in Portugal. Eur. J. Wildl. Res. 2013, 59, 531–541. [Google Scholar] [CrossRef]
  38. Ralph, C.J.; Geupel, G.R.; Pyle, P.; Martin, T.E.; DeSante, D.F.; Mila, B. Manual of Field Methods for Monitoring Terrestrial Birds; Pacific Southwest Research Station: Dr. Davis, CA, USA, 1996. [Google Scholar]
  39. Camacho-Cervantes, M.; Ojanguren, A.F.; MacGregor-Fors, I. Birds from the burgh: Bird diversity and its relation with urban traits in a small town. J. Urban. Ecol. 2018, 4, juy011. [Google Scholar] [CrossRef]
  40. Issa, M.A.A. Diversity and abundance of wild birds species’ in two different habitats at Sharkia Governorate. Egypt. J. Basic Appl. Zool. 2019, 80, 1–7. [Google Scholar] [CrossRef]
  41. Magurran, A. Measuring Biological Diversity, 1st ed.; Blackwell Science Ltd.: Hoboken, NJ, USA, 2004. [Google Scholar]
  42. Chao, A.; Chazdon, R.L.; Colwell, R.K.; Shen, T. A new statistical approach for assessing similarity of species composition with incidence and abundance data. Ecol. Lett. 2005, 8, 148–159. [Google Scholar] [CrossRef]
  43. Grimmett, R.; Inskipp, C.; Inskipp, T. Birds of the Indian Subcontinent: India, Pakistan, Sri Lanka, Nepal, Bhutan, Bangladesh and the Maldives; Bloomsbury Publishing: London, UK, 2016. [Google Scholar]
  44. Sengupta, S.; Mondal, M.; Basu, P. Bird species assemblages across a rural urban gradient around Kolkata, India. Urban Ecosyst. 2014, 17, 585–596. [Google Scholar] [CrossRef]
  45. Bunn, A.; Korpela, M. R: A Language and Environment for Statistical Computing; R Foundation for Statistical Computing: Vienna, Austria, 2013; Available online: https://www.r-project.org/ (accessed on 6 April 2019).
  46. Kindt, R.; Coe, R. Tree Diversity Analysis: A Manual and Software for Common Statistical Methods for Ecological and Biodiversity Studies; World Agroforestry Centre: Nairobi, Kenya, 2005. [Google Scholar]
  47. Chen, H.; Boutros, P.C. VennDiagram: A package for the generation of highly-customizable Venn and Euler diagrams in R. BMC Bioinform. 2011, 12, 35. [Google Scholar] [CrossRef] [PubMed] [Green Version]
  48. Barter, R.; Yu, B. Superheat: A Graphical Tool for Exploring Complex Datasets Using Heatmaps; R Packag Version: Vienna, Austria, 2017. [Google Scholar]
  49. García-Navas, V.; Thuiller, W. Farmland bird assemblages exhibit higher functional and phylogenetic diversity than forest assemblages in France. J. Biogeogr. 2020, 47, 2392–2404. [Google Scholar] [CrossRef]
  50. Wade, M.R.; Gurr, G.M.; Wratten, S.D. Ecological restoration of farmland: Progress and prospects. Philos. Trans. R. Soc. B Biol. Sci. 2008, 363, 831–847. [Google Scholar] [CrossRef] [Green Version]
  51. Martin, E.A.; Viano, M.; Ratsimisetra, L.; Laloë, F.; Carrière, S.M. Maintenance of bird functional diversity in a traditional agroecosystem of Madagascar. Agric. Ecosyst. Environ. 2012, 149, 1–9. [Google Scholar] [CrossRef]
  52. Blount, J.D.; Horns, J.J.; Kittelberger, K.D.; Neate-Clegg, M.H.C.; Şekercioğlu, Ç.H. Avian use of agricultural areas as migration stopover sites: A review of crop management practices and ecological correlates. Front. Ecol. Evol. 2021, 9, 650641. [Google Scholar] [CrossRef]
  53. Grishchenko, M.; Prins, H.H.T.; Ydenberg, R.C.; Schaepman, M.E.; de Boer, W.F.; de Knegt, H.J. Land use change and the migration geography of Greater White-fronted geese in European Russia. Ecosphere 2019, 10, e02754. [Google Scholar] [CrossRef] [Green Version]
  54. Wuczyński, A.; Kujawa, K.; Dajdok, Z.; Grzesiak, W. Species richness and composition of bird communities in various field margins of Poland. Agric. Ecosyst. Environ. 2011, 141, 202–209. [Google Scholar] [CrossRef]
  55. Haslem, A.; Bennett, A.F. Countryside elements and the conservation of birds in agricultural environments. Agric. Ecosyst. Environ. 2008, 125, 191–203. [Google Scholar] [CrossRef]
  56. Liao, J.; Liao, T.; He, X.; Zhang, T.; Li, D.; Luo, X.; Ran, J. The effects of agricultural landscape composition and heterogeneity on bird diversity and community structure in the Chengdu Plain. China Glob. Ecol. Conserv. 2020, 24, e01191. [Google Scholar] [CrossRef]
  57. Reif, J.; Vermouzek, Z. Collapse of farmland bird populations in an Eastern European country following its EU accession. Conserv. Lett. 2019, 12, e12585. [Google Scholar] [CrossRef]
  58. Cueto, V.R.; Gorosito, C.A. Seasonal changes in bird assemblages of a forest-steppe ecotone in North Patagonia. Ornito. Neot. 2018, 29, 349–358. [Google Scholar]
  59. Lennon, J.J.; Greenwood, J.J.D.; Turner, J.R.G. Bird diversity and environmental gradients in Britain: A test of the species–energy hypothesis. J. Anim. Ecol. 2000, 69, 581–598. [Google Scholar] [CrossRef]
  60. Hawkins, B.A.; Field, R.; Cornell, H.V.; Currie, D.J.; Guégan, J.-F.; Kaufman, D.M.; Kerr, J.T.; Mittelbach, G.G.; Oberdorff, T.; O’Brien, E.M. Energy, water, and broad-scale geographic patterns of species richness. Ecology 2003, 84, 3105–3117. [Google Scholar] [CrossRef] [Green Version]
  61. Bauer, S.; Hoye, B.J. Migratory animals couple biodiversity and ecosystem functioning worldwide. Science 2014, 344, 1242552. [Google Scholar] [CrossRef]
  62. Yujun, W.; Shuihua, C.; Ping, D. Bird community structures and their seasonal variations among Hangzhou urban woodlots. J. Zhejiang Univ. 2005, 32, 320–326. [Google Scholar]
  63. Chatterjee, A.; Adhikari, S.; Barik, A.; Mukhopadhyay, S.K. The mid-winter assemblage and diversity of bird populations at Patlakhawa Protected Forest, Coochbehar, West Bengal, India. Ring 2013, 35, 31–53. [Google Scholar] [CrossRef] [Green Version]
  64. Filloy, J.; Bellocq, M.I. Patterns of bird abundance along the agricultural gradient of the Pampean region. Agric. Ecosyst. Environ. 2007, 120, 291–298. [Google Scholar] [CrossRef]
  65. Sánchez-Oliver, J.S.; Benayas, J.M.R.; Carrascal, L.M. Local habitat and landscape influence predation of bird nests on afforested Mediterranean cropland. Acta Oecol. 2014, 58, 35–43. [Google Scholar] [CrossRef]
  66. Palei, H.S.; Mohapatra, P.P.; Sahu, H.K. Birds of Hadagarh Wildlife Sanctuary, Odisha, Eastern India. World J. Zool. 2012, 7, 221–225. [Google Scholar] [CrossRef]
  67. Hossain, A.; Aditya, G. Avian diversity in agricultural landscape: Records from Burdwan, West Bengal, India. Proc. Zool. Soc. 2016, 69, 38–51. [Google Scholar] [CrossRef]
  68. de Toledo, M.C.B.; Donatelli, R.J.; Batista, G.T. Relation between green spaces and bird community structure in an urban area in Southeast Brazil. Urban Ecosyst. 2012, 15, 111–131. [Google Scholar] [CrossRef]
  69. Chace, J.F.; Walsh, J.J. Urban effects on native avifauna: A review. Landsc. Urban Plan. 2006, 74, 46–69. [Google Scholar] [CrossRef]
  70. Melles, S.; Glenn, S.; Martin, K. Urban bird diversity and landscape complexity: Species–environment associations along a multiscale habitat gradient. Conserv. Ecol. 2003, 7, 1–22. [Google Scholar] [CrossRef] [Green Version]
  71. Garaffa, P.I.; Filloy, J.; Bellocq, M.I. Bird community responses along urban–rural gradients: Does the size of the urbanized area matter? Landsc. Urban Plan. 2009, 90, 33–41. [Google Scholar] [CrossRef]
  72. Ortega-Álvarez, R.; MacGregor-Fors, I. Living in the big city: Effects of urban land-use on bird community structure, diversity, and composition. Landsc. Urban Plan. 2009, 90, 189–195. [Google Scholar] [CrossRef]
  73. Manhães, M.A.; Loures-Ribeiro, A. Spatial distribution and diversity of bird community in an urban area of Southeast Brazil. Braz. Arch. Biol. Technol. 2005, 48, 285–294. [Google Scholar] [CrossRef] [Green Version]
  74. Woldemariam, W.; Mekonnen, T.; Morrison, K.; Aticho, A. Assessment of wetland flora and avifauna species diversity in Kafa Zone, Southwestern Ethiopia. J. Asia-Pac. Biodivers. 2018, 11, 494–502. [Google Scholar] [CrossRef]
  75. Rajpar, M.N.; Zakaria, M. Bird abundance and its relationship with microclimate and habitat variables in open-area and shrub habitats in Selangor, Peninsular Malaysia. JAPS J. Anim. Plant Sci. 2015, 25, 114–124. [Google Scholar]
  76. Møller, A.P. Successful city dwellers: A comparative study of the ecological characteristics of urban birds in the Western Palearctic. Oecologia 2009, 159, 849–858. [Google Scholar] [CrossRef] [PubMed]
  77. Audet, J.-N.; Ducatez, S.; Lefebvre, L. The town bird and the country bird: Problem solving and immunocompetence vary with urbanization. Behav. Ecol. 2016, 27, 637–644. [Google Scholar] [CrossRef] [Green Version]
  78. Charmantier, A.; Demeyrier, V.; Lambrechts, M.; Perret, S.; Grégoire, A. Urbanization is associated with divergence in pace-of-life in great tits. Front. Ecol. Evol. 2017, 5, 53. [Google Scholar] [CrossRef]
  79. Senar, J.C.; Garamszegi, L.Z.; Tilgar, V.; Biard, C.; Moreno-Rueda, G.; Salmón, P.; Rivas, J.M.; Sprau, P.; Dingemanse, N.J.; Charmantier, A.; et al. Urban great tits (Parus major) show higher distress calling and pecking rates than rural birds across Europe. Front. Ecol. Evol. 2017, 5, 163. [Google Scholar] [CrossRef] [Green Version]
  80. Jokimäki, J.; Kaisanlahti-Jokimäki, M. Spatial similarity of urban bird communities: A multiscale approach. J. Biogeogr. 2003, 30, 1183–1193. [Google Scholar] [CrossRef]
  81. Fernández-Juricic, E. Bird community composition patterns in urban parks of Madrid: The role of age, size and isolation. Ecol. Res. 2000, 15, 373–383. [Google Scholar] [CrossRef]
  82. Jokimäki, J.; Suhonen, J. Effects of urbanization on the breeding bird species richness in Finland: A biogeographical comparison. Ornis. Fenn. 1993, 70, 71–77. [Google Scholar]
  83. Daniels, G.D.; Kirkpatrick, J.B. Does variation in garden characteristics influence the conservation of birds in suburbia? Biol. Conserv. 2006, 133, 326–335. [Google Scholar] [CrossRef]
  84. Mukhopadhyay, S.; Mazumdar, S. Habitat-wise composition and foraging guilds of avian community in a suburban landscape of lower Gangetic plains, West Bengal, India. Biologia 2019, 74, 1001–1010. [Google Scholar] [CrossRef]
  85. Faeth, S.H.; Warren, P.S.; Shochat, E.; Marussich, W.A. Trophic dynamics in urban communities. Bioscience 2005, 55, 399–407. [Google Scholar] [CrossRef]
  86. Orłowski, G. Cropland use by birds wintering in arable landscape in south-western Poland. Agric. Ecosyst. Environ. 2006, 116, 273–279. [Google Scholar] [CrossRef]
  87. Herzon, I.; Auninš, A.; Elts, J.; Preikša, Z. Intensity of agricultural land-use and farmland birds in the Baltic States. Agric. Ecosyst. Environ. 2008, 125, 93–100. [Google Scholar] [CrossRef]
  88. Deikumah, J.P.; Kwafo, R.; Konadu, V.A. Land use types influenced avian assemblage structure in a forest–agriculture landscape in Ghana. Ecol. Evol. 2017, 7, 8685–8697. [Google Scholar] [CrossRef]
  89. Jokimäki, J.; Suhonen, J.; Jokimäki-Kaisanlahti, M.-L.; Carbó-Ramírez, P. Effects of urbanization on breeding birds in European towns: Impacts of species traits. Urban Ecosyst. 2016, 19, 1565–1577. [Google Scholar] [CrossRef]
  90. Chamberlain, D.; Kibuule, M.; Skeen, R.Q.; Pomeroy, D. Urban bird trends in a rapidly growing tropical city. Ostrich 2018, 89, 275–280. [Google Scholar] [CrossRef]
  91. Xu, W.; Yu, J.; Huang, P.; Zheng, D.; Lin, Y.; Huang, Z.; Zhao, Y.; Dong, J.; Zhu, Z.; Fu, W. Relationship between Vegetation Habitats and Bird Communities in Urban Mountain Parks. Animals 2022, 12, 2470. [Google Scholar] [CrossRef]
  92. Clergeau, P.; Savard, J.-P.L.; Mennechez, G.; Falardeau, G. Bird Abundance and Diversity along an Urban-Rural Gradient: A Comparative Study between Two Cities on Different Continents. Condor 1998, 100, 413–425. [Google Scholar] [CrossRef] [Green Version]
  93. Sorace, A. High density of bird and pest species in urban habitats and the role of predator abundance. Ornis. Fenn. 2002, 79, 60–71. [Google Scholar]
  94. Frishkoff, L.O.; Karp, D.S.; M’Gonigle, L.K.; Mendenhall, C.D.; Zook, J.; Kremen, C.; Hadly, E.A.; Daily, G.C. Loss of avian phylogenetic diversity in neotropical agricultural systems. Science 2014, 345, 1343–1346. [Google Scholar] [CrossRef] [PubMed] [Green Version]
  95. Diaz, M.; Telleria, J.L. Granivorous birds in a stable and isolated open habitat within the Amazonian rainforest. J. Trop. Ecol. 1996, 12, 419–425. [Google Scholar] [CrossRef] [Green Version]
  96. Chettri, N.; Deb, D.C.; Sharma, E.; Jackson, R. The relationship between bird communities and habitat. Mt. Res. Dev. 2005, 25, 235–243. [Google Scholar] [CrossRef] [Green Version]
  97. Trager, M.; Mistry, S. Avian community composition of kopjes in a heterogeneous landscape. Oecologia 2003, 135, 458–468. [Google Scholar] [CrossRef] [PubMed]
  98. Suhonen, J.; Jokimäki, J. Fruit removal from rowanberry (Sorbus aucuparia) trees at urban and rural areas in Finland: A multi-scale study. Landsc. Urban Plan. 2015, 137, 13–19. [Google Scholar] [CrossRef]
  99. Curzel, F.E.; Leveau, L.M. Bird taxonomic and functional diversity in three habitats in Buenos Aires City, Argentina. Birds 2021, 2, 217–229. [Google Scholar] [CrossRef]
  100. Gomes, L.G.L.; Oostra, V.; Nijman, V.; Cleef, A.M.; Kappelle, M. Tolerance of frugivorous birds to habitat disturbance in a tropical cloud forest. Biol. Conserv. 2008, 141, 860–871. [Google Scholar] [CrossRef]
  101. Suhonen, J.; Jokimäki, J.; Lassila, R.; Kaisanlahti-Jokimäki, M.-L.; Carbó-Ramírez, P. Effects of roads on fruit crop and removal rate from rowanberry trees (Sorbus aucuparia) by birds in urban areas of Finland. Urban For. Urban Green. 2017, 27, 148–154. [Google Scholar] [CrossRef]
  102. Abrahamczyk, S.; Kessler, M. Hummingbird diversity, food niche characters, and assemblage composition along a latitudinal precipitation gradient in the Bolivian lowlands. J. Ornithol. 2010, 151, 615–625. [Google Scholar] [CrossRef]
Figure 1. Map showing the different habitats and transect locations in the city of Baripada, Odisha, India—(a) transect 1 at Takatpur (TKP), (b) transect 2 at Baripada (BPD), (c) transect 3 at Rani Bandh (RBD), (d) transect 4 at Borjhor (BOJ), (e) transect 5 at cropland (CL1), (f) transect 6 at cropland (CL2), (g) transect 7 at Manchabandha (MBD), and (h) transect at Budhikhamari Forest (BKR). Refer Figure 2 for more information.
Birds 03 00026 g001
Figure 2. Map showing all eight transects in the study area; red color represents the transect line; (a) TKP = Takatpur, (b) BPD = Baripada, (c) RBD = Rani Bandh, (d) BOJ = Borjhor, (e) CL1 = Cropland1, (f) CL2 = Cropland2, (g) MBD = Manchabandha, (h) BKR = Budhikhamari.
Birds 03 00026 g002
Figure 3. Individual-based rarefaction curve for bird species richness found in four different habitats in the study area. The shaded area around the curve indicates 95% confidence intervals (CI).
Birds 03 00026 g003
Figure 4. Non-metric Multidimensional Scaling (NMDS) showing the different bird species composition at each habitat (stress = 0.25; Non-metric fit R2 = 0.936; linear fit R2 = 0.695); CL = Cropland, RA = Residential areas, SF = Sal Forest, and WB = Water Body. Where; ap = Alexandrine Parakeet; acsl = Ashy-crowned Sparrow Lark; asp = Ashy Prinia; ak = Asian Koel; aob = Asian Openbill; aps = Asian Palm Swift; ipfc = Indian Paradise-flycatcher; apst = Asian Pied Starling; bm = Bank Myna; bs = Barn Swallow; bw = Baya Weaver; bbs = Bay-backed Shrike; bd = Black Drongo; bhm = Black-headed Munia; bk = Black kite; bwk = Black-winged Kite; bhcs = Black-headed Cuckooshrike; bho = Black-hooded Oriole; bno = Black-naped Oriole; brw = Black-rumped Woodpecker; rp = Rock Pigeon; btb = Blue-throated Barbet; bbbe = Blue-bearded Bee-eater; bq = Common Buttonquail; bst = Brahminy Starling; brd = Bronzed Drongo; bwj = Bronze-winged Jacana; brs = Brown Shrike; bhb = Brown-headed Barbet; ce = Cattle Egret; chbe = Chestnut-headed Bee-eater; cts = Chestnut-tailed Starling; cc = Common Chiffchaff; cct = Common Coot; chc = Common Hawk Cuckoo; ch = Common Hoopoe; ci = Common Iora; ck = Common Kingfisher; cmh = Common Moorhen; cm = Common Myna; csp = Common Sandpiper; csn = Common Snipe; ctb = Common Tailorbird; csb = Coppersmith Barbet; ipg = Indian Pygmy-goose; cse = Crested Serpent Eagle; cw = Citrine Wagtail, Motacilla citreola; dw = Dusky Warbler; rcd = Red Collared Dove; ecd = Eurasian Collared Dove; ego = Eurasian Golden Oriole; fw = Forest Wagtail; fbw = Fulvous-breasted Woodpecker; gc = Greater Coucal; ggbw = Greater Golden-backed Woodpecker; gbe = Green Bee-eater; gbm = Green-billed Malkoha; gw = Grey Wagtail; hc = House Crow; hs = House Sparrow; hsw = House Swift; inj = Indian Nightjar; ph = Indian Pond Heron; iro = Indian Robin; irl = Indian Roller; jc = Jacobin Cuckoo; jb = Jerdon’s Baza; jbb = Jungle Babbler; jm = Jungle Myna; jcs = Large Cuckooshrike; ge = Great Egret; lwd = Lesser Whistling Duck; leg = Little Egret; lg = Little Grebe; omr = Oriental Magpie-Robin; osl = Oriental Sky Lark; owe = Oriental White-eye; pfp = Paddyfield Pipit; ptj = Pheasant-tailed Jacana; pk = Pied Kingfisher; pp = Plain Prinia; php = Plum-headed Parakeet; psb = Purple Sunbird; prsb = Purple-rumped Sunbird; lrtd = Greater Racket-tailed Drongo; rrsw = Red-rumped Swallow; rvb = Red-vented Bulbul; rwb = Red-whiskered Bulbul; rrp = Rose-ringed Parakeet; rs = Rosy Starling; rtp = Rufous Treepie; rw = Rufous Woodpecker; sbm = Scaly-breasted Munia; sk = Shikra; stse = Short-toed Snake Eagle; sd = Spotted Dove; so = Spotted Owlet; sbk = Stork-billed Kingfisher; tbfp = Thick-billed Flowerpecker; tfc = Taiga Flycatcher; avfc = Asian Verditer Flycatcher, Eumyias thalassinus; wbwh = White-breasted Waterhen; wtk = White-throated Kingfisher; ww = White Wagtail; wbd = White-bellied Drongo; wds = Dusky Woodswallow; yeb = Yellow-eyed Babbler; yfgp = Yellow-legged Green Pigeon; zsc = Zitting Cisticola; rwl = Red-wattled Lapwing; lc = Little Cormorant; phr = Purple Heron; jlb = Jerdon’s Leafbird; sm = Scarlet Minivet, Pericrocotus speciosus; gf = Grey Francolin; ip = Indian Pitta; gi = Glossy Ibis.
Birds 03 00026 g004
Figure 5. ANOVA showing that there was a significant difference between habitat in terms of bird abundance (a) and richness (b); CL = Cropland, RA = Residential areas, SF = Sal Forest, and WB = Water Body. Check Table 2 for more details.
Birds 03 00026 g005
Figure 6. The rank-abundance represents the position of the bird in various habitats; the highest abundance of each bird in each habitat held the top position.
Birds 03 00026 g006
Figure 7. Venn diagram showing the number of unique and shared species among the different sampling habitats; CL: Cropland, RA: Residential Areas, SF: Sal Forest, WB: Waterbodies.
Birds 03 00026 g007
Figure 8. The pie chart represents the occurrence of birds feeding guild richness (%) in the study area; C = Carnivore, F = Frugivore, G = Granivore, I = Insectvore, N = Nectarivore, and O = Omnivore.
Birds 03 00026 g008
Figure 9. Heat map showing the distribution pattern of various feeding guilds in different habitats; blue color represented low value and yellow indicated higher value. The distribution pattern of bird guilds in various habitats formed two hierarchical clusters; CL: Cropland, RA: Residential Areas, SF: Sal Forest, WB: Waterbodies, I: Insectivore, G: Granivore, O: Omnivore, N: Nectarivore, and C: Carnivore.
Birds 03 00026 g009
Table 1. Description of different habitat types in the study area.
HabitatTransectGPS CoordinateNo. of PointsTransect Length (km)Characteristics of the Study Area
Lat (N)Long (E)
RABPD21.92815386.73702330.6Human-dominated landscapes with fewer vegetation covers like Shorea robusta, Mangifera indica, Ficus benghalensis, etc.
TKP21.93358486.75047430.6Human-dominated landscape with vegetation covers like Bombax ceiba, Bamboosa sp., Gmelina arborea, Mangifera indica, Lantena camara, etc.
WBRBD21.92969586.77306520.4A small pond with aquatic flora and medium patches of vegetation covers like Borassus flabellifer, Lantena camara, F. bengalensis, like Nimphea sp., etc.
BOJ21.83190986.7868761.1Large ponds with aquatic flora and small vegetation covers like Nimphea spp., Hydrilla sp., Utricularia sp. Ipomea sp., etc.
CLCL121.93851686.77157430.6Mosaic landscape of annual crops (paddy) or fallow land with small patches of vegetation, grass, seasonal canals, and ditches.
CL221.8352886.80014320.5Mosaic landscape of annual crops or fallow land with small patches of vegetation, grass, seasonal ditches
SFMBD21.90373986.74998230.6Sal-dominated forest covers with small canals and open areas with scattered patches of Ziziphus jujuba
BKR21.87233586.75489330.6Sal-dominated forest covered with small canals and open areas with Suzygium cumini and Ziziphus jujuba.
RA = Residential Areas, WB = Waterbodies, CL = Cropland, SF = Sal Forest, BPD = Baripada, TKP = Takatpur, RBD = Rani Bandh, BOJ = Borjhor Dam, CL1 = Cropland near University, CL2 = Cropland near Borjhor, MBD = Manchabandha Forest, BKR = Bhudikhamari Forest.
Table 2. Table showing the results—(a) One-way ANOVA test for both abundance and richness. Additionally, pairwise comparisons—(b) Tukey’s HSD test for bird richness and abundance across the habitat and season are represented below the ANOVA results; CL = Cropland, RA = Residential areas, SF = Sal Forest, and WB = Water Body.
ANOVA for Abundance (Habitat)
dfSum SqMean SqF valuePr (>F)Significance
Habitat379992666.46.5820.000341<0.001
Residuals14058,714405.1
ANOVA for Richness (Habitat)
Habitat3764.7254.9214.233.78 × 10−8<0.001
Residuals140270717.91
ANOVA for Abundance (Season)
Season212,0486024165.4 × 10−7<0.001
Residuals14153,078376
ANOVA for Abundance (Season)
Season2380.4190.229.260.00016<0.001
Residuals1412895.720.54
Group95% Confidence level of interval for mean abundanceSignificance
DifferencesUpperLowerp Adj
RA-CL4.22−8.1116.550.81No
SF-CL−12.80−25.14−0.470.03<0.05
WB-CL6.44−5.8918.770.52No
SF-RA−17.02−29.36−4.6920.002<0.05
WB-RA2.22−10.1114.550.96No
WB-SF19.256.91431.580.0004<0.001
95% Confidence level of interval for mean richness
RA-CL−0.11−2.702.480.99No
SF-CL−2.5−5.090.090.06No
WB-CL−5.66−8.26−3.070.01<0.001
SF-RA−2.38−4.980.200.08No
WB-RA−5.55−8.14−2.960.01<0.001
WB-SF−3.16−5.76−0.570.01<0.05
Seasons95% Confidence level of interval for mean abundance
Summer-Monsoon0.62−8.7510.000.98No
Winter-Monsoon19.7010.3229.080.001Yes
Winter-Summer19.089.7028.460.001Yes
95% Confidence level of interval for mean richness
Summer-Monsoon1.14−1.043.330.43No
Winter-Monsoon3.871.686.060.001Yes
Winter-Summer2.720.534.920.01Yes
Table 3. Pairwise comparisons of the bird communities among four different habitats and seasons in the study area.
Similarity IndexEuclidian DistanceBray–CurtisMorista–HornJaccard
HabitatRAWBCLRAWBCLRAWBCLRAWBCL
WB687.18 0.81 0.19 0.33
CL255.83653.68 0.470.78 0.730.11 0.480.23
SF305.01656.31281.300.540.870.660.570.070.520.310.170.19
SeasonWinterSummer WinterSummer WinterSummer WinterSummer
Summer362.92 0.27 0.75 0.86
Monsoon376.30121.30 0.290.18 0.720.94 0.830.87
CL: Cropland, RA: Residential Areas, SF: Sal Forest, WB: Waterbodies.
Publisher’s Note: MDPI stays neutral with regard to jurisdictional claims in published maps and institutional affiliations.

