Article

HIV-1 Gag Non-Cleavage Site PI Resistance Mutations Stabilize Protease/Gag Substrate Complexes In Silico via a Substrate-Clamp

Laco Science Institute, Bradenton, FL 34208, USA
BioChem 2021, 1(3), 190-209; https://doi.org/10.3390/biochem1030015
Submission received: 14 September 2021 / Revised: 27 October 2021 / Accepted: 29 October 2021 / Published: 5 November 2021

Abstract

:
HIV-1 protease active site inhibitors are a key part of antiretroviral therapy, though resistance can evolve rendering therapy ineffective. Protease inhibitor resistance typically starts with primary mutations around the active site, which reduces inhibitor binding, protease affinity for substrate cleavage site residues P4-P4′, and viral replication. This is often followed by secondary mutations in the protease substrate-grooves which restore viral replication by increasing protease affinity for cleavage site residues P12-P5/P5′-P12′, while maintaining resistance. However, mutations in Gag alone can also result in resistance. The Gag resistance mutations can occur in cleavage sites (P12-P12′) to increase PR binding, as well as at non-cleavage sites. Here we show in silico that Gag non-cleavage site protease inhibitor resistance mutations can stabilize protease binding to Gag cleavage sites which contain structured subdomains on both sides: SP1/NC, SP2/p6, and MA/CA. The Gag non-cleavage site resistance mutations coordinated a network of H-bond interactions between the adjacent structured subdomains of the Gag substrates to form a substrate-clamp around the protease bound to cleavage site residues P12-P12′. The substrate-clamp likely slows protease disassociation from the substrate, restoring the cleavage rate in the presence of the inhibitor. Native Gag substrates can also form somewhat weaker substrate-clamps. This explains the 350-fold slower cleavage rate for the Gag CA/SP1 cleavage site in that the CA-SP1 substrate lacks structured subdomains on both sides of the cleavage site, and so cannot form a substrate-clamp around the PR.

1. Introduction

Since the discovery of HIV-1 as the causative agent of the acquired immune deficiency syndrome (AIDS) [1,2], efforts have been made to develop inhibitors that target key viral enzymes including the protease (PR), reverse transcriptase (RT), and integrase (IN) [3]. While RT inhibitors alone were initially effective [4,5], the selection of mutations in the RT made the inhibitors ineffective [6,7]. It was only after the development and use of PR active site inhibitors (PI), in combination with RT inhibitors, that a more durable antiretroviral therapy (ART) was produced [8]. However, due to preexisting mutations as well as selection for resistance mutations, ART failed for some patients [9]. Frieden and coworkers reported that in 2012 only 30% of the estimated 1.2 million HIV-1 infected individuals in the US and Puerto Rico were on effective ART [10]. Individuals infected with HIV-1 and not on effective ART can infect other people, and represented over 90% of HIV-1 transmissions in the US and Puerto Rico [10]. Resistance to PR active site inhibitors (PI) is one of the factors contributing to the failure of ART.
The HIV-1 PR is composed of two identical monomers each of which contribute an aspartic acid side chain to the active site [11]. PIs are typically peptidomimetics, based on native cleavage site residues P2-P2′, and bind in the PR active site [12]. The PR develops resistance to PIs through both primary and secondary resistance mutations [13,14,15,16,17,18,19,20,21]. PR primary resistance mutations are initially selected for around the PR active site which reduces PI binding, while also reducing PR cleavage of native substrates and so viral replication. Next, secondary resistance mutations are selected for, often in or adjacent to the substrate-grooves (S-grooves), one on each face of the PR dimer, as seen in Figure 1A, [22,23].
The PR S-groove secondary resistance mutations restore PR binding to substrates by increasing S-groove affinity for cleavage site residues P12-P5/P5′-P12′ (|P12-P5|) [22,23], and that in turn restores viral replication while maintaining PI resistance [14,15,16,17,18,19,20,21]. The HIV-1 PR S-groove model is supported by computational chemistry results [22,23], experimental results [23,25], as well as NMR results [24]. The solution NMR results by Deshmukh and coworkers demonstrated that HIV-1 PR S-groove residues interacted directly with Gag cleavage site residues outside of P4-P4′, i.e., |P12-P5|, Figure 1B, [24]. While HIV-1 PR S-groove secondary resistance mutations were selected for by all clinical PI regimes, S-groove primary resistance mutations were also selected for by three PI regimes, as seen in Figure 1C [13].
Recently, several other research groups have studied the role of PR resistance mutations that are distant from the PR active site, and those resistance mutations included many S-groove residues [26,27,28,29]. However, the researchers did not analyze the direct interactions between those S-groove resistance residues and cleavage site residues |P12-P5|, in order to explain PR resistance, but instead focused on indirect H-bond networks between the distant PR resistance residues and the PR active site that was up to ~20 A away [26,27,28].
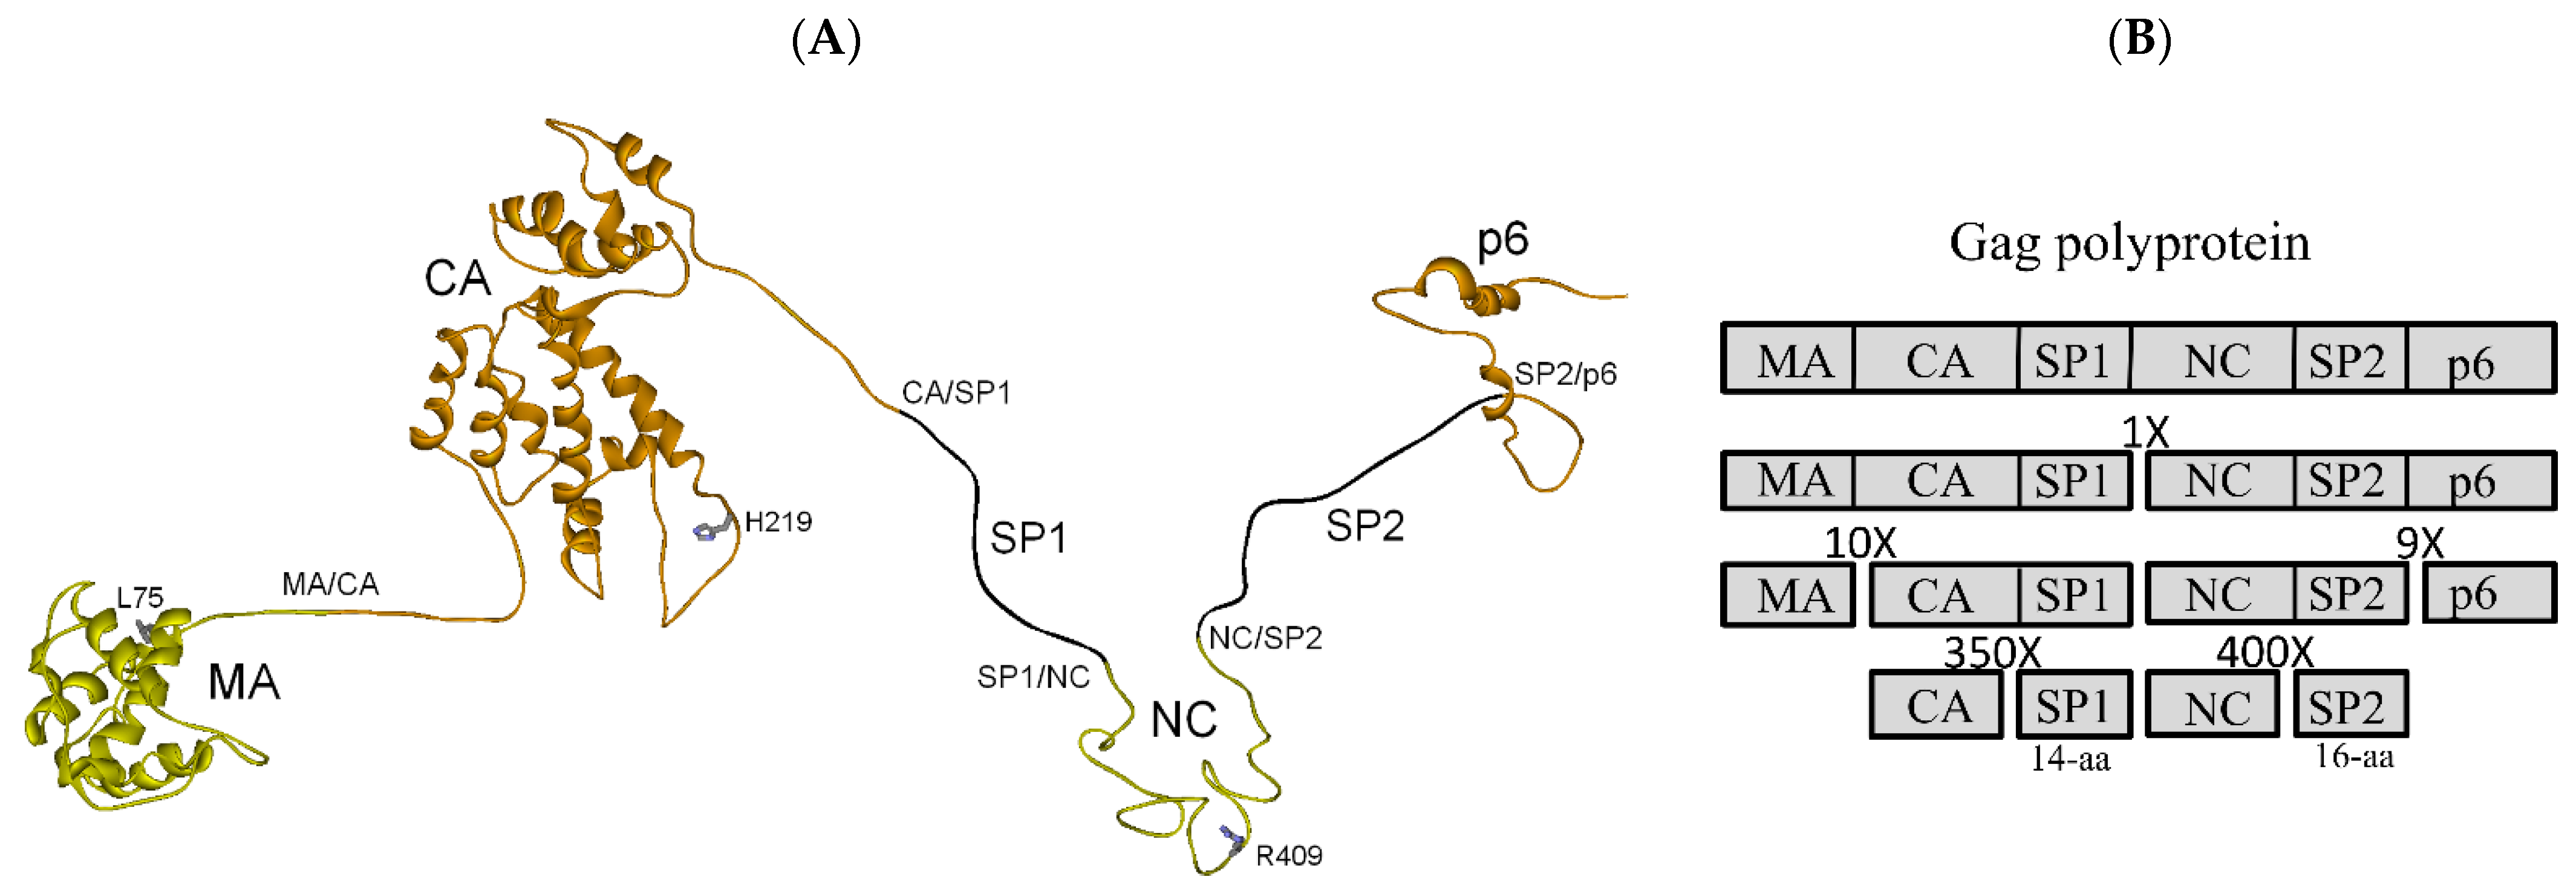
The HIV-1 Gag polyprotein is composed of matrix (MA), capsid (CA), spacer peptide 1 (SP1), nucleocapsid (NC), spacer peptide 2 (SP2), and p6, shown in Figure 2A (note: SP1 and SP2 have also been named p2 and p1, respectively).
It was determined via the structure-based modeling studies that when HIV-1 PR bound the MA/CA cleavage site, within an MA-CA polyprotein, the PR S-grooves curved the substrate backbone ~90 degrees down both faces of the PR so that the MA-CA polyprotein encircled the PR, as seen in Figure 1D [23]. The curvature of the MA/CA cleavage site backbone was initiated by PR residues D29 and D30, for the B-subunit the D29 and D30 side chain oxygens H-bonded to the backbone nitrogens of the MA/CA cleavage site P4′G and P5′N residues, respectively (Figure 1B), while the PR A-subunit D29 side chain oxygen H-bonded to the P4A backbone nitrogen and the D30 side chain oxygen H-bonded to the P5S side chain oxygen. Support for the PR/MA-CA polyprotein ternary complex (Figure 1D) comes from small-angle neutron scattering experiments on a Gag polyprotein in which the MA and CA subdomains were found to be closely associated [33], while solution NMR studies of a Gag MA-CA polyprotein revealed that the MA and CA subdomains aligned with complementary surfaces and charges to within 2–6 A in three models [34]. The published experimental results on PR binding to Gag cleavage sites [23,24,25], and Gag MA and CA subdomains associations [33,34] support the structure-based model of HIV-1 PR bound to the MA-CA polyprotein in Figure 1D [23]. The HIV-1 PR S-groove model was then expanded to include many other retroviral proteases where the native multi-drug resistance was found to be due to a combination of primary active site mutations and secondary S-groove mutations [22]. A third more straightforward PI resistance mechanism is based on the selection of mutations in Gag cleavage sites P12-P12′ to likely enhance PR binding to substrates in the presence of PIs reviewed in [35], similar to how S-groove resistance residues increase PR binding to substrates [23].
HIV-1 PR primary and secondary resistance mutations, as well as Gag cleavage site mutations, are important in PI failure [13]. However, Gag non-cleavage site PI resistance mutations alone can result in high-level PI resistance [35], though a unifying mechanism for how those Gag non-cleavage site PI resistance mutations functioned was not reported. The Gag non-cleavage site PI resistance mutations fall outside of cleavage site residues P12-P12′. In regards to PI resistance attributed to Gag mutations Wensing and coworkers noted that, “mutations in Gag cleavage sites may confer or contribute to resistance to PIs and may even emerge before mutations in protease” [13,36], and that “a large proportion of virus samples from patients with confirmed virologic failure on a PI-containing regimen is not found to have PI resistance-associated mutations” in the protease gene [13].
The structure-based model of the HIV-1 PR in complex with the MA-CA polyprotein was the first step in understanding the mechanism of Gag non-cleavage site PI resistance mutations, shown in Figure 1D [23]. The reported HIV-1 Gag non-cleavage site PI resistance mutations were found on the surface of the structured Gag subdomains including MA, CA, NC, and p6, reviewed in [35]. However, few of the reported Gag non-cleavage site PI resistance mutations were individually introduced into a wild-type HIV-1 background to test the role of each mutation independently of other mutations and polymorphisms in Gag and PR [35]. A notable exception was by Gatanaga and coworkers who reported a detailed examination into the selection for, and PI resistance of, Gag non-cleavage site PI resistance mutations [30]. In that study, Gatanaga and coworkers introduced each mutation into a wild-type HIV-1 background and determined two Gag non-cleavage site mutations (CA H219Q, NC R409K) were responsible for high-level resistance against three PIs, while the addition of a third Gag non-cleavage site mutation (MA L75R) was important in resistance to amprenavir [30]. Those results by Gatanaga and coworkers [30] were reproduced by Aoki and coworkers [37]. Since those three mutations were on the surface of the respective Gag structured subdomains, they could potentially interact directly via H-bonds with an adjacent Gag subdomain to form a substrate-clamp around the PR when bound to a cleavage site, similar to how the PR was modeled binding the MA/CA cleavage site in a MA-CA polyprotein, as seen in Figure 1D [23].
Lastly, it was reported that while the HIV-1 Gag polyprotein is cleaved at five sites by the PR (Figure 2A), the cleavage rates for those sites differed by up to 400-fold, as seen in Figure 2B [31]. In particular, the cleavage at the CA/SP1 site in the CA-SP1 substrate was reported by Pettit and coworkers to be 350-fold slower than cleavage at the adjacent SP1/NC site in the full-length Gag substrate, as seen in Figure 2B [31,38,39]. When Pettit and coworkers blocked the cleavage at the fast SP1/NC site in the full-length Gag the cleavage rate at the adjacent slow CA/SP1 site, now in the context of the full-length Gag, increased 20-fold [40]. Here the mechanism of action for the HIV-1 Gag non-cleavage site PI resistance mutations was explored, as were the factors affecting the cleavage rates for the Gag cleavage sites.

2. Materials and Methods

Discovery Studio version 2.1 (Dassault Systèmes Biovia, San Diego, CA, USA) and the Consistent Force Field (CFF) were used for all computational chemistry experiments. Gag substrates were generated from the previously reported structure-based full-length Gag polyprotein which was generated from the following structures: 1L6N.pdb and 4XFX.pdb (MA-CA-SP1), 1MFS.pdb (NC), and 2C55.pdb (p6), with missing linking residues coming from the HIV-1 HXB2 sequence [3]. The previously reported PR/24-mer cleavage site complexes (PR based on 1KJ7.pdb) [22] were modified in the following manner: for the PR/full-length Gag model (Figure 3B), the 24-residues of the SP2/NC cleavage site were deleted and then the new C-termini and N-termini, generated by the deletion, were bonded to the respective N-termini and C-termini of the substrate in the model of PR bound to the 24-mer SP1/NC cleavage site [22]. The remaining Gag substrates were generated in the same manner with Gag subdomains deleted as needed to generate the respective Gag substrates (Figure 4, Figure 5 and Figure 6). The Gag substrate-clamps were generated from the PR/Gag substrate ternary complexes by rotating the structured Gag domains on each side of the PR using the backbone Cα-C and N-Cα bonds at the junction between the structured subdomains and the cleavage site P12/P12′ residues, and within the unstructured region separating the PR and a given structured subdomain. When using an active H-bond monitor in a Discovery Studio 3D window, this strategy allowed for the identification of H-bond interactions between adjacent Gag structured subdomains. An electrostatic surface potential was also added to subdomains as needed to help visualize the surface and charges of the subdomains during the alignment of subdomains and formation of a substrate-clamp H-bond network.
Protease/substrate models were energy minimized prior to calculation of the interaction energy scores using CFF with parameters set to the approximate in vitro conditions for direct interactions between proteins as previously described [41], including using CFF and implicit distance-dependent dielectrics with a dielectric constant of 3. The only explicit water in the protease/substrate models was the PR active site water tetrahedrally coordinated between the PR flap Ile50 A-subunit/B-subunit backbone nitrogens, and the respective substrate residues P1 and P1′ backbone carbonyl oxygens. Harmonic restraints were placed on those H-bonded heavy atoms as previously described [22,23].
Molecular dynamics simulations (Equilibrium) were performed with a target temperature of 300 K to represent room temperature, since that often corresponds to experimental conditions, constant pressure, an implicit solvent model (distance-dependent dielectric and dielectric constant of 3), and electrostatics with a spherical cutoff. Molecular dynamics simulations (Production) were performed with a target temperature of 300 K, temperature coupling decay time of 5.0, NVT production (constant-temperature and constant-volume ensemble), an implicit solvent model (distance-dependent dielectric and dielectric constant of 3) and electrostatics with a spherical cutoff.
RMSD calculations for Gag subdomains before and after substrate-clamp formations were performed by using Structure/Superimpose by Residue using the following indicated structures and respective residues: (1) the full-length Gag was generated from 1L6N.pdb and 4XFX.pdb (MA-CA-SP1), 1MFS.pdb (NC), and 2C55.pdb (p6) as modified [22], CA P149-C350 and NC V390-C426; (2) NC-SP2-p6, NC V390-C426 and p6 S462-S473/P478-Q500 excluding four hinge residues; (3) MA-CA-SP1, MA G2-A119, CA P149-M377; and for the MA-CA NMR structure models (1L6N.pdb), MA G2-A119 and CA P149-L283, excluding the C-terminal His-tag [34].

3. Results and Discussion

3.1. Full-Length Gag Polyprotein Structure-Based Model, Cleavage Order and Rates

A structure-based model of the full-length HIV-1 Gag polyprotein was previously published, as shown in Figure 2A [22]. The Gag polyprotein is comprised of the following structured subdomains and unstructured spacer peptides starting from the N-terminus, MA-CA-SP1-NC-SP2-p6 (Figure 2A). The orientations of the five subdomains within the Gag polyprotein are dynamic relative to one another due to the unstructured cleavage site between MA and CA, and unstructured spacer peptides separating CA, NC, and p6 (Figure 2A). The five cleavage sites in the full-length Gag polyprotein were reported to be cleaved in the following order: SP1/NC; SP2/p6; MA/CA; CA/SP1; and NC/SP2, with the resulting Gag cleavage products and reported cleavage rates shown in Figure 2B [31,39,42].

3.2. HIV-1 PR Bound to the Five Gag Substrates

In addition to the full-length Gag polyprotein model in Figure 2A [22], structure-based models of HIV-1 PR bound to 24-mer substrates representing the five Gag cleavage sites were also previously reported [22]. Here those HIV-1 PR/24-mer cleavage site complexes were ligated into the respective five Gag substrates, from which the cleavage site residues P12-P12′ were deleted (Materials and Methods). The Gag non-cleavage site PI resistance mutations MA L75R, CA H219Q, and NC R409K were added to the respective PR/Gag substrate complexes since each could either accept or donate an H-bond [30]. The PR/Gag substrate complexes were studied in the order in which they were cleaved by the PR (Figure 2B).

3.2.1. Full-Length Gag Substrate

The first Gag substrate cleaved by the PR was the full-length Gag, which the PR cleaved at the SP1/NC cleavage site (Figure 2A,B). The full-length Gag polyprotein contains two highly structured subdomains (MA and CA), as well as two moderately structured subdomains (NC and p6), with all four subdomains separated by unstructured regions containing the cleavage sites (Figure 2A). In the immature virion the Gag polyproteins are organized in a parallel 3D array with the N-terminal MA myristoyl groups embedded in the virion plasma membrane [43]. When PR binds to the SP1/NC cleavage site there are no unstructured residues between PR and NC and this stabilized the orientation of NC relative to PR; however, there were 10 unstructured residues between PR and CA and so there was no stabilization effect on CA (Figure 3A).
As a result, the starting orientations for the MA, CA, and p6 subdomains in the PR/full-length Gag model are speculative (Figure 3A). However, PR S-groove binding to the SP1/NC cleavage site in the full-length Gag orientated the two halves of the Gag polyprotein so that the structured CA and NC subdomains were adjacent (Figure 3A). Of the three Gag non-cleavage site PI resistance mutations analyzed in the full-length Gag (L75R, H219Q, and R409K) [30], R409K in the NC subdomain was found to make a direct H-bond interaction with the adjacent CA subdomain, while at the same time coordinating a network of H-bonds between native residues in CA and NC (Figure 3B,C).
The full-length Gag non-cleavage site PI resistance mutation was R409K. The NC R409K side chain nitrogen H-bonded to both the CA E211 side chain oxygen and CA E207 side chain oxygen while coordinating the following six H-bonds between native Gag NC and CA residues (Figure 3C): (1) NC K411 side chain nitrogen to both CA E203 and E207 side chain oxygens; (2) NC C416 backbone oxygen to CA R299 side chain nitrogen; (3) NC K418 side chain nitrogen to both CA D295 side chain oxygen and CA D298 side chain oxygen; (4) and NC E419 side chain oxygen to CA K302 side chain oxygen (Figure 3B). This model of PR bound to the full-length Gag illustrates how the single R409K non-cleavage site PI resistance mutation coordinated a network of H-bond and Van der Waals interactions to stabilize a substrate-clamp around the PR. It is important to note that the network of six native H-bonds coordinated by the R409K mutation can form the same substrate-clamp around the PR in native Gag in the absence of the R409K mutation, and contribute to the fast cleavage rate of the SP1/NC site in native Gag (Figure 2B). The root mean square deviation (RMSD) for selected C-α atoms in the CA and NC subdomains in Figure 3A,B were 0.49 and 0.53, respectively (Materials and Methods).

3.2.2. NC-SP2-p6 Substrate

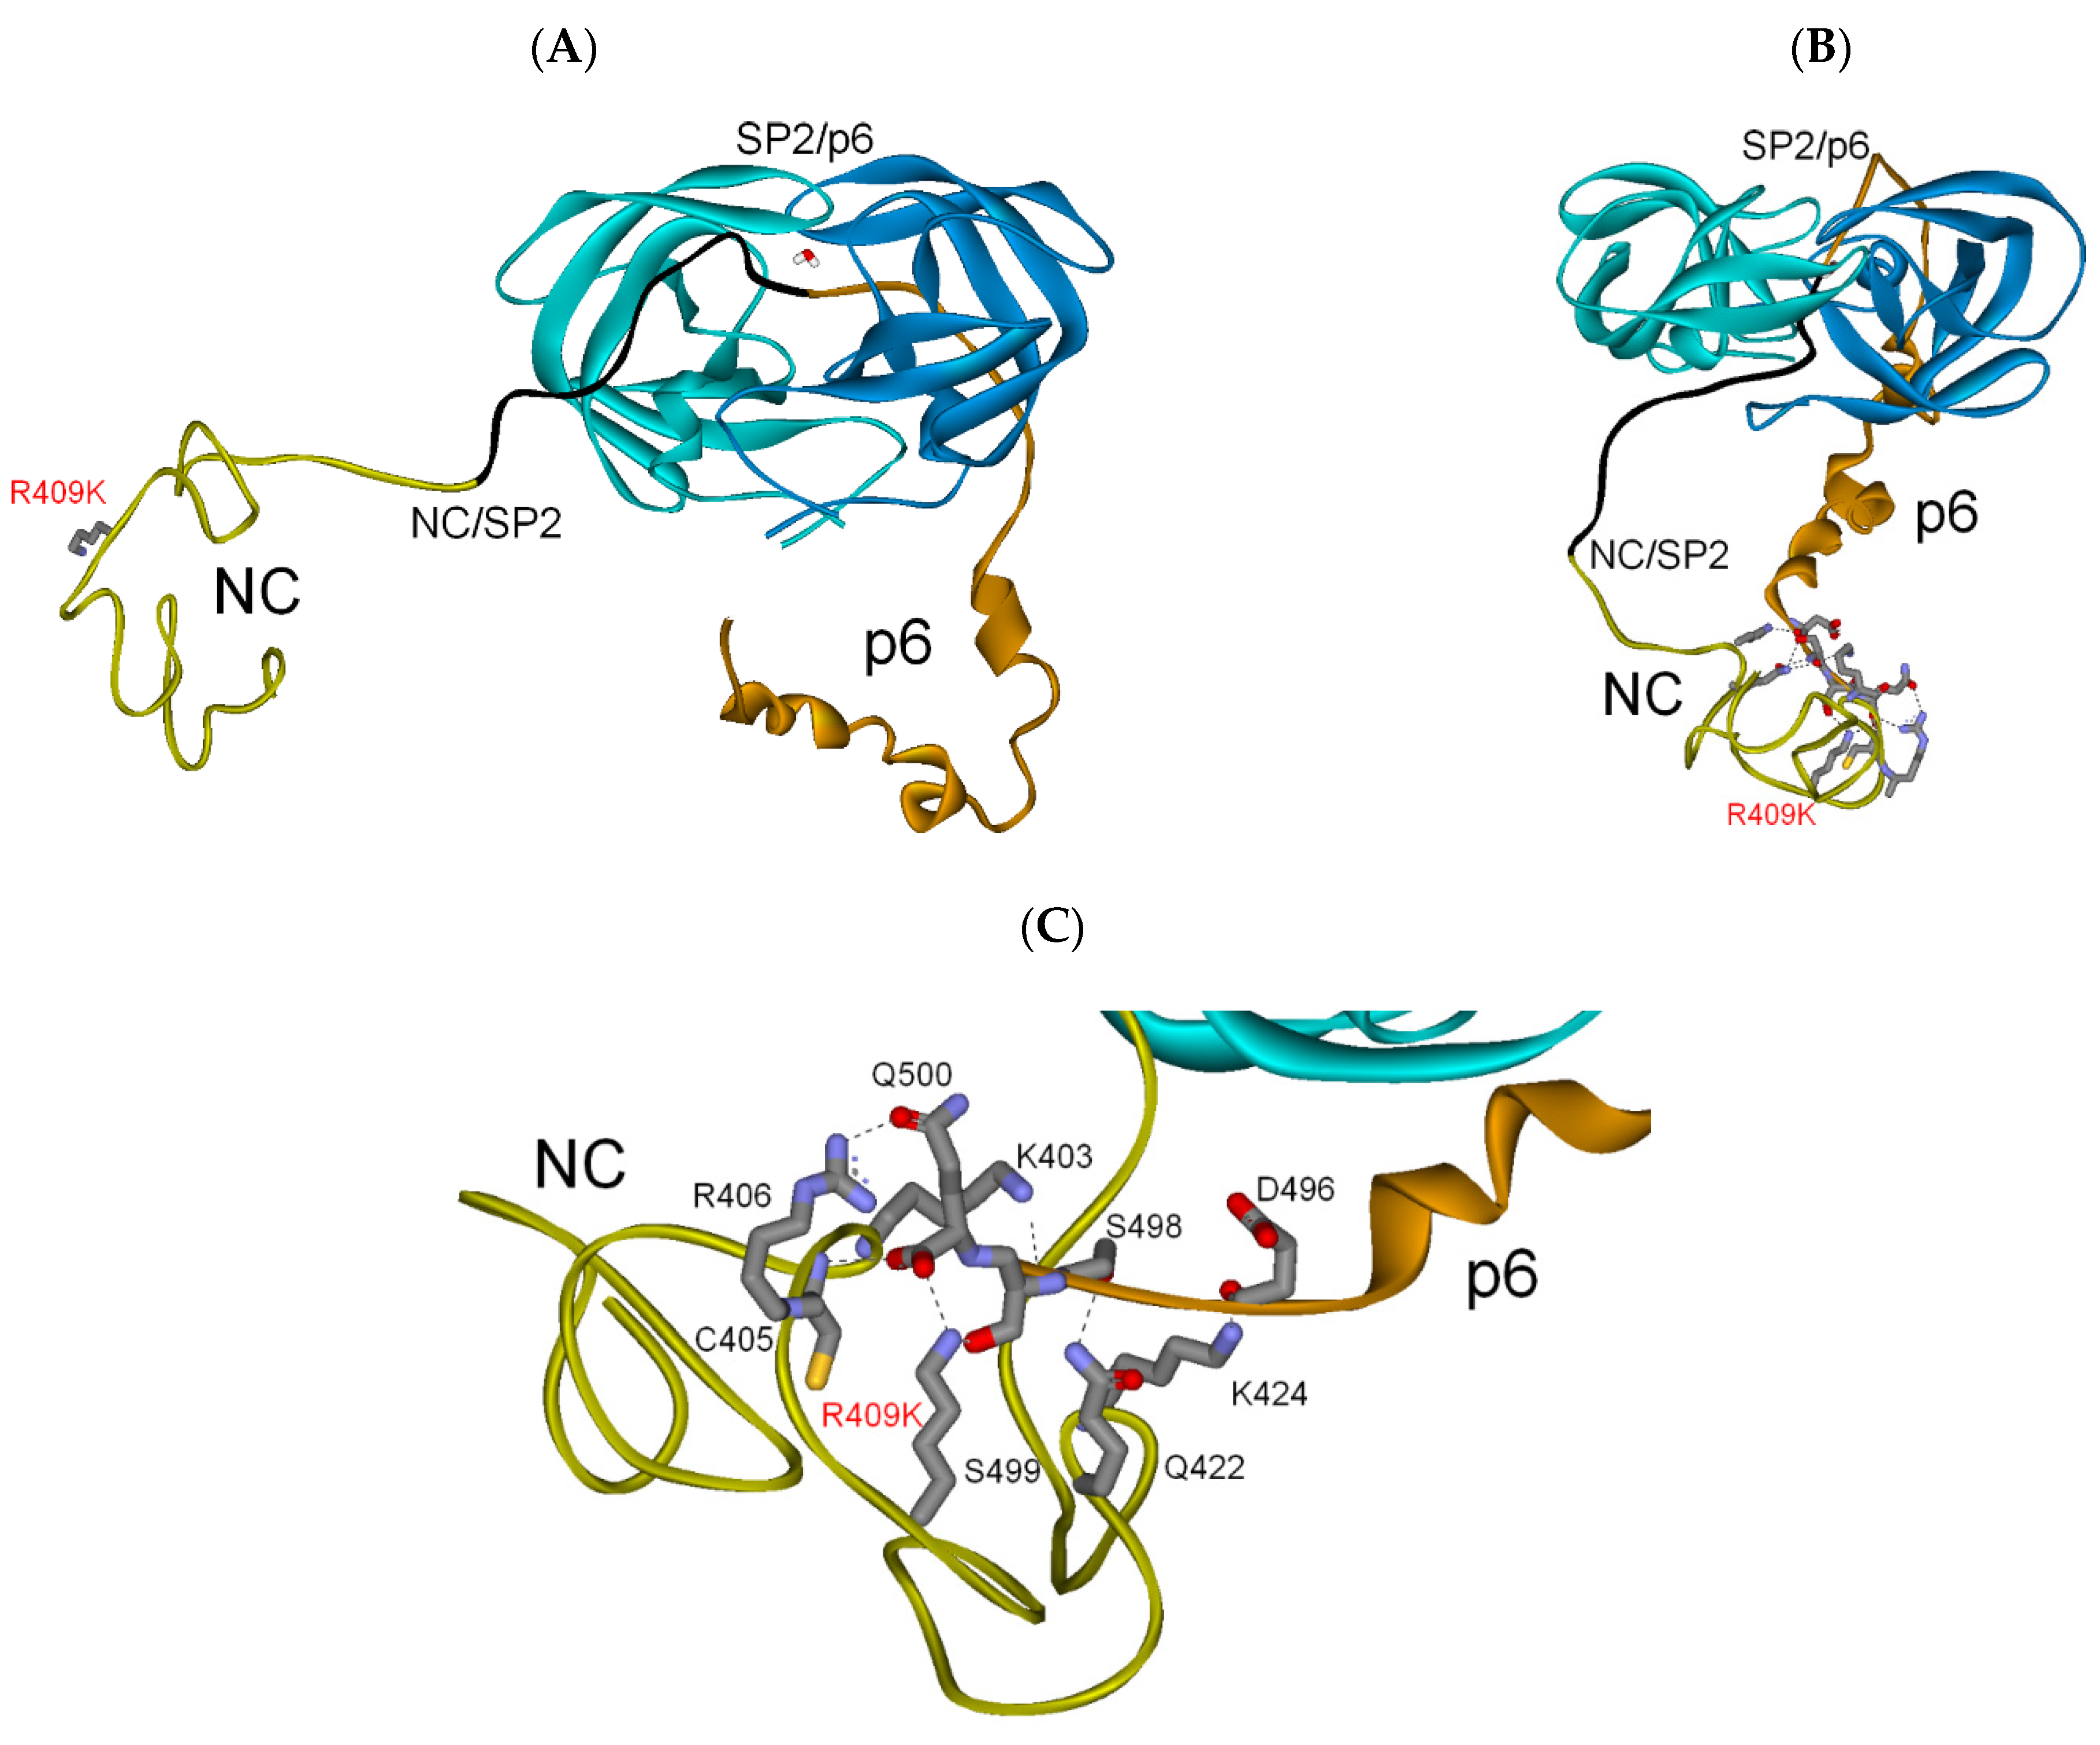
The second Gag substrate cleaved by the PR was NC-SP2-p6 (Figure 2B), which has two moderately structured subdomains separated by the unstructured SP2 (Figure 4A). When PR binds the SP2/p6 cleavage site in NC-SP2-p6, the S-grooves orientate the NC and p6 subdomains, so they are adjacent (Figure 4A). In the PR/NC-SP1-p6 ternary complex there are no unstructured residues between PR and p6 and so that stabilizes the orientation of p6 relative to PR; however, there are 12 unstructured residues between PR and NC and so there is no stabilization effect on NC (Figure 4A). Of the three Gag non-cleavage site PI resistance mutations reported by Gatanaga and coworkers [30], R409K in the NC subdomain was found to make direct H-bond interactions with the adjacent p6 subdomain, while at the same time coordinating a network of H-bonds between native residues in NC and p6 (Figure 4B).
The NC-SP2-p6 non-cleavage site PI resistance mutation was R409K. Here the same mutation used above in the full-length Gag substrate-clamp was able to play a similar role in forming the NC-SP2-p6 substrate-clamp. The NC R409K side chain nitrogen H-bonded to both p6 S499 side chain oxygen and p6 Q500 C-terminal carboxyl oxygen 1 and coordinated the following five H-bonds between native NC and p6 residues (Figure 4C): (1) NC K403 side chain nitrogen to p6 S498 backbone oxygen; (2) NC C405 backbone nitrogen to p6 Q500 C-terminal carboxyl oxygen 2; (3) NC R406 side chain nitrogen to p6 Q500 side chain oxygen; (4) NC Q422 side chain nitrogen to p6 S498 side chain oxygen; (5) and NC K424 side chain nitrogen to p6 D496 backbone oxygen. The fact that the same Gag non-cleavage site PI resistance mutation (NC R409K) can coordinate H-bond networks for both the SP1/NC and SP2/p6 cleavage sites, which are bordered by structure Gag subdomains, means that only one additional Gag non-cleavage site PI resistance mutation is needed for the MA/CA cleavage site that is also bordered by structured Gag subdomains (Figure 2A). The RMSD for selected C-α atoms in the NC and p6 subdomains in Figure 4A,B were 0.51 and 0.64, respectively (Materials and Methods).

3.2.3. MA-CA-SP1 Substrate (Single and Double Mutation)

The third Gag substrate cleaved by the PR was MA-CA-SP1 (Figure 2B), and is an ideal substrate for testing the substrate-clamp mechanism because the PR binds the 24 unstructured MA/CA cleavage site residues, leaving no unstructured residues between the PR and the adjacent highly structured MA and CA subdomains (Figure 5A).
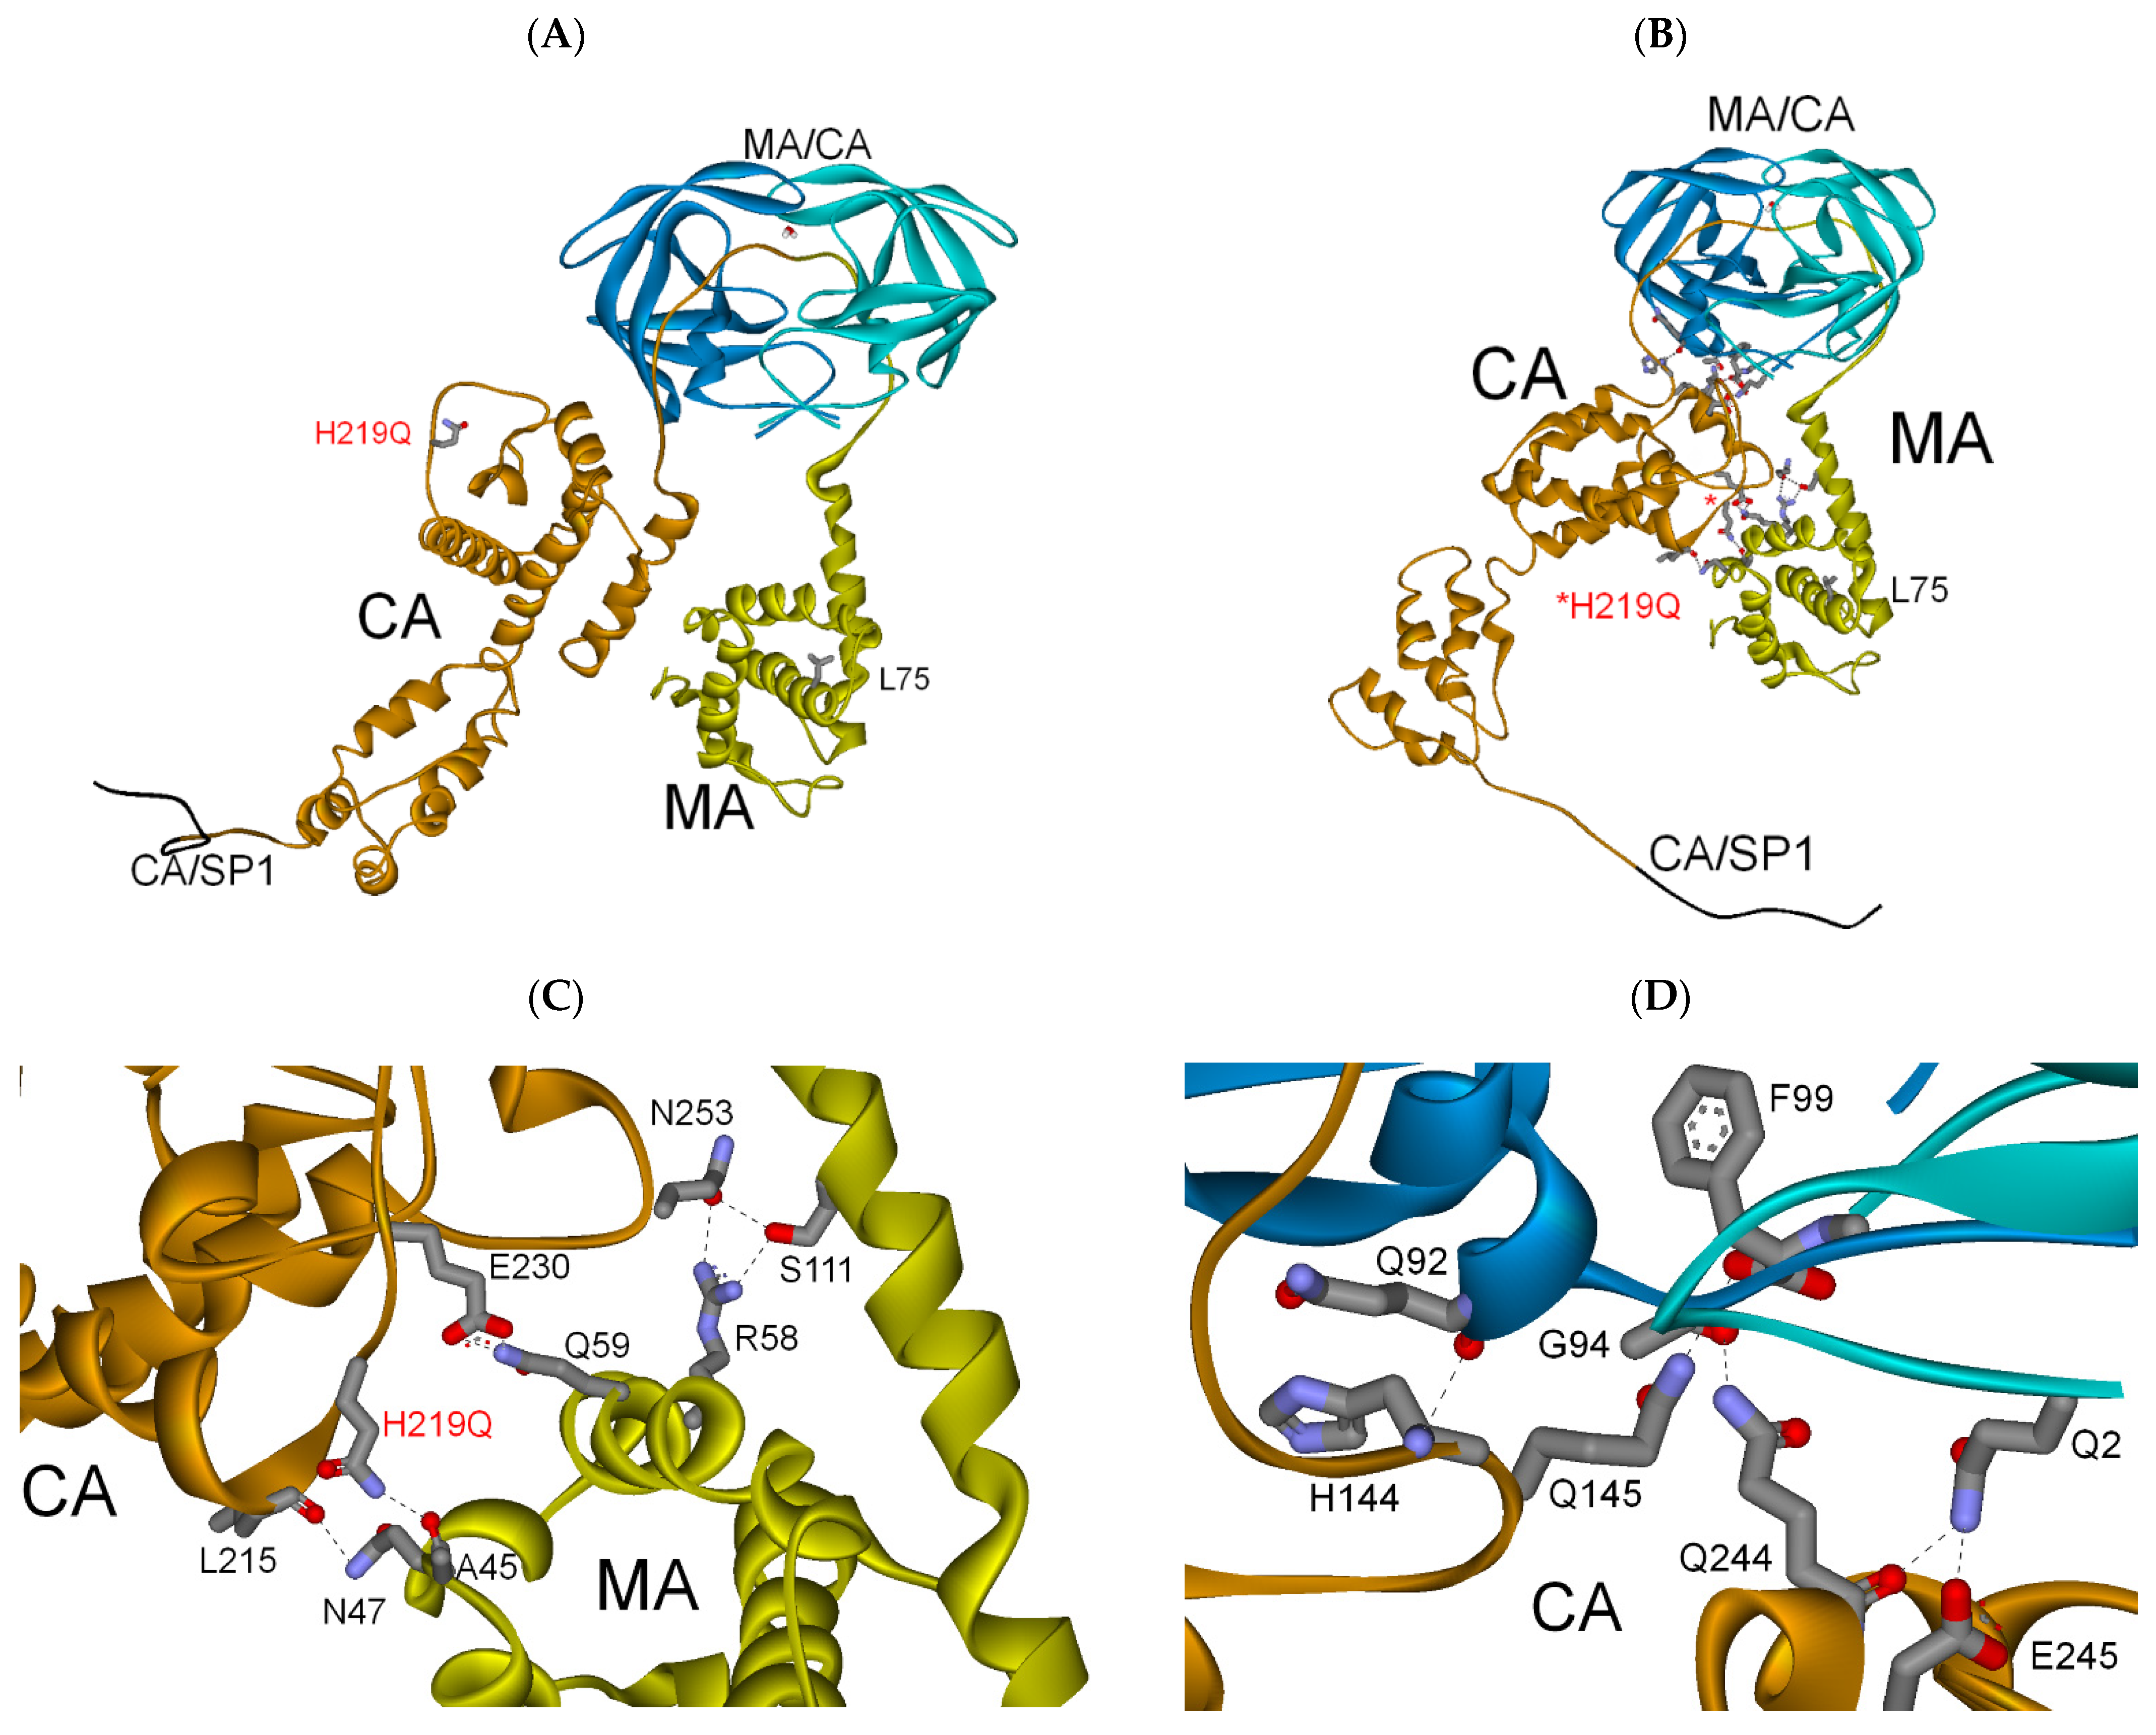
The solution NMR studies of an MA-CA polyprotein revealed that complementary surfaces/charges of the MA and CA subdomains came to within 2–6 A [34], and that supports the model of the PR bound to the MA-CA-SP1 substrate (Figure 5A). Unlike the above PR/full-length Gag and PR/NC-SP2-p6 ternary complexes (Figure 3 and Figure 4), the PR/MA-CA-SP1 ternary complex leaves little freedom of movement for the MA and CA subdomains, except along the respective vertical axis of MA and CA (Figure 5A). PR S-groove binding to the MA/CA cleavage site in MA-CA-SP1 orientates the MA and CA subdomains so that they are in position to form a substrate-clamp that encircles the PR (Figure 5A). Of the three Gag non-cleavage site PI resistance mutations reported by Gatanaga and coworkers [30], only L75R in the MA subdomain, and H219Q in the CA subdomain, were found in the MA-CA-SP1 polyprotein Figure 5A. The Gag non-cleavage site PI resistance mutations MA L75R and CA H219Q were added to the MA-CA-SP1 substrate as either a single mutation (CA H219Q) or as a double mutation (MA L75R/CA H219Q), and in both cases the mutations were able to make direct H-bond interactions with the respective adjacent subdomain, while coordinating networks of H-bond interactions between native residues in the MA and CA subdomains (Figure 5B and Figure 6A).
The MA-CA-SP1 non-cleavage site PI resistance single mutation was H219Q. The CA H219Q side chain nitrogen made a H-bond to MA A45 backbone oxygen and coordinated the following four H-bonds between native MA and CA residues (Figure 5C): (1) CA L215 backbone oxygen to MA N47 side chain nitrogen; (2) CA E230 side chain oxygen to MA Q59 side chain nitrogen; (3) and CA N253 side chain oxygen to MA R58 side chain nitrogen and MA S111 side chain oxygen; while also coordinating another five H-bonds between CA and PR (Figure 5D): (1) CA H144 backbone nitrogen to PR B-subunit Q92 backbone oxygen: (2) CA Q145 side chain nitrogen to PR B-subunit F99 C-terminal carboxyl oxygen; (3) CA Q244 side chain nitrogen to PR B-subunit G94 backbone oxygen; (4) CA Q244 backbone oxygen to PR B-subunit Q2 side chain nitrogen; (5) and CA E245 side chain oxygen to PR A-subunit Q2 side chain nitrogen. The RMSD for selected C-α atoms in the MA and CA subdomains in Figure 5A,B were 0.75 and 2.45, respectively (Materials and Methods).
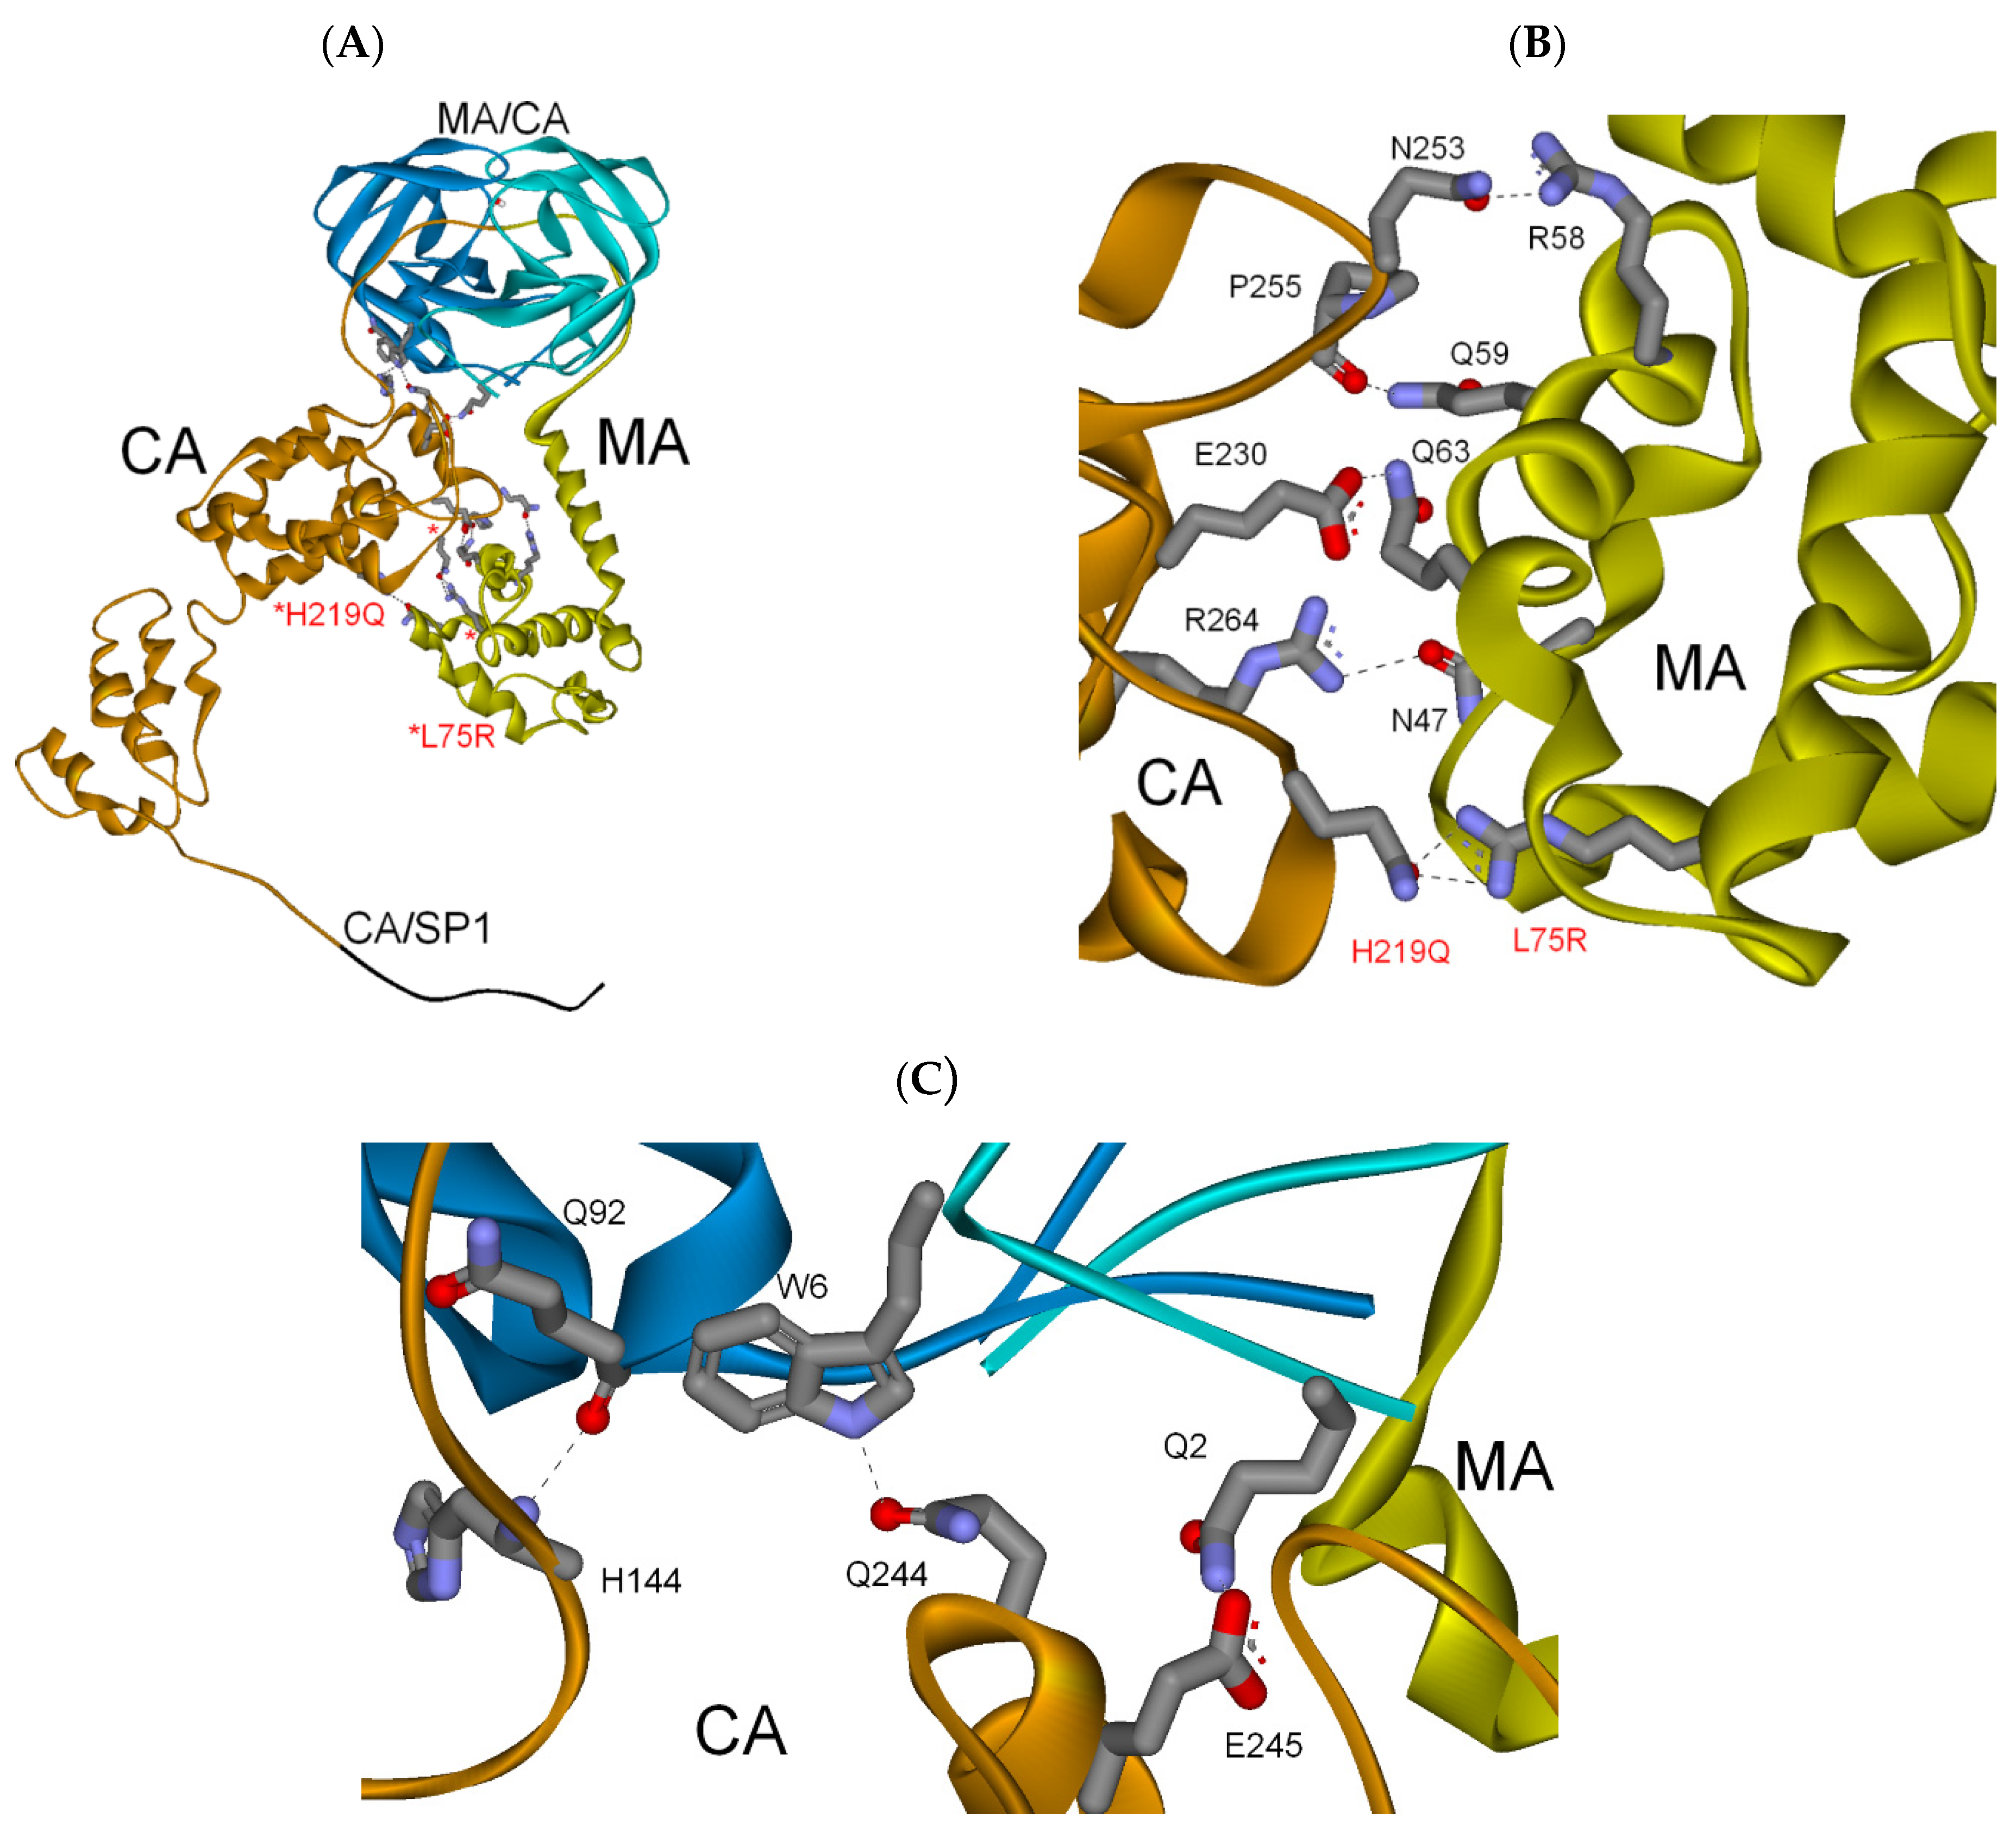
The MA-CA-SP1 non-cleavage site PI resistance double mutation was L75R/H219Q (Figure 6A). The MA L75R side chain nitrogens H-bonded to the CA H219Q side chain oxygen and coordinated the following four H-bonds between native MA and CA residues (Figure 6B): (1) MA N47 side chain oxygen to CA R264 side chain nitrogen; (2) MA Q63 side chain nitrogen to CA E230 side chain oxygen; (3) MA Q59 side chain nitrogen to CA P255 backbone oxygen; (4) and MA R58 side chain nitrogen to CA N253 side chain oxygen; while also coordinating another three H-bonds between CA and PR (Figure 6C): (1) CA H144 backbone nitrogen to PR B-subunit Q92 backbone nitrogen; (2) CA Q244 side chain oxygen to PR A-subunit W6 ring nitrogen; (3) and CA E245 side chain oxygen to PR A-subunit Q2 side chain nitrogen. The RMSD for selected C-α atoms in the MA and CA subdomains in Figure 5A and Figure 6A are 1.05 and 2.48, respectively (Materials and Methods). The RMSD values for the MA and CA subdomains in Figure 5B and Figure 6A are similar to the RMSD values of 1.24–2.27 calculated here for the MA and CA subdomains in different solution NMR structures of a Gag polyprotein, as seen in Materials and Methods [34].
Here we see how either a single or double Gag non-cleavage site PI resistance mutation can H-bond to either a native residue or a resistance residue in the adjacent subdomain and then coordinate a network of up to nine H-bonds between native residues in the MA and CA subdomains as well as between the CA subdomains and native residues in the PR A and B-subunits (Figure 5C,D and Figure 6B,C). The fact that the coordinated H-bond networks were between native MA, CA, and PR residues supports the substrate-clamp mechanism functioning in the wild-type Gag as a way to increase the PR cleavage rate for the MA/CA cleavage site in the MA-CA-SP1 polyprotein (Figure 2B). The substrate-clamp mechanism can also function in the Gag-Pol polyprotein, since the Pol p6*, PR, RT, and IN subdomains are all separated by unstructured linkers which contain the PR cleavage sites [22,31]. However, in the Pol polyprotein there is no counterpart to the Gag protein substrates CA-SP1 and NC-SP1 (Figure 2B). Based on the above results for the three Gag substrates, a minimum of two Gag non-cleavage site PI resistance mutations were needed to coordinate the respective H-bond networks, and stabilize the resulting substrate-clamps, for the three Gag cleavage sites bordered by structured subdomains (full-length Gag, NC-SP1-p6, and MA-CA-SP1), seen in Figure 2B. These finding confirm the results reported by Gatanaga and coworkers who found a minimum of two Gag non-cleavage site PI resistance mutations (CA H219Q, NC R409K) were needed for high-level resistance against three PIs [30].
It was reported that CA H219 is in the cyclophilin A (CypA) binding loop of CA and H-bonds to CypA N71 [44]. CA H219 does make a single side chain nitrogen H-bond to the CypA N71 backbone oxygen in one of the two CypA/CA complexes in the crystal asymmetric unit; however, in the other complex the H219 side chain nitrogen makes an intramolecular H-bond to the CA E320 side chain oxygen to stabilize the CA CypA binding loop, without H-bonding to CypA [45]. The H219Q mutation prevents H-bond interactions with either CypA N71, or CA E230, which can contribute to reduced CypA binding by CA, but how that correlated with PR resistance was not clarified [44].

3.2.4. CA-SP1 Substrate

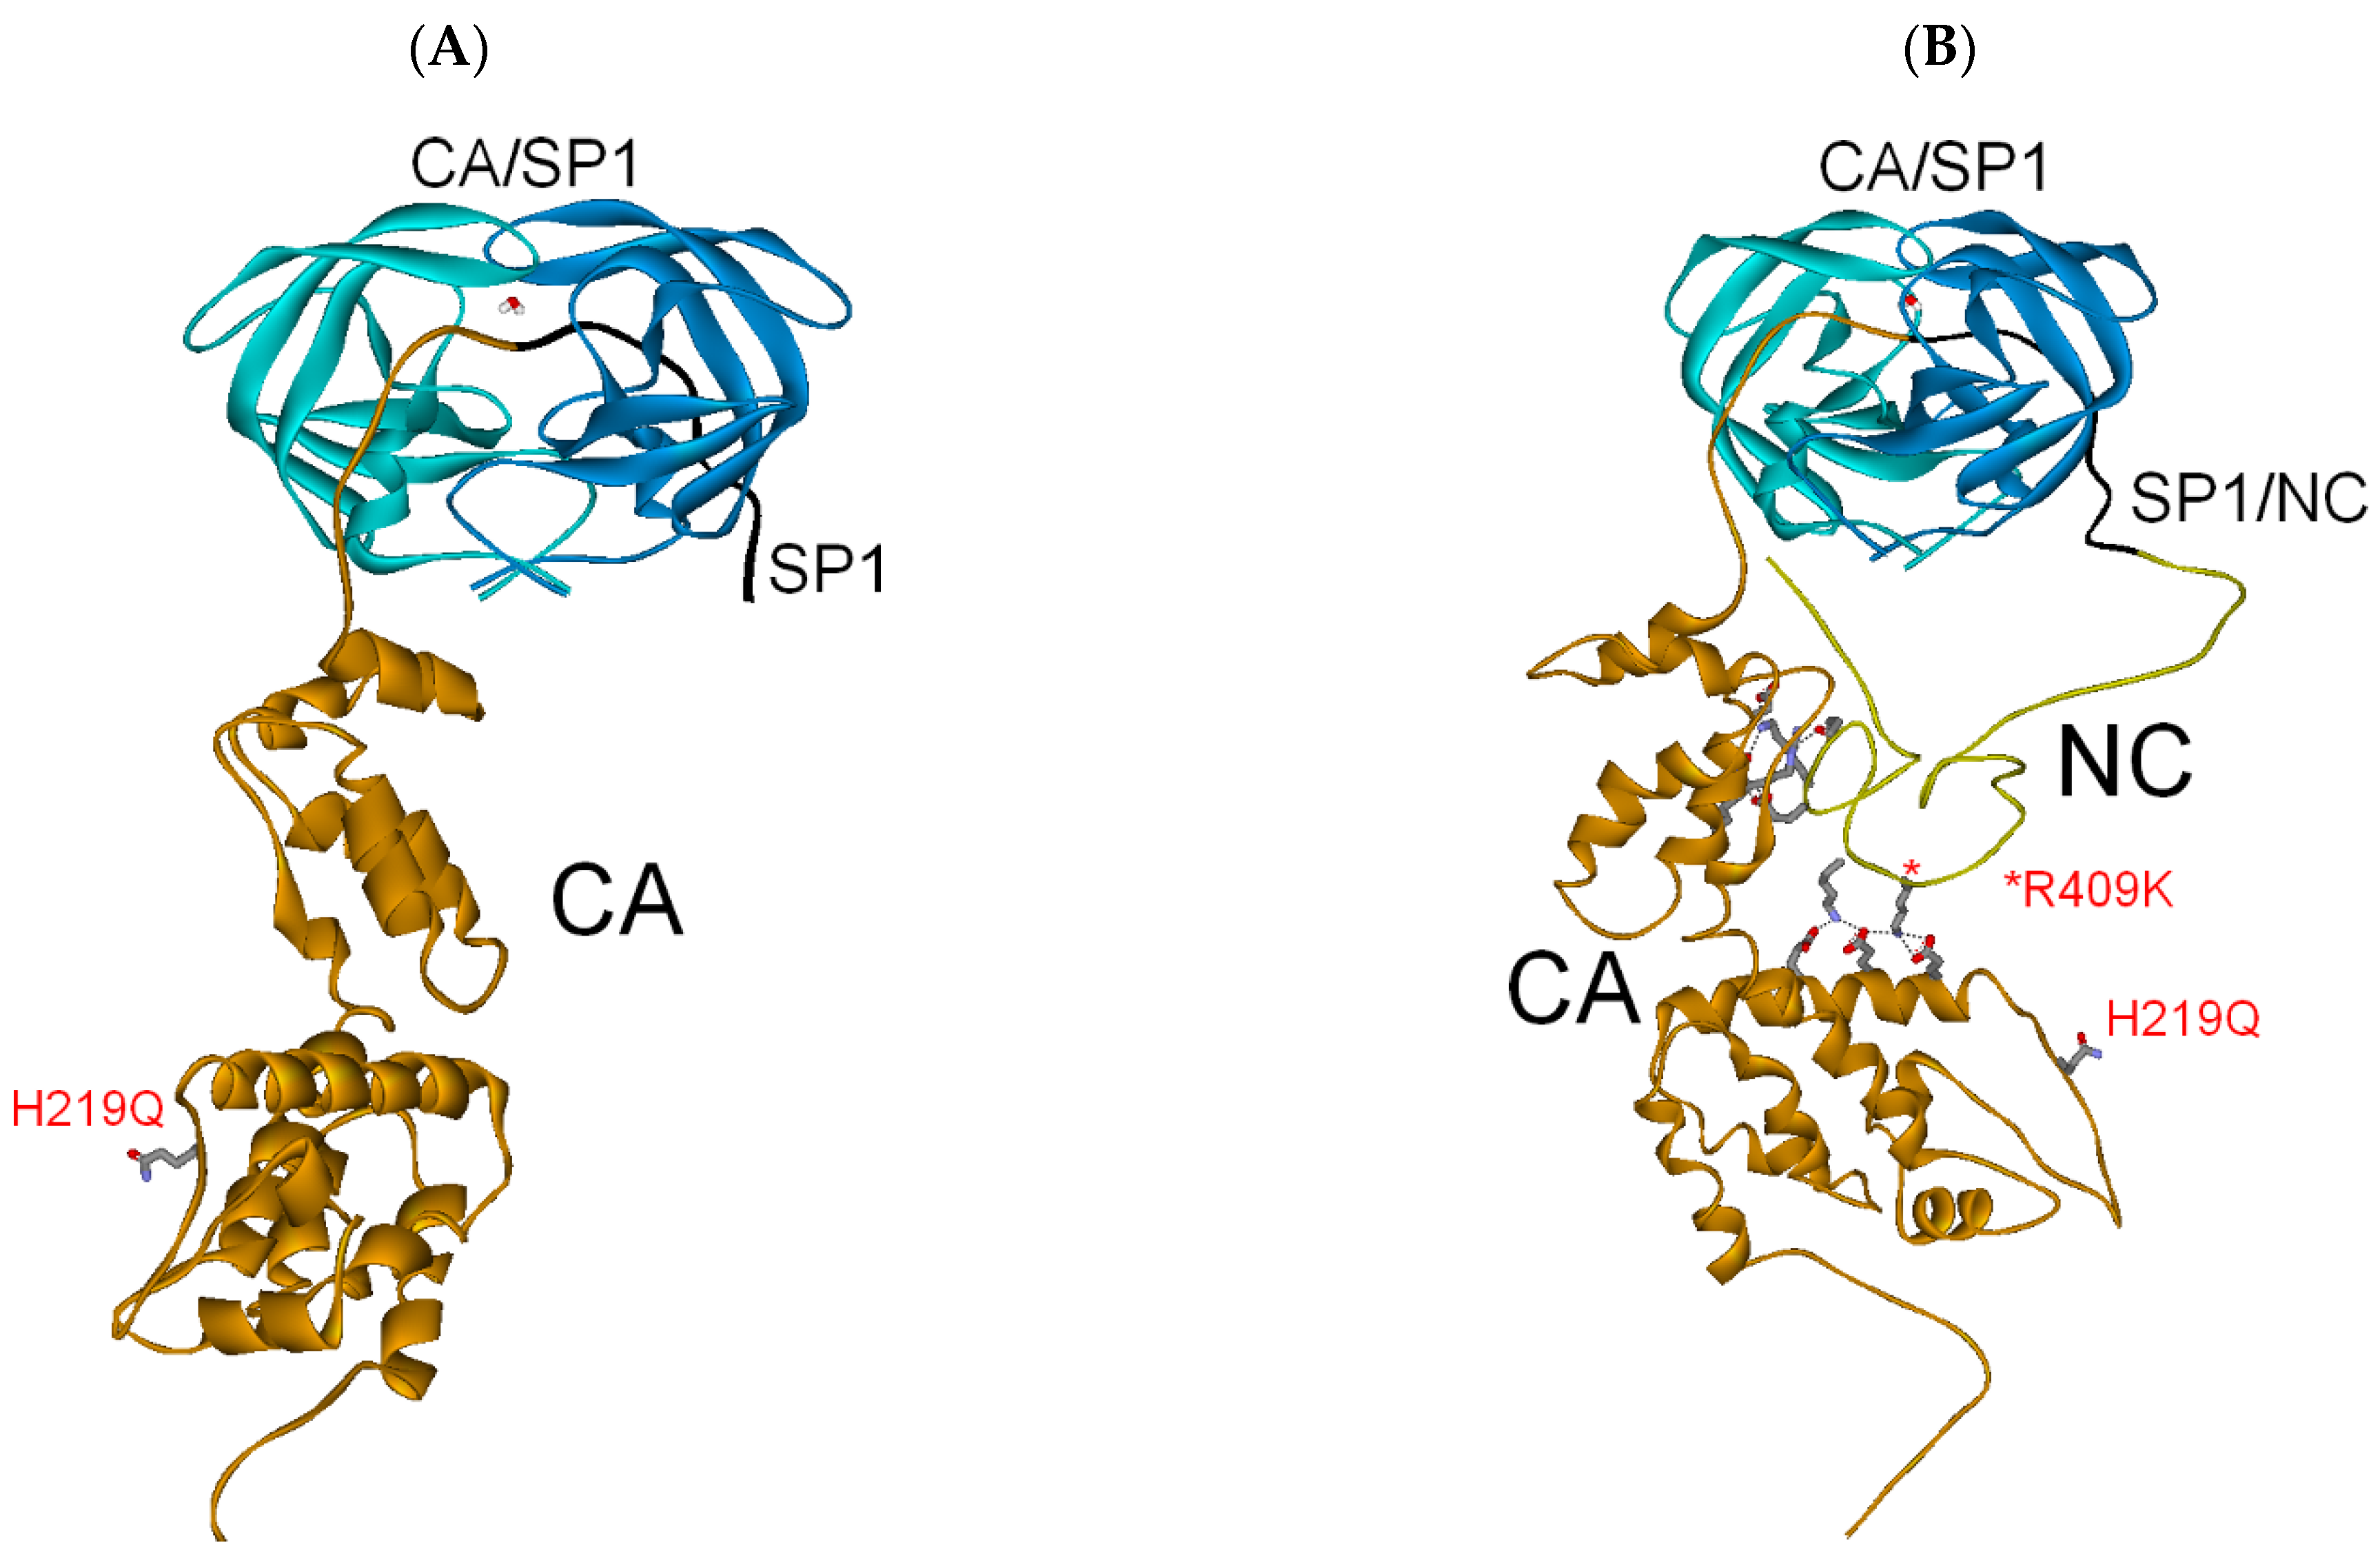
The fourth Gag substrate cleaved by the PR was CA-SP1 (Figure 2B), a substrate that cannot form a substrate-clamp around the PR due to the C-terminal end of the CA-SP1 protein extending only two residues past the S-groove-bound CA/SP1 cleavage site, while the N-terminal highly-structured CA protein has no unstructured residues between it and the PR, which limits the orientations it can adopt (Figure 7A).
The CA/SP1 cleavage site in the CA-SP1 substrate was reported to be cleaved 350-fold slower than the adjacent SP1/NC cleavage site in the full-length Gag, as seen in Figure 2B [31]. When Pettit and coworkers blocked the cleavage at the fast SP1/NC cleavage site, in the context of the full-length Gag (Figure 2A,B), the cleavage at the adjacent slow CA/SP1 cleavage site increased 20-fold [40]. When Pettit and coworkers blocked cleavage at the fast SP1/NC cleavage site in the full-length Gag, the PR bound the slow CA/SP1 site with the structured CA and NC subdomains on either side of the CA/SP1 cleavage site, Figure 7B [40].
Deshmukh and coworkers also investigated the cleavage rates of Gag by replacing both the moderate MA/CA and slow CA/SP1 cleavage site residues P5-P5′ with the fast SP1/NC cleavage site residues P5-P5′ in a ∆Gag construct (MA-CA-SP1-NC) [46]. In that study by Deshmukh and coworkers, the cleavage rate for the mutated MA/CA site did not change significantly [46], indicating the importance of cleavage site residues P12-P6/P6′-P12′ in determining the MA/CA cleavage rate, since both the MA/CA and SP1/NC sites were bordered by structured subdomains that can form a substrate-clamp, see Figure 3, Figure 5 and Figure 6 [46]. Interestingly, Miczi and coworkers demonstrated the importance of the MA/CA cleavage site P12-P6/P5′-P12′ residues by replacing the native MA/CA site residues P12-P6/P5′-P12′ with the respective residues from the slow CA/SP1 site (also named CA/p2), and reported that the cleavage at the mutant MA/CA site had a 2.9-fold lower kcat/KM [25]. The CA/SP1 cleavage site residues |P12-P5| were reported to have the weakest in silico interaction with PR of all the cleavage site |P12-P5| residues in the Gag and Pol polyproteins [22].
In addition, Deshmukh and coworkers reported that the cleavage at the mutated CA/SP1 site, in which the residues P5-P5′ were replaced with the fast SP1/NC site residues P5-P5′, increased 12-fold [46]. That increase in the cleavage rate at the mutated CA/SP1 site reported by Deshmukh and coworkers is significantly less than the 20-fold increase reported by Pettit and coworkers for the CA/SP1 site when the adjacent SP1/NC site was blocked, as discussed above [40]. The differences in cleavage enhancement at the CA/SP1 site is likely due to CA being generated in the Deshmukh and coworker study from both the mutated but still slow CA-SP1 substrate as well as from the mutated and fast CA-SP1-NC substrate in which the CA/SP1 cleavage site was bordered by the CA and NC structured subdomains, and which resulted in the generation of the telltale SP1-NC cleavage product [46]. In the case of both the Pettit and coworkers’ and Deshmukh and coworkers’ results [40,46], a substrate-clamp composed of CA and NC could form around the PR bound to the respective CA/SP1 cleavage sites increasing the cleavage rates. When the Gag CA-SP1-NC substrate with the R409K mutation was modeled here bound to PR at the CA/SP1 site, the CA and NC subdomains were able to form a substrate-clamp around the PR (Figure 7B) and make the same network of H-bonds between CA and NC as reported for the PR/full-length Gag ternary complex with the R409K mutation (Figure 3B,C). The substrate-clamp mechanism represents a functional explanation for those intriguing CA/SP1 cleavage site results reported by Pettit and coworkers and Deshmukh and coworkers [40,46].

3.2.5. NC-SP2 Substrate

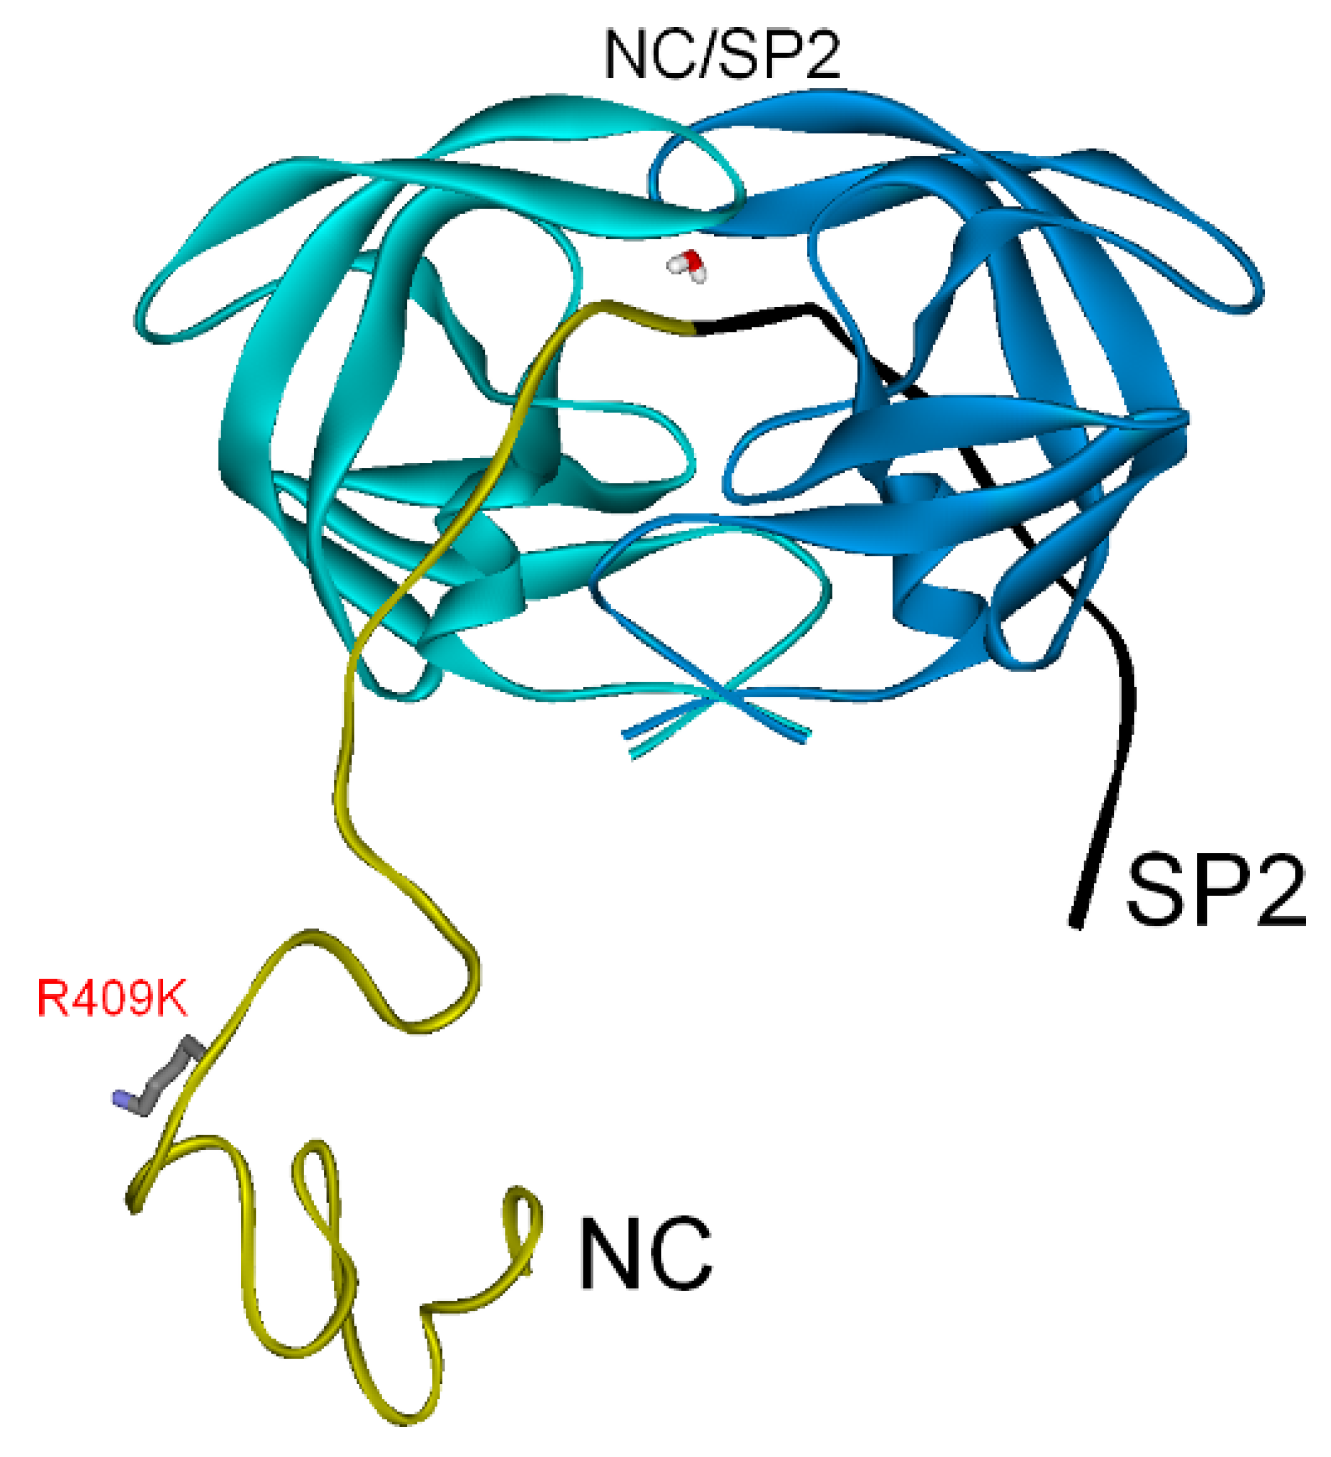
The fifth Gag substrate cleaved by the PR was NC-SP2 (Figure 2B), a second Gag substrate which cannot form a substrate-clamp around the PR due to the C-terminal end of the NC-SP2 protein extending only four residues past the S-groove-bound NC/SP2 cleavage site (Figure 8).
In addition, the NC protein has no significant unstructured region between it and the PR and that limits the orientations it can adopt (Figure 8). The NC-SP2 substrate was reported to be cleaved at a rate 400-fold slower than the SP1/NC cleavage site when using a full-length Gag substrate, as seen in Figure 2B [31]. The inability of the NC-SP2 substrate to form a substrate-clamp explains the slow cleavage rate versus the Gag substrates which can form a substrate-clamp (Figure 3, Figure 4, Figure 5 and Figure 6).

3.2.6. Interaction Energy Scores between PR and Substrates, and Substrate Subdomains

In order to quantify the effect of the Gag non-cleavage site PI resistance mutations on the PR binding to Gag substrates, intermolecular interaction energy scores (IES), which included electrostatic and Van der Waals interactions, were first calculated between the PR and bound Gag substrates (Table 1, column 2).
Secondly, intramolecular IESs were calculated between the subdomains for a given Gag substrate that was bound by the PR (Table 1, column 3), since the intramolecular subdomain interactions stabilized the substrate-clamp around the PR without directly interacting with the PR (Figure 3, Figure 4, Figure 5 and Figure 6). In the case of each Gag substrate with structured subdomains on both sides of the cleavage site (full-length Gag, NC-SP2-p6, MA-CA-SP1), the non-cleavage site PI resistance mutations resulted in a stronger interaction between the substrate subdomains (Table 1, Column 3), which made the total IES for each of those PR/substrate combinations stronger than the respective wild-type combination (Table 1, Column 4). When PR bound to the SP1/NC cleavage site in the full-length Gag with the R409K resistance mutation the total IES increased by 30%, when PR bound to the SP2-p6 cleavage site in NC-SP2-p6 with the R409K resistance mutation the total IES increased by 27%, and when PR bound to the MA/CA cleavage site in MA-CA-SP2 with the H219Q resistance mutation the total IES increased by 19%, while for the double mutant L75R/H219Q the total IES increased by 25% (Table 1, Column 4). The Gag non-cleavage site PI resistance mutations made direct H-bonds with residues in the adjacent structured subdomain, and coordinated up to nine additional H-bonds between native residues in the Gag subdomains (Figure 3, Figure 4, Figure 5 and Figure 6), as well as between native residues in the subdomains and the PR (Figure 5B,D and Figure 6A,C). Interestingly, the IES for the PR bound to the CA-SP1 and NC-SP2 substrates were similar to the IES for the PR bound to the wild-type full-length Gag and NC-SP2-p6 substrates (Table 1, Column 4, unbracketed IES). That result indicates wild-type Gag substrates (full-length Gag, NC-SP2-p6, and MA-CA-SP1) likely form substrate-clamps that, while weaker than those formed by the PI resistant Gag substrates (Table 1, Column 4, bracketed IES), still trap PR on the respective substrates increasing the cleavage rates (Figure 2B).

3.2.7. Gag Cleavage Order Factors

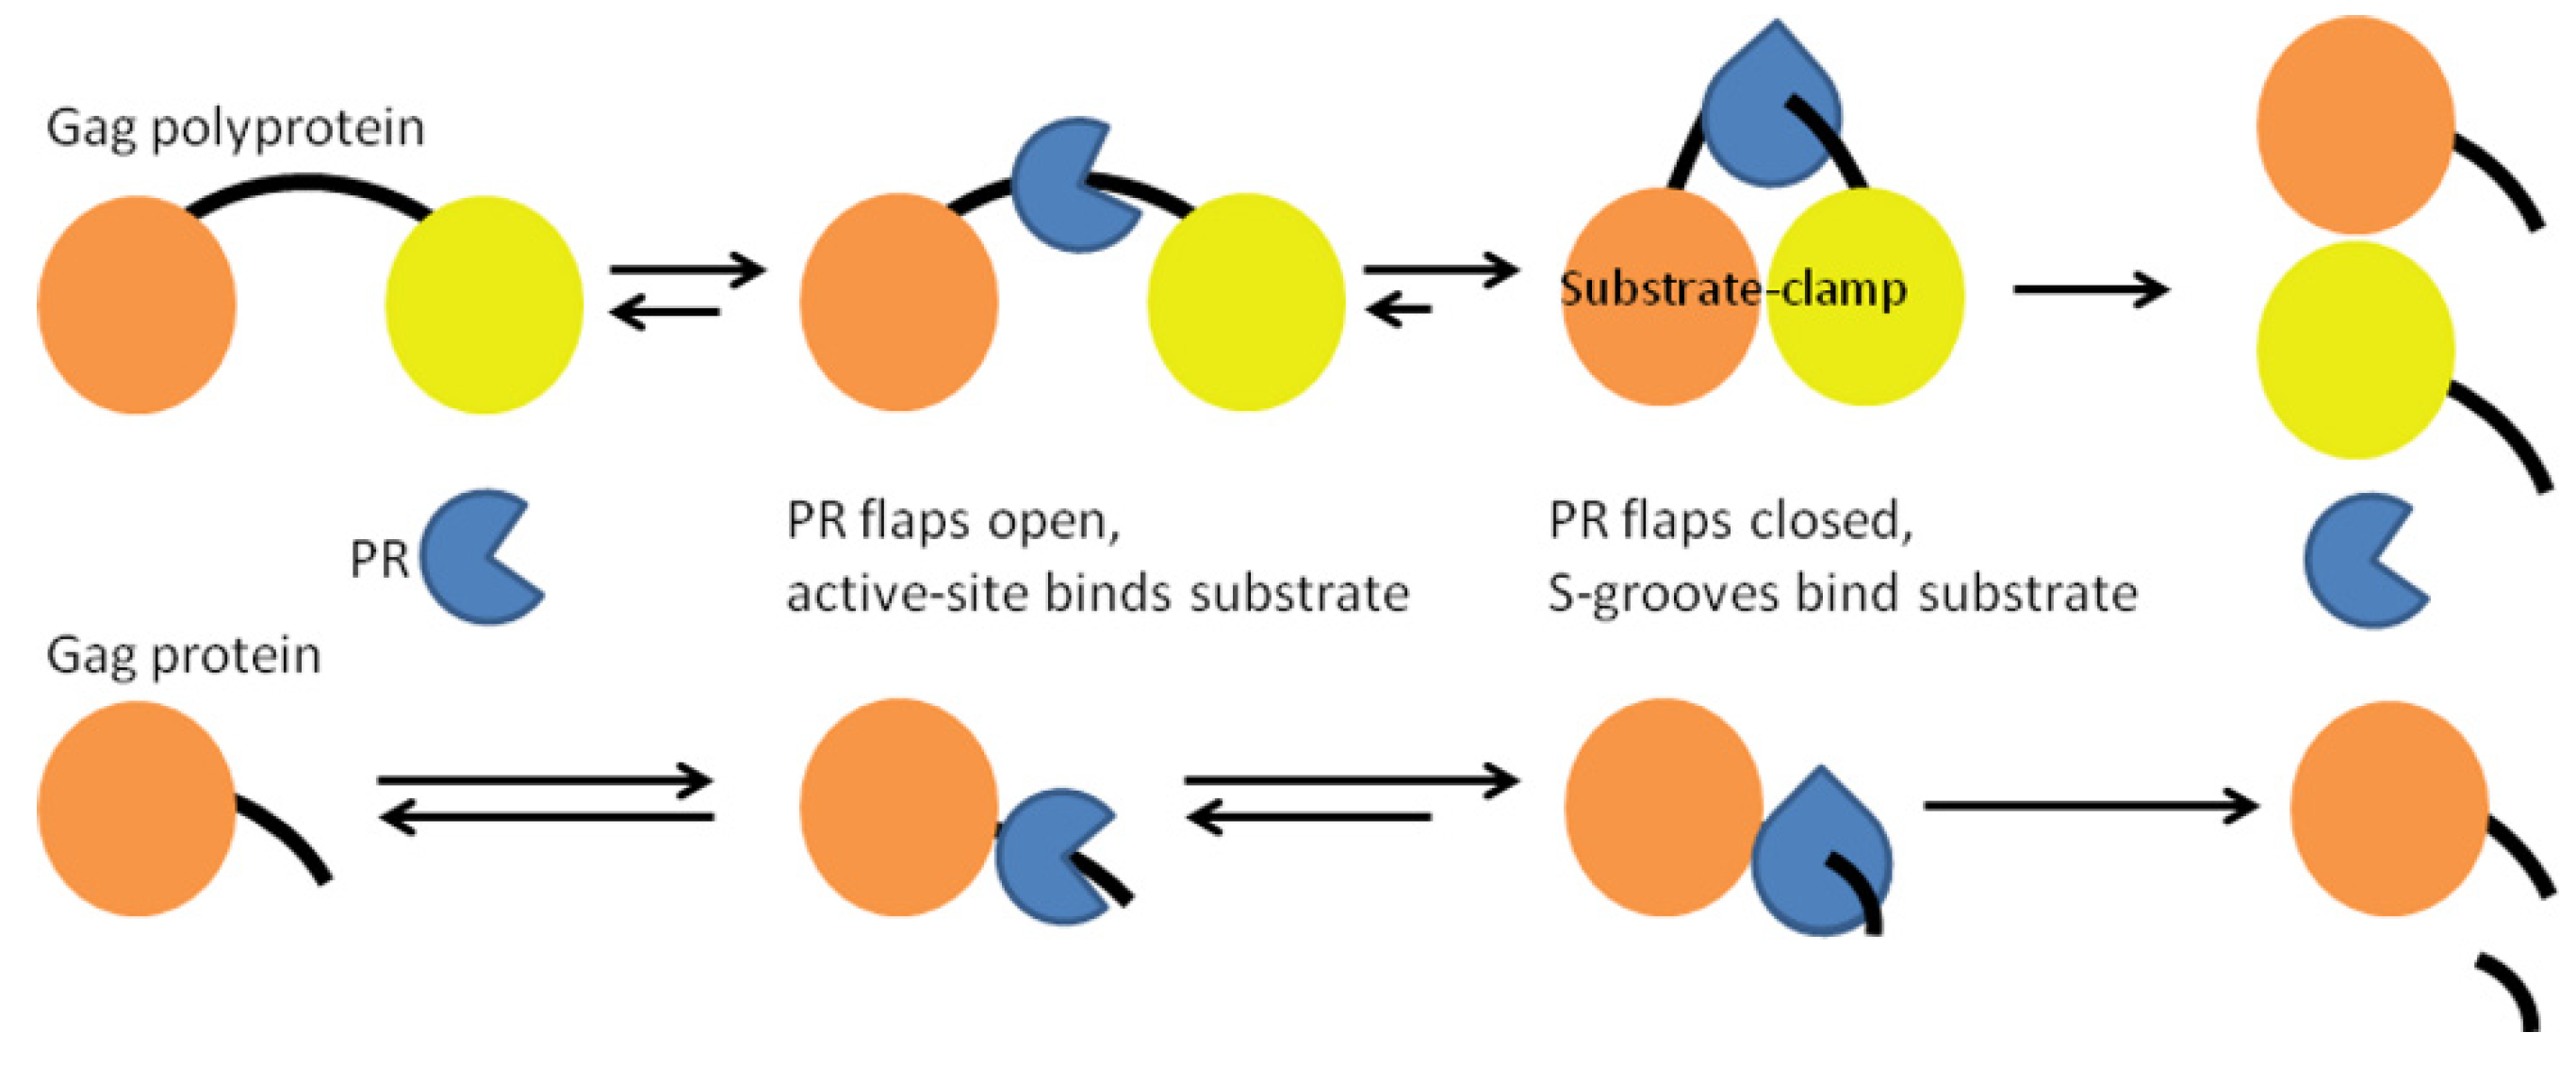
From the above structure-based models (Figure 3, Figure 4, Figure 5, Figure 6, Figure 7 and Figure 8) and computational chemistry results (Table 1), there are three factors which when combined contributed to the cleavage order of the Gag polyprotein (Figure 2B): (1) PR accessibility to a cleavage site, the length of the unstructured region containing a cleavage site affects PR access to and the cleavage of a site, i.e., the two fastest sites included SP1/NC within a region of 37 unstructured residues and SP2/p6 within a region of 39 unstructured residues, in contrast, the slower MA/CA site is centered within a region of 24 unstructured residues constraining PR access to, and binding of, the MA/CA site (Figure 3, Figure 4, Figure 5 and Figure 6); (2) the primary sequence of a cleavage site (P12-P12′) affects PR affinity for a site, so while the CA/SP1 and SP1/NC sites are both within the 37 residue SP1 unstructured region, the SP1/NC site is cleaved first due to PR having a higher affinity for the SP1/NC cleavage site sequence P12-P12′, the same applies to the NC/SP2 and SP2/p6 cleavage sites in which the SP2/p6 site is cleaved first (Figure 2B); (3) the ability of the substrate to form a substrate-clamp around the PR bound to the cleavage site increases the cleavage rate, so the faster SP1/NC, SP2/p6, and MA/CA sites are all within substrates that can form a substrate-clamp (Figure 3, Figure 4, Figure 5 and Figure 6), while the slowest CA/SP1 and NC/SP2 sites are within substrates that cannot form a substrate-clamp (Figure 7A and Figure 8). A schematic diagram of PR cleaving sites within a Gag substrate that can form a substrate-clamp (Gag polyprotein), versus sites within a Gag substrate that cannot form a substrate-clamp (Gag protein), is shown in Figure 9.
It is proposed that at each step in the cleavage of a Gag polyprotein substrate, there is a rate enhancement over the cleavage of the Gag protein substrate, and that is indicated by the relative lengths of the association and disassociation arrows (Figure 9): (1) the Gag polyprotein substrates have long unstructured linkers containing the cleavage site; (2) the ability of the Gag polyprotein substrates to form a substrate-clamp can prevent the bound PR dimer from disassociating from the polyprotein substrate until PR cleaved the Gag polyprotein substrate, irreversibly breaking the substrate-clamp. Molecular dynamics simulations supported the stability of the substrate-clamps and associated H-bond networks presented here (Figure 3, Figure 4, Figure 5 and Figure 6, Materials and Methods).
In regards to the occurrence of the Gag non-cleavage site PI resistance mutations (L75R, H219Q, R409K) in HIV-1 genomes in the general population worldwide, for the following reporting years by the Los Alamos National Laboratory (New Mexico, USA) the percentage of HIV-1 genomes in the general population worldwide encoding H219Q in the HIV-1 Gag amino acid sequence alignments, increased from 19% in 1997 to 22% in 2002, 27% in 2010, and most recently 32% in 2018 [47,48,49,50]. In contrast, L75R was not found, and R409K was found in only one HIV-1 genome in the 2018 HIV-1 Gag amino acid sequence alignment, and that genome encoded H219 [47]. The native Gag residues involved in the substrate-clamps were also examined to see if they were conserved (Figure 3, Figure 4, Figure 5 and Figure 6). Overall, the native Gag substrate-clamp residues were highly conserved based on the Los Alamos 2018 HIV-1 Gag amino acid sequence alignment [47], and while several residues had alternate residues in HIV-1 genomes worldwide, those alternate residues were found to be able to make similar H-bond interactions in the respective substrate-clamps.
Several other research groups have also carried out modeling studies of HIV-1 Gag to gain insight into the mechanism of Gag non-cleavage site PI resistance mutations including H219Q [51,52]. They found the resistance mutations interacted with membrane lipids, CypA, and Gag cleavage sites [51,52]. However, since PR was not included in those Gag modeling studies, it complicated the understanding of how the Gag non-cleavage site PI resistance mutations enabled PR resistance to PIs [51,52].

4. Conclusions

The substrate-clamp mechanism is a natural extension of the retroviral PR S-groove model [22,23], since the S-grooves on each face of the PR, when binding cleavage site residues |P12-P5|, direct the Gag substrate subdomains towards one another increasing the probability that a substrate-clamp forms (Figure 3, Figure 4, Figure 5, Figure 6 and Figure 7). The substrate-clamp mechanism explains the Gag non-cleavage site PI resistance mutations in that they stabilized interactions between PR and Gag substrates via direct H-bonds between Gag subdomains, and by coordinating additional native H-bond networks between the Gag subdomains to form a substrate-clamp, as well as coordinating H-bond networks between the Gag subdomains and PR (Figure 5B,D and Figure 6A,C). That allowed the Gag polyprotein substrates with non-cleavage site PI resistance mutations to outcompete PI binding to the PR active sites by 3.7 to 4.4 orders of magnitude, based on the total IES reported in Table 1 (−328 to −354 kcal/mol) and the reported IES for the PR/amprenavir (−79 kcal/mol) and PR/nelfinavir (−87 kcal/mol) complexes [23]. The three Gag non-cleavage site PI resistance mutations studied here included MA L75R, CA H219Q, and NC R409K. While the MA L75R mutation is important in amprenavir resistance, only CA H219Q and NC R409K were needed for other PIs [30]. Just the two Gag non-cleavage site PI resistance mutations CA H219Q and NC R409K were found to allow the formation of substrate-clamps in the full-length Gag, NC-SP2-p6, and MA-CA-SP1 substrates (Figure 3, Figure 4, Figure 5 and Figure 6).
The role of CA H219Q in the MA-CA-SP1 substrate-clamp, and increasing prevalence in HIV-1 genomes in the general population worldwide over a 21-year reporting timeframe [47,48,49,50], is consistent with the increasing prevalence of PI resistance mutations occurring outside of the PR [13]. The increasing dominance of H219Q suggests that HIV-1 may be evolving under selective pressure from PIs that are more competitive in vivo with the Gag MA/CA cleavage site versus other Gag cleavage sites. For an individual infected with HIV-1 carrying H219Q, the virus would only need to acquire the R409K or similar mutation, to have PI resistance for the three Gag substrates that can form substrate-clamps (Figure 3, Figure 4, Figure 5 and Figure 6). The remaining two Gag substrates that cannot form a substate-clamp, CA-SP1 and NC-SP2, are cleaved last and so would benefit from the ~5-fold increase in molarity within the virion due to the Gag and Pol polyprotein cleavage and concomitant increase in PR concentration, both of which would reduce the effectiveness of PIs within the virion.
The substrate-clamp mechanism also explains the disproportionately slow cleavage rates for the Gag CA-SP1 and NC-SP2 substrates, in that without the ability to form a substrate-clamp the PR has an inherently difficult time staying bound to and cleaving those substrates (Figure 7A, Figure 8 and Figure 9). Importantly, the native network of H-bonds coordinated by the Gag non-cleavage site PI resistance mutations were present in the wild-type Gag, making the substrate-clamp a novel mechanism to enhance the cleavage of the Gag polyprotein and likely the Gag-Pol polyprotein as well since the Pol cleavage sites are also in unstructured linkers with structured subdomains on either side, excluding the RT/RH site [22]. The substrate-clamp mechanism likely functions in other retroviruses, just as the S-groove model was reported to [22]. These results point to the substrate-clamp as a unique mechanism employed by retroviruses to cleave polyprotein substrates efficiently and in the order required for virion maturation. As a result, both the retroviral PR S-groove and substrate-clamp can be targeted to disrupt replication in both wild-type and PI-resistant retroviruses.

Funding

This research received no external funding.

Acknowledgments

Thanks goes to János Mótyán and Steven Pettit for careful review of the manuscript, thoughtful comments, and insightful discussions.

Conflicts of Interest

The author declares no conflict of interest.

References

  1. Barré-Sinoussi, F.; Chermann, J.C.; Rey, F.; Nugeyre, M.T.; Chamaret, S.; Gruest, J.; Dauguet, C.; Axler-Blin, C.; Vézinet-Brun, F.; Rouzioux, C.; et al. Isolation of a T-Lymphotropic Retrovirus from a Patient at Risk for Acquired Immune Deficiency Syndrome (AIDS). Science 1983, 220, 868–871. [Google Scholar] [CrossRef] [Green Version]
  2. Gallo, R.C.; Sarin, P.S.; Gelmann, E.P.; Robert-Guroff, M.; Richardson, E.; Kalyanaraman, V.S.; Mann, D.; Sidhu, G.D.; Stahl, R.E.; Zolla-Pazner, S.; et al. Isolation of Human T-Cell Leukemia Virus in Acquired Immune Deficiency Syndrome (AIDS). Science 1983, 220, 865–867. [Google Scholar] [CrossRef] [PubMed]
  3. Ratner, L.; Haseltine, W.; Patarca, R.; Livak, K.J.; Starcich, B.; Josephs, S.F.; Doran, E.R.; Rafalski, J.A.; Whitehorn, E.A.; Baumeister, K.; et al. Complete nucleotide sequence of the AIDS virus, HTLV-III. Nat. Cell Biol. 1985, 313, 277–284. [Google Scholar] [CrossRef]
  4. Kuritzkes, D.R.; Quinn, J.B.; Benoit, S.L.; Shugarts, D.L.; Griffin, A.; Bakhtiari, M.; Poticha, D.; Eron, J.J.; Fallon, M.A.; Rubin, M. Drug resistance and virologic response in NUCA 3001, a randomized trial of lamivudine (3TC) versus zidovudine (ZDV) versus ZDV plus 3TC in previously untreated patients. AIDS 1996, 10, 975–981. [Google Scholar] [CrossRef] [PubMed]
  5. Kuritzkes, D.R. Clinical significance of drug resistance in HIV-1 infection. AIDS 1996, 10, S27–S31. [Google Scholar] [CrossRef]
  6. Shafer, R.W.; Iversen, A.K.N.; Winters, M.A.; Aguiniga, E.; Katzenstein, D.; Merigan, T.C. Drug Resistance and Heterogeneous Long-Term Virologic Responses of Human Immunodeficiency Virus Type 1-Infected Subjects to Zidovudine and Didanosine Combination Therapy. J. Infect. Dis. 1995, 172, 70–78. [Google Scholar] [CrossRef] [PubMed]
  7. D’Aquila, R.T.; Johnson, V.A.; Welles, S.L.; Japour, A.J.; Kuritzkes, D.R.; DeGruttola, V.; Reichelderfer, P.S.; Coombs, R.W.; Crumpacker, C.S.; Kahn, J.O.; et al. Zidovudine Resistance and HIV-1 Disease Progression during Antiretroviral Therapy. Ann. Intern. Med. 1995, 122, 401–408. [Google Scholar] [CrossRef] [PubMed]
  8. Lea, A.P.; Faulds, D. Ritonavir. Drugs 1996, 52, 541–546. [Google Scholar] [CrossRef]
  9. Erickson, J.W.; Burt, S.K. Structural Mechanisms of HIV Drug Resistance. Annu. Rev. Pharmacol. Toxicol. 1996, 36, 545–571. [Google Scholar] [CrossRef] [PubMed]
  10. Frieden, T.R.; Foti, K.E.; Mermin, J. Applying Public Health Principles to the HIV Epidemic—How Are We Doing? N. Engl. J. Med. 2015, 373, 2281–2287. [Google Scholar] [CrossRef] [PubMed]
  11. Kohl, N.E.; Emini, E.A.; Schleif, W.A.; Davis, L.J.; Heimbach, J.C.; Dixon, R.A.; Scolnick, E.M.; Sigal, I.S. Active human immunodeficiency virus protease is required for viral infectivity. Proc. Natl. Acad. Sci. USA 1988, 85, 4686–4690. [Google Scholar] [CrossRef] [PubMed] [Green Version]
  12. Bhat, T.N.; Baldwin, E.T.; Liu, B.; Cheng, Y.-S.E.; Erickson, J.W. Crystal structure of a tethered dimer of HIV-1 proteinase complexed with an inhibitor. Nat. Genet. 1994, 1, 552–556. [Google Scholar] [CrossRef] [PubMed]
  13. Wensing, A.M.; Calvez, V.; Ceccherini-Silberstein, F.; Charpentier, C.; Günthard, H.F.; Paredes, R.; Shafer, R.W.; Richman, D.D. 2019 Update of the Drug Resistance Mutations in HIV-1. Top. Antivir. Med. 2019, 27, 111–121. [Google Scholar] [PubMed]
  14. Chang, M.W.; Torbett, B.E. Accessory Mutations Maintain Stability in Drug-Resistant HIV-1 Protease. J. Mol. Biol. 2011, 410, 756–760. [Google Scholar] [CrossRef] [PubMed] [Green Version]
  15. Prabu-Jeyabalan, M.; Nalivaika, E.A.; King, N.M.; Schiffer, C.A. Structural Basis for Coevolution of a Human Immunodeficiency Virus Type 1 Nucleocapsid-p1 Cleavage Site with a V82A Drug-Resistant Mutation in Viral Protease. J. Virol. 2004, 78, 12446–12454. [Google Scholar] [CrossRef] [PubMed] [Green Version]
  16. Nijhuis, M.; Schuurman, R.; De Jong, D.; Erickson, J.; Gustchina, E.; Albert, J.; Schipper, P.; Gulnik, S.; Boucher, C.A.B. Increased fitness of drug resistant HIV-1 protease as a result of acquisition of compensatory mutations during suboptimal therapy. AIDS 1999, 13, 2349–2359. [Google Scholar] [CrossRef] [PubMed]
  17. Martinez-Picado, J.; Savara, A.V.; Sutton, L.; D’Aquila, R.T. Replicative fitness of protease inhibitor-resistant mutants of human immunodeficiency virus type 1. J. Virol. 1999, 73, 3744–3752. [Google Scholar] [CrossRef] [Green Version]
  18. Schock, H.B.; Garsky, V.M.; Kuo, L.C. Mutational Anatomy of an HIV-1 Protease Variant Conferring Cross-resistance to Protease Inhibitors in Clinical Trials. J. Biol. Chem. 1996, 271, 31957–31963. [Google Scholar] [CrossRef] [PubMed] [Green Version]
  19. Pazhanisamy, S.; Stuver, C.M.; Cullinan, A.B.; Margolin, N.; Rao, B.; Livingston, D.J. Kinetic Characterization of Human Immunodeficiency Virus Type-1 Protease-resistant Variants. J. Biol. Chem. 1996, 271, 17979–17985. [Google Scholar] [CrossRef] [Green Version]
  20. Gulnik, S.V.; Suvorov, L.I.; Liu, B.; Yu, B.; Anderson, B.; Mitsuya, H.; Erickson, J.W. Kinetic Characterization and Cross-Resistance Patterns Of HIV-1 Protease Mutants Selected under Drug Pressure. Biochemistry 1995, 34, 9282–9287. [Google Scholar] [CrossRef] [PubMed]
  21. Kaplan, A.H.; Michael, S.F.; Wehbie, R.S.; Knigge, M.F.; Paul, D.A.; Everitt, L.; Kempf, D.J.; Norbeck, D.W.; Erickson, J.W.; Swanstrom, R. Selection of multiple human immunodeficiency virus type 1 variants that encode viral proteases with decreased sensitivity to an inhibitor of the viral protease. Proc. Natl. Acad. Sci. USA 1994, 91, 5597–5601. [Google Scholar] [CrossRef] [Green Version]
  22. Laco, G.S. Retroviral protease: Correlating substrate recognition with both selected and native inhibitor resistance. J. Mol. Biochem. 2017, 6, 45–63. [Google Scholar]
  23. Laco, G.S. HIV-1 protease substrate-groove: Role in substrate recognition and inhibitor resistance. Biochimie 2015, 118, 90–103. [Google Scholar] [CrossRef] [PubMed]
  24. Deshmukh, L.; Tugarinov, V.; Louis, J.M.; Clore, G.M. Binding kinetics and substrate selectivity in HIV-1 protease−Gag interactions probed at atomic resolution by chemical exchange NMR. Proc. Natl. Acad. Sci. USA 2017, 114, E9855–E9862. [Google Scholar] [CrossRef] [Green Version]
  25. Miczi, M.; Diós, Á.; Bozóki, B.; Tőzsér, J.; Mótyán, J. Development of a Bio-Layer Interferometry-Based Protease Assay Using HIV-1 Protease as a Model. Viruses 2021, 13, 1183. [Google Scholar] [CrossRef] [PubMed]
  26. Weikl, T.R.; Hemmateenejad, B. Accessory mutations balance the marginal stability of the HIV-1 protease in drug resistance. Proteins 2020, 88, 476–484. [Google Scholar] [CrossRef] [Green Version]
  27. Liu, Z.; Tran, T.T.; Pham, L.; Hu, L.; Bentz, K.; Savin, D.A.; Fanucci, G.E. Darunavir-Resistant HIV-1 Protease Constructs Uphold a Conformational Selection Hypothesis for Drug Resistance. Viruses 2020, 12, 1275. [Google Scholar] [CrossRef] [PubMed]
  28. Bastys, T.; Gapsys, V.; Walter, H.; Heger, E.; Doncheva, N.T.; Kaiser, R.; De Groot, B.L.; Kalinina, O.V. Non-active site mutants of HIV-1 protease influence resistance and sensitisation towards protease inhibitors. Retrovirology 2020, 17, 13. [Google Scholar] [CrossRef]
  29. Agniswamy, J.; Louis, J.M.; Roche, J.; Harrison, R.; Weber, I.T. Structural Studies of a Rationally Selected Multi-Drug Resistant HIV-1 Protease Reveal Synergistic Effect of Distal Mutations on Flap Dynamics. PLoS ONE 2016, 11, e0168616. [Google Scholar] [CrossRef] [Green Version]
  30. Gatanaga, H.; Suzuki, Y.; Tsang, H.; Yoshimura, K.; Kavlick, M.F.; Nagashima, K.; Gorelick, R.J.; Mardy, S.; Tang, C.; Summers, M.F.; et al. Amino Acid Substitutions in Gag Protein at Non-cleavage Sites Are Indispensable for the Development of a High Multitude of HIV-1 Resistance against Protease Inhibitors. J. Biol. Chem. 2002, 277, 5952–5961. [Google Scholar] [CrossRef] [PubMed] [Green Version]
  31. Pettit, S.C.; Lindquist, J.N.; Kaplan, A.H.; Swanstrom, R. Processing sites in the human immunodeficiency virus type 1 (HIV-1) Gag-Pro-Pol precursor are cleaved by the viral protease at different rates. Retrovirology 2005, 2, 66. [Google Scholar] [CrossRef] [PubMed] [Green Version]
  32. Pettit, S.C.; Simsic, J.; Loeb, D.D.; Everitt, L.; Hutchison, C.A., 3rd; Swanstorm, R. Analysis of retroviral protease cleavage sites reveals two types of cleavage sites and the structural re-quirements of the P1 amino acid. J. Biol. Chem. 1991, 266, 14539–14547. [Google Scholar] [CrossRef]
  33. Datta, S.; Curtis, J.E.; Ratcliff, W.; Clark, P.K.; Crist, R.; Lebowitz, J.; Krueger, S.; Rein, A. Conformation of the HIV-1 Gag Protein in Solution. J. Mol. Biol. 2007, 365, 812–824. [Google Scholar] [CrossRef] [Green Version]
  34. Tang, C.; Ndassa, Y.; Summers, M.F. Structure of the N-terminal 283-residue fragment of the immature HIV-1 Gag poly-protein. Nat. Struct. Biol. 2002, 9, 537–543. [Google Scholar] [PubMed]
  35. Su, C.T.-T.; Koh, D.W.-S.; Gan, S.K.-E. Reviewing HIV-1 Gag Mutations in Protease Inhibitors Resistance: Insights for Possible Novel Gag Inhibitor Designs. Molecules 2019, 24, 3243. [Google Scholar] [CrossRef] [PubMed] [Green Version]
  36. Fun, A.; Wensing, A.M.; Verheyen, J.; Nijhuis, M. Human Immunodeficiency Virus gag and protease: Partners in resistance. Retrovirology 2012, 9, 63. [Google Scholar] [CrossRef] [PubMed] [Green Version]
  37. Aoki, M.; Venzon, D.J.; Koh, Y.; Aoki-Ogata, H.; Miyakawa, T.; Yoshimura, K.; Maeda, K.; Mitsuya, H. Non-Cleavage Site Gag Mutations in Amprenavir-Resistant Human Immunodeficiency Virus Type 1 (HIV-1) Predispose HIV-1 to Rapid Acquisition of Amprenavir Resistance but Delay Development of Resistance to Other Protease Inhibitors. J. Virol. 2009, 83, 3059–3068. [Google Scholar] [CrossRef] [PubMed] [Green Version]
  38. Tritch, R.J.; Cheng, Y.E.; Yin, F.H.; Erickson-Viitanen, S. Mutagenesis of protease cleavage sites in the human immunodeficiency virus type 1 gag polyprotein. J. Virol. 1991, 65, 922–930. [Google Scholar] [CrossRef] [PubMed] [Green Version]
  39. Erickson-Viitanen, S.; Manfredi, J.; Viitanen, P.; Tribe, D.E.; Tritch, R.; Hutchisoniii, C.A.; Loeb, D.D.; Swanstrom, R. Cleavage of HIV-1gagPolyprotein Synthesized In Vitro: Sequential Cleavage by the Viral Protease. AIDS 1989, 5, 577–591. [Google Scholar] [CrossRef]
  40. Pettit, S.; Moody, M.D.; Wehbie, R.S.; Kaplan, A.H.; Nantermet, P.V.; Klein, C.A.; Swanstrom, R. The p2 domain of human immunodeficiency virus type 1 Gag regulates sequential proteolytic processing and is required to produce fully infectious virions. J. Virol. 1994, 68, 8017–8027. [Google Scholar] [CrossRef] [PubMed] [Green Version]
  41. Laco, G.S. Evaluation of Two Models for Human Topoisomerase I Interaction with dsDNA and Camptothecin Derivatives. PLoS ONE 2011, 6, e24314. [Google Scholar] [CrossRef] [PubMed] [Green Version]
  42. Krausslich, H.G.; Ingraham, R.H.; Skoog, M.T.; Wimmer, E.; Pallai, P.V.; Carter, C.A. Activity of purified biosynthetic proteinase of human immunodeficiency virus on natural substrates and synthetic peptides. Proc. Natl. Acad. Sci. USA 1989, 86, 807–811. [Google Scholar] [CrossRef] [PubMed] [Green Version]
  43. Veronese, F.D.; Copeland, T.D.; Oroszlan, S.; Gallo, R.C.; Sarngadharan, M.G. Biochemical and immunological analysis of human immunodeficiency virus gag gene products p17 and p24. J. Virol. 1988, 62, 795–801. [Google Scholar] [CrossRef] [Green Version]
  44. Gatanaga, H.; Das, D.; Suzuki, Y.; Yeh, D.D.; Hussain, K.A.; Ghosh, A.K.; Mitsuya, H. Altered HIV-1 Gag Protein Interactions with Cyclophilin A (CypA) on the Acquisition of H219Q and H219P Substitutions in the CypA Binding Loop. J. Biol. Chem. 2006, 281, 1241–1250. [Google Scholar] [CrossRef] [PubMed] [Green Version]
  45. Gamble, T.R.; Vajdos, F.; Yoo, S.; Worthylake, D.K.; Houseweart, M.; Sundquist, W.I.; Hill, C.P. Crystal Structure of Human Cyclophilin A Bound to the Amino-Terminal Domain of HIV-1 Capsid. Cell 1996, 87, 1285–1294. [Google Scholar] [CrossRef] [Green Version]
  46. Deshmukh, L.; Louis, J.M.; Ghirlando, R.; Clore, G.M. Transient HIV-1 Gag–protease interactions revealed by paramagnetic NMR suggest origins of compensatory drug resistance mutations. Proc. Natl. Acad. Sci. USA 2016, 113, 12456–12461. [Google Scholar] [CrossRef] [PubMed] [Green Version]
  47. Foley, B.T.; Korber, B.T.M.; Leitner, T.K.; Apetrei, C.; Hahn, B.; Mizrachi, I.; Mullins, J.; Rambaut, A.; Wolinsky, S. HIV Sequence Compendium 2018; Los Alamos National Laboratory: Los Alamos, NM, USA, 2018. [Google Scholar]
  48. Kuiken, C.; Foley, B.; Leitner, T.; Apetrei, C.; Hahn, B.; Mizrachi, I.; Mullins, J.; Rambaut, A.; Wolinsky, S.; Korber, B. HIV Sequence Compendium 2018; Los Alamos National Laboratory: Los Alamos, NM, USA, 2010. [Google Scholar]
  49. Kuiken, C.; Foley, B.; Freed, E.; Hahn, B.; Marx, P.; McCutchan, F.; Mellors, J.; Wolinsky, S.; Korber, B. HIV Sequence Compendium 2018; Los Alamos National Laboratory: Los Alamos, NM, USA, 2002. [Google Scholar]
  50. Korber, B.; Foley, B.; Leitner, T. Human retroviruses and AIDS 1997; Los Alamos National Laboratory: Los Alamos, NM, USA, 1997. [Google Scholar]
  51. Samsudin, F.; Gan, S.K.-E.; Bond, P.J. The impact of Gag non-cleavage site mutations on HIV-1 viral fitness from integrative modelling and simulations. Comput. Struct. Biotechnol. J. 2021, 19, 330–342. [Google Scholar] [CrossRef] [PubMed]
  52. Su, C.T.-T.; Kwoh, C.-K.; Verma, C.S.; Gan, S.K.-E. Modeling the full length HIV-1 Gag polyprotein reveals the role of its p6 subunit in viral maturation and the effect of non-cleavage site mutations in protease drug resistance. J. Biomol. Struct. Dyn. 2017, 36, 4366–4377. [Google Scholar] [CrossRef]
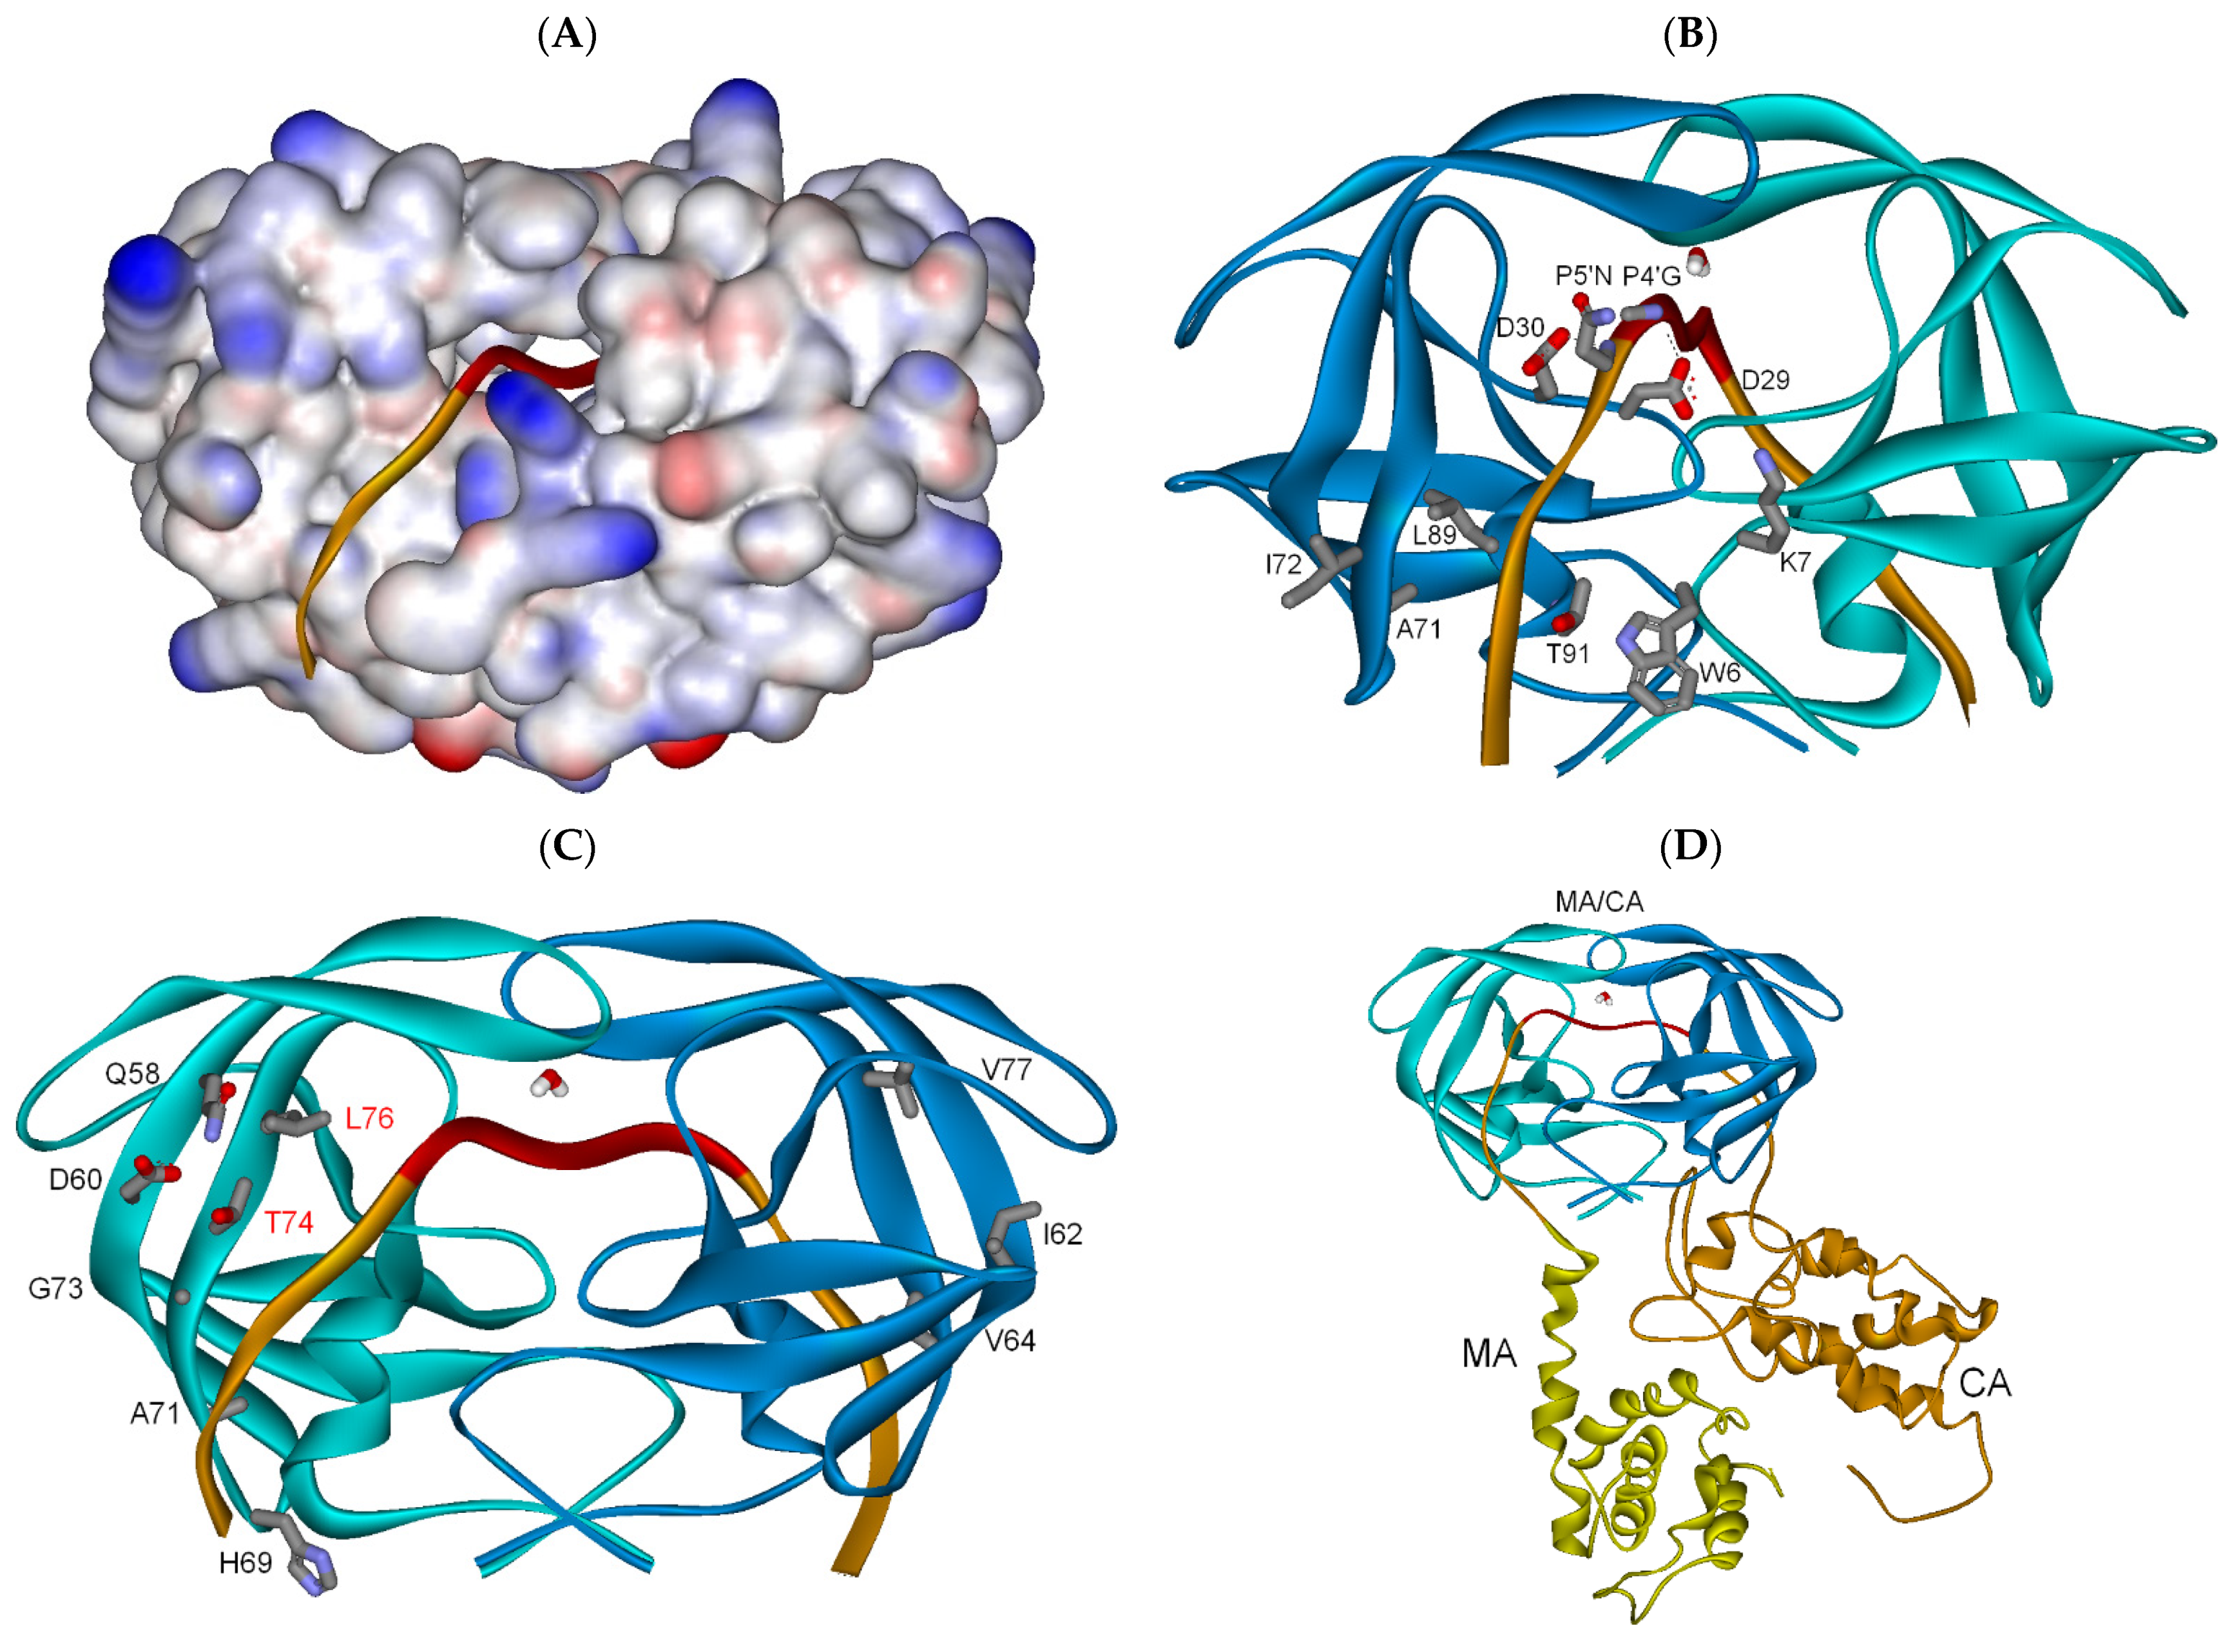
Figure 1. (A) HIV-1 PR (1KJ7.pdb as modified [22]) bound to 24-mer SP1-NC substrate (backbone ribbon), PR with electrostatic surface potential (blue positive, red negative), cleavage site residues P4-P4′ (red) bound to active site, cleavage site residues P12-P5/P5′-P12′ (|P12-P5|) bound in S-grooves (bronze); (B) PR bound to 24-mer substrate as in (A), PR as backbone ribbon (A-subunit teal, B-subunit blue), seven S-groove residues that interacted with Gag cleavage site residues |P12-P5|in a NMR study by Deshmukh et al. [24] are shown in addition to D29 (carbon grey, oxygen red, nitrogen blue), SP1-NC cleavage site residues P5′N and P4′G including backbone nitrogens indicated, active site tetrahedrally coordinated water under flaps; (C) PR bound to 24-mer SP1-NC substrate as in (B), with ten native PR S-groove residues shown, Wensing and coworkers reported PI resistance mutations for each of those ten native residues [13], S-groove residues on PR A-subunit anti-parallel β-sheet (left), residues on backside of PR B-subunit S-groove anti-parallel β-sheet (right), red residue labels indicate primary PI resistance, black residue labels indicate secondary PI resistance, when residues were mutated as reported by Wensing and coworkers [13]; (D) PR bound to MA/CA cleavage site when part of a MA-CA polyprotein (1L6N.pdb as modified [23]) with backbone ribbon (MA yellow, CA bronze) as previously reported [23].
Biochem 01 00015 g001
Figure 2. (A) Structure-based model of HIV-1 full-length Gag polyprotein as previously reported [22], ribbon backbone with subdomains indicated left-to-right (MA yellow 1L6N.pdb, CA bronze 1L6N.pdb and 4XFX.pdb, NC yellow 1MFS.pdb, p6 bronze 2C55.pdb as modified [22]), SP1 and SP2 regions in black, five Gag cleavage sites indicated as are the non-cleavage site residues MA L75, CA H219, and NC R409, which when mutated resulted in PI resistance (carbon grey, nitrogen blue) [30]. (B) Schematic diagram of HIV-1 Gag polyprotein with PR cleavage sites and products indicated, inverse relative cleavage rates for the five sites indicated with the SP1/NC cleavage site set to 1 and the NC/SP2 cleavage site 400X slower, as reported by Pettit and coworkers [31,32]. Length of the cleaved SP1 and SP2 peptides indicated.
Biochem 01 00015 g002
Figure 3. (A) HIV-1 PR (side-view, backbone ribbon, A-subunit teal, B-subunit blue) bound to the SP1/NC cleavage site in full-length Gag (backbone ribbon right-to-left, MA yellow, CA bronze, NC yellow, p6 bronze), with the SP1 and SP2 regions in black, the five cleavage sites indicated. Gag non-cleavage site PI resistance residues MA L75R, CA H219Q and NC R409K (red labels) shown (carbon grey, nitrogen blue); (B) HIV-1 PR (front view) bound to full-length Gag with a substrate-clamp formed between Gag CA and NC subdomains mediated by the Gag non-cleavage site PI resistance mutation NC R409K (red label), substrate-clamp H-bonding residues shown (carbon grey, oxygen red, nitrogen blue), Gag cleavage sites indicated as are PI resistance residues MA L75R and CA H219Q (red labels); (C), close-up view of the full-length Gag substrate-clamp interactions between CA and NC subdomain residues looking down and from the right side of B. Native CA residues (left side) D295, D298, R299, K302 and (right side) E203, E207, E211, and native NC residues (left side) C416, K418, E419, and (right side) K411 with the NC non-cleavage site PI resistant mutation R409K indicated with red label (upper center). H-bonds as dashed black lines, see Results and Discussion Section 3.2.1. for detailed description of the substrate-clamp H-bond network.
Biochem 01 00015 g003
Figure 4. (A) HIV-1 PR front view (backbone ribbon, A-subunit teal, B-subunit blue) bound to NC-SP2-p6 polyprotein (backbone ribbon, NC yellow, SP2 black, p6 bronze) at the SP2/p6 cleavage site, tetrahedrally coordinated active site water shown. Gag non-cleavage site PI resistance residue R409K indicated with red label; (B) looking down at top of HIV-1 PR bound to the SP2/NC site in the NC-SP2-p6 polyprotein with a substrate-clamp formed between the NC and p6 subdomains mediated by the Gag non-cleavage site PI resistance mutation R409K with red label (bottom), H-bonds as black dashed lines; (C) looking upward from underneath of (B), close-up of the NC and p6 subdomain substrate-clamp interactions between native NC residues (counter clockwise) K403, R406, C405, Q422, K424, and native p6 residues (right to left) D496, S498, S499, and Q500 (C-terminal Gag residue), NC R409K non-cleavage site PI resistant mutation indicated with red label (center-left). H-bond interactions shown as dashed black lines, NC and p6 labeled as in (B), see Results and Discussion Section 3.2.2. for detailed description of the substrate-clamp H-bond network.
Biochem 01 00015 g004
Figure 5. (A) HIV-1 PR (front view) bound to MA/CA cleavage site in MA-CA-SP1 polyprotein, PR backbone as ribbon (A-subunit teal, B-subunit blue), MA-CA-SP1 polyprotein backbone as ribbon, MA yellow, CA bronze, MA/CA and CA/SP1 cleavage sites indicated, SP1 backbone black, Gag non-cleavage site PI resistance residue CA H219Q (red label) and MA L75 (black label) shown (carbon grey, oxygen red, nitrogen blue), tetrahedrally coordinated active site water shown; (B) PR (front view) bound to MA-CA-SP1 with a substrate-clamp between MA and CA subdomains coordinated by the H219Q Gag non-cleavage site PI resistant mutation (red label, center), MA L75 shown (black label), MA and CA subdomain residues involved in substrate-clamp shown (carbon grey, oxygen red, nitrogen blue), H-bonds as black dashed lines; (C) close-up of substrate-clamp H-bond network between MA and CA subdomains, native MA residues (right side) N47, A45, Q59, R58, S111, and native CA residues (left side) L215, E320, N253, as well as the Gag non-cleavage site PI resistance mutation H219Q (red label, center); (D) close-up of substrate-clamp mediated H-bond interactions between CA subdomain and PR, CA residues left to right, H144, Q145, Q244, and E245 and PR A-subunit Q2 and C-terminal F99 (right) and PR B-subunit Q92 and G94 (left), see Results and Discussion Section 3.2.3. for detailed description of the substrate-clamp H-bond network.
Biochem 01 00015 g005
Figure 6. (A) HIV-1 PR (front view) bound to MA/CA cleavage site in MA-CA-SP1 polyprotein with Gag non-cleavage site PI resistance double mutation L75R/H219Q (red labels) which coordinated a substrate-clamp between MA and CA subdomains. PR backbone ribbon A-subunit teal, B-subunit blue), MA-CA-SP1 backbone ribbon (MA yellow, CA bronze, SP1 black), substrate-clamp residues shown (carbon grey, oxygen red, nitrogen blue). (B) Close-up of (A), H-bond interactions between MA and CA subdomain residues coordinated by Gag non-cleavage site PI resistance double mutation L75R/H219Q (bottom, red labels), native CA residues (left side) R264, E230, P255, N253, and native MA residues (right side) N47, Q63, Q59, and R58. (C) Close-up of (A), H-bond interactions between native CA subdomain residues and native PR residues coordinated by the Gag non-cleavage site PI resistant double L75R/H219Q mutation. Native CA residues (lower) H144, Q244, and E245 and PR A-subunit residues (upper right) Q2 and W6, and PR B-subunit residue (upper left) Q92; H-bonds shown as dashed black lines. See Results and Discussion Section 3.2.3 for detailed description of the substrate-clamp H-bond network.
Biochem 01 00015 g006
Figure 7. (A) HIV-1 PR (front view) bound to CA/SP1 cleavage site in CA-SP1 protein, PR backbone as ribbon A-subunit teal, B-subunit blue), CA-SP1 protein backbone ribbon (CA bronze, SP1 black), CA/SP1 cleavage site indicated. Gag non-cleavage site PI resistance residue CA H219Q shown (red label), tetrahedrally coordinated active site water indicated; (B) PR bound to the CA/SP1 cleavage site in the non-native CA-SP1-NC polyprotein, PR as in (A), CA-SP1-NC polyprotein backbone as ribbon (CA bronze, SP1 black, NC yellow) with a substrate-clamp between the CA and NC subdomains in which the Gag non-cleavage site PI resistance mutation R409K (red label) coordinated the identical H-bond network as described for the substrate-clamp in the full-length Gag polyprotein with the R409K mutation (Figure 3B), cleavage sites shown. Tetrahedrally coordinated active site water and substrate-clamp residues shown (carbon grey, oxygen red, nitrogen blue). H-bonds shown as dashed black lines. See Results and Discussion Section 3.2.1. for PR bound to full-length Gag with R409K mediated substrate-clamp for detailed description of H-bond network.
Biochem 01 00015 g007
Figure 8. HIV-1 PR (front view) bound to NC/SP2 cleavage site in NC-SP2 protein, PR backbone as ribbon (A-subunit teal, B-subunit blue), NC-SP2 protein backbone ribbon (NC yellow, SP2 black), NC/SP2 cleavage site indicated. Gag non-cleavage site PI resistance residue NC R409K residue shown (red label), with tetrahedrally coordinated active site water indicated (carbon grey, oxygen red, and nitrogen blue).
Biochem 01 00015 g008
Figure 9. Schematic diagram of HIV-1 PR binding to and cleaving Gag substrates: top, Gag polyprotein with two spheres (representing structured subdomains) joined by black line (unstructured linker) represents full-length Gag, NC-SP2-p6, and MA-CA-SP1 substrates; bottom, Gag protein with one sphere (representing structured subdomain) and a black C-terminal tail represents CA-SP1 and NC-SP2 substrates. PR flaps open (blue open pie) with substrate residues P4-P4′ bound in active site; PR flaps closed (blue tear drop) with cleavage site residues P12-P5/P5′-P12′ bound in S-grooves, and residues P4-P4′ bound in active site. Substrate-clamp formation indicated for Gag polyprotein. Shorter forward arrows for Gag polyprotein indicates relatively faster forward rates versus Gag protein, shorter reverse arrows for Gag polyprotein indicate relatively slower reverse rates versus Gag protein.
Biochem 01 00015 g009
Table 1. Interaction energy scores (IESs) in kcal/mol between PR and Gag substrates, and Gag substrate subdomains. Column 1 lists Gag substrates with cleavage site, and Gag non-cleavage site PI resistance mutation(s) indicated (PI res.); Column 2, IES between HIV-1 PR and indicated Gag substrate (PR/Gag); Column 3, IES between Gag substrate subdomains (Gag subdomains); Column 4, total IES (Column 2 plus Column 3 values) for the same Gag substrate, with Gag substrates with non-cleavage site PI resistance mutations (PI res.) IES in brackets. * The CA-SP1 and NC-SP2 Gag substrates do not have a subdomain on both sides of the cleavage site so no IES was reported in Column 3, not applicable (NA).
Gag Substrate
(Cleavage Site)
PR/GagGag SubdomainsTotal (PI Res.)
Full-length Gag (SP1/NC)−2530−253
PI res. R409K−254−75(−329)
NC-SP2-p6 (SP2/p6)−2570−257
PI res. R409K−264−64(−328)
MA-CA-SP1 (MA/CA)−280−1−281
PI res. H219Q−289−48(−337)
PI res. L75R/H219Q−282−72(−354)
CA-SP1 * (CA/SP1)−260NA−260
NC-SP2 * (NC/SP2)−250NA−250
Publisher’s Note: MDPI stays neutral with regard to jurisdictional claims in published maps and institutional affiliations.