Article

Numerical Simulation of Particle-Laden Flow and Soot Layer Formation in Porous Filter

Department of Mechanical System Engineering, Nagoya University, Furo-cho, Chikusa-ku, Nagoya-shi 464-8603, Aichi, Japan
*
Author to whom correspondence should be addressed.
Solids 2022, 3(2), 282-294; https://doi.org/10.3390/solids3020020
Submission received: 25 March 2022 / Revised: 30 April 2022 / Accepted: 6 May 2022 / Published: 10 May 2022

Abstract

:
So far, diesel particulate filters (DPFs) have been widely used to collect diesel particulates including soot in the exhaust after-treatment. However, as the soot is continuously collected in the porous filter, the exhaust pressure (pressure drop) increases. To optimize the filter design for reducing its pressure drop, we need a numerical simulation. In this study, we simulated the particle-laden flow across the DPF. Structure of SiC-DPF was obtained by an X-ray CT technique. We conducted the numerical simulation by changing the soot aggregation diameter (simply called soot size), and evaluated the time-variation of the pressure drop. For discussing the soot deposition process, the contributions of the Brownian diffusion and the interception effect were separately estimated. Especially, we focused on the soot deposition region which could affect the pressure drop, together with the soot cake permeability and the soot packing density. Results show that, as the soot size is smaller, more soot is trapped. As a result, the shift from the depth filtration to the surface filtration is observed earlier. Therefore, for discussing the pressure drop, it is important to consider where the soot deposition occurs as well as the deposited soot mass in the filter.

1. Introduction

In our daily life, the main energy resource is produced by combustion of oil, coal, and natural gas, which ineluctably releases CO2 to the atmosphere. For solving the global warming problem, CO2 emissions should be reduced. In general, the transport sector is a significant contributor to CO2 emission in the world [1,2]. Diesel engines have an advantage of lower fuel consumption, compared to gasoline engines [3]. However, there are drawbacks in terms of NOx and particulate emissions. It is known that particulates of diesel soot can penetrate into the lung, causing human carcinogenic effects [4,5]. Then, in many countries, stricter exhaust emission standards such as Euro VI have been set. Therefore, an after-treatment of diesel exhaust gas is needed [6,7,8,9].
In Japan, in order to realize further improvement of fuel economy and reduction of tailpipe emissions, automakers have established a joint research organization, the Research Association of Automotive Internal Combustion Engines (AICE) in 2014. The goal of AICE is to utilize the research achievement and to accelerate the development activities of each automaker. Our group in Nagoya University has joined AICE as one of the research players. So far, we have conducted experimental and numerical research in their project [10,11]. One of our targets is to develop diesel particulate filters (DPFs) of the porous substrate with higher filtration efficiency and lower pressure drop.
DPFs have been widely used to collect diesel particulates in the exhaust after-treatment. A SCR (selective catalytic reduction) catalyst on the DPF substrate has been proposed, called SCR-F, for reducing both PM and NOx emissions simultaneously [12]. Recently, a gasoline particulate filter (GPF) has been also developed to trap particulates emitted from gasoline direct injection GDI engines [13,14,15,16]. It should be noted that as the soot particle is continuously collected, the exhaust pressure (pressure drop across the filter) increases. Consequently, the fuel consumption rate is unexpectedly worsened with the reduction of the engine output. Therefore, the deposited soot in DPF is periodically burned, which is called a filter regeneration process [17,18,19,20,21]. Since additional fuel consumption is needed for this process, the filter with low pressure drop is better to use. To optimize the filter substrate structure for the reduction of the pressure drop, it is efficient to conduct a numerical simulation. We have developed a numerical model of soot filtration by a lattice Boltzmann method (LBM) [22,23,24,25,26,27]. In this study, we simulated the particle-laden flow across the porous SiC-DPF. The non-uniform structure of the filter substrate was obtained by an X-ray CT technique. Mainly, we focused on the effect of soot aggregation size on the filtration process and the pressure drop.

2. Numerical Methods

To simulate the particle-laden flow with the soot deposition, the numerical scheme of LBM was used. Equations for the flow and the soot deposition model were the same as those of our previous studies [24,26]. Here, we explain the numerical procedure in the lattice Boltzmann simulation. To realize the porous media flow in the uneven ceramic filter substrate, the 3D model [28] was used, which is composed of 15 discrete velocities in the lattice space, expressed by
[ c 1       c 2       c 3         c 4       c 5       c 6       c 7       c 8       c 9       c 10       c 11       c 12       c 13       c 14       c 15 ]   = [ 1 1 0 0 0 1 0 0 0         0 0 0 1 0 0 0 1 1         1 1 1 1 1 1 1 1 1         1 1 1 1 1 1 1 1 1         1 1 0 1 1 0 1 1 0 ]
where cα (α = 1 to 15) is the gas velocity of each advection along the lattice coordinate. The evolution equation for the convection of the flow is
p α ( x + c α δ t , t + δ t ) p α ( x , t ) = 1 τ [ p α ( x , t ) p α e q ( x , t ) ]
Here, the time step is δt. The variable of τ is the relaxation time for controlling the rate to the equilibrium distribution due to collision between gas in the flow, which is related with the kinetic viscosity using ν = (2 τ − 1)/6 c2δt, showing that the Navier–Stokes equations are derived by the Chapman–Enskog procedure [29]. The equilibrium distribution function, pαeq, is
p α e q = w α { p + p 0 [ 3 ( c α u ) c 2 + 9 2 ( c α u ) 2 c 4 3 2 u u c 2 ] }
where wα = 1/9 (α = 1:6), wα = 1/72 (α = 7:14), and w15 = 2/9. The sound speed, cs, is c/√3 with p0 = ρ0RT0 = ρ0cs2. Here, p0 and ρ0 are the pressure and density at the room temperature. In the simulation, the temperature was constant. The pressure and the velocity vector of u = (ux, uy, uz) are evaluated in terms of the low Mach number approximation [23], together with the ideal gas equation.
All variables were converted to be dimensionless. Based on the similarity of the Reynolds number (Re = UinW/ν), the real values such as flow velocity were treated in the lattice space of the LBM, where Uin is the inflow velocity of the diesel exhaust, W is the inlet width of the 3D numerical domain in Figure 1.
p = α p α
u = ρ 0 ρ 1 p 0 α c α p α
As for the validity of the numerical model, previous simulations were compared with experimental data. It was confirmed that mass of trapped soot during the filtration and the soot oxidation rate of the filter regeneration were matched with those in the experiments [22,23].
In the simulation of the particle-laden flow, the soot particle in the gas phase is deposited on the fiber or the soot layer. The soot deposition is described by the modified particle deposition model [30]. Different from the Lagrangian approach through the equation of motion, individual particles are not considered. Instead, the soot concentration is monitored, so that we do not have to consider the complex geometry of nanoparticles [4,5]. The mass fraction of deposited soot is given by
Y C , s ( x , t + δ t ) = α F C , α ( x , t ) P D + Y C , s ( x , t )
Here, PD is the soot deposition probability, which is a model parameter. It corresponds to the deposition ratio which determines the local mass of deposited soot at each spatial grid. In order to consider the soot size, the soot deposition probability in the new model [31] is described by the Brownian diffusion and the interception effect [32], by which it is possible to investigate the dependence of the soot size. Moreover, we can discuss the contributions of the Brownian diffusion and the interception effect, separately.
Figure 1 shows the three-dimensional numerical domain used for the filtration simulation. The inner structure of the SiC-DPF obtained by the X-ray CT was used. The porosity of the filter was 0.38. In the coordinate system, the direction of exhaust gas passing through the filter wall is defined as the x-axis, and the directions perpendicular to the x-axis are defined as the y- and z-axis. The size of the calculation domain was 450 μm (x) × 60 μm (y) × 60 μm (z). The grid size was 1 μm, corresponding to the spatial resolution of the X-ray CT measurement. The number of grid points are 451 (x) × 61 (y) × 61 (z). The filter of 300 μm (x) × 60 μm (y) × 60 μm (z) is placed at the center of the calculation domain, and the lengths of inlet and outlet zones are 120 μm and 30 μm, which are set before and after the filter, respectively.
Next, the boundary conditions of the flow and concentration fields are explained. In the simulation, the soot aggregation diameter (simply called soot size) was changed by keeping the soot concentration (the soot mass fraction) in the exhaust gas. The exhaust gas whose temperature was 300 °C [23] evenly flowed at the inlet. The inflow velocity was 1 cm/s. At the outlet, the pressure was constant, with atmospheric pressure. The four boundaries at the upper, lower, right, and left sides of the numerical domain were treated as symmetrical boundaries with slip boundaries. A non-slip boundary for the flow was adopted on the surface of the filter substrate.
As for the soot concentration field, the soot mass fraction was constant at 0.005, at the inlet. At the four boundaries at the upper, lower, right, and left sides, the concentration gradient along the y-, z-axis was zero. At the outlet, a developed boundary condition was adopted, where the gradient of soot concentration along x-axis was zero. As mentioned before, the soot was trapped by the Brownian diffusion and the interception effect, and the local mass of deposited soot at each computational grid was calculated. Resultantly, the soot layer (the soot cake) was formed by the deposited soot. The permeability of the soot layer was given by the function of the flow velocity, the soot size, and the diffusion coefficient of the soot [32].
Figure 1. Three-dimensional numerical domain used for the particle-laden flow across the porous SiC-DPF is shown. The total size is 450 μm (x) × 60 μm (y) × 60 μm (z), with the grid size of 1 μm.
Solids 03 00020 g001

3. Results and Discussion

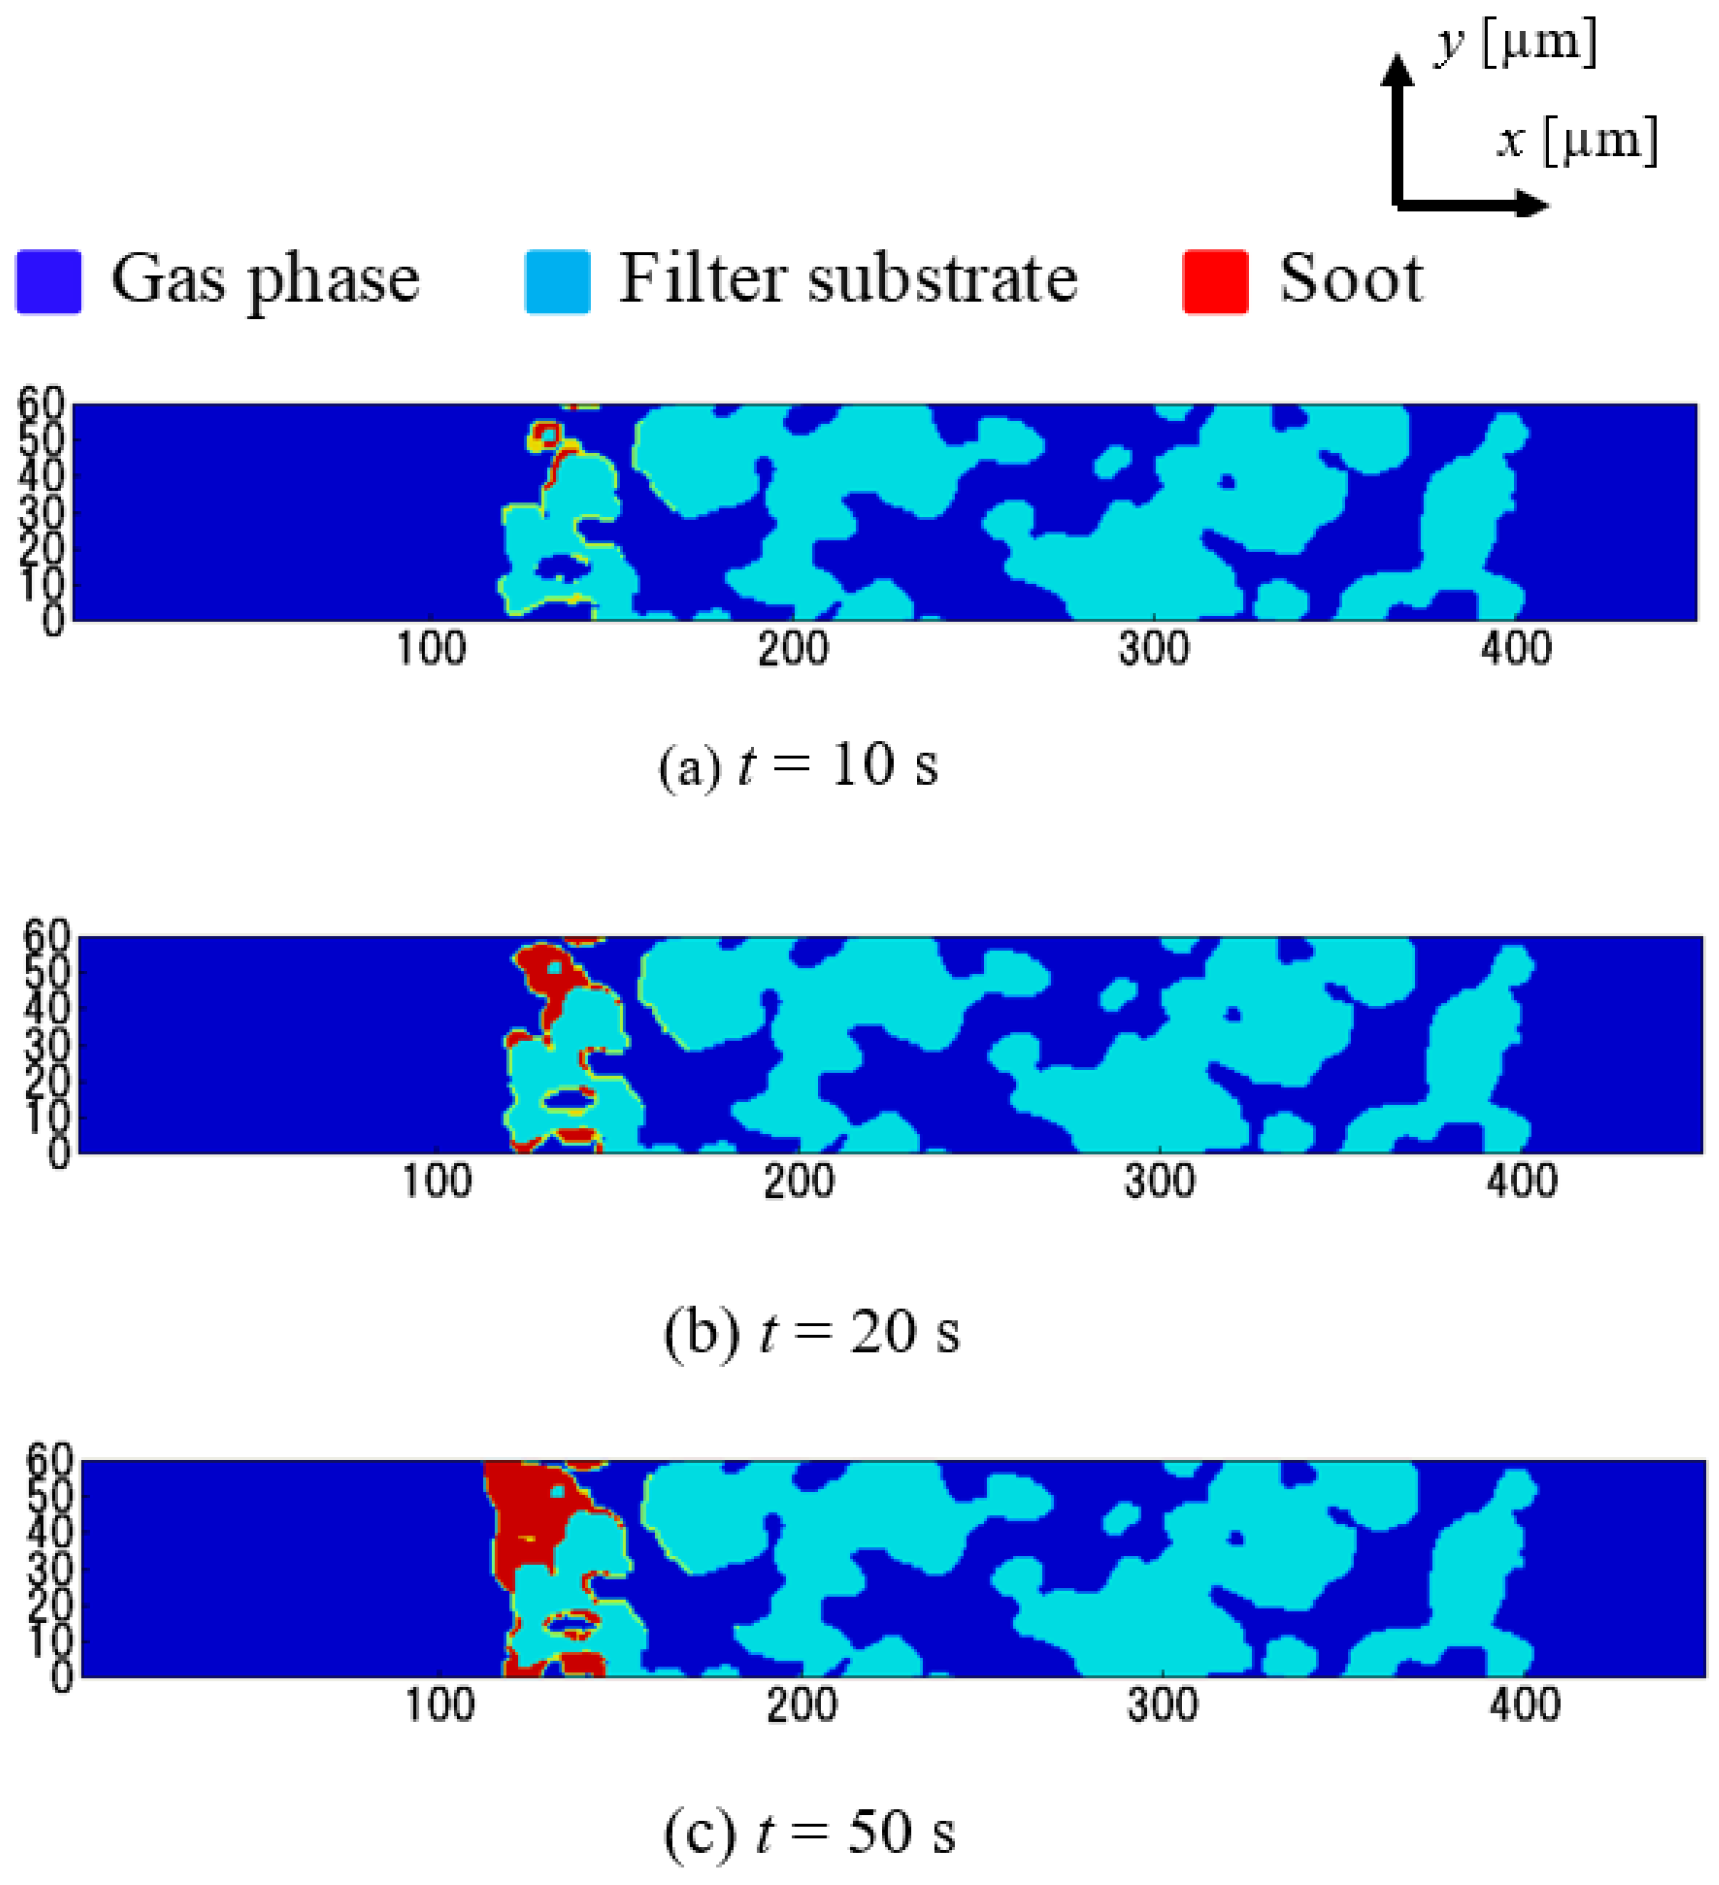
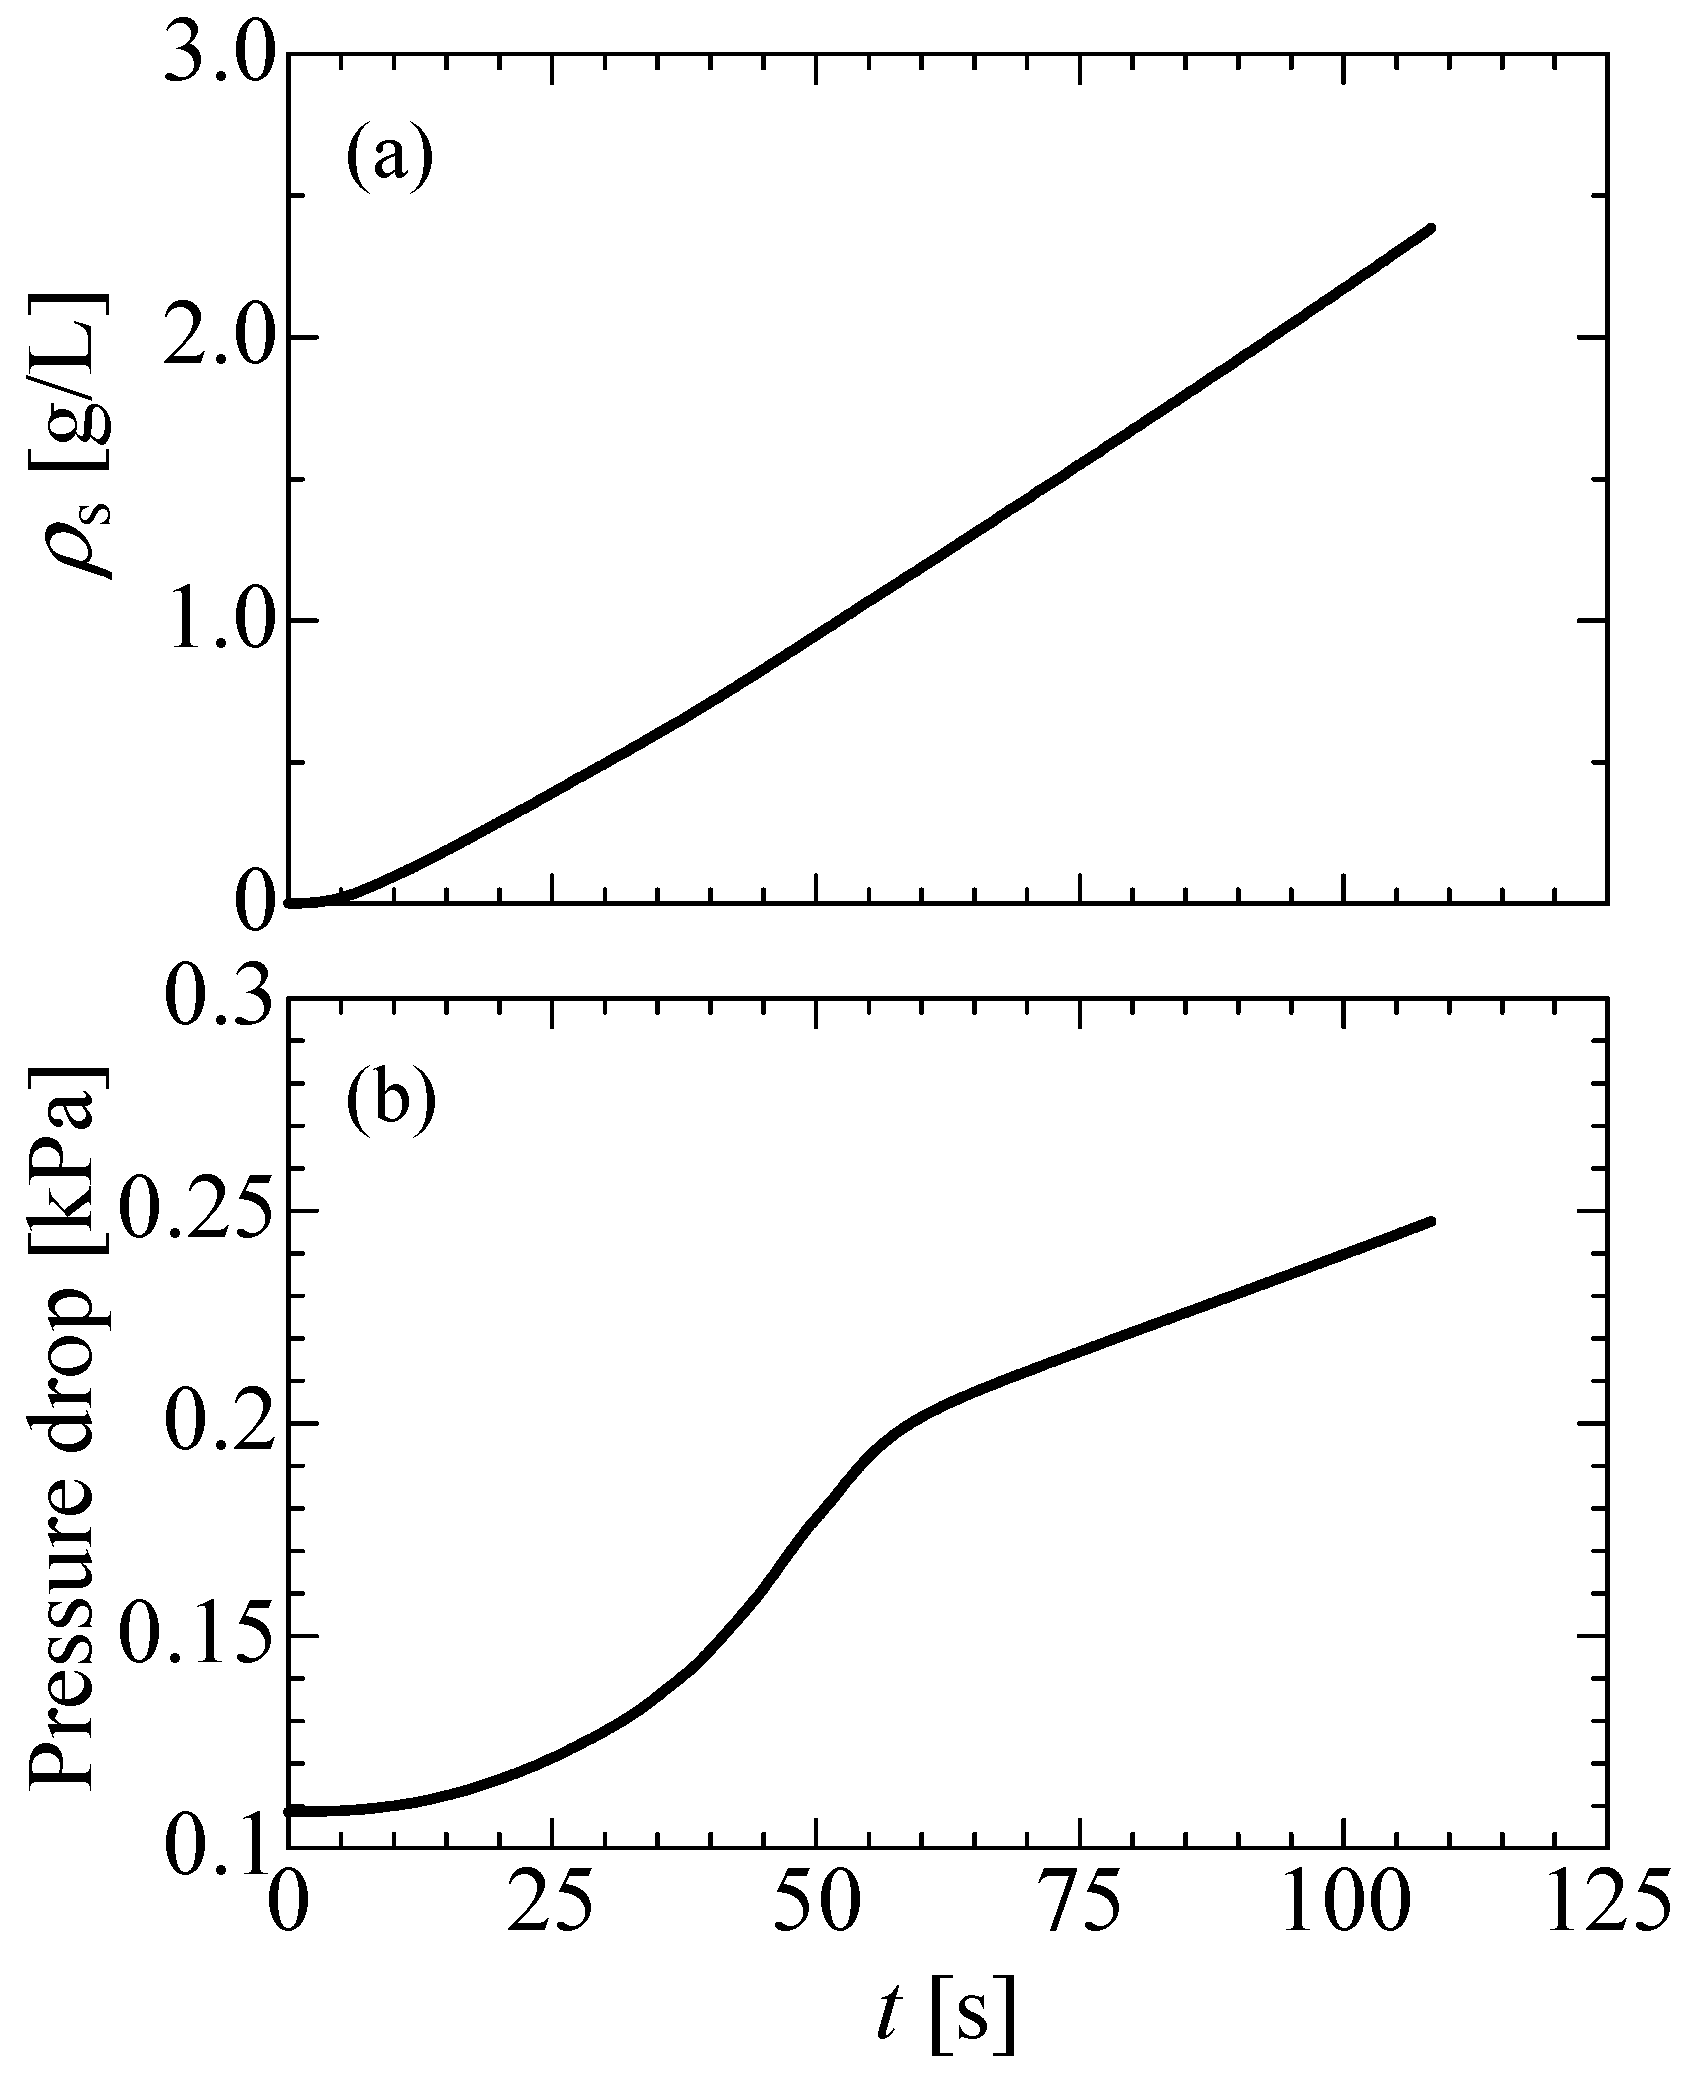
3.1. Soot Deposition Region and Pressure Drop

First, we explain the soot deposition region. Figure 2 and Figure 3 show two sets of slice images obtained at z = 21 μm or y = 35 μm. In this case, the soot size is 100 nm. Three profiles of different times are shown at t = 10, 20, 50 s. Initially, the soot passes through the surface pores of the porous filter and is deposited inside the filter wall. Namely, the so-called depth filtration [33] is observed. As more soot is deposited, pores on the filter surface are gradually covered by the soot deposition. At t = 20 s, all pores seen in Figure 3 are plugged with soot, but in Figure 2, there is one pore which is not covered with soot. By checking three-dimensional images of the soot deposition region, all pores on the filter wall surface are plugged with soot at t = 45 s. After that, as seen in the profile at t = 50 s, the soot layer is formed on the filter wall surface. As more soot is deposited, the thickness of the soot layer is thicker and thicker, corresponding to the surface filtration.
To discuss the shift between the depth filtration and the surface filtration, the time-variations of the deposited soot mass and the pressure drop were examined. Results are shown in Figure 4. The soot size is 100 nm. The deposited soot mass divided by the filter volume is shown in Figure 4a. The resultant time-variation of the pressure drop is shown in Figure 4b. It is seen that the deposited soot mass gradually increases. On the other hand, the pressure drop steeply increases. Once all pores on the filter wall surface are covered with the deposited soot, the surface filtration appears. After that, the filtration efficiency is 100%, because all soot is trapped by the soot layer. The resultant pressure increase seems to be linear. That is, the constant pressure rise is observed. In this case, the thickness of the soot cake is proportional to the time [32]. According to the theoretical model [34,35], the increase of the pressure drop is always proportional to the mass of deposited soot, which is apparently different from our predictions in Figure 4.
Next, to see the main contribution of the soot deposition quantitatively, the Brownian diffusion and the interception effect during the filtration were considered separately. Three cases were tested; (i) both effects were considered, (ii) only the Brownian diffusion was considered, and (iii) only the interception effect was considered. Figure 5 shows the slice images in the zy plane obtained at z = 21 μm for three cases. These profiles are obtained at t = 110 s, and the soot size is 100 nm. It is found that the soot deposition regions in cases (i) and (ii) are almost matched, showing the same thickness of the soot layer. On the other hand, as seen in case (iii), most of the soot is trapped deeply inside the filter wall. Besides, there is no soot layer on the filter wall surface.
To see the difference between three cases, the time-variations of the deposited soot mass and the pressure drop were compared. Results are shown in Figure 6. The soot size is 100 nm. As seen in Figure 6a, the time-variations of the deposited soot mass are the same for cases (i) and (ii). Furthermore, the same pressure drop is observed in Figure 6b. Therefore, the soot deposition occurs mainly due to the Brownian diffusion. However, when only the interception effect is considered, the deposited soot mass as well as the pressure drop is much smaller. As shown in case (iii) in Figure 5, the pores on the filter wall surface are not covered with the deposited soot by time t = 110 s. This is because there is some leakage through the filter wall, resulting in the small deposited soot mass. Therefore, it can be concluded that the soot deposition is mainly caused by the Brownian diffusion, which plays an important role in formation of the soot layer on the filter wall surface.

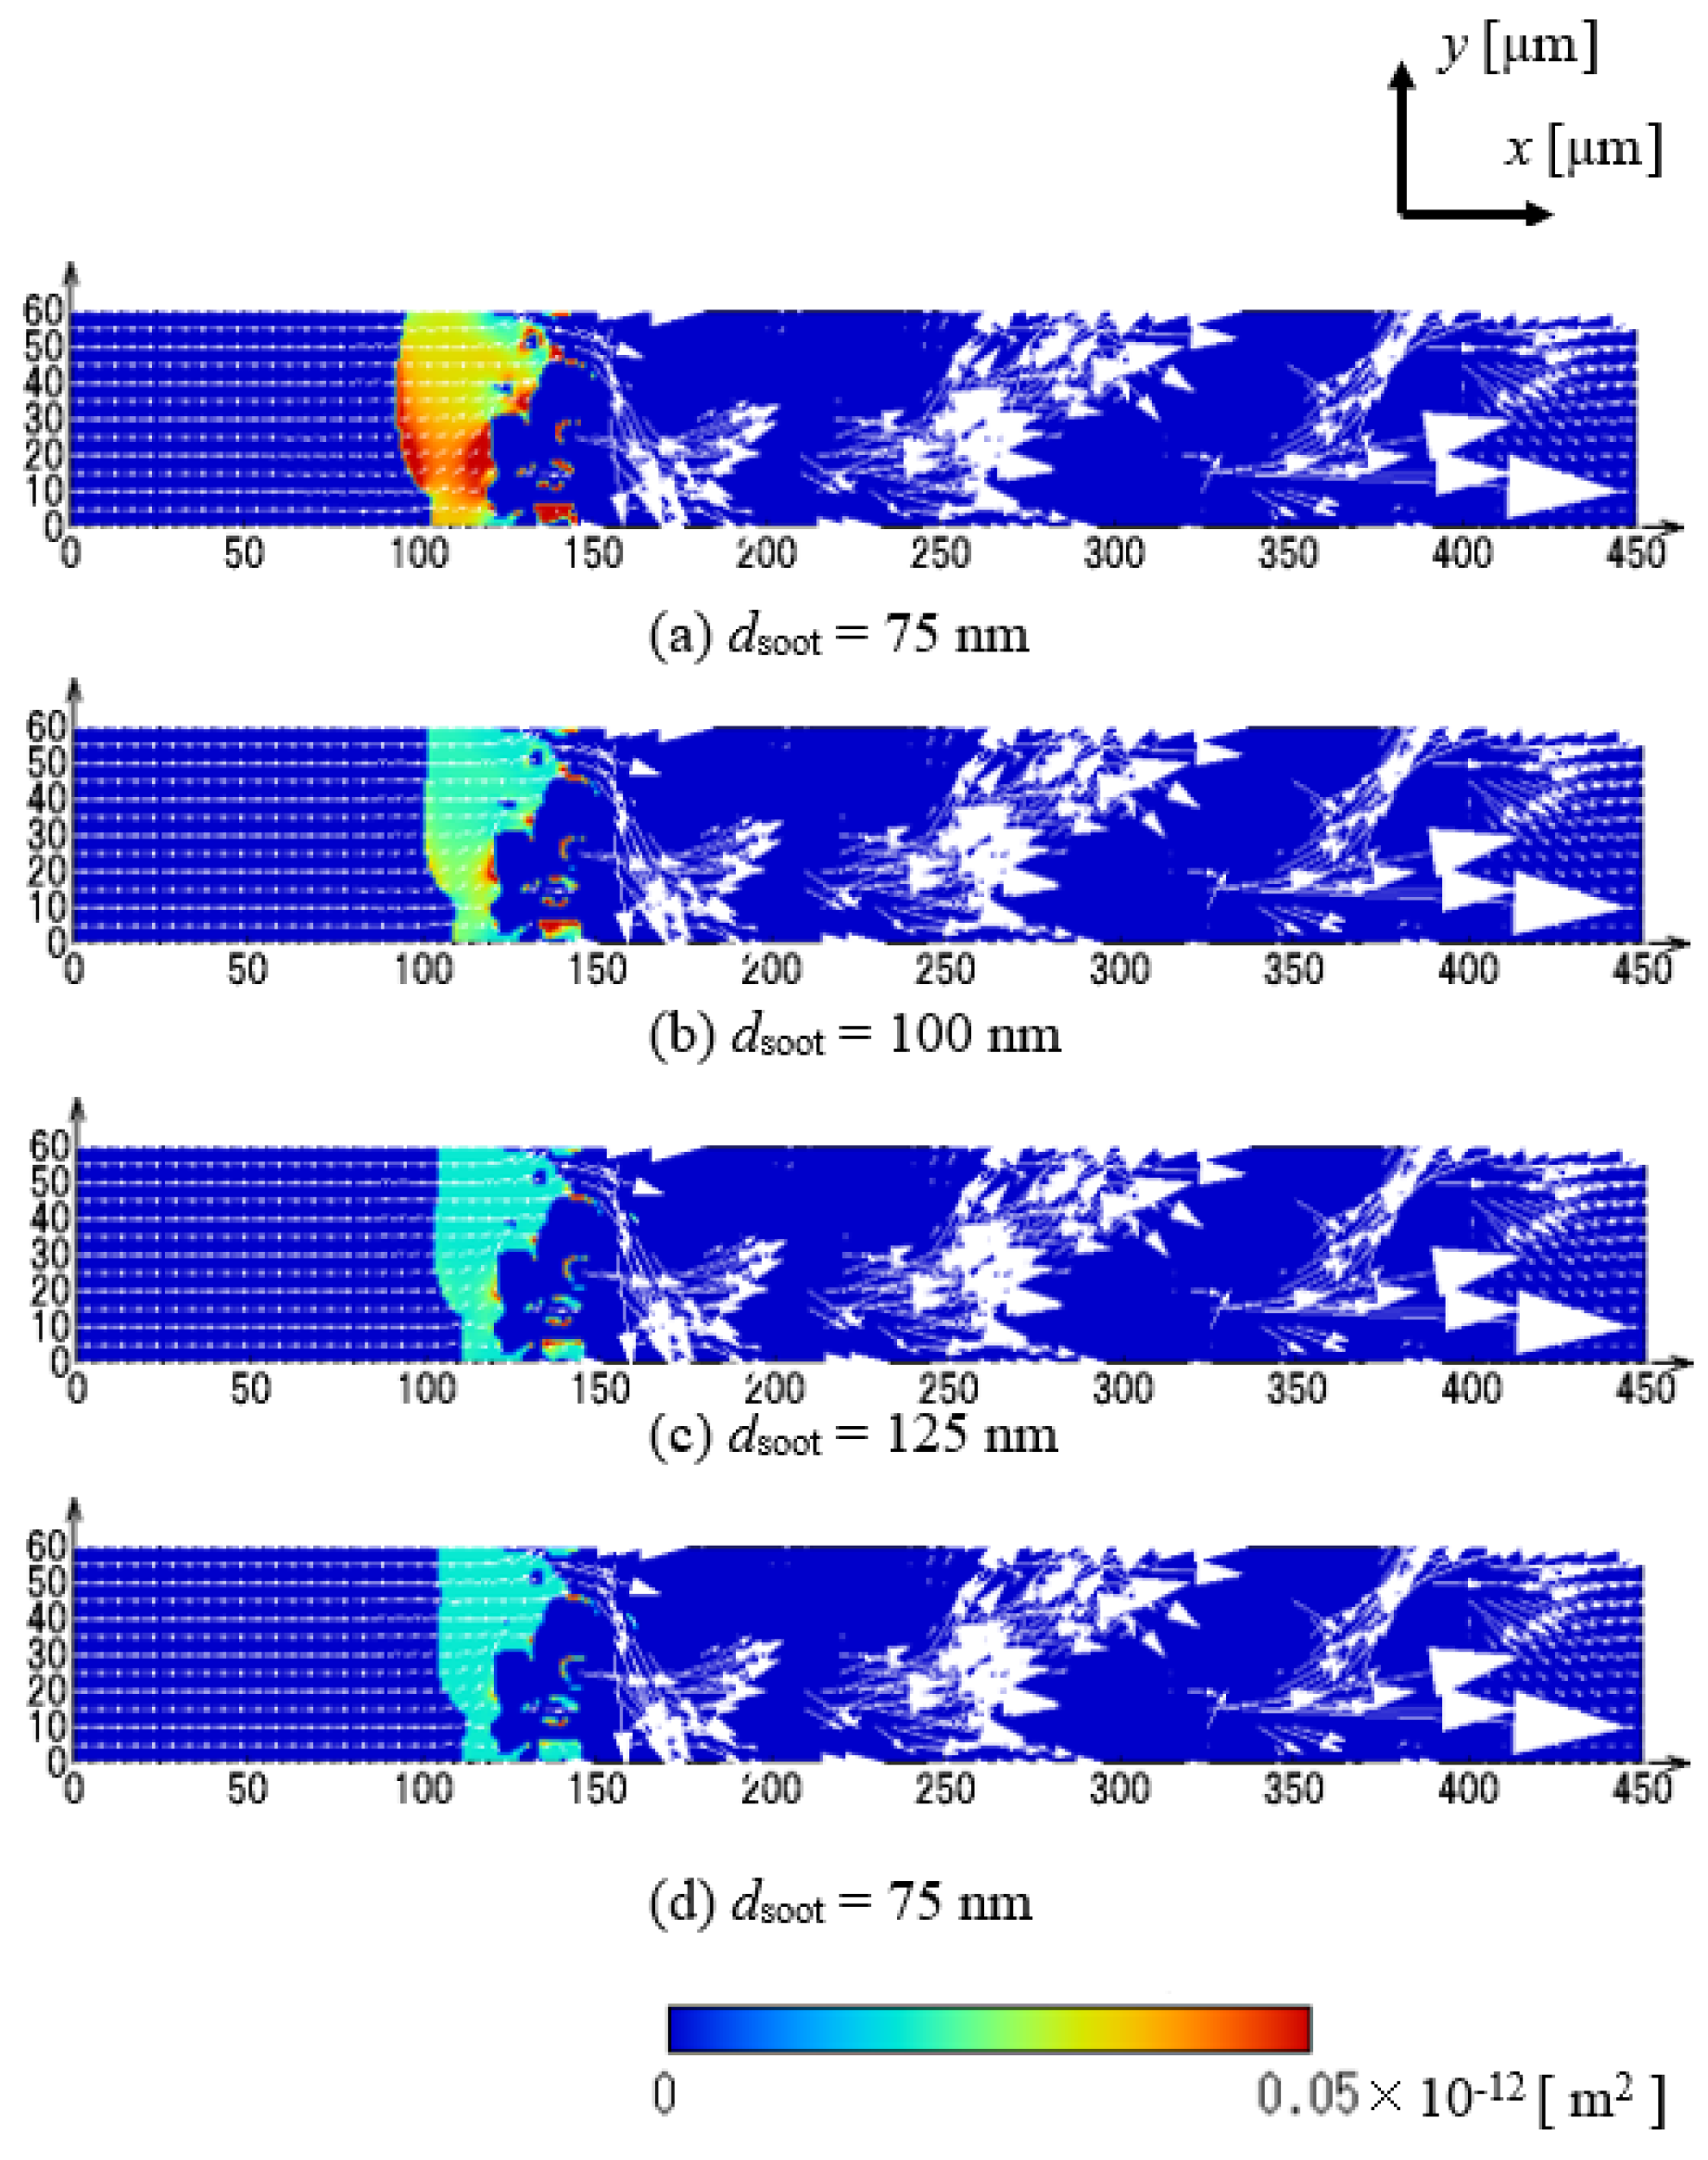
3.2. Effect of Soot Size on Pressure Drop

In the previous section, it is found that the Brownian diffusion is the main factor for the soot deposition mechanism. Needless to say, the Brownian diffusion largely depends on the soot size. Then, we investigated the effect of soot size, dsoot. Figure 7 shows the soot deposition regions at t = 90 s. It is the slice image in the xy plane at z = 21 μm. These are the profiles of dsoot = 75, 100, 125, 150 nm. Since they are the results obtained at the same period, it is expected that the soot mass supplied into the filter is the same. For all cases, the soot deposition region is observed relatively in the upstream region of the filter wall. As the soot size is larger, the soot layer forming on the filter wall surface becomes thinner. For further discussion, we evaluated the soot mass deposited on the filter wall. Figure 8a shows the time-variations of the deposited soot mass by changing the soot size. The resultant pressure drop is also shown in Figure 8b. As seen in Figure 8a, less soot is deposited with an increase in the soot size. It seems very reasonable, because the smaller soot is more efficiently deposited by the Brownian diffusion. On the other hand, it may not be easy to explain the resultant pressure drop in Figure 8b. It is expected that the smaller soot shows the larger pressure drop due to the efficient deposition. In fact, the pressure drop of dsoot = 75 nm is initially larger. However, when time elapses, the pressure drop of the larger soot is conversely superior, which is the same tendency reported by the engine test bench [36].
To discuss the pressure drop, we need to consider where the soot is deposited during the filtration process. Additionally, by considering the Darcy’s law, it is necessary to examine the permeability of the soot layer as well as the soot density. Figure 9 shows the soot density at the same location and period in Figure 7. It is found that the soot density is higher as the soot size is larger. That is, the soot layer becomes sparse when the smaller soot is deposited. It is reasonable, because the soot layer of the smaller soot is thicker even at the same period as shown in Figure 7. The resultant soot permeability is shown in Figure 10. As the smaller soot has a sparse soot layer, its soot permeability is larger, showing smaller pressure drop. That is why the pressure drop of the smaller soot is relatively reduced at t > 55 s in Figure 8b, although the pressure drop of dsoot = 75 nm is even higher than those of other three cases at t < 50 s. Then, we further discuss the soot deposition region.
Figure 11 shows the profiles of the deposited soot mass of dsoot = 75, 100, 125, 150 nm. The abscissa is the x-coordinate of the flow direction of the exhaust gas. By considering that the soot layer has a three-dimensional structure, the deposited soot mass is integrated in the yz plane. Then, we can discuss the difference between the soot deposition profiles. To focus on the soot layer formation, the profiles of t = 45 s are shown. As shown in Figure 2 and Figure 3, it is the time when all pores on the filter wall surface are covered with soot. As seen in this figure, dependent on the soot size, a clear difference is observed. That is, as the soot size is smaller, the soot is deposited more upstream. In other words, in the case of dsoot = 150 nm, more soot is trapped by the depth filtration. Since the smaller soot is efficiently deposited due to the Brownian diffusion, it is understandable to consider that the smaller soot is trapped at the more upstream region. Resultantly, the surface filtration appears earlier with a linear pressure increase in Figure 8b. Hence, when we discuss the pressure drop during the filtration process, it is important to consider where the soot deposition occurs, together with the deposited soot mass.

4. Conclusions

In this study, we simulated the particle-laden flow across the SiC-DPF. Focusing on the soot size, we discussed the filtration process and the pressure drop. The following results were obtained.
(1)
The contributions of the Brownian diffusion and the interception effect were evaluated quantitatively. The soot deposition mainly occurs due to the Brownian diffusion. The soot deposition region is restricted to the area of the upstream of the filter wall surface.
(2)
Independent of the soot size, the shift from the depth filtration to the surface filtration is observed. By checking the soot deposition region, the pressure drop increases steeply during the depth filtration. Once all pores on the filter wall surface are covered with soot, the pressure rise is reduced, showing the linear increase during the surface filtration. As the soot size is smaller, the shift to the surface filtration appears earlier.
(3)
As the soot size is smaller, the soot layer forming on the filter wall surface becomes sparse. The resultant soot permeability of the smaller soot is larger. Then, due to the larger soot permeability, the pressure drop of the smaller soot is expectedly reduced. However, the smaller soot is trapped more efficiently by the Brownian diffusion. Then, only in the earlier stage of the filtration, the pressure drop of the smaller soot is larger. After that, the pressure drop is conversely smaller. Therefore, for discussing the pressure drop, it is important to consider where the soot deposition occurs as well as the deposited soot mass in the filter.

Author Contributions

K.Y. had the original idea for the study and drafted the manuscript. S.Y. was responsible for data analyses. All authors have read and agreed to the published version of the manuscript.

Funding

This research received no external funding.

Institutional Review Board Statement

Not applicable.

Informed Consent Statement

Not applicable.

Data Availability Statement

Data sharing not applicable. Some of the data can be shared with a joint research agreement with Nagoya University.

Conflicts of Interest

The authors declare no conflict of interest.

Sample Availability

Samples of the compounds are available, but a joint research agreement with Nagoya University is needed.

References

  1. Zervas, E.; Poulopoulos, S.; Philippopoulos, C. CO2 emissions change from the introduction of diesel passenger cars: Case of Greece. Energy 2006, 31, 2579–2589. [Google Scholar] [CrossRef]
  2. Knecht, W. Diesel engine development in view of reduced emission standards. Energy 2008, 33, 264–271. [Google Scholar] [CrossRef]
  3. Kong, H.; Yamamoto, K. Simulation on soot deposition in in-wall and on-wall catalyzed diesel particulate filters. Catal. Today 2019, 332, 89–93. [Google Scholar] [CrossRef]
  4. Kittelson, D.B. Engines and nanoparticles: A review. J. Aerosol Sci. 1998, 29, 575–588. [Google Scholar] [CrossRef]
  5. Kennedy, I.M. The health effects of combustion-generated aerosols. Proc. Combust. Inst. 2007, 31, 2757–2770. [Google Scholar] [CrossRef]
  6. Schejbal, M.; Štěpánek, J.; Marek, M.; Kočí, P.; Kubíček, M. Modelling of soot oxidation by NO2 in various types of diesel particulate filters. Fuel 2010, 89, 2365–2375. [Google Scholar] [CrossRef]
  7. Tzamkiozis, T.; Ntziachristos, L.; Samaras, Z. Diesel passenger car PM emissions: From Euro 1 to Euro 4 with particle filter. Atmos. Environ. 2010, 44, 909–916. [Google Scholar]
  8. Lapuerta, M.; Oliva, F.; Agudelo, J.R.; Boehman, A.L. Effect of fuel on the soot nanostructure and consequences on loading and regeneration of diesel particulate filters. Combust Flame 2012, 159, 844–853. [Google Scholar] [CrossRef]
  9. Johnson, T.V. Vehicular emissions in review. SAE Int. J. Engines 2016, 9, 1258–1275. [Google Scholar] [CrossRef]
  10. Yamamoto, K.; Tajima, Y. Mechanism for pressure drop variation caused by filtration of diesel particulates. Int. J. Engine Res. 2019, 22, 632–639. [Google Scholar] [CrossRef]
  11. Yamamoto, K.; Kato, H.; Suzuki, D. Pressure response during filtration and oxidation in diesel particulate filter. Emiss. Control Sci. Technol. 2019, 5, 24–30. [Google Scholar] [CrossRef]
  12. Chundru, V.R.; Parker, G.G.; Johnson, J.H. Development of a Kalman filter estimator for simulation and control of NOx and PM in a SCR catalyst on a DPF. Int. J. Engine Res. 2021, 22, 2407–2421. [Google Scholar]
  13. Gong, J.; Viswanathan, S.; Rothamer, S.A.; Foster, D.A.; Rutland, C.J. Dynamic heterogeneous multiscale filtration model: Probing micro and macroscopic filtration characteristics of gasoline particulate filters. Environ. Sci. Technol. 2017, 51, 11196–11204. [Google Scholar] [CrossRef] [PubMed]
  14. Czerwinski, J.; Comte, P.; Heeb, N.; Mayer, A.; Hensel, V. Nanoparticle Emissions of DI Gasoline Cars with/without GPF; SAE Technical Paper 2017-01-1004; SAE: Warrendale, PA, USA, 2017; pp. 1–8. [Google Scholar]
  15. Viswanathan, S.; Rothamer, D.A.; Foster, D.E.; Fansler, T.D.; Zelenyuk, A.; Stewart, M.; Bell, D.M. Evolution of deep-bed filtration of engine exhaust particulates with trapped mass. Int. J. Engine Res. 2017, 18, 543–559. [Google Scholar] [CrossRef]
  16. Jang, J.; Lee, J.; Choi, Y.; Park, S. Reduction of particle emissions from gasoline vehicles with direct fuel injection systems using a gasoline particulate filter. Sci. Total Environ. 2018, 644, 28–33. [Google Scholar] [CrossRef] [PubMed]
  17. Warner, J.R.; Dobson, D.; Cavataio, G. A study of active and passive regeneration using laboratory generated soot on a variety of SiC diesel particulate filter formulations. SAE Int. J. Fuels Lubr. 2010, 3, 149–164. [Google Scholar] [CrossRef]
  18. Chen, C.; Yao, A.; Yao, C.; Qu, G. Experimental study of the active and passive regeneration procedures of a diesel particulate filter in a diesel methanol dual fuel engine. Fuel 2020, 264, 116801. [Google Scholar] [CrossRef]
  19. R’Mili, B.; Boréave, A.; Meme, A.; Vernoux, P.; Leblanc, M.; Noël, L. Physico-chemical characterization of fine and ultrafine particles emitted during diesel particulate filter active regeneration of Euro5 diesel vehicles. Environ. Sci. Technol. 2018, 52, 3312–3319. [Google Scholar] [CrossRef]
  20. Li, Z.; Li, S.; Li, Z.; Wang, Y.; Li, Z.; Li, M.; Jiao, P.; Cai, D. Simulation study of NO2-assisted regeneration performance of variable cell geometry catalyzed diesel particulate filter. Process. Saf. Environ. Prot. 2021, 154, 211–222. [Google Scholar] [CrossRef]
  21. Zhang, J.; Li, Y.; Wong, V.W.; Shuai, S.; Qi, J.; Wang, G.; Liu, F.; Hua, L. Experimental study of lubricant-derived ash effects on diesel particulate filter performance. Int. J. Engine Res. 2021, 22, 921–934. [Google Scholar]
  22. Yamamoto, K.; Yamauchi, K.; Takada, N.; Misawa, M.; Furutani, H.; Shinozaki, O. Lattice Boltzmann simulation on continuously regenerating diesel filter. Philos. Trans. A 2011, 369, 2584–2591. [Google Scholar] [CrossRef] [PubMed]
  23. Yamamoto, K.; Yamauchi, K. Numerical simulation of continuously regenerating diesel particulate filter. Proc. Combust. Inst. 2013, 34, 3083–3090. [Google Scholar] [CrossRef]
  24. Yamamoto, K.; Matsui, K. Diesel exhaust after-treatment by silicon carbide fiber filter. Fibers 2014, 2, 128–141. [Google Scholar] [CrossRef] [Green Version]
  25. Yamamoto, K.; Sakai, T. Effect of pore structure on soot deposition in diesel particulate filter. Computation 2016, 3, 274–284. [Google Scholar] [CrossRef] [Green Version]
  26. Yamamoto, K.; Toda, T. Numerical simulation on flow dynamics and pressure variation in porous ceramic filter. Computation 2018, 64, 52. [Google Scholar] [CrossRef] [Green Version]
  27. Yamamoto, K.; Kondo, S.; Suzuki, K. Filtration and regeneration performances of SiC fiber potentially applied to gasoline particulates. Fuel 2019, 243, 28–33. [Google Scholar] [CrossRef]
  28. Qian, Y.H.; D’Humie’res, D.; Lallemand, P. Lattice BGK models for Navier-Stokes equation. Eur. Lett. 1992, 17, 479–484. [Google Scholar] [CrossRef]
  29. Chen, S.; Doolen, G.D. Lattice Boltzmann method for fluid flows. Annu. Rev. Fluid Mech. 1998, 30, 329–364. [Google Scholar] [CrossRef] [Green Version]
  30. Chopard, B.; Masselot, A.; Dupuis, A. A lattice gas model for erosion and particles transport in a fluid. Comput. Phys. Commun. 2000, 129, 167–176. [Google Scholar] [CrossRef]
  31. Yamamoto, K.; Komiyama, R.; Sakai, T. Flow and pressure variations through porous filter during soot filtration and regeneration. ASME J. Therm. Sci. Eng. Appl. 2019, 11, 1–6. [Google Scholar] [CrossRef]
  32. Konstandopoulos, A.G.; Skaperdas, E. Microstructural properties of soot deposits in diesel particulate traps. SAE Tech. Pap. 2002, 2002, 11. [Google Scholar]
  33. Wirojsakunchai, E.; Schroeder, E.; Kolodziej, C.; Foster, D.E.; Schmidt, N.; Root, T.; Kawai, T.; Suga, T.; Nevius, T.; Kusaka, T. Detailed Diesel Exhaust Particulate Characterization and Real-Time DPF Filtration Efficiency Measurements during PM Filling Process; SAE Technical Paper 2007-01-0320; SAE: Warrendale, PA, USA, 2007; pp. 1–8. [Google Scholar]
  34. Stratakis, G.A.; Psarianos, D.L.; Stamatelos, A.M. Experimental investigation of the pressure drop in porous ceramic diesel particulate filters. Proc. Inst. Mech. Eng. 2002, 216, 773–784. [Google Scholar] [CrossRef]
  35. Kladopoulou, E.A.; Yang, S.L.; Johnson, J.H.; Parker, G.G.; Konstandopoulos, A.G. A study describing the performance of diesel particulate filters during loading and regeneration—A lumped parameter model for control applications. SAE Tech. Pap. 2003, 112, 647–668. [Google Scholar]
  36. Uenishi, T.; Tanaka, T.; Shigeno, G.; Fukuma, T.; Kusaka, J.; Daisho, Y. A Quasi Two Dimensional Model of Transport Phenomena in Diesel Particulate Filters—The Effects of Particle and Wall Pore Diameter on the Pressure Drop; SAE Technical Paper 2015-01-2010; SAE: Warrendale, PA, USA, 2015; pp. 1–10. [Google Scholar]
Figure 2. Soot deposition regions of the xy plane at z = 21 µm are shown at three different times.
Solids 03 00020 g002
Figure 3. Soot deposition regions of the xz plane at y = 35 µm are shown at three different times.
Solids 03 00020 g003
Figure 4. Time-variations of (a) deposited soot mass and (b) pressure drop are shown.
Solids 03 00020 g004
Figure 5. Slice images of the soot deposition region in the xy plane obtained at z = 21 μm are shown for three cases (iiii).
Solids 03 00020 g005
Figure 6. Time-variations of (a) deposited soot mass and (b) pressure drop for three cases (i) to (iii) are shown to discuss the soot deposition process.
Solids 03 00020 g006
Figure 7. Soot deposition regions in xy plane by changing the soot size at z = 21 μm; t = 90 s.
Solids 03 00020 g007
Figure 8. Time-variations of (a) deposited soot mass and (b) pressure drop by changing the soot size.
Solids 03 00020 g008
Figure 9. Profiles of soot density in xy plane by changing the soot size at z = 21 μm; t = 90 s.
Solids 03 00020 g009
Figure 10. Profiles of soot permeability in xy plane by changing the soot size at z = 21 μm; t = 90 s.
Solids 03 00020 g010
Figure 11. Profiles of the deposited soot mass along flow direction by changing the soot size.
Solids 03 00020 g011
Publisher’s Note: MDPI stays neutral with regard to jurisdictional claims in published maps and institutional affiliations.

