Article

A Reflective Spectroscopy Proof-of-Concept Study of Urea for Supporting Investigations of Human Waste in Multiple Forensic Contexts

1
Department of Geology & Environmental Earth Sciences, Miami University, 118 Shideler Hall, 250 S. Patterson Avenue, Oxford, OH 45056, USA
2
Department of Mathematical and Physical Sciences, Miami University Hamilton, 1601 University Boulevard, Hamilton, OH 45011, USA
*
Author to whom correspondence should be addressed.
Forensic Sci. 2024, 4(3), 463-474; https://doi.org/10.3390/forensicsci4030030
Submission received: 17 July 2024 / Revised: 4 September 2024 / Accepted: 6 September 2024 / Published: 20 September 2024
(This article belongs to the Special Issue The Role of Forensic Geology in Criminal Investigations)

Abstract

:
Human urine and its detection are of interest in forensic studies in numerous contexts. Both crystalline urea and 1.0 M solutions of urea, as synthetic analog endmember components of human urine, were investigated as a proof-of-concept study to determine if detailed lab spectroscopy would be viable. Urea was reliably detected on Ottawa sand at concentrations of approximately 3.2% in dried experiments. Urea was detectable after 1 week of solution evaporation under lab conditions, at 9.65 wt.% 1 M solution. This investigation successfully establishes urea as a material of interest for reflective spectroscopy and hyperspectral remote sensing/image spectroscopy on a wide range of spatial scales, from specific centimeter-scale areas in a crime scene to searching large outdoor regions > 1 km2. In addition, this investigation is relevant to improving the monitoring of human trafficking, status and condition of refugee camps, and monitoring sewage.

1. Introduction

Tracing and interpreting human activity are fundamental goals of forensic investigations in criminal investigations, human rights contexts, and search and rescue efforts. Hyperspectral remote sensing/image spectroscopy (HRS/IS) is an increasingly important potential tool for forensic investigations in these contexts. Through HRS/IS approaches, digital imagery is obtained through satellites, airplanes, or unmanned air vehicles. Each pixel of the acquired image has a reflective spectrum associated with it that is a function of the source materials on the ground. HRS/IS allows for materials to be identified and their spectra to be compiled in order to provide a high-quality library of geomaterials. HRS/IS has been utilized extensively in the context of characterizing a wide range of materials at several scales and in a diverse range of environments, including climate change science, mapping of invasive species, mine waste, petroleum pollution investigations, resource mapping, and radiological material detection [1,2,3,4,5,6,7,8,9,10].
The use of basic unmanned aerial vehicles/systems (UAVs/UASs) equipped with cameras and video in law enforcement and search and rescue is becoming more pronounced [11,12,13,14,15]. HRS/IS is an attractive technology in forensic investigations because it can be utilized in multiple modes to document and even monitor in near real time large crime scenes, disaster sites, and conflict zones [16]. The potential and capability for HRS/IS to be meaningfully integrated into forensic investigations of human materials, clothing, blood, and associated items is significant. Examples of broad forensic contexts include finding evidence of violent crime(s), and locating lost, missing persons, or hostages. Increasingly, HRS/IS is being tested and explored in the context of forensic investigations [17,18,19,20,21,22,23,24,25,26,27,28,29,30,31].
A major limitation for HRS/IS implementation for forensic investigations exists, however, in that detailed, comprehensively characterized libraries optimized specifically for forensic use are uncommon [16]. This is exacerbated for complex outdoor or geologic terranes owing to the range of environmental variability [16]. There is an extreme need to develop comprehensively characterized libraries that address these complexities in the context of forensic applications. However, before extensive time and resources can be attributed for detailed library development, proof-of-concept studies that demonstrate probable feasibility are warranted. One pronounced gap in the body of forensic HRS/IS library work is in the development of liquid combination substrates. One liquid of potential forensic interest is human urine.
Human urine is of interest in forensic studies as it can indicate the presence of a person or persons at a point in time or over some period of time. This can be important, particularly in scenarios where a person is missing, such as lost hikers, dementia patients, or missing children, or in scenarios where persons are held against their will in numerous contexts, including human trafficking or when they are forced to be in locations such as illegal border crossings. Detection of urine in outdoor environments by HRS/IS is expected to be challenging. Whether human urine can be identified routinely in HRS/IS imaging, and whether or not trends of age estimation could be established, are not known. The chemical composition of urine can be very diverse based on diet and age. One component of urine that is functionally ubiquitous is urea. As a proof of concept, and to inform future more detailed investigations of urea, we investigated urea on an ideal geologic substrate that is quartz-rich, Ottawa sand; as a powder as analogs for dried accumulation of urine, and in 1.0 M solutions for urine solutions evaporating.

2. Materials

Ottawa sand was purchased from Fisher Scientific (Sigma Aldrich, USA) as a 3 kg container and was used as shipped. Ottawa sand was selected owing to its presumed mineralogical uniformity and controlled grain size and adopted use in geotechnical studies. Ottawa sand was not sterilized in the lab. Crystalline urea was purchased from Sigma Aldrich and was used unmodified. A 1.0 M solution of urea was prepared for spray experiments. The structure of urea and the structure of quartz are presented in Figure 1 for reference.

3. Methods

3.1. Grain Size Characteristics

A 200 g sample of Ottawa sand was dried in an oven at 60 °C for 24 h. Grain size properties were determined on this sample using 8″ ASTM mechanical brass sieves using mesh sizes from 4000 to 38 μm and a Gilson mechanical shaker unit. Mass for each size fraction was recorded and was then evaluated using the Gradistat v9.1 Excel program [32].

3.2. Polarized Light Microscopy (PLM)

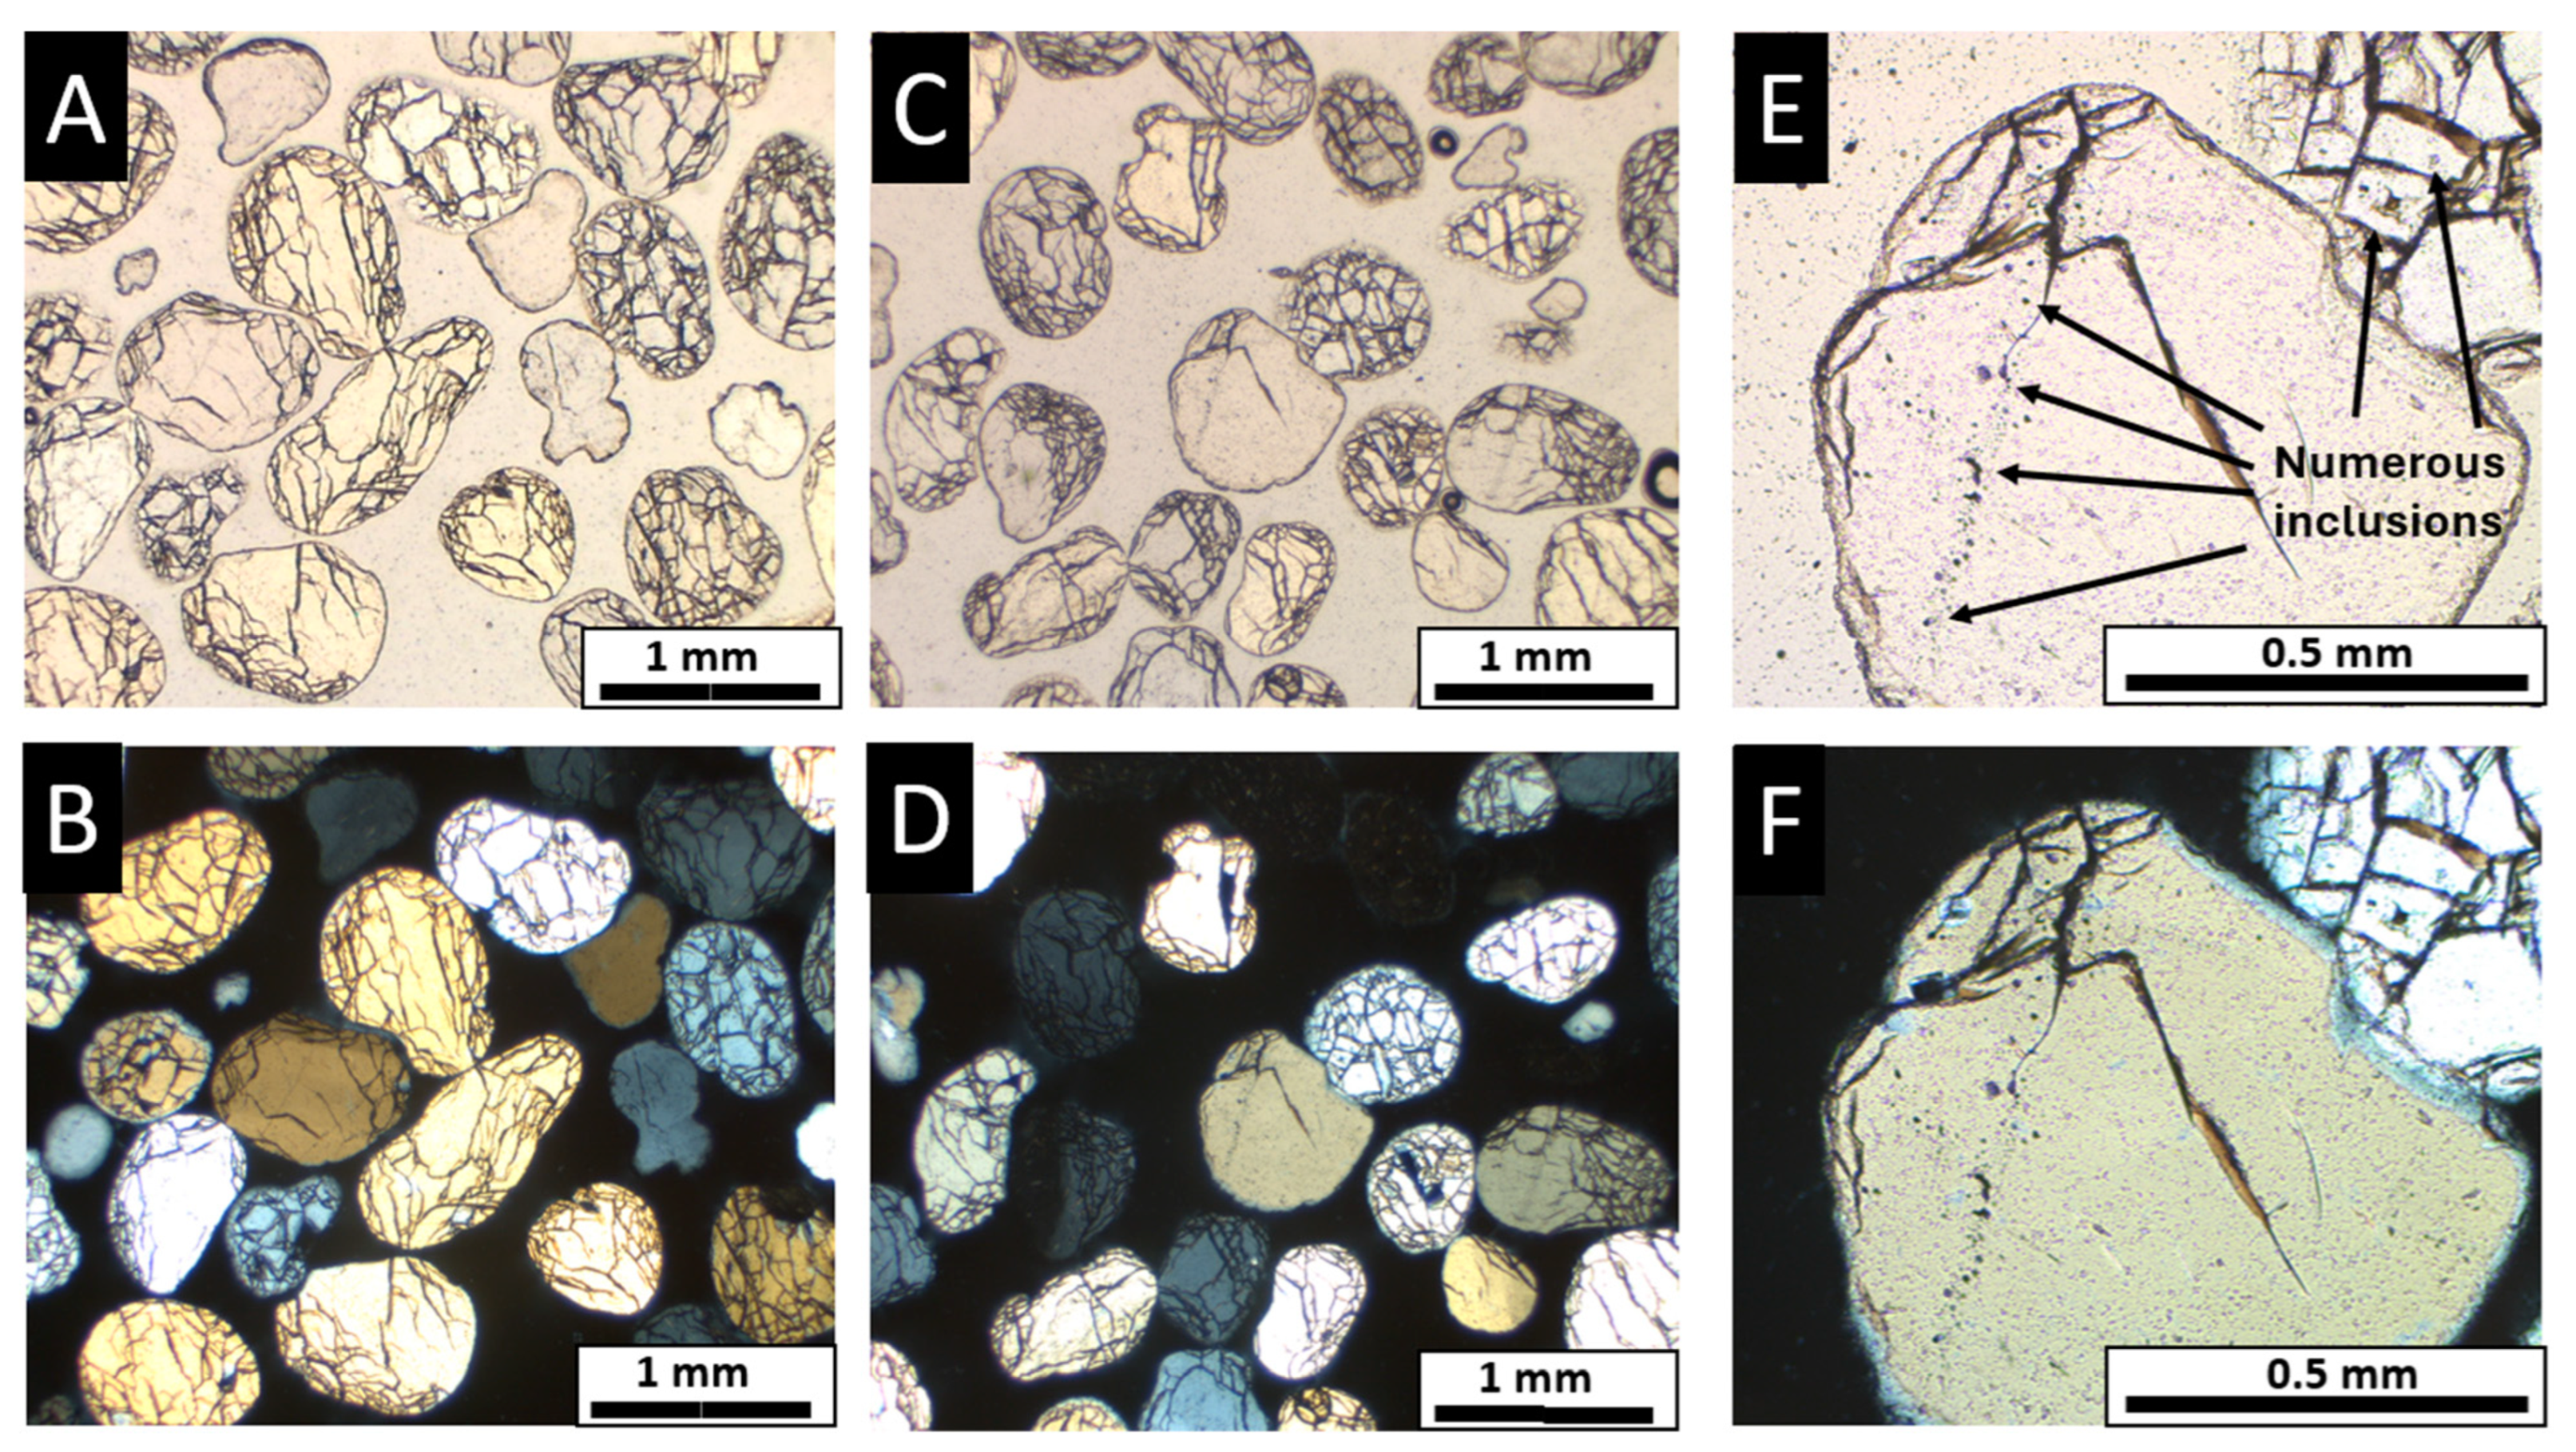
One single side polished thin section of Ottawa sand was prepared by Applied Petrographic Services, Inc. (Greensburg, PA, USA). The thin section was evaluated using a Leica DM2700 P microscope using the mineral identification criteria of Nesse [33]. Images were captured digitally in plane and polarized light.

3.3. Scanning Electron Microscopy and Energy Dispersive Spectroscopy

For SEM-EDS investigation, Ottawa sand material was mounted onto a 10 mm aluminum stub using a carbon sticky tab and was uncoated. A Zeiss 35VP field emission scanning electron microscope (FESEM) was used to collect data under variable pressure (VP) using nitrogen (N2) as the compensating gas. The instrument is equipped with a Bruker Quantax energy dispersive spectrometer. X-ray emission lines used to identify elements observed in the Bruker software include O Kα = 0.525 keV; Al Kα = 1.487 keV; Si Kα = 1.740 keV (nominally Kβ = 1.837 keV); K Kα = 3.312 keV; Fe Kα = 6.399 keV; and Kβ = 7.060 keV. The Al Kα line is attributed in part to scatter from the aluminum stub. The detection limit for EDS is approximately 0.08 wt.%. The instrument and approaches used are the same as several recent mineralogical and environmental studies [34,35,36,37,38,39,40,41,42,43,44,45,46].

3.4. Reflective Spectroscopy

Plastic Petri dishes that were painted with flat black spray paint were utilized for experimental substrates for reflective spectra measurements. Reflective spectra were acquired using a contact probe to produce the most uniform data using an ASD FieldSpec 4 Hi-Res spectroradiometer. The ASD FieldSpec 4 Hi-Res spectroradiometer has a range of 350 to 2500 nm with spectral resolutions of 3 nm at 700 nm, and of 8 nm at 1400 nm and 2100 nm. This instrument is equipped with both a modular silicon array and an InGaAs Peltier-cooled detector platform. The instrument has a post-dispersive system for extremely low stray light which is rated at <0.02% for 350 to 1000 nm and rated at <0.1% for 1000 to 2500 nm. The low noise equivalent delta radiance (NeDL) values are provided as 1.1 × 10⁻⁹ W/cm2/sr/nm at 700 nm for UV/VNIR, 2.8 × 10⁻⁹ W/cm2/sr/nm at 1400 nm for NIR, and 5.6 × 10⁻⁸ W/cm2/sr/nm at 2100 nm. Assignments were informed by known chemical bonds of materials and the mineral identification of Ottawa sand based on SEM and PLM. The ASD FieldSpec 4 Hi-Res spectroradiometer and the approaches described below have been used in numerous similar previous investigations [6,16,41,47,48,49,50,51].

3.5. Bond Assignments

The spectroscopy literature and the USGS spectral library were used to determine bond assignments for spectra [51,52,53,54,55,56,57,58]. For Ottawa sand, adoption features are assigned as follows: the ~470 nm minor inflection is attributed to Fe3+ crystal field band [54]. The broader ~660 nm inflection is attributed to Fe3+ electron transitions [55,57,58]. The ~1420 nm absorption feature is attributed to water v1 + v3 and OH [52,57,58]. The ~1930 nm feature is attributed to OH structure and deformation and water [52,57,58]. The ~2230 nm feature is attributed to OH [53]. The ~2300 nm feature is attributed to Al-OH [57,58].
For crystalline urea, experimental reflective data with clear bond assignments are sparse owing to the difference in wavelengths commonly studied. NIST provides a spectrum of urea without bond assignments. Bond assignments for some major features of urea are found to be ~1160 nm (C=O, fourth overtone); ~1460 nm (symmetric N-H stretch, first overtone); ~1520 nm (N-H stretch, first overtone); ~1990 nm (N-H stretch and N-H bend combination), ~2030 nm (C=O stretch, second overtone); ~2070 nm (N-H deformation and overtone) [59]. Other sources indicate that the ~2180 nm feature is assigned to N-H bend, C=O stretch, C-N stretch, and the ~2300 nm feature is assigned to N-H stretch and C=O stretch [52]. It is noted that there are numerous additional features in our experimental data and the data of others, however specific bond assignments generally are not provided for these features in the reflective ranges (350 to 2500 nm), but in wavenumbers [59,60,61].

3.6. Experimental

Spectra for the initial characterization of Ottawa sand were obtained by placing ~20 g of the sand in the painted Petri dishes to reasonably fill the dishes uniformly. Three replicate spots on each sample were analyzed using the contact probe of the spectroradiometer, and five spectra from each spot were recorded. The spectra were collected at one-second intervals, and the five spectra were averaged for each spectrum measurement using the RS3 software. Afterward, we applied incrementally increasing amounts of 1.0 M liquid urea solution to fifteen samples using a spray bottle to determine the threshold of detectability of liquid urea through its spectral signature. Spectra for each sample with the added urea solution were collected in the same manner as that of the Ottawa dry sand. To assess the degree to which time affects the spectra of the urea solution, the samples were covered with tinfoil for three days and then spectra were collected once again. The same procedure was repeated after five days, one week, and one month. Weights were recorded for each measurement set (see Supplementary Materials, Table S1). Spectra to determine the threshold of detectability of powdered urea were collected with ~1.6 g of powdered urea divided in incrementally increasing amounts among five samples of Ottawa sand, with the first sample containing 0.0 g (a sample blank) of powdered urea (see Supplementary Materials, Table S1). Spectra for each sample with the added powdered urea were collected in the same manner as previous procedures. All spectral data are provided in Supplementary Materials, Table S2.

4. Results

4.1. Ottawa Sand

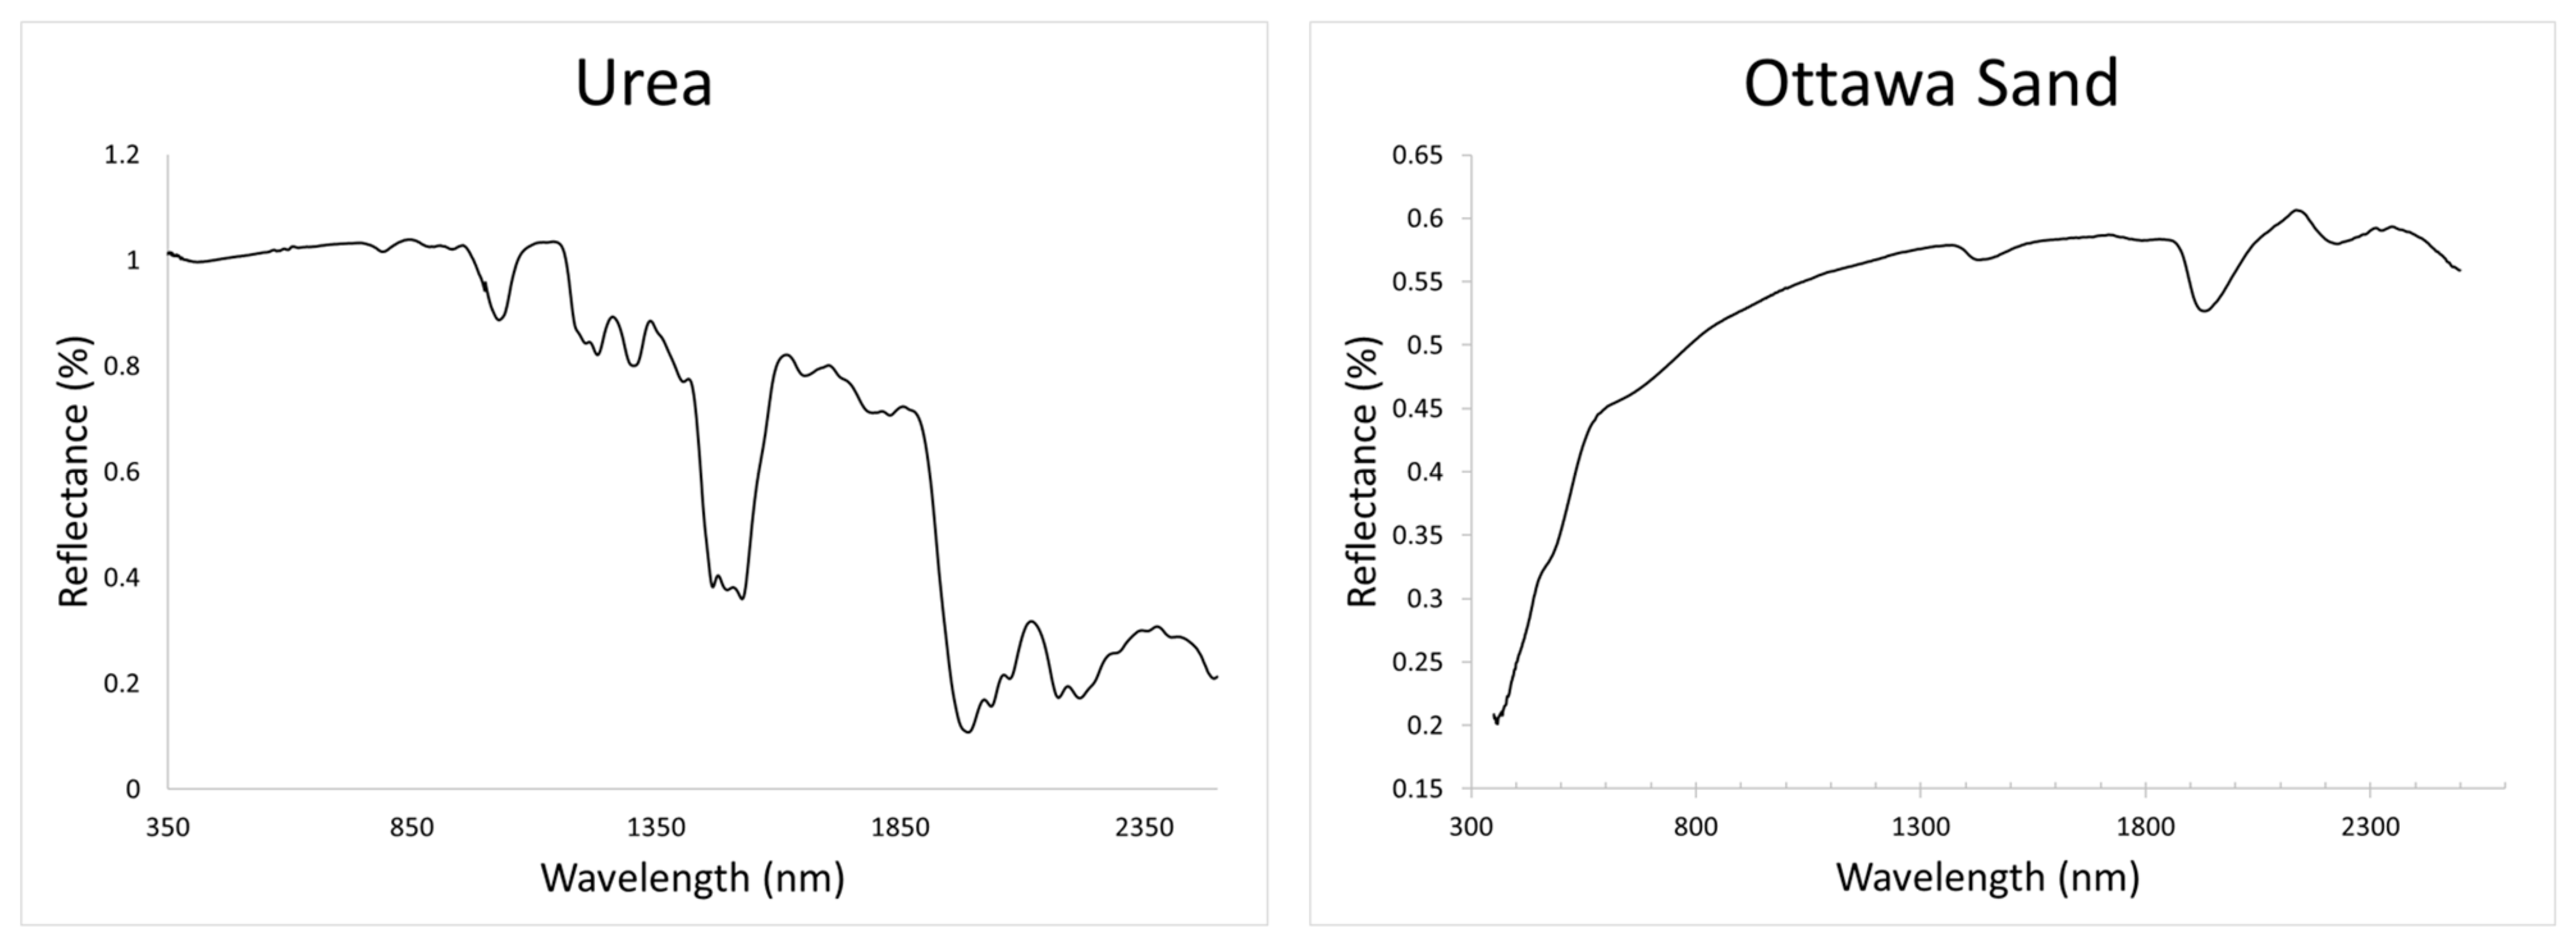
Substrate characteristics are shown in Figure 2 and Figure 3 with spectral features shown in Figure 4. The Ottawa sand is primarily composed of very well-rounded quartz grains with trace amounts of K, Fe, and Fe-oxide inclusions. Inclusions are primarily fluid inclusions, Fe-oxide minerals, and likely minor K-feldspar or mica based on minor K in EDS data. The sand is very well sorted, and the average diameter of sand grains is between 500 and 800 µm (See Supplementary Materials Table S3 for grain size data). Grains are well-rounded and smooth but show minor pitting on surfaces, as shown in the SEM images (Figure 3). The sand has a comparatively uniform reflective spectra among multiple sand samples analyzed and has a high reflective topology in the NIR and SWIR regions, with a pronounced ramp in the visible region and lower wavelength NIR region. Its more pronounced adsorption features are beyond 1300 nm. See Section 3.5 for bond assignments.

4.2. Urea Experiments

Endmember urea characteristics of the reflective spectrum are shown in Figure 4. See Section 3.5 for bond assignments. With an initial high reflective value, the more pronounced adsorption features occur beyond 800 nm. The reflective spectra of varying amounts of urea powder on sand are shown in Figure 5. At 3.2 wt.% urea, features start to become evident in the spectra and this is ascribed as the detection limit for powdered or dry urea on Ottawa sand. These features are beyond 1350 nm; however, at increasing concentrations of 4.91 wt.% urea and 5.67 wt.% urea, more features are evident or prominent. Many urea features are observable at 5.67%.
The reflective spectra of varying amounts of 1.0 M urea solution on sand after selected periods of time are shown in Figure 6. After 1 week of evaporation under lab conditions, urea features start to become evident in the spectra of the 9.65 wt.% 1.0 M solution. These features are beyond 1350 nm. In the following samples with 13.71 wt.% solution and 16.70 wt.% solution, the features of the urea spectrum become more pronounced and evident. After 1 month of the solution drying, urea features remain evident in the spectra of amounts of 9.65 wt.% solution and higher, and more features become evident.

5. Discussion

5.1. Selection of Materials

The Ottawa sand is an ideal substrate for such proof-of-concept investigations because it has a comparatively uniform mineralogy that is dominated by quartz with grains that are well rounded. The Ottawa sand has a narrow and well-defined grain size distribution. These traits promote uniform light scattering by preventing mineral separations in samples that may arise from density differences or grain size variation. Notably, however, Ottawa sands are not characterized in detail in many investigations owing to the recognized or presumed uniformity. Our supporting analytical work, including SEM and light microscopy work on the Ottawa sand used, combined with the repeated reflective spectra data, serves as important data for better interpreting combination experiments not only in this study but also serve as important comparisons for other environmental and forensically important substrates, such as other sands, building materials, and soils.
Numerous components exist in urine; however, urea was selected as an analog material as it is a common and abundant component, and the distinct N-H spectral features enable reasonable promise for detection. Urea is functionally non-hazardous, whereas ammonia would emit noxious vapors, and it is expected that there would be more progressive mass loss and variability owing to vaporization of NH3. The direct use of human urine for a proof-of-concept study would be too variable given the wide range of chemical compositions. Furthermore, human subject, biohazard safety issues, and extensive urine characterization would need to be addressed and are cost prohibitive for the current proof-of-concept investigation. Synthetic urine solutions were considered; however, these appeared to have a strong synthetic dye in the options available and were also considered hazardous materials and were deemed not appropriate for this proof-of-concept study. Ingredients observed in the available options would lead to ambiguous interpretation of spectroscopy results.

5.2. Comments Regarding the Ottawa Sand

Features observed in the spectra of Ottawa sand are consistent with petrography and scanning electron microscopy data. Small inclusions of iron oxides are evident in SEM, and there are numerous similar opaque inclusions observable throughout the quartz grains in PLM, which are interpreted to produce the inflections at ~470 nm and ~660 nm. The features at ~1420 nm, ~1930 nm, and 2230 nm that are attributed to water and OH are interpreted to arise from the many evident fluid inclusions and likely altered felsic composition glass inclusions observed in PLM in quartz grains. The ~2300 nm features attributed to Al-OH are also interpreted to arise from glass inclusions. Noted also is the potential for some minor contribution of the inflections at ~470 nm and ~660 nm to be from Fe3+ content in the glass inclusions. Variation in the spectra of Ottawa sand may be attributed to minor differences in the abundance of Fe-oxides, altered glass, and fluid inclusions. The grain size of the Ottawa sand used is comparatively uniform and likely has a negligible effect on minor variations.

5.3. Comments Regarding the Urea Experiments

The reflective spectra of urea is distinct. Although not all features in the urea spectra can be assigned to specific bonds, there are several features that have assigned bonds. The topology of the spectra of urea obtained for this study is largely consistent with that of NIST [62]. There are several small features that may be useful for HRS/IS, and the shape of the doublet/triplet feature observed between 1420 nm and 1520 nm is a very distinctive major feature of the spectra. Issues may arise in outdoor HRS/IS investigations in this region owing to atmospheric absorption or interference ranges of ~1300 nm to 1500 nm and 1800 nm to 1950 nm, particularly at high humidity levels and at pronounced sensor to target distances. However, the features observed for urea at ~1160 nm, ~1990 nm, ~2030 nm, ~2070 nm, ~2180 nm, and ~2300 nm likely would be potentially exploitable for urea detection in outdoor settings.
Notably, there appeared to be no detectable modification or change in the form of urea over time in either the powdered experiments or the solution experiments. The sand was not sterilized in the lab and there was also no organic matter content. By simple observation, there was no odor, there was no ammonia that evolved, no visible color change in solution or substrate, nor was there any incongruent crystal form or coating as solutions aged or evaporated. These results are interpreted to reflect minimal microbial influence; however, the role microbial interactions would play in the detection and evolution of urea should also be further explored.

5.4. Implications for Supporting HRS/IS Approaches for Locating Persons

HRS/IS is increasingly of interest in forensic investigations [17,18,19,20,21,22,23,24,25,26,27,28,29,30,31,63]. Also, HRS/IS has been considered and used broadly in search and rescue and finding persons [16,64,65,66]. Key to improving these applications is improving spectral libraries. This investigation successfully characterized urea and establishes urea as a material of interest for reflective spectroscopy and HRS/IS forensic investigations on a wide range of spatial scales, from specific areas in a crime scene on the order of centimeter scale to large outdoor regions > 1 km2 that can be investigated by UAVs or other platforms.
As urea has a distinct reflective spectrum, it potentially serves as an analog for evaluating urine in HRS/IS images. In sufficient concentrations observed in the spectra here (e.g., >3.2 Wt.%), urea may be detected using HRS/IS images. Detection of urea in outdoor settings may be of use in numerous scenarios and environments involving forensics. This may include simple scenarios, such as looking for lost or missing hikers along park trails and adjacent environments. Other settings may include trails or areas that are actively or passively used for human trafficking, where resting spots may be used repeatedly, accumulating urine over time. The data on urea may be useful for more accurately interpreting HRS/IS images of other human trafficking sites, such as shipping containers, basements, rooms, or buildings. Specifically, there may be potential to identify hostage locations given the context of repeated waste expulsion, or specific marker items associated with human waste. Additional settings of potential use are monitoring the status of waste in refugee camps or mass human migrations.
The intersection of geoscience, emergency management, and defense science continues to expand through HRS/IS approaches. The evolving intersection with hyperspectral remote sensing, geoscience, emergency management, and defense science has created potential for applications, including finding missing persons or potentially hostages in remote locations [16]. Data on urea from this investigation may enhance such applications.
Results of this investigation have implications broader than those of forensic investigations alone. Results of this study may provide useful data for HRS/IS investigations of accidental release of urea or waste that is rich in urea. For example, the application or overapplication of urea fertilizer or chemicals is a well-recognized environmental problem [67,68,69]. Data from this investigation also may be useful for monitoring sewage release or system failure. HRS/IS investigations of sewage are recognized as an area of evolving interest [70]. Thus, the results of this investigation may have broad implications for environmental forensic investigations and environmental monitoring.

5.5. Future Directions

The results of this study provide a clear trajectory for future efforts, which would progressively involve investigations of more complex analogs. More complex analogs should be investigated first, including proteins, glucose, and several relevant pharmaceuticals. Doing so would enable more meaningful interpretations of future work involving human urine. Additionally, a wider range of substrates should be investigated, and a well-characterized suite of soil and geologic materials is available for study [16]. Investigation of environmental variables such as substrate water content, temperature, and general microbial activity is warranted. Ideally, a suite of natural human urine samples that are representative (e.g., sex, age, weight, race, common medical conditions, e.g., type 2 diabetes) of the population should then be investigated. Open questions exist regarding the impact and potential detection of pharmaceutical metabolites in urine as well and should be explored. Chronological relationships, mass relationships, and environmental relationships should be explored. Although uncertainties exist, there is promise for reflective spectroscopy and HRS/IS investigations of human urine in numerous contexts that may enable search and rescue of persons, accountability of crimes at multiple scales, and environmental monitoring.

6. Conclusions

Reflective spectroscopic results on endmember sand and urea of this investigation establish new and important detailed context for future spectroscopic and HRS/IS studies of urea and human urine in the context of forensic investigations. Initial constraints for detection of urea in solid form (3.2 wt.%) and in solution (9.65 wt.% 1 M solution, after 1 week under lab conditions) are established. These results are significant in that they prove that urea can be detected on a uniform geologic substrate. Results of this investigation also provide a foundation and basis for more detailed studies using a variety of human urine compositions, ages, and quantities on a variety of geologic (soil, sand, rock) substrates. Detailed reflective spectroscopy and HRS/IS studies involving human urine may provide new forensic tools at a variety of scales for crime scene investigations.

Supplementary Materials

The following supporting information can be downloaded at: https://www.mdpi.com/article/10.3390/forensicsci4030030/s1, Table S1: Sample weight data; Table S2: Sample spectral data; Table S3: Gradistat data.

Author Contributions

L.M. co-developed the concept of the paper with M.P.S.K., planned experiments, prepared sample dishes, collected sample dish weights, acquired extensive spectroscopy data, created spectroscopy figures, wrote portions of the manuscript throughout, edited the manuscript and compiled and revised the reference list. E.B. and E.K. assisted with grain size analysis, weighing samples, and acquiring spectra at the direction of L.M. A.S. assisted with acquiring spectra at the direction of L.M. J.C. assisted with acquiring and interpreting light microscopy data and editing the manuscript. M.P.S.K. supervised the project, co-developed the idea generation with L.M., supervised data collection, collected SEM data, wrote portions of the manuscript throughout, edited the manuscript and provided resources. All authors have read and agreed to the published version of the manuscript.

Funding

This research was funded by a 2024 Miami University Honors College Peer Mentor Fellowship Award to L.M. A.S. was supported in part by a Miami University Undergraduate Summer Scholars award during this project. Spectroradiometry equipment used for this project was acquired through NIJ Forensic Science R&D award 2015-DN-BX-K011 to M.P.S.K. This project was partially supported by the Mineralogy and Petrology Career Development Fund, managed by M.P.S.K.

Institutional Review Board Statement

Not applicable.

Informed Consent Statement

Not applicable.

Data Availability Statement

Data are available in the Supplementary Materials and will be provided on request.

Acknowledgments

We thank the Department of Geology and Environmental Earth Sciences for the space and facilities to carry out this project. We thank Matt Duley of Miami University’s Center for Advanced Microscopy and Imaging (CAMI) for general facility assistance.

Conflicts of Interest

The authors declare no conflicts of interest.

References

  1. Allen, C.S.; Krekeler, M.P.S. Crude oil, petroleum and water discrimination on terrestrial substrates with airborne imaging spectroscopy. In Active and Passive Signatures, Proceedings of the SPIE Defense, Security, and Sensing, Orlando, FL, USA, 11–29 April 2011; International Society for Optics and Photonics: San Diego, CA, USA, 2011; Volume 8040. [Google Scholar] [CrossRef]
  2. Aumann, H.H.; Gregorich, D.; Gaiser, S. AIRS hyper-spectral measurements for climate research: Carbon dioxide and nitrous oxide effects. Geophys. Res. 2011, 32, L05806. [Google Scholar] [CrossRef]
  3. Cracknell, M.J.; Reading, A.M. Geological mapping using remote sensing data: A comparison of five machine learning algorithms, their response to variations in the spatial distribution of training data and the use of explicit spatial information. Comput. Geosci. 2014, 63, 22–33. [Google Scholar] [CrossRef]
  4. Crouvi, O.; Ben-Dor, E.; Beyth, M.; Avigad, D.; Amit, R. Quantitative mapping of arid alluvial fan surfaces using field spectrometer and hyperspectral remote sensing. Remote Sens. Environ. 2016, 104, 103–117. [Google Scholar] [CrossRef]
  5. Hörig, B.; Kühn, F.; Oschütz, F.; Lehmann, F. HyMap hyperspectral remote sensing to detect hydrocarbons. Int. J. Remote Sens. 2001, 22, 1413–1422. [Google Scholar] [CrossRef]
  6. Krekeler, M.P.S.; Allen, C.S. Remote sensing spectra of cesium chloride provide a potential emergency management tool for response to a radiological dispersal device detonation. J. Emerg. Manag. 2008, 6, 60–64. [Google Scholar] [CrossRef]
  7. Kruse, F.A.; Boardman, J.A.; Huntington, J.F. Comparison of airborne hyper- spectral data and EO-1 hyperion for mineral mapping. IEEE Trans. Geosci. Remote Sens. 2003, 41, 1388–1400. [Google Scholar] [CrossRef]
  8. Mars, J.C.; Crowley, J.K. Mapping mine wastes and analyzing areas affected by selenium-rich water runoff in southeast Idaho using AVIRIS imagery and digital elevation data. Remote Sens. Environ. 2003, 84, 422–436. [Google Scholar] [CrossRef]
  9. Swayze, G.A.; Smith, K.S.; Clark, R.N.; Sutley, S.J.; Pearson, R.M.; Vance, J.S.; Hageman, P.L.; Briggs, P.H.; Meier, A.L.; Singleton, M.J.; et al. Using imaging spectroscopy to map acidic mine waste. Environ. Sci. Technol. 2000, 34, 47–54. [Google Scholar] [CrossRef]
  10. Ustin, S.L.; Valko, P.G.; Kefauver, S.C.; Santos, M.J.; Zimpfer, J.F.; Smith, S.D. Remote sensing of biological soil crust under simulated climate change manipulations in the Mojave Desert. Remote Sens. Environ. 2009, 113, 317–328. [Google Scholar] [CrossRef]
  11. Valdovinos, M.; Specht, J.; Zeunik, J. Community Policing & Unmanned Aircraft Systems (UAS) Guidelines to Enhance Community Trust. 2016. Available online: https://portal.cops.usdoj.gov/resourcecenter/RIC/Publications/cops-w0822-pub.pdf (accessed on 1 July 2024).
  12. Karaca, Y.; Cicek, M.; Tatli, O.; Sahin, A.; Pasli, S.; Beser, M.F.; Turedi, S. The potential use of unmanned aircraft systems (drones) in mountain search and rescue operations. Am. J. Emerg. Med. 2018, 36, 583–588. [Google Scholar] [CrossRef]
  13. Eyerman, J.; Crispino, G.; Zamarro, A.; Durscher, R. Drone Efficacy Study (DES): Evaluating the Impact of Drones for Locating Lost Persons in Search and Rescue Events; DJI and European Emergency Number Association: Brussels, Belgium, 2018; Available online: https://unode1.s3.amazonaws.com/assets/6946/VA4uymUuQYaFmDMt9jLA_Durscher_Romeo_08222019_v1Handout_5.pdf (accessed on 1 July 2024).
  14. Goda, N.; Soules, J. Testing AI-Enabled Drones for Search and Rescue. 2024. Available online: https://www.colorado.edu/today/2024/06/14/testing-ai-enabled-drones-search-and-rescue (accessed on 1 July 2024).
  15. O’Donnell, J. AI-Directed Drones Could Help Find Lost Hikers Faster. 2024. Available online: https://www.technologyreview.com/2024/05/30/1092988/ai-directed-drones-could-help-find-lost-hikers-faster/ (accessed on 1 July 2024).
  16. Krekeler, M.P.S.; Burke, M.; Allen, S.; Sather, B.; Chappell, C.; McLeod, C.L.; Loertscher, C.; Loertscher, S.; Dawson, C.; Brum, J.; et al. A novel hyperspectral remote sensing tool for detecting and analyzing human materials in the environment: A geoenvironmental approach to aid in emergency response. Environ. Earth Sci. 2023, 82, 109. [Google Scholar] [CrossRef]
  17. Lim, H.T.; Murukeshan, V.M. Hyperspectral imaging of polymer banknotes for building and analysis of spectral libraries. Opt. Las. Eng. 2017, 98, 168–175. [Google Scholar] [CrossRef]
  18. Silva, C.S.; Pimentel, M.F.; Amigo, J.M.; Honorato, R.S.; Pasquini, C. Detecting semen stains on fabrics using near infrared hyperspectral images and multivariate models. TRAC-Trend. Anal. Chem. 2017, 95, 23–35. [Google Scholar] [CrossRef]
  19. Cadd, S.; Li, B.; Beveridge, P.; O’Hare, W.T.; Islam, M. Age determination of blood stained fingerprints using visible wavelength reflectance hyperspectral imaging. J. Imaging 2018, 4, 141. [Google Scholar] [CrossRef]
  20. De Carvalho, M.A.; Talhavini, M.; Pimentel, M.F.; Amigo, J.M.; Pasquini, C.; Alves, S.; Weber, I.T. NIR hyperspectral images for identification of gunshot residue from tagged ammunition. Anal. Methods UK 2018, 10, 4711–4717. [Google Scholar] [CrossRef]
  21. Edelman, G.J.; Aalders, M.C. Photogrammetry using visible, infrared, hyper- spectral and thermal imaging of crime scenes. Forensic Sci. Int. 2019, 292, 181–189. [Google Scholar] [CrossRef]
  22. Glomb, P.; Romaszewski, M.; Cholewa, M.; Domino, K. Application of hyper- spectral imaging and machine learning methods for the detection of gunshot residue patterns. Forensic Sci. Int. 2018, 290, 227–237. [Google Scholar] [CrossRef]
  23. Khan, M.J.; Khan, H.S.; Yousaf, A.; Khurshid, K.; Abbas, A. Modern trends in hyperspectral image analysis: A review. IEEE Access 2018, 6, 14118–14129. [Google Scholar] [CrossRef]
  24. Murray, B.; Anderson, D.T.; Wescott, D.J.; Moorhead, R.; Anderson, M.F. Survey and Insights into unmanned aerial-vehicle-based detection and documentation of clandestine graves and human remains. Hum. Biol. 2018, 90, 45–61. [Google Scholar] [CrossRef]
  25. Brito, L.R.E.; Braz, A.; Honorato, R.S.; Pimentel, M.F.; Pasquini, C. Evaluating the potential of near infrared hyperspectral imaging associated with multivariate data analysis for examining crossing ink lines. Forensic Sci. Int. 2019, 298, 169–176. [Google Scholar] [CrossRef]
  26. Xu, J.Y.; Fang, S.B.; Zhou, J. Application of hyperspectral imaging and mass spectrometry imaging technique to fingerprinting visualization and trace analysis. Acta Phys. Sin. 2019, 68, 068701. [Google Scholar] [CrossRef]
  27. Qureshi, R.; Uzair, M.; Khurdid, K.; Yan, H. Hyperspectral document image processing: Applications, challenges and future prospects. Pattern Recogn. 2019, 90, 12–22. [Google Scholar] [CrossRef]
  28. Książek, K.; Romaszewski, M.; Głomb, P.; Grabowski, B.; Cholewa, M. Blood stain classification with hyperspectral imaging and deep neural networks. Sensors 2020, 20, 6666. [Google Scholar] [CrossRef]
  29. Devassy, B.M.; George, S. Dimensionality reduction and visualization of hyperspectral ink data using t-SNE. Forensic Sci. Int. 2020, 311, 110194. [Google Scholar] [CrossRef]
  30. Devassy, B.M.; George, S.; Nussbaum, P. Unsupervised Clustering of Hyperspectral Paper Data Using t-SNE. J. Imaging 2020, 6, 29. [Google Scholar] [CrossRef] [PubMed]
  31. Devassy, B.M.; George, S. Forensic analysis of beverage stains using hyperspectral imaging. Sci Rep. 2021, 11, 6512. [Google Scholar] [CrossRef]
  32. Blott, S.J.; Pye, K. GRADISTAT: A grain size distribution and statistics package for the analysis of unconsolidated sediments. Earth Surf. Process. Landf. 2021, 26, 1237–1248. [Google Scholar] [CrossRef]
  33. Nesse, W. Introduction to Optical Mineralogy; Oxford University Press: Oxford, UK, 2013. [Google Scholar]
  34. Allen, A.; McLeod, C.L.; Velázquez Santana, L.; Zimmerer, M.; Lytle, M.L.; Krekeler, E.; Amick, W.; Tegge, J.; Ventura-Valentín, W.; Vest, J.; et al. Mineralogy and Geochemistry of Sands from Playa las Golondrinas, Puerto Rico: Establishing a Regional Geogenic Background. Environ. Ear. Sci. 2024; minor revisions submitted. [Google Scholar]
  35. Allen, A.; Dietrich, M.; McLeod, C.L.; Gillis, M.; Gokey, K.; Fouh, M.; Krekeler, M.P.S. Investigating mercury in road sediment in Michigan City, Indiana: A new type of environmental pollution record. Environ. Adv. 2024, 15, 100483. [Google Scholar] [CrossRef]
  36. Wudke, H.; Brown, K.; Murchland, M.; Gillis, M.; Gokey, K.; Bank, J.; Lytle, M.; McLeod, C.L.; Krekeler, M.P.S. Mineralogical and geochemical characterization of Johnson’s baby powder from 1985: Evidence of contamination. Appl. Clay Sci. 2024, 250, 107252. [Google Scholar] [CrossRef]
  37. Flett, L.; McLeod, C.L.; McCarty, J.L.; Shaulis, B.J.; Fain, J.J.; Krekeler, M.P.S. Monitoring uranium mine pollution on Native American lands: Insights from tree bark particulate matter on the Spokane Reservation, Washington, USA. Environ. Res. 2021, 194, 110619. [Google Scholar] [CrossRef]
  38. O’Shea, M.J.; Krekeler, M.P.; Vann, D.R.; Gieré, R. Investigation of Pb-contaminated soil and road dust in a polluted area of Philadelphia. Environ. Monit. Assess. 2021, 193, 440. [Google Scholar] [CrossRef] [PubMed]
  39. Cymes, B.A.; Almquist, C.B.; Krekeler, M.P.S. Europium-doped cryptomelane: Multi-pathway synthesis, characterization, and evaluation for the gas phase catalytic oxidation of ethanol. Appl. Catal. A Gen. 2020, 589, 117310. [Google Scholar] [CrossRef]
  40. Klein, E.; Krekeler, M.P.S. The occurrence of Hg, Se, S, Ni, Cr, and Th in Talc Ore: A scanning electron microscopy (SEM) study of historical samples from the Willow Creek Mine, Montana. Results Geochem. 2020, 1, 100003. [Google Scholar] [CrossRef]
  41. Oglesbee, T.; McLeod, C.; Chappell, C.; Vest, J.; Sturmer, D.; Krekeler, M.P.S. A Mineralogical and Geochemical Investigation of Modern Aeolian Sands near Tonopah, Nevada: Sources and Environmental Implications. Catena 2020, 194, 104640. [Google Scholar] [CrossRef]
  42. Velázquez Santana, L.V.; McLeod, C.L.; Blakemore, D.; Shaulis, B.; Hill, T. Bolivian hornblendite cumulates: Insights into the depths of Central Andean arc magmatic systems. Lithos 2020, 370, 105618. [Google Scholar] [CrossRef]
  43. Dietrich, M.; Wolfe, A.; Burke, M.; Krekeler, M.P.S. The first pollution investigation of road sediment in Gary, Indiana: Anthropogenic metals and possible health implications for a socioeconomically disadvantaged area. Environ. Intern. 2019, 128, 175–192. [Google Scholar] [CrossRef]
  44. Dietrich, M.; Huling, J.; Krekeler, M.P.S. Metal pollution investigation of Goldman Park, Middletown Ohio: Evidence for steel and coal pollution in a high child use setting. Sci. Tot. Environ. 2018, 618, 1350–1362. [Google Scholar] [CrossRef]
  45. Burke, M.; Rakovan, J.; Krekeler, M.P.S. A study by electron microscopy of gold and associated minerals from Round Mountain, Nevada. Ore Geol. Rev. 2017, 91, 708–717. [Google Scholar] [CrossRef]
  46. Paul, K.C.; Silverstein, J.; Krekeler, M.P.S. New insights into rare earth element (REE) particulate generated by cigarette lighters: An electron microscopy and materials science investigation of a poorly understood indoor air pollutant and constraints for urban geochemistry. Environ. Earth Sci. 2017, 76, 369. [Google Scholar] [CrossRef]
  47. Curtis, J.; Stitle, L.; Certain, J.; Murchland, M.; Piszel, C.; Vest, J.; McLeod, C.L.; Krekeler, M.P.S. A reflective spectroscopy and mineralogical investigation of cosmetic blush (Wet’N’Wild) potentially for forensic investigations related to interpersonal violence—An experimental feasibility study. Forensic Sci. 2023, 3, 544–559. [Google Scholar] [CrossRef]
  48. Barnes, M.; McLeod, C.; Faraci, O.; Chappell, C.; Krekeler, M.P.S. Characterizing the geogenic background of the Midwest: A detailed mineralogical and geochemical investigation of a glacial till in southwestern Ohio. Environ. Earth Sci. 2011, 79, 159. [Google Scholar] [CrossRef]
  49. Brum, J.; Schlegel, C.; Chappell, C.; Burke, M.; Krekeler, M.P.S. Reflective spectra of gasoline, diesel and jet fuel ion sand substrates under ambient and cold conditions: Implications for detection using hyperspectral remote sensing and development of age estimation models. Environ. Earth Sci. 2020, 79, 463. [Google Scholar] [CrossRef]
  50. Burke, M.; Dawson, C.; Allen, C.S.; Brum, J.; Roberts, J.; Krekeler, M.P.S. Reflective spectroscopy investigations of clothing items to support law enforcement, search and rescue, and war crime investigations. Forensic Sci. Int. 2019, 304, 109945. [Google Scholar] [CrossRef] [PubMed]
  51. Allen, C.S.; Krekeler, M.P.S. Reflectance spectra of crude oils and refined petroleum products on a variety of common substrates. In Active and Passive Signatures; Charmaine, G., Chadwick, H., Eds.; SPIE: Bellingham, WA, USA, 2010; Volume 7687, p. 76870L. [Google Scholar] [CrossRef]
  52. Curran, P.J.; Dungan, J.L.; Gholz, H.L. Exploring the relationship between reflectance red edge and chlorophyll content in slash pine. Tree Physiol. 1990, 7, 33–48. [Google Scholar] [CrossRef]
  53. Cloutis, E.A. Spectral reflectance properties of hydrocarbons: Remote-sensing implications. Science 1989, 245, 65–168. [Google Scholar] [CrossRef]
  54. Hunt, G. Spectral signatures of particulate minerals in the visible and near infrared. Geophysics 1977, 42, 501–513. [Google Scholar] [CrossRef]
  55. Hunt, G.R.; Salisbury, J.W.; Lenhoff, C.J. Visible and near-infrared spectra of minerals and rocks VI: Additional silicates. Mod. Geol. 1973, 4, 85–106. [Google Scholar]
  56. Hunt, G.R.; Logan, L.M. Variation of Single Particle Mid-Infrared Emission Spectrum with Particle Size. Appl. Opt. 1972, 11, 142–147. Available online: https://opg.optica.org/ao/abstract.cfm?uri=ao-11-1-142 (accessed on 1 July 2024). [CrossRef]
  57. Hunt, G.R.; Salisbury, J.W.; Lenhoff, C.J. Visible and near-infrared spectra of minerals and rocks III: Oxides and hydroxides. Mod. Geol. 1971, 2, 195–205. [Google Scholar]
  58. Hunt, G.R.; Salisbury, J.W.; Lenhoff, C.J. Visible and near-infrared spectra of minerals and rocks IV: Sulphides and sulphates. Mod. Geol. 1971, 3, 1–14. [Google Scholar]
  59. Ramasahayam, S.; Chowdhury, S.R. Non invasive estimation of blood urea concentration using near infrared spectroscopy. Int. J. Smart Sens. Intell. Syst. 2016, 9, 449–467. [Google Scholar] [CrossRef]
  60. Piasek, Z.; Urbanski, T. The infra-red absorption spectrum and structure of urea. B Pol. Acad. Sci.-Tech. X 1962, 21, 113–120. [Google Scholar] [CrossRef]
  61. Fischer, P.H.H.; McDowell, C.A. The infrared absorption spectra of urea–hydrocarbon adducts. Can. J. Chem. 1960, 38, 187–193. [Google Scholar] [CrossRef]
  62. Johnson, T.J.; Myers, T.L.; Su, Y.-F.; Tonkyn, R.G.; Kelly-Gorham, M.R.K.; Danby, T.O. “IARPA/PNNL Solid Phase IR Spectra” in NIST Chemistry WebBook, NIST Standard Reference Database Number 69; Linstrom, P.J., Mallard, W.G., Eds.; National Institute of Standards and Technology: Gaithersburg, MD, USA, 2024; Volume 20899. [CrossRef]
  63. Beales, E. Hyperspectral Analysis of Selected Fabrics Submerged in the Indian Ocean: An Innovative Way to Aid in the Estimation of the Time Human Remains Have Spent in Water. Ph.D. Thesis, Murdoch University, Perth, Australia, 2020. [Google Scholar]
  64. Olejnik, M.K. Opportunities of adapting spectral imagery in rescue services of the national fire and rescue system. Sci. Rep. Fire Univ. 2023, 87, 325–343. [Google Scholar] [CrossRef]
  65. Proft, J.; Suarez, J.; Murphy, R. Spectral anomaly detection with machine learning for wilderness search and rescue. In Proceedings of the IEEE MIT Undergraduate Research Technology Conference (URTC), Cambridge, MA, USA, 7–8 November 2015; pp. 1–3. [Google Scholar] [CrossRef]
  66. Eismann, M.T.; Stocker, A.D.; Nasrabadi, N.M. Automated hyperspectral cueing for civilian search and rescue. Proc. IEEE 2009, 97, 1031–1055. [Google Scholar] [CrossRef]
  67. Weerakoon, D.; Bansal, B.; Padhye, L.P.; Rachmani, A.; Wright, L.J.; Roberts, G.S.; Baroutian, S. A critical review on current urea removal technologies from water: An approach for pollution prevention and resource recovery. Sep. Purif. Technol. 2023, 314, 123652. [Google Scholar] [CrossRef]
  68. Ibrahim, K.A.; Naz, M.Y.; Shukrullah, S.; Sulaiman, S.A.; Ghaffar, A.; AbdEl-Salam, N.M. Controlling nitrogen pollution via encapsulation of urea fertilizer in cross-linked corn starch. BioResources 2019, 14, 7775–7789. [Google Scholar] [CrossRef]
  69. Finlay, K.; Patoine, A.; Donald, D.B.; Bogard, M.J.; Leavitt, P.R. Experimental evidence that pollution with urea can degrade water quality in phosphorus-rich lakes of the Northern Great Plains. Limnol. Oceanogr. 2010, 55, 1213–1230. [Google Scholar] [CrossRef]
  70. Lechevallier, P.; Villez, K.; Felsheim, C.; Rieckermann, J. Towards non-contact pollution monitoring in sewers with hyperspectral imaging. Environ. Sci. Water Res. Technol. 2024, 10, 1160–1170. [Google Scholar] [CrossRef]
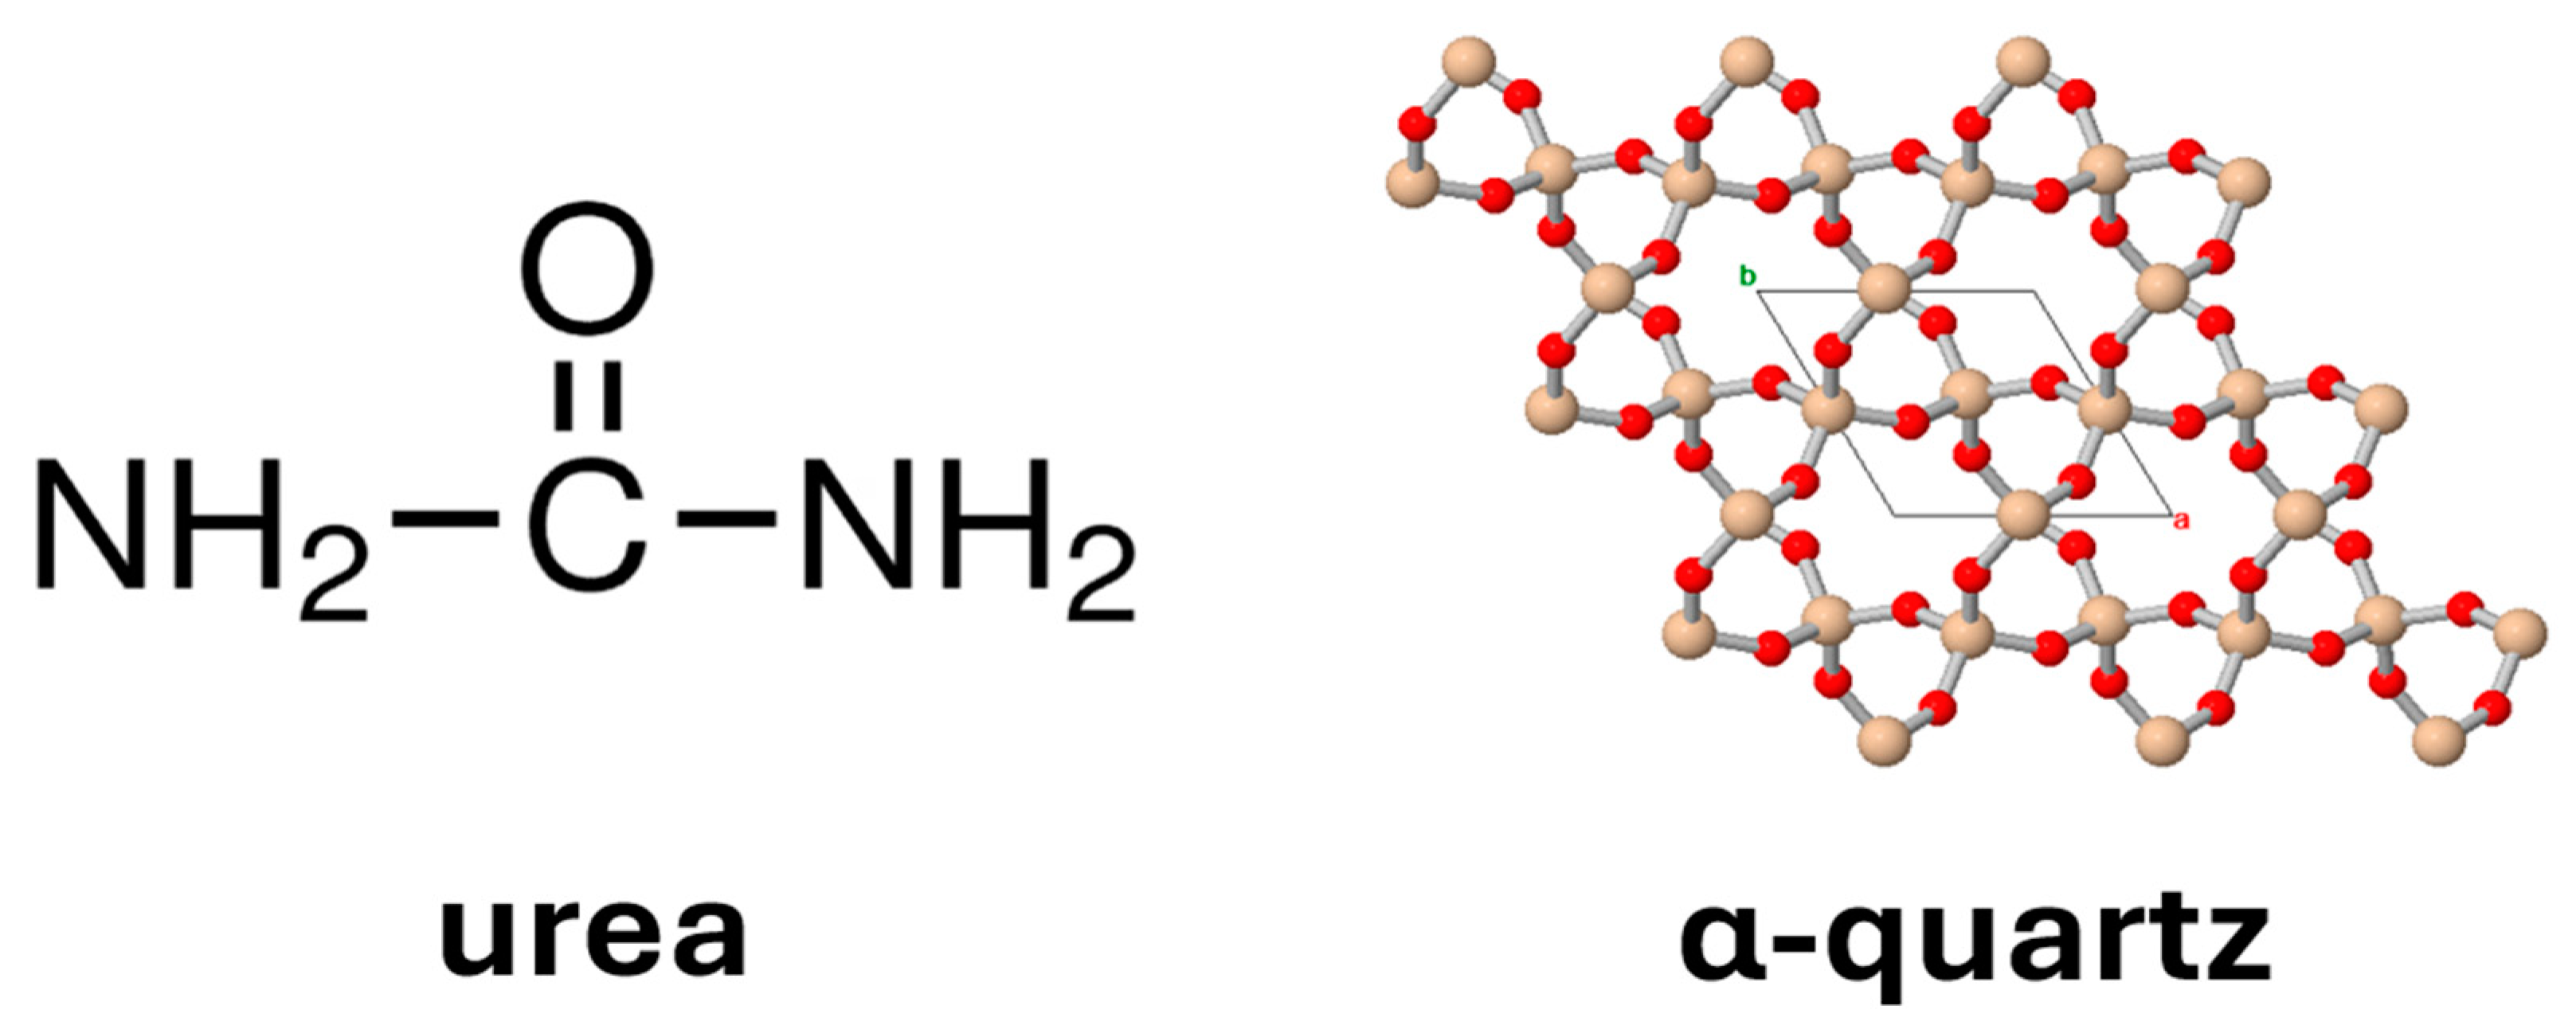
Figure 1. Images showing the structure of the materials of interest. Urea is a carbonyl group with two C-bound amine groups (left). The crystal structure of quartz projected along the c-axis is shown (right).
Forensicsci 04 00030 g001
Figure 2. The top row shows PPL images of the Ottawa sand (A,C), and the bottom row shows XPL images (B,D). Note that every grain is quartz, and there are numerous inclusions of fluid and likely Fe-oxide minerals as shown in (E,F).
Forensicsci 04 00030 g002
Figure 3. SEM images showing Ottawa sand quartz grain morphology with EDS spectra. (A) An example of a well-rounded quartz grain with oxygen and silicon lines in the commensurate EDS spectrum. (B) An example of well-rounded quartz grain showing an iron-oxide inclusion near the grain surface, with oxygen, silicon, minor K and iron lines in the commensurate EDS spectrum. K originates from inclusions below the grain surface, within the volume of inter-action of the beam but not expressed at the surface.
Forensicsci 04 00030 g003
Figure 4. Reflective spectra of the materials used in this study, urea (left) and Ottawa sand (right).
Forensicsci 04 00030 g004
Figure 5. Reflective spectra of urea and sand combinations. Note that features of urea start to become evident in the sample with 3.2% urea.
Forensicsci 04 00030 g005
Figure 6. Reflective spectra of 1.0 M urea solution and sand combinations. Weight percent of 1.0 M solution is displayed on the right side of the graphs. Note that features of urea start to become evident in the third sample on each graph.
Forensicsci 04 00030 g006
Disclaimer/Publisher’s Note: The statements, opinions and data contained in all publications are solely those of the individual author(s) and contributor(s) and not of MDPI and/or the editor(s). MDPI and/or the editor(s) disclaim responsibility for any injury to people or property resulting from any ideas, methods, instructions or products referred to in the content.