1. Introduction
Interface pressure is a key aspect of compression bandage therapy [
1], which depends on the bandage mechanical properties [
2], but also on the patient morphology [
3] and body position [
4]. Bandages can be differentiated with regards to the interface pressure variation from supine to standing position, the so-called Static Stiffness Index [
5], which is commonly used in clinical studies [
6,
7,
8]. From supine to standing position, calf muscles and blood tend to fall down and muscles contract to stabilize the standing position [
9], modifying both the calf geometry and apparent soft tissue mechanical properties.
This study aimed at investigating the possible relationship between interface pressure and calf soft tissue global stiffness. The latter was measured on both legs of 25 patients in sitting and standing position. In addition, pressure applied by six different bandages was measured in supine, sitting, and standing position. The correlation between the variation in soft tissue stiffness and interface pressure was then investigated.
2. Materials and Methods
This protocol was approved by the local Committee for the Protection of Persons (CPP Sud-Est I–2015-34) (NCT 02803398).
2.1. Population
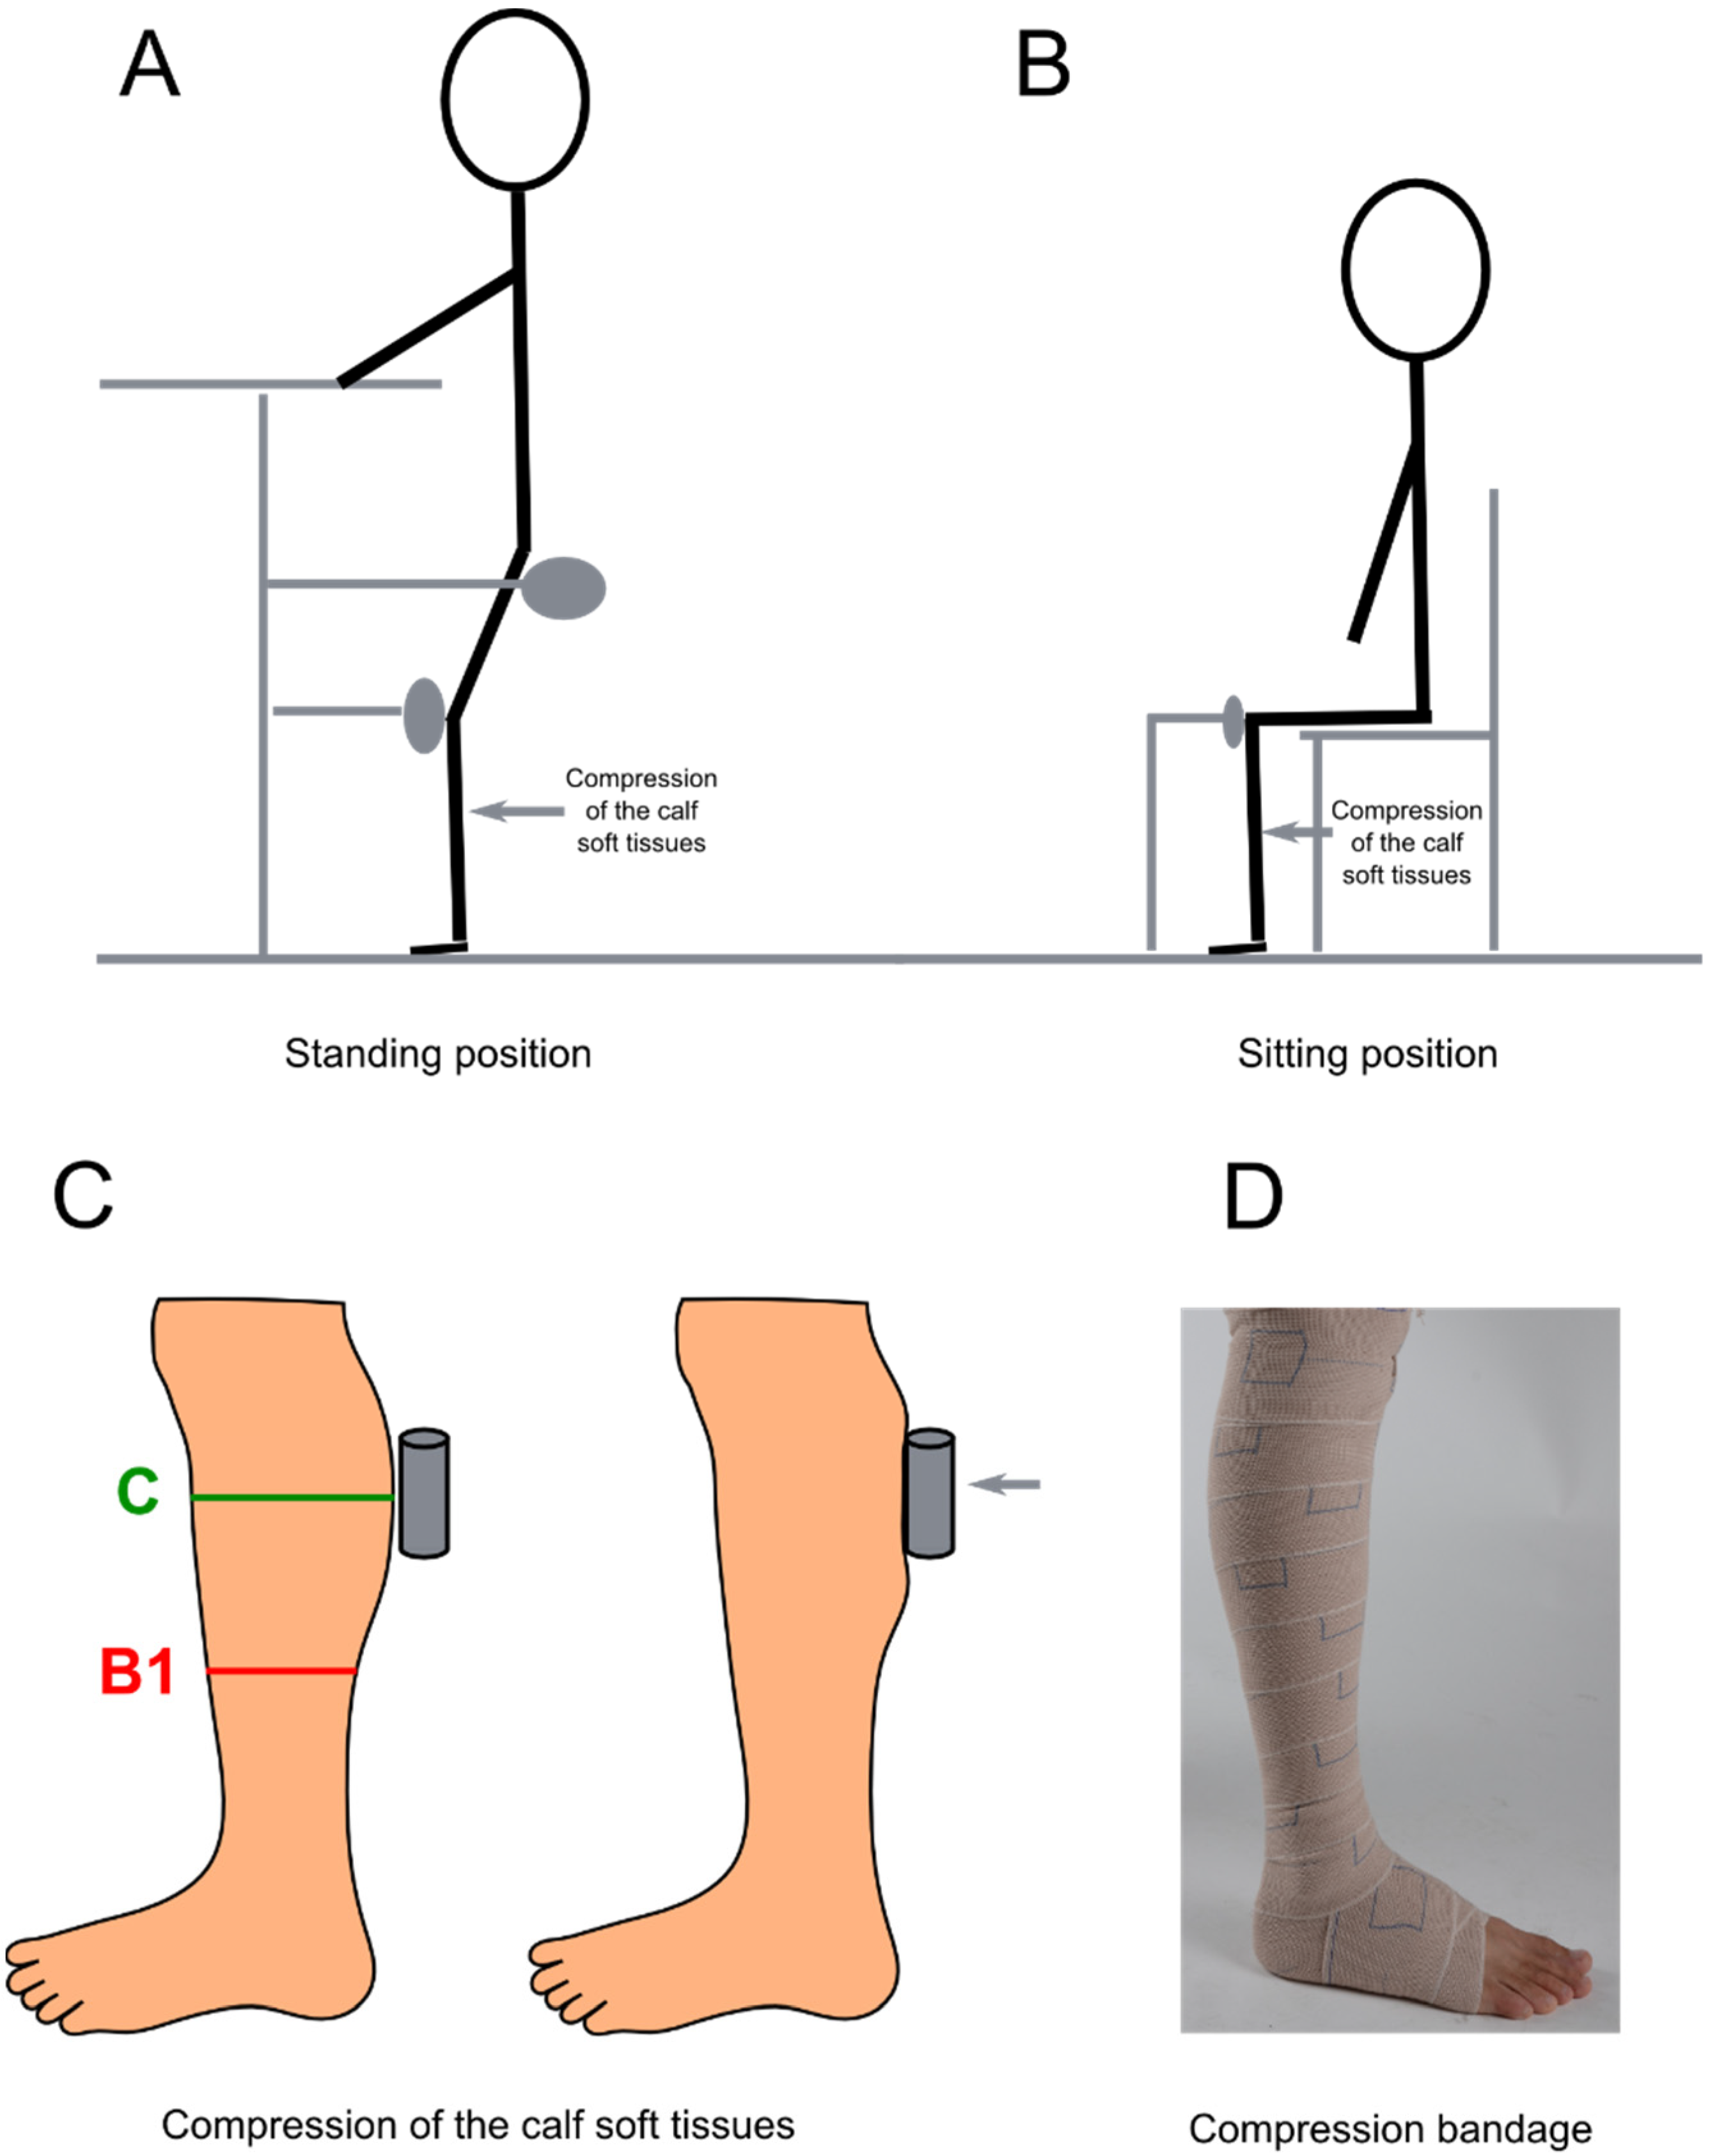
A total of 26 patients were included in the study (16 women and 10 men; mean age = 48-years old (19–72)), with only 25 undergoing measurements. These patients were at risk of venous thrombosis and were hospitalized in the Department of Physical Medicine and Rehabilitation of the University Hospital of Saint-Etienne, France. They were treated with compression therapy (stockings or bandages) and had to be able to stay in a standing frame for at least 10 min (
Figure 1A). Signed informed consent was obtained from each patient before inclusion in the study.
2.2. Compression Bandages
Single component or multi component bandages were composed of elastic (Biflex
® 16, Thuasne, Levallois-Perret, France) and/or inelastic (Rosidal
® K, L & R, Neuwied, Germany) bandages, giving six possible combinations. They were applied on the patients’ leg, in a spiral pattern with a 50% overlapping technique (i.e., a two-layer bandaging technique) following a previously described protocol [
10].
2.3. Characterization of the Lower Leg Soft Tissue Global Stiffness
The methodology implemented for the characterization of the calf soft tissue global stiffness was the combination of experimental compression tests and finite element (FE) model updating [
11].
2.3.1. Compression of the Calf Soft Tissues
Compression of the posterior part of the calf was performed on both legs of 25 patients in a sitting and standing position (
Figure 1A,B). The order in which patients’ legs underwent the tests was randomly determined for each patient. To limit tiredness, the compression test was first performed in standing position and then in sitting position.
The compression device was described in a previous article [
11]. The displacement of a 50 mm long, 30 mm diameter cylinder and the force needed to compress the calf were acquired thanks to displacement and force sensors. The cylinder was placed at the height of measurement point C (where the calf circumference is the largest [
12]) on the posterior face of the calf (
Figure 1C). The depth of compression ((0, 24) mm) was adapted to each patient and their position, so that the compression was not sensitive.
2.3.2. Finite Element Model Updating
A 2D FE model of the compression test was built for every test (i.e., 100 FE models). The leg geometry was obtained from a 3D optical scan (ArtecTM MHT 3D scanner, ArtecTM Group) performed before the compression test (
Figure 2). A section of the scan was taken at the mid plane of the compression cylinder. This scan provided the external leg geometry, the position of the cylinder, and the direction of its translation (
Figure 2). The sections of generic bones geometry, obtained from the Visible Human Server [
13], were scaled and implanted in the leg section. Finally, the leg and cylinder sections were meshed in Abaqus
® with 3-node and 4-node linear plain strain finite elements with hybrid formulation to manage quasi-incompressibility.
As the 3D optical scan only provided the external geometry of the calf, the leg soft tissues were considered as one homogeneous material whose behavior was modeled with a neo-Hookean hyperelastic constitutive law:
with
the first deviatoric strain invariant,
the elastic volume ratio,
the bulk modulus (equal to 88.9 kPa as in the previous study [
14]), and
the global stiffness parameter to be identified.
The inverse identification process was very similar to the one described in a previous study [
8]. An initial value was given to the parameter to identify: the global stiffness
. The simulation of the compression of the calf was run and the force needed to compress the tissue (
) was collected as a function of the displacement of the cylinder (
). As previously described [
8], a correction was applied to the force, to compensate for the underestimation of the reaction forces made with the 2D-plane strain model. The numerical response
was then compared to the experimental response
via a cost function (
,
being the maximum displacement of the cylinder obtained in the experiments). Using an optimization function, the value of the global stiffness was modified, and the simulation was re-run. The process was repeated until the difference between the numerical and experimental responses (i.e., the cost function
) was lower than the acceptation threshold (
). The value of the global stiffness used for the last simulation was considered as the identified value.
2.4. Interface Pressure Measurements
After the compression test, interface pressure applied by the six different bandages (
Figure 1D) was measured for both legs with pressure sensors Picopress
® (Microlab Elettronica, Ponte S. Nicolo, Italy), whose use is commonly accepted for such applications [
15,
16,
17]. A previous evaluation of this sensor demonstrated high linearity (
) and very low hysteresis (
) [
3]. The pressure was measured at 4 measurement points (at the height of measurement point B1 and C (
Figure 1C) [
12] on the medial and lateral side of the leg) and in 3 positions: supine, sitting, and standing.
Only the pressure applied at the height of measurement point C on both sides of the leg in sitting and standing positions was considered for analysis in the present study.
2.5. Statistical Analysis
The normality of the distribution of soft tissue stiffnesses was tested with the Shapiro–Wilk test (nsitting = 50, nstanding = 47). Because of the non-normality of the distributions, the significance of the difference in soft tissue stiffnesses between sitting and standing position was then tested with the Wilcoxon paired-test (n = 47). The same approach was repeated to test the significance of the difference in interface pressure between the two positions (6 bandages × 50 legs = 300).
The correlation between the variation in interface pressure and calf soft tissue stiffness was evaluated with the Pearson’s correlation coefficient (6 bandages × 47 differences in stiffness = 282).
3. Results
3.1. Compression Test and Calf Soft Tissue Global Stiffness
Large discrepancies were observed among the mechanical responses (force vs. displacement) of the calf soft tissues (
Figure 3A,B). They were the consequence of differences in morphology, pathology (especially muscle spasticity), and sensitivity to the compression tests within patients.
Identified values of the global stiffness of the calf soft tissues
(Equation (1)) are presented in
Table 1. A representative comparison of experimental and numerical responses is given in
Figure 3C.
Calf soft tissue global stiffness significantly increased from sitting to standing position, respectively, (range: ) and (range: ).
3.2. Calf Soft Tissue Global Stiffness and Interface Pressure
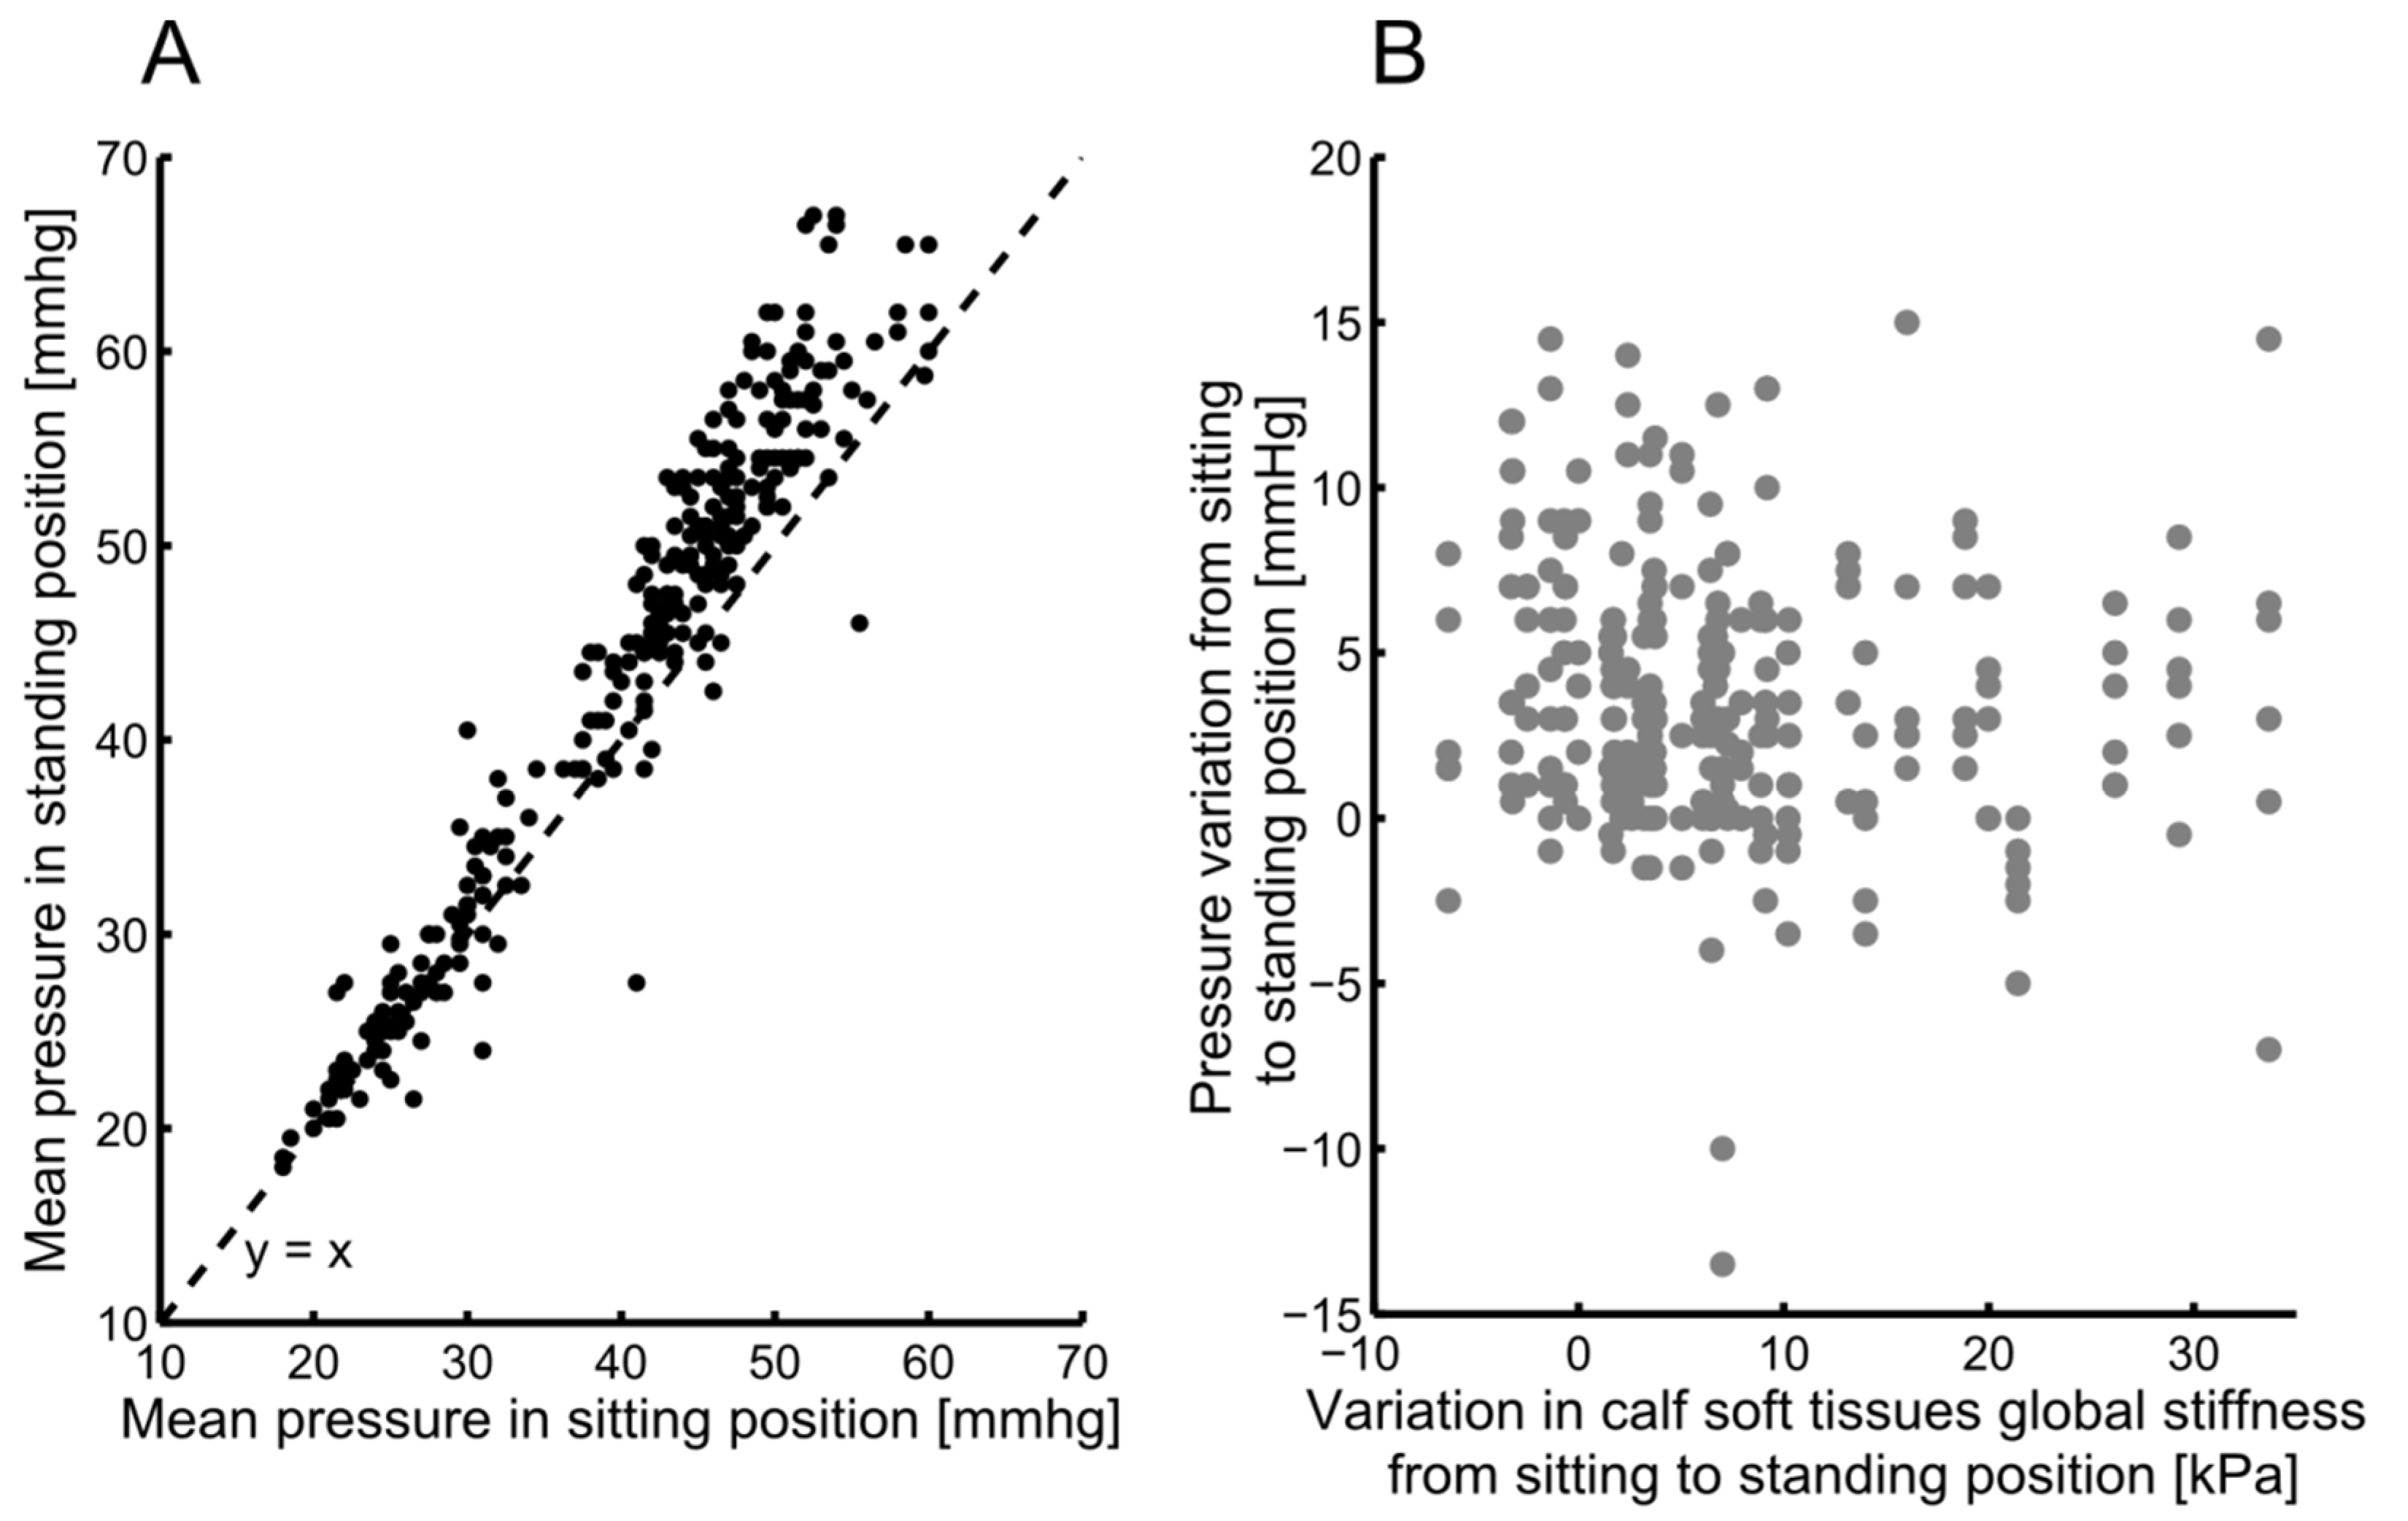
The compression test was followed by the application of six different bandages and pressure measurements. Interface pressure significantly increased from sitting to standing position (
p < 0.0001) (
Figure 4A). This pressure variation from sitting to standing position was plotted as a function of the variation in calf soft tissue global stiffness in
Figure 4B. Though both soft tissue stiffness and pressure increased from sitting to standing position, no significant correlation was found between their variations (for the six bandages:
).
4. Discussion
4.1. Compression Test and Calf Soft Tissue Global Stiffness
A significant increase in soft tissue global stiffness was observed from sitting to standing position, resulting from the muscle contraction required to stabilize the standing position [
9].
Patients included in the clinical study suffered from motor or balance deficiency and about half of them could not walk at all. This heterogeneous population may explain the very large discrepancies in the identified soft tissue global stiffnesses.
Eleven patients showed spasticity of the lower limb (for one leg in the case of hemiplegic patients and both legs for paraplegic patients). The biomechanical component of spasticity is known to be an increase in muscle stiffness [
18,
19]. In the present study, for five out of eight spastic hemiplegic patients the paretic leg showed higher stiffness than the healthy one at rest. In addition, the highest global stiffnesses were measured for a paraplegic patient with high spasticity. Though this approach may be a quick tool for the evaluation of spasticity, the number of spastic patients included in the study was too small to conclude about the efficiency of this identification method.
4.2. Calf Soft Tissue Global Stiffness and Interface Pressure
It was hypothesized that the pressure increase from supine to standing position was the consequence of two phenomena: a change in leg geometry (consequence of the gravity) and a change in muscle mechanical properties induced by muscle contraction. A significant change in mechanical properties from sitting to standing was observed but was not correlated to the corresponding pressure variation.
Thus, it can be concluded that this pressure variation is mostly due to the geometrical changes in the leg (volume for instance). However, even though soft tissue mechanical properties do not seem to impact interface pressure, it is important to remember that they may impact its transmission through soft tissues to the veins [
20].
4.3. Limitations
The main limitation of this method is the lack of internal anatomical data, especially the accurate bones geometry and location. To evaluate this uncertainty, the identification process was implemented for six different geometries, all based on the same initial leg geometry. The standard deviation of the identified global stiffnesses was equal to 8.6% for the initially identified value (). This variation is much lower than inter-individual variability, which is equal to 53.2% for the mean global stiffness in standing position ().
In addition, as the identification was only based on the external geometry of the leg, muscular and adipose tissues could not be differentiated. Moreover, only the stiffness parameter was identified in this study, when the bulk modulus was kept constant for all legs. The assumption of quasi-incompressibility of the calf soft tissues was supported by previous experimental observations [
14].
Finally, all bandages were applied in supine position. Calf mechanical properties in supine position would have been of great interest but their identification is for now not possible with this method.
5. Conclusions
Calf soft tissues global stiffness was characterized for both legs of 25 patients in a sitting and standing position, thanks to the combination of a compression test and a finite element model updating method. This identification was coupled with interface pressure measurements applied by six compression bandages.
Interface pressure and soft tissue global stiffness increased from the sitting to standing position. However, no correlation was found between interface pressure and stiffness increase. This result suggests that interface pressure variations with body positions are mostly the consequence of changes in leg geometry. Based on these observations made in static positions, future work could focus on the effect of dynamic changes in leg geometry and mechanical properties while walking, and their effect on interface pressure applied by compression bandages.
Author Contributions
Conceptualization, F.C. and P.G.; methodology, F.C.; software, F.C. and P.B.; validation, F.C. and J.M.; formal analysis, F.C. and J.M.; investigation, C.H.-D. and F.C.; resources, R.C.; data curation, C.H.-D. and F.C.; writing—original draft preparation, F.C.; writing—review and editing, F.C. and J.M.; visualization, J.M.; supervision, P.G.; project administration, R.C.; funding acquisition, P.B. All authors have read and agreed to the published version of the manuscript.
Funding
This research was partially funded by French National Association of Research and Technology under grant 2014/0189.
Institutional Review Board Statement
The study was conducted according to the guidelines of the Declaration of Helsinki, and approved by the Institutional Review Board (or Ethics Committee) of CPP Sud-Est I under Nb.2015-34, 7 September 2015.
Informed Consent Statement
Informed consent was obtained from all subjects involved in the study.
Data Availability Statement
Conflicts of Interest
Reynald Convert is currently Research and Development Director at Thuasne. Fanette Chassagne was employed by Thuasne during her Ph.D. thesis Clothilde Helouin Desenne was employed by Thuasne as Master trainee. The other authors declare no conflict of interest.
References
- Partsch, H. Compression for the management of venous leg ulcers: Which material do we have? Phlebology 2014, 29 (Suppl. 1), 140–145. [Google Scholar] [CrossRef] [PubMed]
- Partsch, H.; Clark, M.; Mosti, G.; Steinlechner, E.; Schuren, J.; Abel, M.; Benigni, J.-P.; Coleridge-Smith, P.; Cornu-ThéNard, A.; Flour, M.; et al. Classification of Compression Bandages: Practical Aspects. Dermatol. Surg. 2008, 34, 600–609. [Google Scholar] [CrossRef] [PubMed]
- Chassagne, F.; Martin, F.; Badel, P.; Convert, R.; Giraux, P.; Molimard, J. Experimental Investigation of Pressure Applied on the Lower Leg by Elastic Compression Bandage. Ann. Biomed. Eng. 2015, 43, 2967–2977. [Google Scholar] [CrossRef] [PubMed] [Green Version]
- Partsch, H. The use of pressure change on standing as a surrogate measure of the stiffness of a compression bandage. Eur. J. Vasc. Endovasc. Surg. 2005, 30, 415–421. [Google Scholar] [CrossRef] [PubMed] [Green Version]
- Partsch, H. The static stiffness index: A simple method to assess the elastic property of compression material in vivo. Derm. Surg. 2005, 31, 625–630. [Google Scholar] [CrossRef]
- Partsch, H.; Schuren, J.; Mosti, G.; Benigni, J.P. The Static Stiffness Index: An important parameter to characterise compression therapy in vivo. J. Wound Care 2016, 25, S4–S10. [Google Scholar] [CrossRef] [PubMed]
- Berszakiewicz, A.; Sieroń, A.; Krasiński, Z.; Cholewka, A.; Stanek, A. Compression therapy in venous diseases: Physical assumptions and clinical effects. Postepy Derm. Alergol. 2020, 37, 842–847. [Google Scholar] [CrossRef] [PubMed]
- Gebruers, N.; Hendriks, J.M.H.; Tjalma, W.; Verbelen, H.; Van Soom, T.; van Breda, E.; De Vrieze, T. Pressure Curves, Static and Dynamic Stiffness of Different Two-Component Compression Systems for the Treatment of Chronic Edema of the Lower Limbs. Lymphat. Res. Biol. 2021. [Google Scholar] [CrossRef] [PubMed]
- Loram, I.D.; Maganaris, C.N.; Lakie, M. Paradoxical muscle movement in human standing: Paradoxical muscle movement in standing. J. Physiol. 2004, 556, 683–689. [Google Scholar] [CrossRef] [PubMed]
- Chassagne, F.; Helouin-Desenne, C.; Molimard, J.; Convert, R.; Badel, P.; Giraux, P. Superimposition of elastic and nonelastic compression bandages. J. Vasc. Surg. Venous Lymphat. Disord. 2017, 5, 851–858. [Google Scholar] [CrossRef] [PubMed]
- Frauziols, F.; Chassagne, F.; Badel, P.; Navarro, L.; Molimard, J.; Curt, N.; Avril, S. In vivo Identification of the Passive Mechanical Properties of Deep Soft Tissues in the Human Leg: In vivo Identification of Passive Mechanical Properties of Leg Soft Tissues. Strain 2016, 52, 400–411. [Google Scholar] [CrossRef] [Green Version]
- Partsch, H.; Clark, M.; Bassez, S.; Benigni, J.-P.; Becker, F.; Blazek, V.; Caprini, J.; Cornu-Thénard, A.; Hafner, J.; Flour, M.; et al. Measurement of lower leg compression in vivo: Recommendations for the performance of measurements of interface pressure and stiffness: Consensus statement. Derm. Surg. 2006, 32, 224–232. [Google Scholar] [CrossRef]
- Bessaud, J.-C.; Hersch, R.D. Visible human slice sequence animation Web server. In Proceedings of the Photonics West 2001-Electronic Imaging, San Jose, CA, USA, 20–26 January 2001; pp. 341–348. [Google Scholar]
- Bouten, L. Identification des Propriétés Mécaniques des Tissus Constitutifs du Mollet pour L’étude Mécanique de la Contention. Ph.D. Thesis, Ecole Nationale Supérieure des Mines de Saint-Etienne, Saint-Étienne, France, 2009. [Google Scholar]
- Lee, S.Y.; Cho, Y.S.; Joo, S.Y.; Seo, C.H. Comparison between the portable pressure measuring device and PicoPress® for garment pressure measurement on hypertrophic burn scar during compression therapy. Burns 2021, 47, 1621–1626. [Google Scholar] [CrossRef] [PubMed]
- Rimaud, D.; Convert, R.; Calmels, P. In vivo measurement of compression bandage interface pressures: The first study. Ann. Phys. Rehabil. Med. 2014, 57, 394–408. [Google Scholar] [CrossRef] [PubMed] [Green Version]
- Partsch, H.; Mosti, G. Comparison of three portable instruments to measure compression pressure. Int. Angiol. 2010, 29, 426–430. [Google Scholar] [PubMed]
- Fridén, J.; Lieber, R.L. Spastic muscle cells are shorter and stiffer than normal cells: Spastic Muscle Cell Properties. Muscle Nerve 2003, 27, 157–164. [Google Scholar] [CrossRef] [PubMed]
- Haugh, A.B.; Pandyan, A.D.; Johnson, G.R. A systematic review of the Tardieu Scale for the measurement of spasticity. Disabil. Rehabil. 2006, 28, 899–907. [Google Scholar] [CrossRef] [PubMed]
- Rohan, P.-Y.; Badel, P.; Lun, B.; Rastel, D.; Avril, S. Prediction of the Biomechanical Effects of Compression Therapy on Deep Veins Using Finite Element Modelling. Ann. Biomed. Eng. 2015, 43, 314–324. [Google Scholar] [CrossRef] [PubMed] [Green Version]
| Publisher’s Note: MDPI stays neutral with regard to jurisdictional claims in published maps and institutional affiliations. |
© 2022 by the authors. Licensee MDPI, Basel, Switzerland. This article is an open access article distributed under the terms and conditions of the Creative Commons Attribution (CC BY) license (https://creativecommons.org/licenses/by/4.0/).


 ,
, 


