
Impact of Obesity on Foot Kinematics: Greater Arch Compression and Metatarsophalangeal Joint Dorsiflexion despite Similar Joint Coupling Ratios
 , ,
, ,
Abstract
:1. Introduction
2. Materials and Methods
2.1. Participants
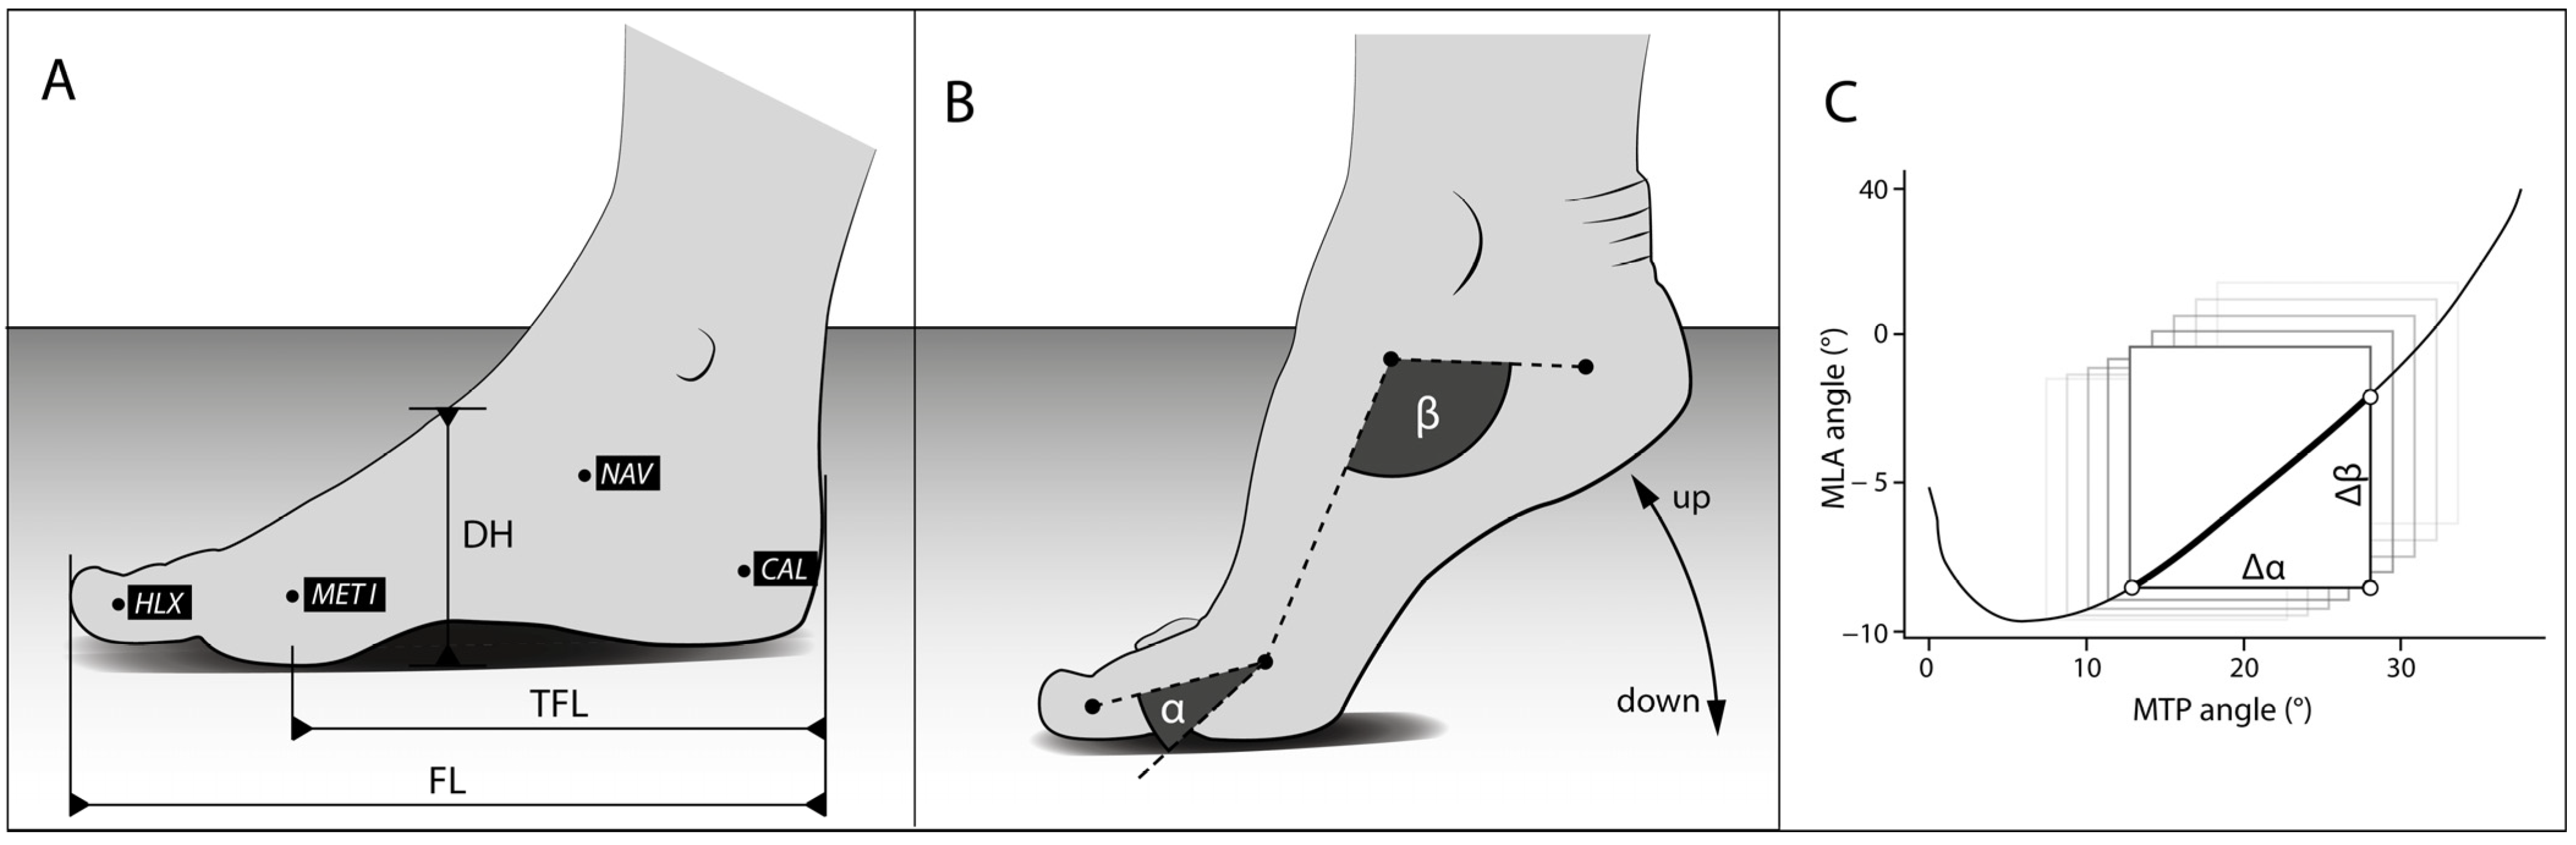
2.2. Kinematic Measurements
2.3. Statistical Analysis
3. Results
4. Discussion
Author Contributions
Funding
Institutional Review Board Statement
Informed Consent Statement
Data Availability Statement
Conflicts of Interest
References
- Anandacoomarasamy, A.; Caterson, I.; Sambrook, P.; Fransen, M.; March, L. The impact of obesity on the musculoskeletal system. Int. J. Obes. 2008, 32, 211–222. [Google Scholar] [CrossRef] [PubMed]
- Dean, E.; Söderlund, A. What is the role of lifestyle behaviour change associated with non-communicable disease risk in managing musculoskeletal health conditions with special reference to chronic pain? BMC Musculoskelet. Disord. 2015, 16, 1–7. [Google Scholar] [CrossRef] [PubMed]
- Mickle, K.J.; Steele, J.R. Obese older adults suffer foot pain and foot-related functional limitation. Gait Posture 2015, 42, 442–447. [Google Scholar] [CrossRef] [PubMed]
- Frey, C.; Zamora, J. The effects of obesity on orthopaedic foot and ankle pathology. Foot Ankle Int. 2007, 28, 996–999. [Google Scholar] [CrossRef] [PubMed]
- Butterworth, P.A.; Menz, H.B.; Urquhart, D.M.; Cicuttini, F.M.; Pasco, J.A.; Brennan, S.L.; Wluka, A.E.; Strauss, B.J.; Proietto, J.; Dixon, J.B.; et al. The association between obesity and foot pain: Metabolic, biomechanical or both? J. Foot Ankle Res. 2015, 8, O5. [Google Scholar] [CrossRef]
- Catan, L.; Amaricai, E.; Onofrei, R.R.; Popoiu, C.M.; Iacob, E.R.; Stanciulescu, C.M.; Cerbu, S.; Horhat, D.I.; Suciu, O. The Impact of Overweight and Obesity on Plantar Pressure in Children and Adolescents: A Systematic Review. Int. J. Environ. Res. Public Health 2020, 17, 6600. [Google Scholar] [CrossRef] [PubMed]
- Molina-García, C.; Jiménez-García, J.D.; Velázquez-Díaz, D.; Ramos-Petersen, L.; López-Del-Amo-Lorente, A.; Martínez-Sebastián, C.; Álvarez-Salvago, F. Overweight and Obesity: Its Impact on Foot Type, Flexibility, Foot Strength, Plantar Pressure and Stability in Children from 5 to 10 Years of Age: Descriptive Observational Study. Children 2023, 10, 696. [Google Scholar] [CrossRef] [PubMed]
- Cimolin, V.; Capodaglio, P.; Cau, N.; Galli, M.; Pau, M.; Patrizi, A.; Tringali, G.; Sartorio, A. Foot-type analysis and plantar pressure differences between obese and nonobese adolescents during upright standing. Int. J. Rehabil. Res. 2016, 39, 87–91. [Google Scholar] [CrossRef] [PubMed]
- Messier, S.P.; Davies, A.B.; Moore, D.T.; Davis, S.E.; Pack, R.J.; Kazmar, S.C. Severe Obesity: Effects on Foot Mechanics During Walking. Foot Ankle Int. 1994, 15, 29–34. [Google Scholar] [CrossRef]
- Capodaglio, P.; Gobbi, M.; Donno, L.; Fumagalli, A.; Buratto, C.; Galli, M.; Cimolin, V. Effect of Obesity on Knee and Ankle Biomechanics during Walking. Sensors 2021, 21, 7114. [Google Scholar] [CrossRef]
- Kim, D.; Lewis, C.L.; Gill, S.V. Effects of obesity and foot arch height on gait mechanics: A cross-sectional study. PLoS ONE 2021, 16, e0260398. [Google Scholar] [CrossRef] [PubMed]
- Gefen, A. The in vivo elastic properties of the plantar fascia during the contact phase of walking. Foot Ankle Int. 2003, 24, 238–244. [Google Scholar] [CrossRef] [PubMed]
- Caravaggi, P.; Pataky, T.; Günther, M.; Savage, R.; Crompton, R. Dynamics of longitudinal arch support in relation to walking speed: Contribution of the plantar aponeurosis. J. Anat. 2010, 217, 254–261. [Google Scholar] [CrossRef] [PubMed]
- Ker, R.F.; Bennett, M.B.; Bibby, S.R.; Kester, R.C.; Alexander, R.M. The spring in the arch of the human foot. Nature 1987, 325, 147–149. [Google Scholar] [CrossRef]
- Wager, J.C.; Challis, J.H. Elastic energy within the human plantar aponeurosis contributes to arch shortening during the push-off phase of running. J. Biomech. 2016, 49, 704–709. [Google Scholar] [CrossRef] [PubMed]
- McDonald, K.A.; Stearne, S.M.; Alderson, J.A.; North, I.; Pires, N.J.; Rubenson, J. The Role of Arch Compression and Metatarsophalangeal Joint Dynamics in Modulating Plantar Fascia Strain in Running. PLoS ONE 2016, 11, e0152602. [Google Scholar] [CrossRef]
- Sichting, F.; Ebrecht, F. The rise of the longitudinal arch when sitting, standing, and walking: Contributions of the windlass mechanism. PLoS ONE 2021, 16, e0249965. [Google Scholar] [CrossRef]
- Welte, L.; Kelly, L.A.; Kessler, S.E.; Lieberman, D.E.; D’Andrea, S.E.; Lichtwark, G.A.; Rainbow, M.J. The extensibility of the plantar fascia influences the windlass mechanism during human running. Proc. R. Soc. B Biol. Sci. 2021, 288, 20202095. [Google Scholar] [CrossRef] [PubMed]
- Williams, L.R.; Ridge, S.T.; Johnson, A.W.; Arch, E.S.; Bruening, D.A. The influence of the windlass mechanism on kinematic and kinetic foot joint coupling. J. Foot Ankle Res. 2022, 15, 16. [Google Scholar] [CrossRef]
- Hicks, J.H. The mechanics of the foot. II. The plantar aponeurosis and the arch. J. Anat. 1954, 88, 25–30. [Google Scholar]
- Farris, D.J.; Birch, J.; Kelly, L. Foot stiffening during the push-off phase of human walking is linked to active muscle contraction, and not the windlass mechanism. J. R. Soc. Interface 2020, 17, 20200208. [Google Scholar] [CrossRef] [PubMed]
- Farris, D.J.; Kelly, L.A.; Cresswell, A.G.; Lichtwark, G.A. The functional importance of human foot muscles for bipedal locomotion. Proc. Natl. Acad. Sci. USA 2019, 116, 1645–1650. [Google Scholar] [CrossRef] [PubMed]
- Jeong, H.-J.; Mueller, M.J.; Zellers, J.A.; Hastings, M.K. Midfoot and ankle motion during heel rise and gait are related in people with diabetes and peripheral neuropathy. Gait Posture 2020, 84, 38–44. [Google Scholar] [CrossRef] [PubMed]
- Williams, D.S.; McClay, I.S. Measurements used to characterize the foot and the medial longitudinal arch: Reliability and validity. Phys. Ther. 2000, 80, 864–871. [Google Scholar] [CrossRef] [PubMed]
- Butler, R.J.; Hillstrom, H.; Song, J.; Richards, C.J.; Davis, I.S. Arch height index measurement system: Establishment of reliability and normative values. J. Am. Podiatr. Med. Assoc. 2008, 98, 102–106. [Google Scholar] [CrossRef] [PubMed]
- Butler, R.J.; Davis, I.S.; Hamill, J. Interaction of arch type and footwear on running mechanics. Am. J. Sports Med. 2006, 34, 1998–2005. [Google Scholar] [CrossRef] [PubMed]
- Butler, R.J.; Hamill, J.; Davis, I. Effect of footwear on high and low arched runners’ mechanics during a prolonged run. Gait Posture 2007, 26, 219–225. [Google Scholar] [CrossRef] [PubMed]
- Horsak, B.; Pobatschnig, B.; Baca, A.; Greber-Platzer, S.; Kreissl, A.; Nehrer, S.; Wondrasch, B.; Crevenna, R.; Keilani, M.; Kranzl, A. Within-assessor reliability and minimal detectable change of gait kinematics in a young obese demographic. Gait Posture 2017, 54, 112–118. [Google Scholar] [CrossRef]
- Ciprandi, D.; Bertozzi, F.; Zago, M.; Ferreira, C.L.P.; Boari, G.; Sforza, C.; Galvani, C. Study of the association between gait variability and physical activity. Eur. Rev. Aging Phys. Act. 2017, 14, 19. [Google Scholar] [CrossRef] [PubMed]
- Feng, Y.; Max, L. Accuracy and Precision of a Custom Camera-Based System for 2-D and 3-D Motion Tracking During Speech and Nonspeech Motor Tasks. J. Speech Lang. Hear Res. 2014, 57, 426–438. [Google Scholar] [CrossRef]
- Hedrick, T.L. Software techniques for two- and three-dimensional kinematic measurements of biological and biomimetic systems. Bioinspir. Biomim. 2008, 3, 034001. [Google Scholar] [CrossRef] [PubMed]
- Caravaggi, P.; Matias, A.B.; Taddei, U.T.; Ortolani, M.; Leardini, A.; Sacco, I.C. Reliability of medial-longitudinal-arch measures for skin-markers based kinematic analysis. J. Biomech. 2019, 88, 180–185. [Google Scholar] [CrossRef] [PubMed]
- Holowka, N.B.; Wallace, I.J.; Lieberman, D.E. Foot strength and stiffness are related to footwear use in a comparison of minimally- vs. conventionally-shod populations. Sci. Rep. 2018, 8, 3679. [Google Scholar] [CrossRef] [PubMed]
- Griffin, N.L.; Miller, C.; Schmitt, D.; D’Août, K. An investigation of the dynamic relationship between navicular drop and first metatarsophalangeal joint dorsal excursion. J. Anat. 2013, 222, 598–607. [Google Scholar] [CrossRef] [PubMed]
- Kappel-Bargas, A.; Woolf, R.D.; Cornwall, M.W.; McPoil, T.G. The windlass mechanism during normal walking and passive first metatarsalphalangeal joint extension. Clin. Biomech. 1998, 13, 190–194. [Google Scholar] [CrossRef] [PubMed]
- Pohl, M.B.; Farr, L. A comparison of foot arch measurement reliability using both digital photography and calliper methods. J. Foot Ankle Res. 2010, 3, 14. [Google Scholar] [CrossRef] [PubMed]
- Evans, A.M.; Karimi, L. The relationship between paediatric foot posture and body mass index: Do heavier children really have flatter feet? J. Foot Ankle Res. 2015, 8, 46. [Google Scholar] [CrossRef]
- Martínez-Nova, A.; Gijón-Noguerón, G.; Alfageme-García, P.; Montes-Alguacil, J.; Evans, A.M. Foot posture development in children aged 5 to11 years: A three-year prospective study. Gait Posture 2018, 62, 280–284. [Google Scholar] [CrossRef] [PubMed]
- de Carvalho, B.K.G.; Penha, P.J.; Ramos, N.L.J.P.; Andrade, R.M.; Ribeiro, A.P.; João, S.M.A. Age, Sex, Body Mass Index, and Laterality in the Foot Posture of Adolescents: A Cross Sectional Study. J. Manip. Physiol. Ther. 2020, 43, 744–752. [Google Scholar] [CrossRef]
- Woźniacka, R.; Bac, A.; Matusik, S.; Szczygieł, E.; Ciszek, E. Body weight and the medial longitudinal foot arch: High-arched foot, a hidden problem? Eur. J. Pediatr. 2013, 172, 683–691. [Google Scholar] [CrossRef]
- Zhao, X.; Tsujimoto, T.; Kim, B.; Katayama, Y.; Tanaka, K. Characteristics of foot morphology and their relationship to gender, age, body mass index and bilateral asymmetry in Japanese adults. J. Back Musculoskelet. Rehabil. 2017, 30, 527–535. [Google Scholar] [CrossRef] [PubMed]
- Naderi, A.; Baloochi, R.; Rostami, K.D.; Fourchet, F.; Degens, H. Obesity and foot muscle strength are associated with high dynamic plantar pressure during running. Foot 2020, 44, 101683. [Google Scholar] [CrossRef] [PubMed]
- Zhao, X.; Hu, F.; Yu, J.; Zhou, Z. Is obesity associated with foot structure and the strength of muscles that move the ankle in adult men? J. Men’s Health 2022, 18, 57. [Google Scholar] [CrossRef]
- Irving, D.B.; Cook, J.L.; A Young, M.; Menz, H.B. Obesity and pronated foot type may increase the risk of chronic plantar heel pain: A matched case-control study. BMC Musculoskelet. Disord. 2007, 8, 41. [Google Scholar] [CrossRef] [PubMed]
- Durrant, M.; Siepert, K. Role of soft tissue structures as an etiology of hallux limitus. J. Am. Podiatr. Med. Assoc. 1993, 83, 173–180. [Google Scholar] [CrossRef]
- Taş, S.; Bek, N.; Onur, M.R.; Korkusuz, F. Effects of Body Mass Index on Mechanical Properties of the Plantar Fascia and Heel Pad in Asymptomatic Participants. Foot Ankle Int. 2017, 38, 779–784. [Google Scholar] [CrossRef] [PubMed]
- Allan, J.J.; McClelland, J.A.; Munteanu, S.E.; Buldt, A.K.; Landorf, K.B.; Roddy, E.; Auhl, M.; Menz, H.B. First metatarsophalangeal joint range of motion is associated with lower limb kinematics in individuals with first metatarsophalangeal joint osteoarthritis. J. Foot Ankle Res. 2020, 13, 33. [Google Scholar] [CrossRef] [PubMed]
- Ahsan, M. Determine the kinematics and kinetics parameters associated with bilateral gait patterns among healthy, overweight, and obese adults. Acta Biomed. 2022, 93, e2022228. [Google Scholar] [CrossRef]
- Tabue-Teguo, M.; Perès, K.; Simo, N.; Le Goff, M.; Zepeda, M.U.P.; Féart, C.; Dartigues, J.-F.; Amieva, H.; Cesari, M. Gait speed and body mass index: Results from the AMI study. PLoS ONE 2020, 15, e0229979. [Google Scholar] [CrossRef]
- Laroche, D.; Pozzo, T.; Ornetti, P.; Tavernier, C.; Maillefert, J.F. Effects of loss of metatarsophalangeal joint mobility on gait in rheumatoid arthritis patients. Rheumatology 2005, 45, 435–440. [Google Scholar] [CrossRef]


| NW | OW | |
|---|---|---|
| n (female/male) | 10 (6/4) | 17 (9/8) |
| age (yrs) | 28.7 ± 9.1 (20–51) | 44.1 ± 12.8 (25–65) |
| weight (kg) | 68.1 ± 11.5 (53.0–88.6) | 136.3 ± 27.5 (92.0–196.0) |
| height (cm) | 175.6 ± 11.3 (160–193) | 174.1 ± 12.9 (152–197) |
| BMI (kg/m²) | 21.9 ± 2.1 (18.4–24.8) | 44.8 ± 6.9 (37.2–61.3) |
| foot length (cm) | 24.8 ± 1.8 (22.4–28.3) | 26.2 ± 2.2 (21.2–29.5) |
| truncated foot length (cm) | 18.3 ± 1.4 (16.0–20.8) | 19.6 ± 1.8 (16.0–22.1) |
| arch height (cm) | 6.5 ± 0.5 (5.7–7.5) | 6.6 ± 0.9 (4.5–8.0) |
| AHI | 0.38 ± 0.01 (0.35–0.40) | 0.41 ± 0.7 (0.34–0.60) |
| NW | OW | p-Values | |
|---|---|---|---|
| Heel-raising task while sitting | |||
| n (f/m) | 10 (6/4) | 13 (7/6) | |
| Joint coupling ratio | 0.66 ± 0.26 (0.20–0.96] | 0.64 ± 0.36 (0.19–1.60) | 0.87 |
| Walking talk | |||
| n (f/m) | 10 (6/4) | 12 (6/6) | |
| Joint coupling ratio | 0.48 ± 0.14 (0.22–0.64) | 0.46 ± 0.15 (0.32–0.87) | 0.75 |
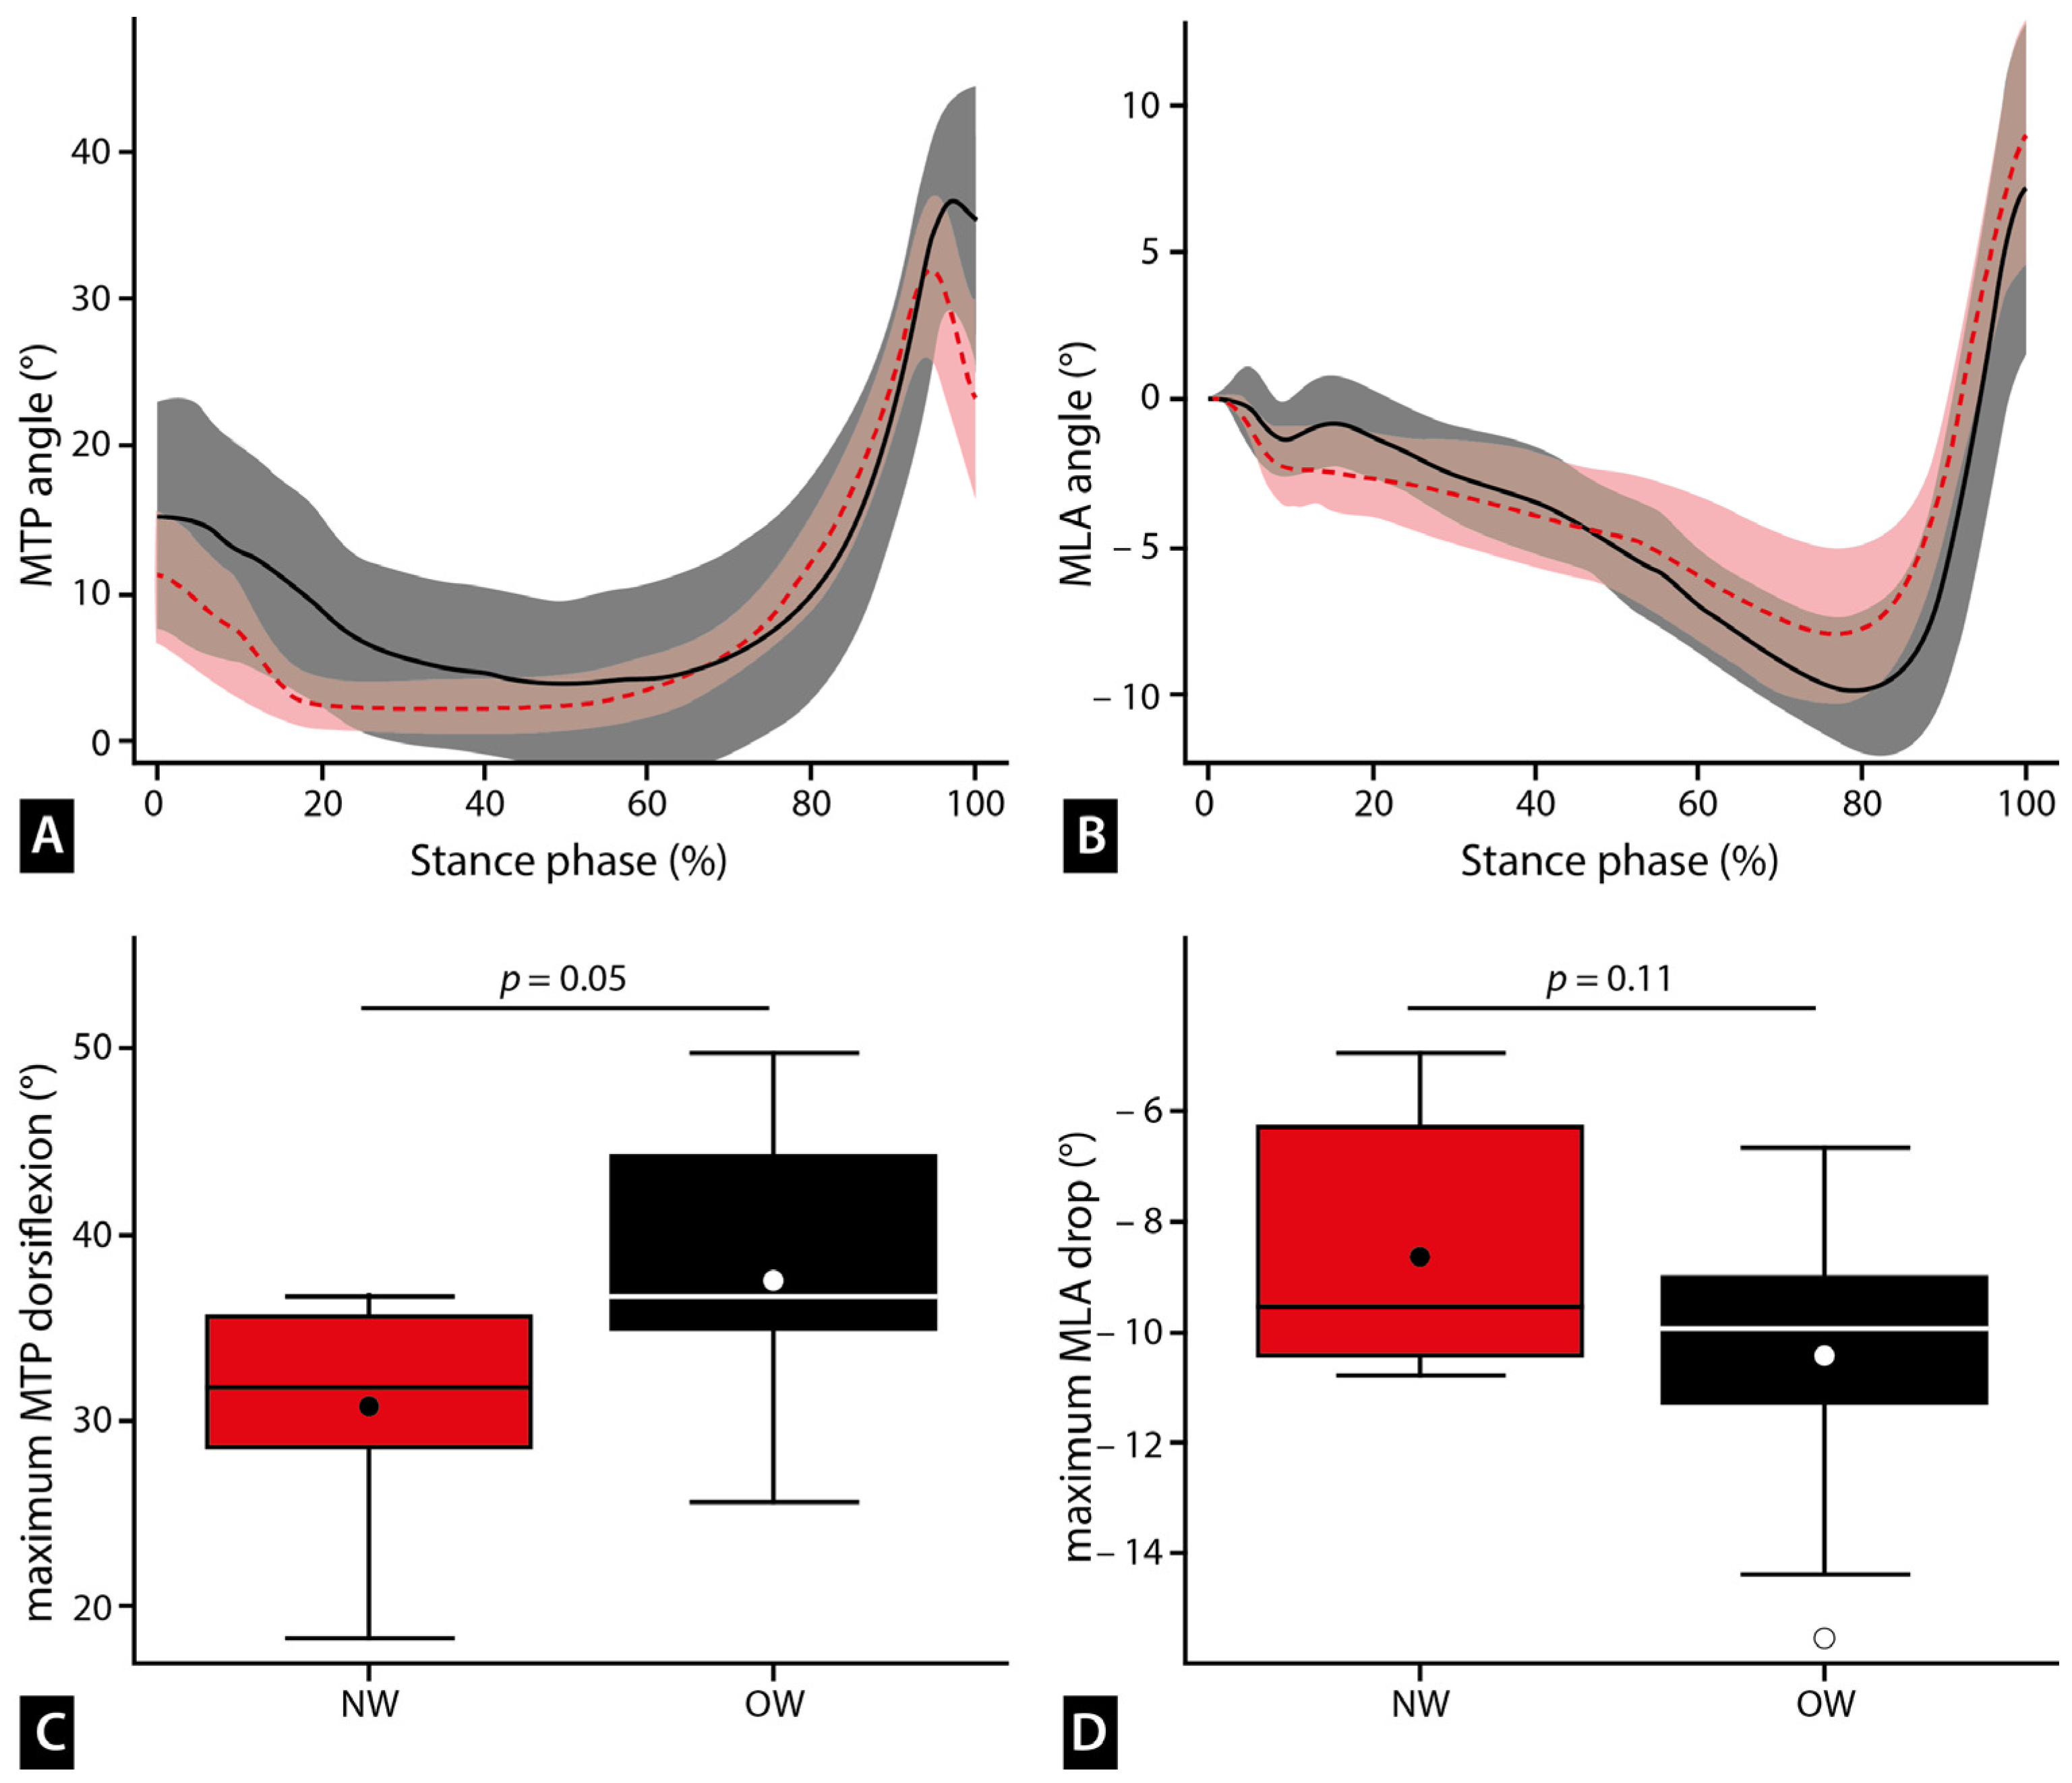
| MTP_max (°) | 31.03 ± 5.80 (18.20–36.73) | 37.52 ± 8.40 (21.05–49.84) | 0.05 |
| MLA drop (°) | −8.67 ± 2.26 (−4.94–−10.81) | −10.39 ± 2.50 (−6.71–−15.53) | 0.11 |
Disclaimer/Publisher’s Note: The statements, opinions and data contained in all publications are solely those of the individual author(s) and contributor(s) and not of MDPI and/or the editor(s). MDPI and/or the editor(s) disclaim responsibility for any injury to people or property resulting from any ideas, methods, instructions or products referred to in the content. |
© 2024 by the authors. Licensee MDPI, Basel, Switzerland. This article is an open access article distributed under the terms and conditions of the Creative Commons Attribution (CC BY) license (https://creativecommons.org/licenses/by/4.0/).
Share and Cite
Sichting, F.; Zenner, A.; Mirow, L.; Luck, R.; Globig, L.; Nitzsche, N. Impact of Obesity on Foot Kinematics: Greater Arch Compression and Metatarsophalangeal Joint Dorsiflexion despite Similar Joint Coupling Ratios. Biomechanics 2024, 4, 235-245. https://doi.org/10.3390/biomechanics4020013
Sichting F, Zenner A, Mirow L, Luck R, Globig L, Nitzsche N. Impact of Obesity on Foot Kinematics: Greater Arch Compression and Metatarsophalangeal Joint Dorsiflexion despite Similar Joint Coupling Ratios. Biomechanics. 2024; 4(2):235-245. https://doi.org/10.3390/biomechanics4020013
Chicago/Turabian StyleSichting, Freddy, Alexandra Zenner, Lutz Mirow, Robert Luck, Lydia Globig, and Nico Nitzsche. 2024. "Impact of Obesity on Foot Kinematics: Greater Arch Compression and Metatarsophalangeal Joint Dorsiflexion despite Similar Joint Coupling Ratios" Biomechanics 4, no. 2: 235-245. https://doi.org/10.3390/biomechanics4020013