Article

Desertification in the Sahel Region: A Product of Climate Change or Human Activities? A Case of Desert Encroachment Monitoring in North-Eastern Nigeria Using Remote Sensing Techniques

by
Esther Shupel Ibrahim
1,2,3,*,
Bello Ahmed
4,
Oludunsin Tunrayo Arodudu
5,
Jibril Babayo Abubakar
3,
Bitrus Akila Dang
3,
Mahmoud Ibrahim Mahmoud
6,
Halilu Ahmad Shaba
7 and
Sanusi Bello Shamaki
8
1
Geography Department, Humboldt-Universität zu Berlin, Unter den Linden 6, 10099 Berlin, Germany
2
Leibniz Centre for Agricultural Landscape Research, Eberswalder Straße 84, 15374 Müncheberg, Germany
3
National Centre for Remote Sensing, National Space Research and Development Agency, Abuja PMB 437, Nigeria
4
Department of Forestry and Wildlife Management, Federal University, Dutse PMB 7156, Nigeria
5
Department of Geography, Maynooth University, W23 F2H6 Maynooth, Ireland
6
National Oil Spill Detection and Research Agency, Federal Ministry of Environment, Abuja PMB 145, Nigeria
7
National Space Research and Development Agency, Federal Ministry of Science and Technology, Abuja PMB 437, Nigeria
8
Department of Forestry and Environment, Usmanu Dan Fodiyo University, Sokoto PMB 2346, Nigeria
*
Author to whom correspondence should be addressed.
Geographies 2022, 2(2), 204-226; https://doi.org/10.3390/geographies2020015
Submission received: 31 December 2021 / Revised: 10 April 2022 / Accepted: 15 April 2022 / Published: 25 April 2022
(This article belongs to the Special Issue Feature Papers of Geographies in 2021)

Abstract

:
Desertification has become one of the most pronounced ecological disasters, affecting arid and semi-arid areas of Nigeria. This phenomenon is more pronounced in the northern region, particularly the eleven frontline states of Nigeria, sharing borders with the Niger Republic. This has been attributed to a range of natural and anthropogenic factors. Rampant felling of trees for fuelwood, unsustainable agriculture, overgrazing, coupled with unfavourable climatic conditions are among the key factors that aggravate the desertification phenomenon. This study applied geospatial analysis to explore land use/land cover changes and detect major conversions from ecologically active land covers to sand dunes. Results indicate that areas covered by sand dunes (a major indicator of desertification) have doubled over the 25 years under consideration (1990 to 2015). Even though 0.71 km2 of dunes was converted to vegetation, indicative of the success of various international, national, local and individual afforestation efforts, conversely about 10.1 km2 of vegetation were converted to sand dunes, implying around 14 times more deforestation compared to afforestation. On average, our results revealed that the sand dune in the study area is progressing at a mean annual rate of 15.2 km2 annually. The land cover conversion within the 25-year study period was from vegetated land to farmlands. Comparing the progression of a sand dune with climate records of the study area and examining the relationship between indicators of climate change and desertification suggested a mismatch between both processes, as increasing rainfall and lower temperatures observed in 1994, 2005, 2012, and 2014 did not translate into positive feedbacks for desertification in the study area. Likewise, the mean annual Normalized Difference Vegetation Index (NDVI) from 2000 to 2015 shows a deviation between vegetation peaks, mean temperatures and rainfall. On average, our results reveal that the sand dune is progressing at a mean annual rate of about 15.2 km2 in the study area. Based on this study’s land cover change, trend and conversion assessment, visual reconciliation of climate records of land cover data, statistical analysis, observations from ground-truthing, as well as previous literature, it can be inferred that desertification in Nigeria is less a function of climate change, but more a product of human activities driven by poverty, population growth and failed government policies. Further projections by this study also reveal a high probability of more farmlands being converted to sand dunes by the years 2030 and 2045 if current practices prevail.

1. Introduction

Globally, about 41% of the earth’s surface has been engulfed by aridity [1], and more than 2 billion people are reported to reside in these areas [2]. The global demography of people living in extreme poverty corresponds with people living under harsh conditions in arid regions, especially in developing nations [3,4,5]. Desertification aggravates poverty and further exposes inhabitants of arid communities to discomfort by limiting their adaptability to harsh environmental conditions. It is reported that the Sahara Desert is encroaching southwards at a rate of 5–6 km per year [6,7], and 24–48 km per year [8,9]. Previous research attributes this primarily to a range of natural and man-made factors. The factors include climate change, overgrazing, deforestation, urbanisation, bush burning, extensive cultivation, marginal land cultivation, mining, changing land use patterns, excessive application of inorganic fertilisers and agrochemicals, poverty, etc., [10,11]. These primary factors are, however, indirectly driven by several other elements, namely population pressure, socio-economic policies, international trade, as well as geomorphological and climate-related processes [12].
Desertification in the Sahelian region of Nigeria sadly conforms to the global extreme poverty stereotype. Desert features now account for approximately 580, 841 km2 of Nigeria’s landmass [13], accounting for up to 63.8% of the country’s landmass. About 30 million people (17% of the national population, and 15 out of 36 States of the Nigerian Federation) are affected by desertification in Nigeria [12]. The affected states share a border with the Sahelian-Saharan zone of the Niger Republic, which is one of the world’s most sensitive ecosystems [12]. Nationally, desertification effects are trending down towards the Southern parts of Nigeria at a rate of 0.6 km per annum, engulfing about 351,000 ha of cropland and rangeland annually [14,15]. This has resulted in catastrophic consequences to affect human, animal and plant populations in a variety of ways. Its impacts include forced human migrations, increased erosion, alteration of geochemical composition of soils, surface and groundwater depletion, biodiversity loss and species extinction, reduced agricultural yields, higher unemployment and rural poverty rates, as well as a rise in social vices and civil conflicts (e.g., kidnapping, armed robbery, religious extremism, insurgency, land/territory grabbing, etc., [16]).
Despite diverse international, national and local efforts and policies to control desertification in Nigeria, its impact persists and threatens the attainment of food security and other important sustainable development goals in the affected states. The affected areas coincide with some of the nation’s food baskets, i.e., areas that produce and supply high volumes of crops and livestock [17]. Despite the far-reaching impacts of desertification globally, there are still limited scientific efforts to assess, monitor, and predict its progression and impacts with precision [18]. The need for timely and precise monitoring and detection of degradation processes is essential for the development of strategies and solutions to combat aridity [18] Most desert estimates are presented at international levels for collaborative planning; local and regional data are often less accurate as they are mostly derived from projections or estimates from global studies [19,20,21]. Because precise data measurements at local and regional scales can in itself be expensive and laborious, there is a need to apply remote and cheaply available methods using local and regional data for such purposes [18,20,21]. Monitoring and developing appropriate intervention mechanisms for combating aridity requires robust and frequent repetitive measurements that can be achieved using remote sensing techniques [22,23,24]. Remote sensing technology is booming and undergoing continuous development regarding its reliability, remote functions and efficiency [18]. Previous remote sensing-based desertification detection and monitoring studies have focused on the use of land cover time slices to monitor the distribution of desertification or the use of vegetative indices or a combination of both [25,26,27,28]. Moreover, advanced vulnerability assessment and modelling techniques have facilitated the mapping and prediction of areas at the risk of desertification using complex desertification models, remote sensing data, climate records and other aridity indices [29,30,31,32,33]. Despite this, only a few scientific efforts exist in the Nigerian context, with respect to assessing and estimating desert areas using remote sensing and geographic information system (GIS) techniques and models [5,33,34,35,36]. While the focus of most of these previous studies was on the assessment of the general time slices (i.e., intervals) of historic land cover change, and the measurement of the rate and impact of sand dune development, none evaluated the causes and drivers of desertification in the Nigerian context. To tackle desertification headlong in the Nigerian Sahel region, there is a need for more precise and timely data on land cover conversions, more accurate predictions of future land cover conversions based on observed rates and measured impacts, as well as an evaluation of the causes and drivers of desertification using remote sensing data and techniques. Consequently, the main objective of this paper is to explore and apply a remote sensing-based change detection approach, as well as easily accessible remote sensing data (Landsat and NigeriaSat imageries) for (i) assessing the causes, rates, and impacts of desertification, and (ii) guiding the predictions of future sand dune development patterns. The remote sensing-based change detection approach adopted by this study not only examined the land cover conversion trends, rates and impacts, but detected the major land cover conversions from and to sand dunes, provided insights into and substantiated the historical causes and major drivers of desertification, while also predicting future sand dune development patterns.

2. Materials and Methods
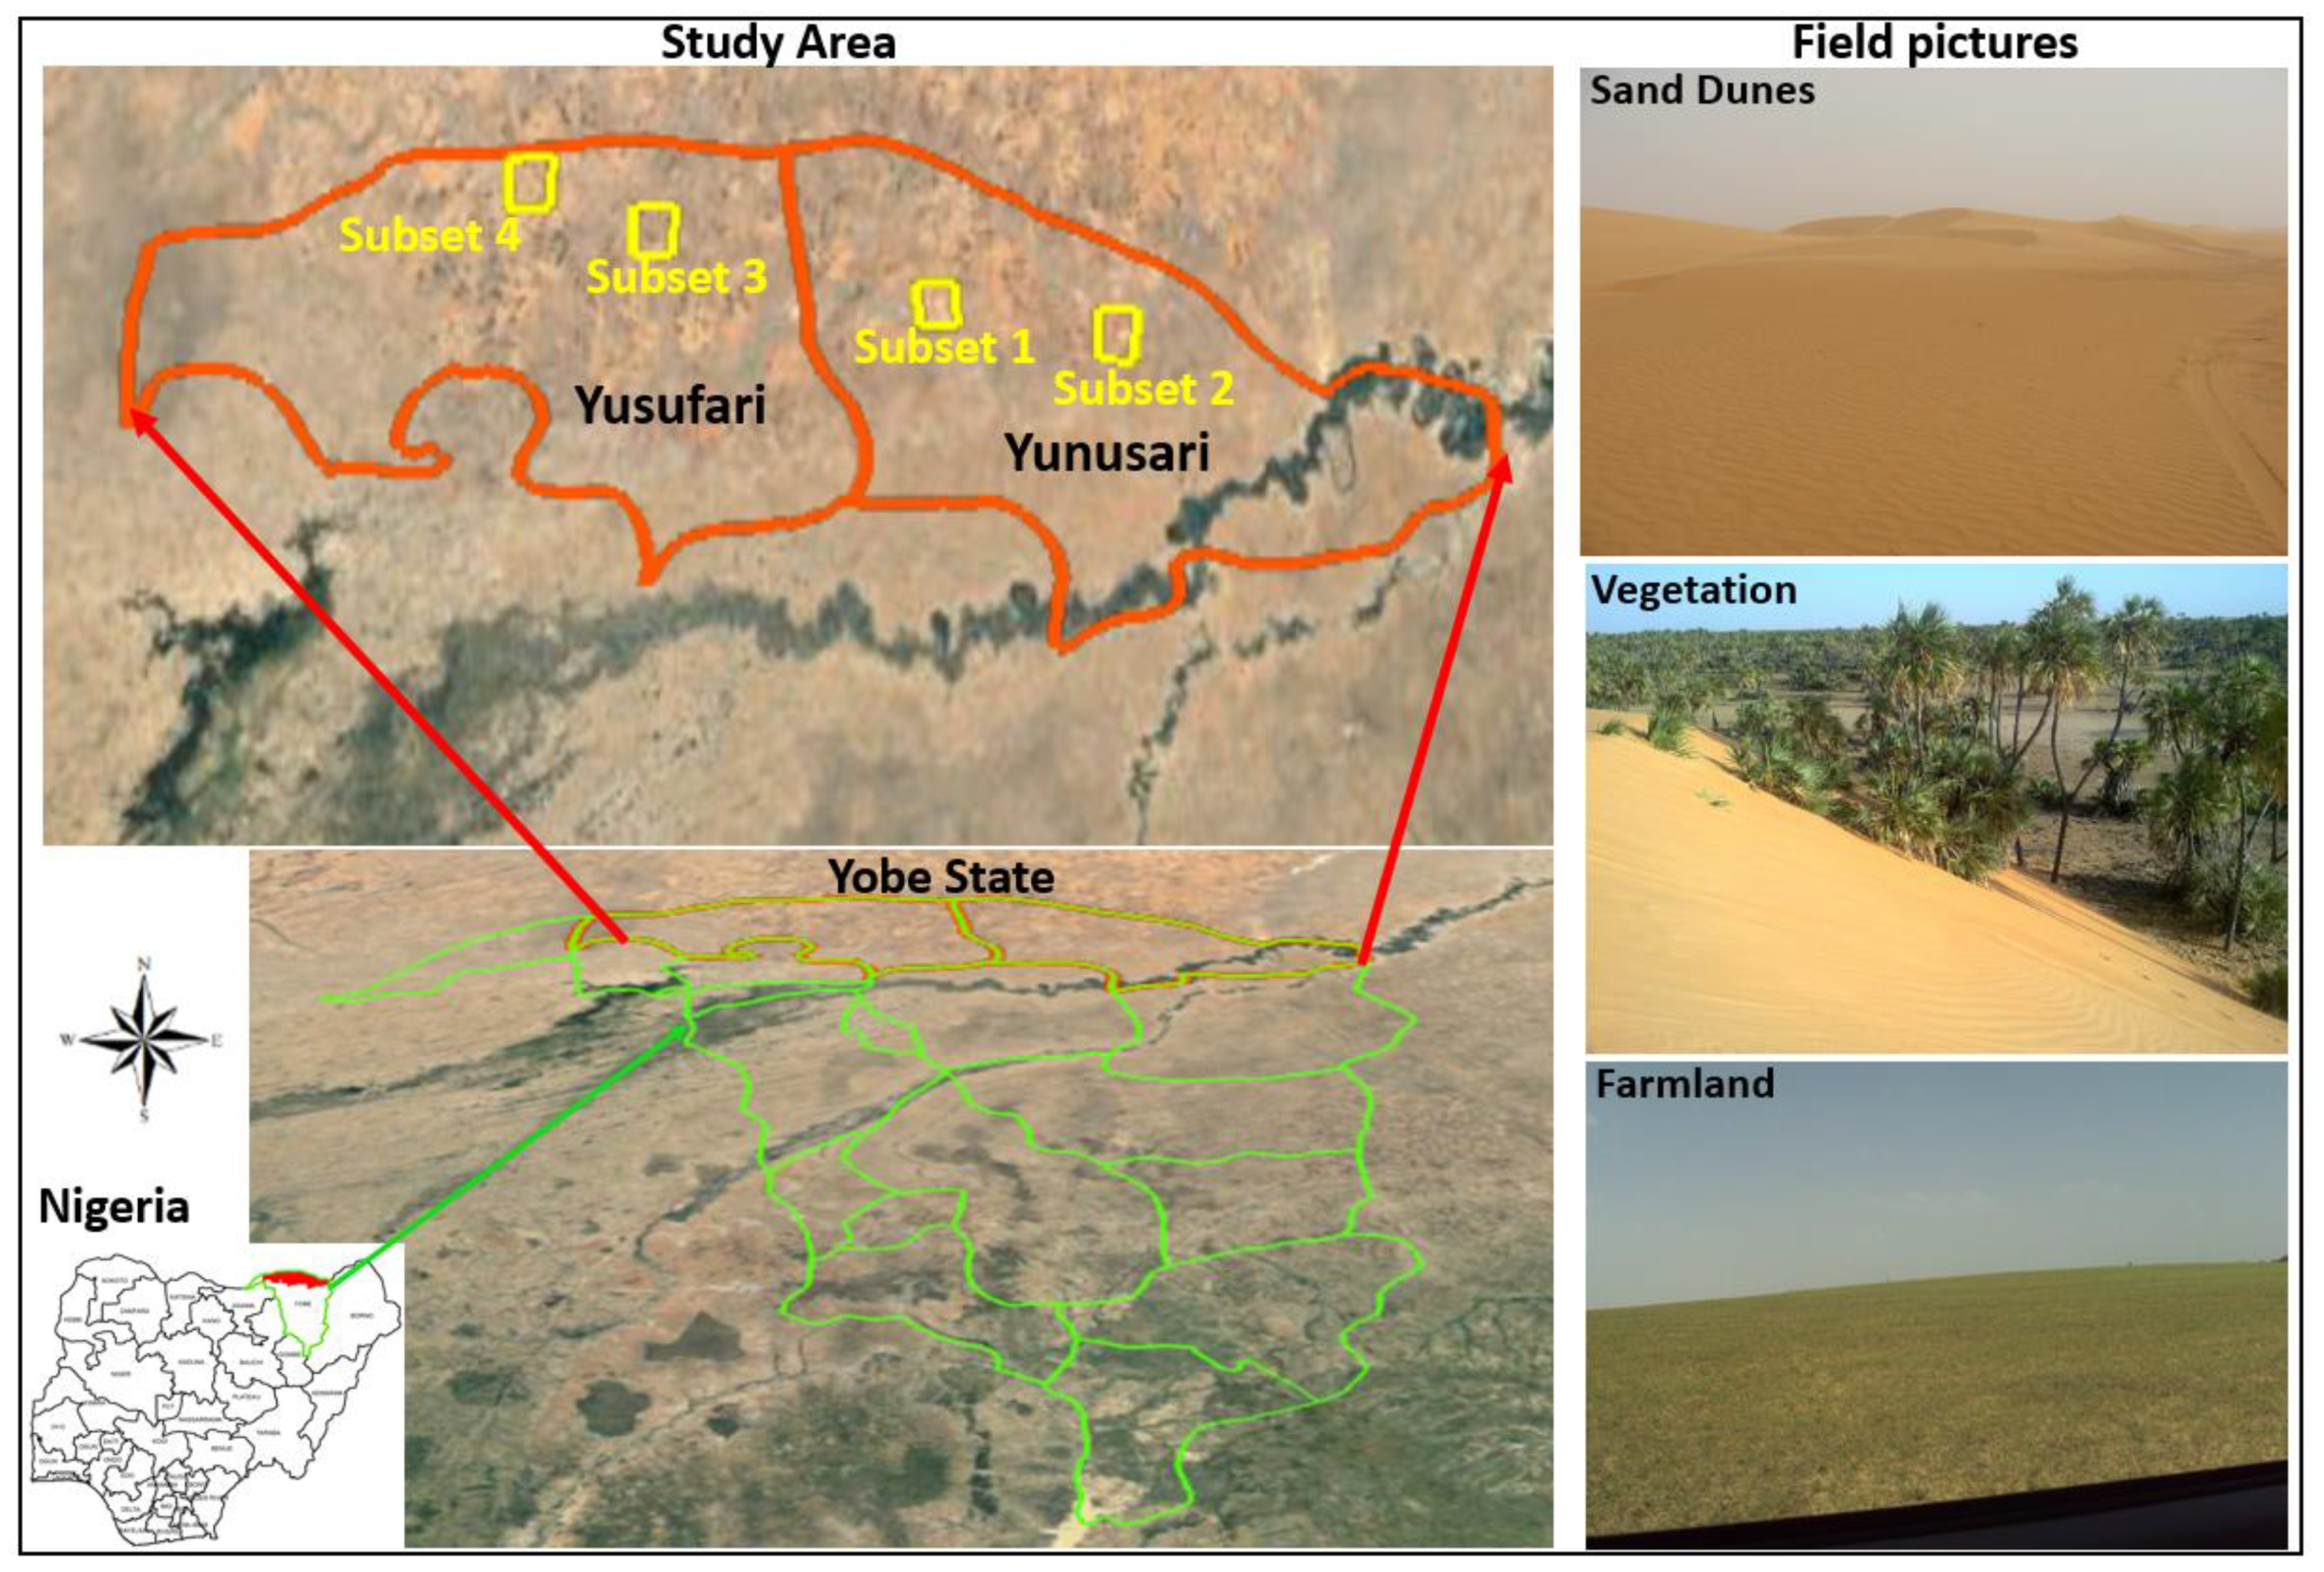
2.1. Study Area

The study area is the Northern parts of Yobe State located in the North-Eastern region of Nigeria and is one of the areas most affected by desertification in Nigeria [5,33]. The area covers Yunusari and Yusufari local government areas (LGAs) in the Northern part of Yobe State and lies between 12°50′ to 13°20′ N and 9°50′ to 12°24′ E. Yobe State shares local boundaries with the Borno, Jigawa, Bauchi and Gombe states, as well as an international border with the Republic of Niger to the North [11]. All its neighbouring states are very active desertification sites, except Bauchi State, with minor desertification influence. Yobe State has 17 LGAs which are all associated with severe cases of dune formation [5,33]. The most severe cases are found in the northernmost parts of Yobe State in the Yunusari and Yusufari local government areas, hence our choice of the two LGAs as a case study (Figure 1). The terrain consists of undulating plains, with elevations ranging from 322 m to 355 m (see: https://en-ng.topographic-map.com/maps/ghff/Yobe/ (accessed on 20 March 2019)). The geological composition is predominantly crystalline and sedimentary rocks underlain by basement complex rocks [5].
According to the Köppenen climates classification, the study area falls within dry climates of warm semi-arid (BSh) subtypes, where the annual daily mean temperature is about 37°C. The hottest months are March, April and May, with maximum temperatures of about 42°C usually experienced in April; and August and December are the coolest months, with minimum temperatures of about 30 °C recorded in December [5]. Rainfall variability is vital for crop growth and development and is also a determinant of crop distribution [18]. There is also variability in rainfall patterns; rainfall lasts for about 120 days in Northern Yobe (our study area included) and more than 140 days in the Southern part of the State [33] with an average annual rainfall of between 160–500 mm. This gives rise to two distinct vegetation zones (Figure 1) in the case study area, which is covered by Sahel Savannah vegetation to the North, and the Southern part covered by Sudan Savannah. The major types of natural vegetation are predominantly scattered Acacia spp., silk cotton, date palm (Phoenix dactylifera), baobab (Adansonia digitata) trees and different species of short grasses [12]. Most of the soils in Yobe State are derived from drift silt clay or clayey materials, which vary in textural characteristics [14]. The profile of the soils is poorly developed, with low water retention capacity, which makes it easily erodible by the wind. According to the 2006 population record, there are about 178,700 in Yunusari and 157,100 people in Yusufari (see: https://www.citypopulation.de/php/nigeria-admin.php?adm1id=nga036 (accessed on 20 March 2019)). The major economic activities of the local people include farming, fishing and livestock production (for meat and dairy); this employs over 80% of the population and constitutes their major source of income [36,37].

2.2. Data and Pre-Processing

Landsat TM (1990) Path 186, Row 051 and Path 187, Row 052, Landsat ETM (2000) in GeoTIFF format of dry seasons were downloaded for free from the United States Geological Survey department via the link (earthexplorer.usgs, accessed on 8 March 2022). These imageries were mosaicked in Erdas Imagine version 9.3. NigeriaSat-1 (2010), and NigeriaSat-X (2015) satellite imageries were also used. NigeriaSat-1 (32 m) and NigeriaSat-X (22 m) data were resampled to 30m (Landsat data resolution) for spatial consistency and overlay purposes. Radiometric was carried out using the haze and noise reduction tools, while atmospheric and geometric corrections were carried out using the ATCOR-II model in Erdas Imagine version 9.3 so as to improve data quality. Both Landsat and NigeriaSat images were orthorectified, in GeoTIFF format and in geographic WGS 84 (EPSG 4326) but we projected to WGS 1984/UTM zone 32N–Minna Datum (EPSG 32632).
We accessed annual rainfall and temperature data (1990 to 2015) from the climate archives of the Nigerian Meteorological Agency (NIMET). The data is for the Nguru weather station, which is the ground station nearest to Yunusari and Yusufari. We also downloaded the NDVI data of the Moderate Resolution Imaging Spectro-radiometer (MODIS). The NDVI data is in 250 m spatial resolution and was downloaded for 15 years time-stamped (available only from 2000 to 2015). Information regarding this data can be accessed from the MODIS website (https://modis.gsfc.nasa.gov/data/dataprod/mod13.php (accessed on 10 February 2022)) or other remote sensing portals (e.g., GEE).

2.3. The Generation of Reference Data

Field data collections in regions such as our study area are reported to be expensive and tedious and likewise risky, as they fall within some of the world’s insecure regions [38,39]. In the recent past, studies were focused on generating training and reference data from auxiliary sources to reduce tedious and expensive fieldwork [40,41,42,43]. They reported significant successes in generating digital and unorthodox reference data. Commonly Google Earth images are used for generating reference samples [40,43,44]. Studies have reported the capability of auxiliary (secondary) data for training and validating maps as a crucial tool in the development and interpretation of remote sensing data, especially in countries like Nigeria, where fieldwork is becoming increasingly risky, aggravated by security challenges. We tested the capability of axillary data sets for training and validation of land cover classification of this heterogeneous landscape in Nigeria using expert knowledge and Google Earth image for 2000 and 2010, while we collected field data for the 2015-time stamp.

2.4. Land Cover Mapping and Accuracy Assessment

Land cover maps of the study area were produced for all satellite imageries using the conventional supervised classification method and maximum likelihood algorithm [45,46,47,48] and recommended for Sub-Saharan Africa [42]. This method uses sufficient training data to prevent skewed dimensionality, while also enabling the production of relatively fast and robust classification results [49]. Land cover classifications were produced using Erdas Imagine version 9.3. The land cover classes mapped for the study area include wetland and oasis, farmland, built-up, bare land/sand dunes, and vegetation. Our class “vegetation” captures leafy and thorny shrubs, tall grasses, orchards, natural trees and plantations, while the “farmland” class includes irrigated and rainfed agricultural activities; both are small scale, intensive and extensive cultivations. The 2010 land cover map (produced from NigeriaSat-2 satellite imagery) was validated using sample points generated from high-resolution data (Google Earth). A total of 170 sample points were extracted across all five classes to perform the accuracy assessment and an accuracy of 89% was achieved. For the 2015 land cover map, we conducted fieldwork in the year 2016 for this validation using the good practice methods proposed by Olofsson et al. [50]. A total of 308 points were collected from the field and the distributions of the random samples are shown in Table 1. An accuracy of 81% was achieved for the 2015 land cover map (See Table 1). We assumed that the earlier land cover maps (1990 and 2000) had levels of accuracy close to the last two (2010 and 2015) because the same methods and algorithms were used to produce them.

2.5. Time Series Assessments and Projections

The trends of land cover change were assessed by performing cross analyses. Losses and gains in each land cover type were estimated. First, the change assessment began by crossing the land cover map of 1990 and that of 2015 to ascertain the total extent and trend of changes across the land cover classes over the 25 years period of study. Similarly, continuous bi-changes were tracked over time between 1990 and 2000, 2000 and 2010, 2010 and 2015.
The results of the land cover change analysis were used to perform a land cover probabilistic prediction, to project future land cover changes based on historical conversions between 1990 and 2015. The land cover probabilistic prediction was applied using a simple cellular automata algorithm, the Markovian transition estimator [51,52,53,54] incorporated in the Idrisi Selva software package [55]. First, the rate of change between the 1990 and 2000 land cover maps was used to predict 2015 land cover map characteristics. To validate the accuracy of the projections and calibrate the land cover prediction model, the prediction map (predicted 2015 land cover map) was correlated with the classified 2015 land cover map (the observed 2015 land cover map [56,57]). A significant Pearson correlation coefficient (r-value) of 0.79 was obtained from the overlay operation. The correlation coefficient is significant and indicative of the reliability of future projections based on the history and rates of observed land cover conversions. It is, therefore, safe to assume that the accuracy of forecasted projections is dependable and therefore acceptable for planning and policy purposes [56,57]. Following this, further extrapolations/projections for sand dune expansion for the years 2030 and 2045 were carried out, using the changes and trends between 2010 and 2015.

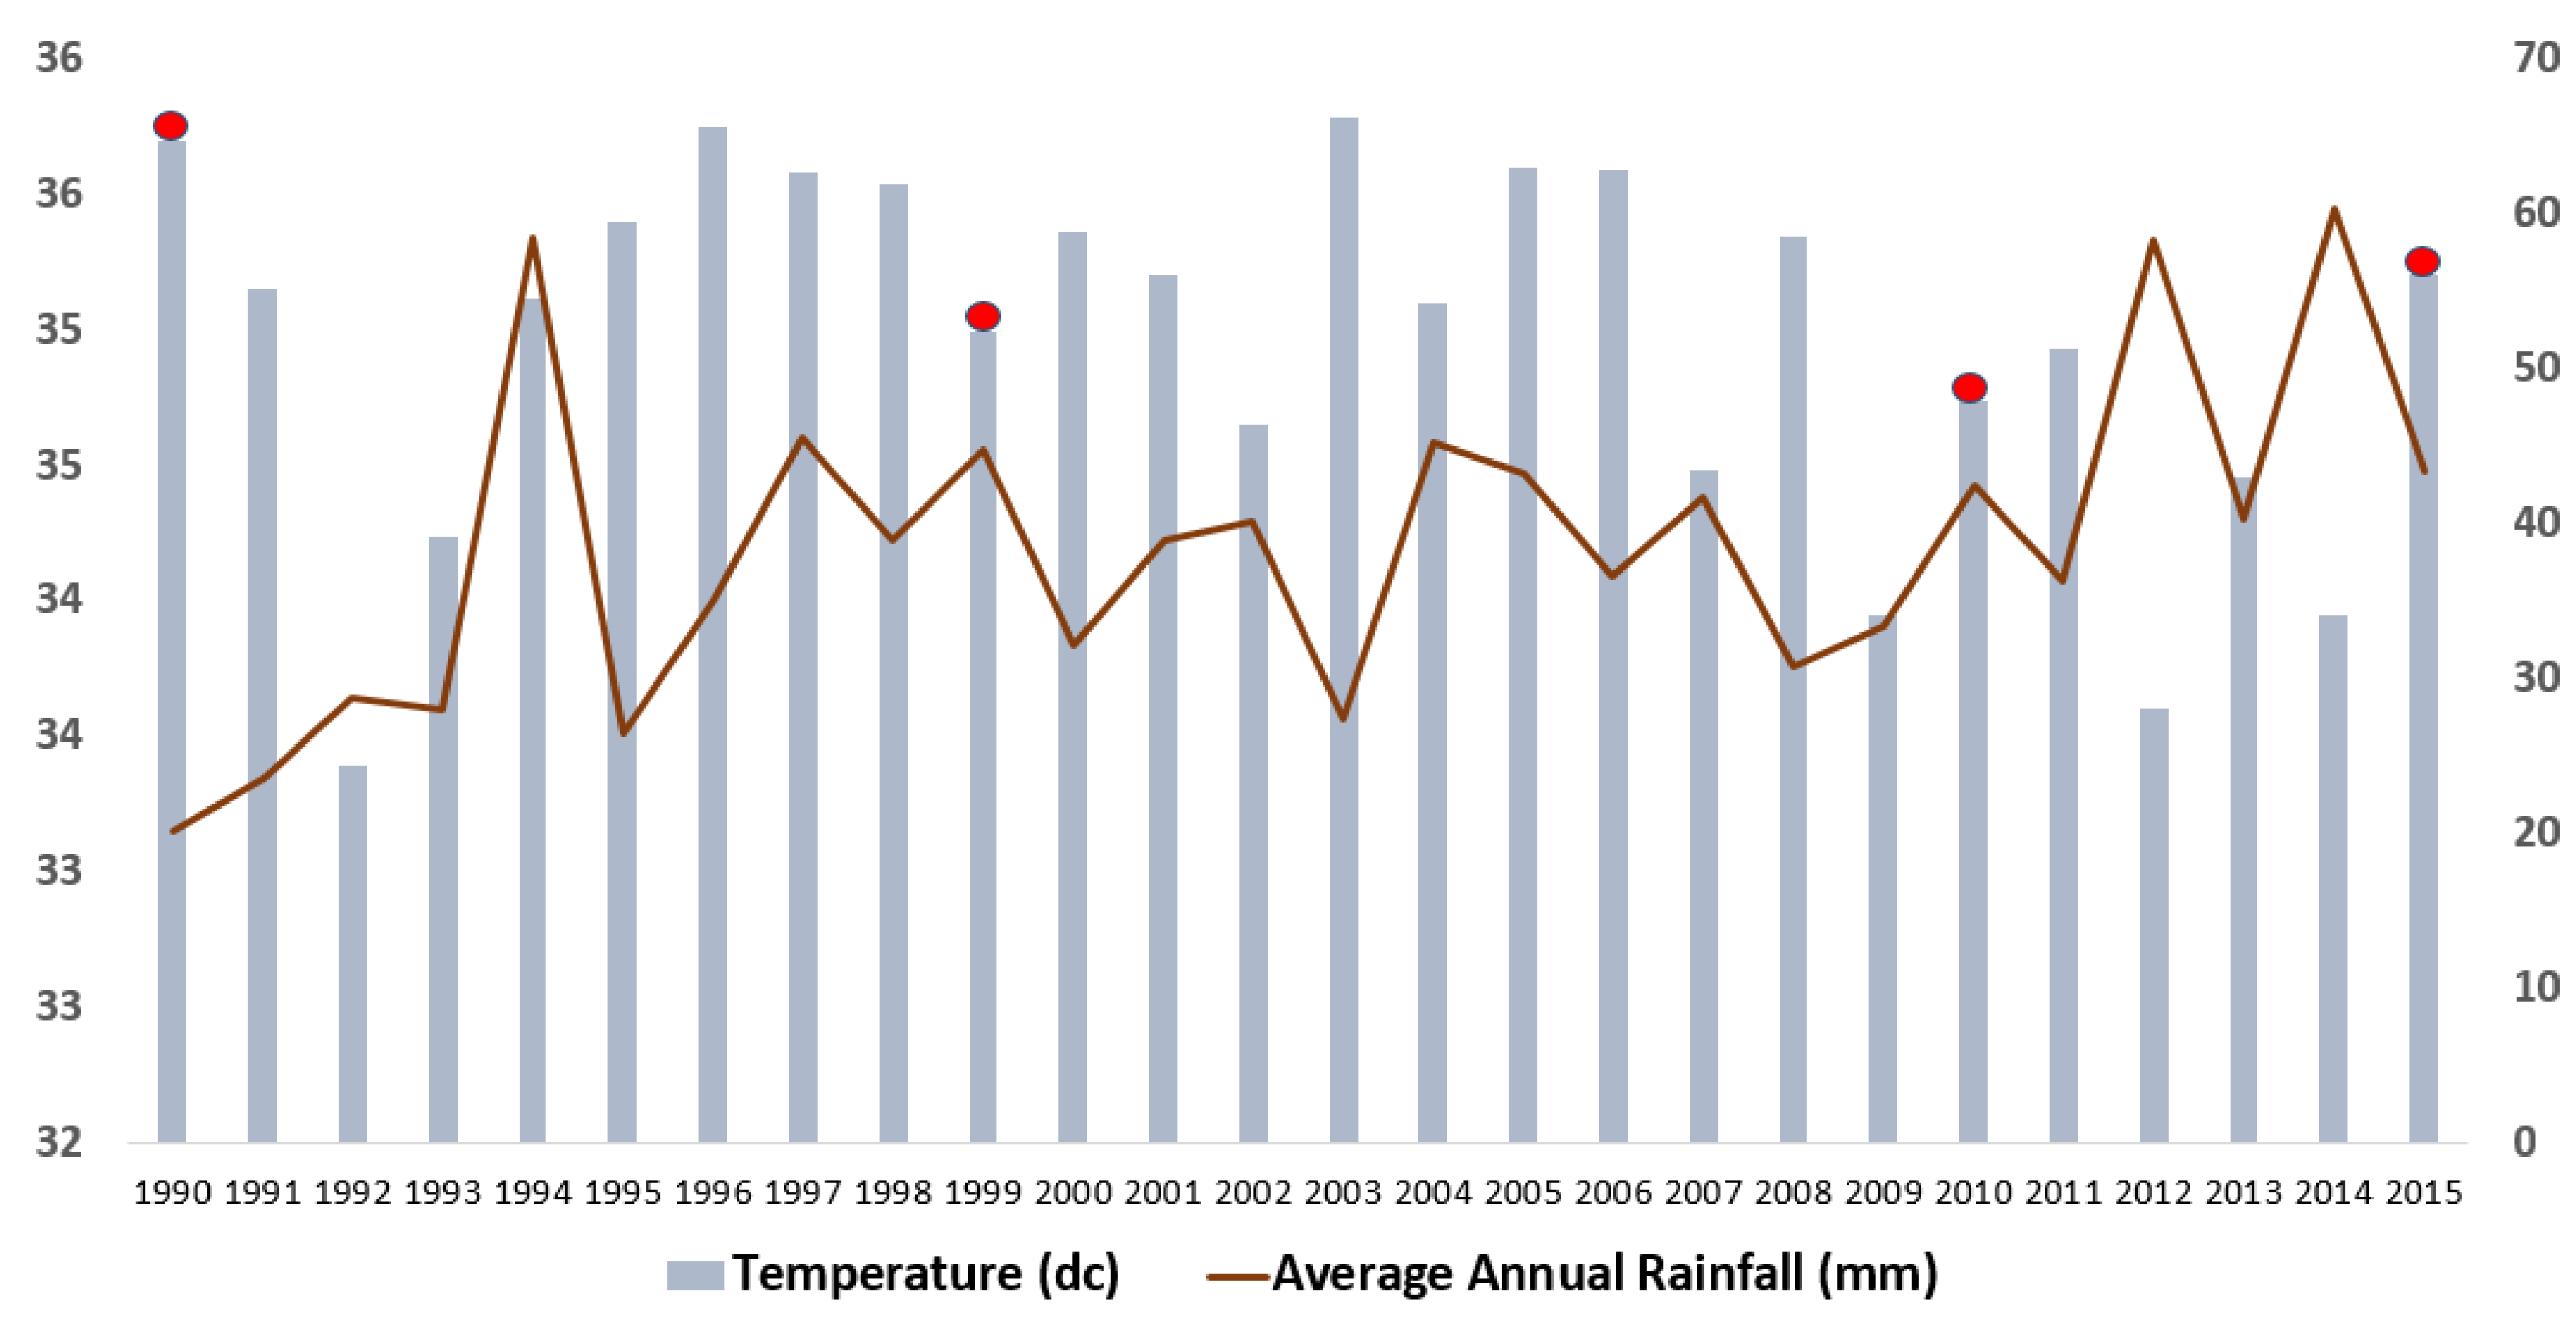
2.6. Climate Change and Land Cover Conversions

Finally, we compared climate records with land use/cover indicators using a simple linear regression model to evaluate the relationships or associations between climate change and desertification processes in the northern area of Yobe State, Nigeria. The indicators of climate change applied were climatic parameters such as the mean annual temperature and annual rainfall of the period investigated (i.e., 1990, 2000, 2010 and 2015). On the other hand, the indicators of desertification processes adopted for assessing the association between climate change and desertification were the changes in land cover area coverage of vegetation, sand dunes, as well as oasis and wetland, over the 25-year period considered. The analysis was achieved using the environment for statistical computing R versions 3.4.4.
The MODIS NDVI data was also used to further explore the relationships between the NDVI mean values and weather variables. The NDVI time series trajectory was performed to evaluate the mean annual distributions of NDVI, temperature and rainfall, highlighting stamps of correlation and deviations. The analysis was carried out using the environment for statistical computing R 4.1.2.
The summery of data, processes and methods described above are illustrated in Figure 2 below.

3. Results

3.1. Land Cover Changes from 1990 to 2015

The start year demonstrates a low concentration of built-up areas. Buildings and tarmacs covered only 2519 ha of the landmass, i.e., 0.3% of the total area (Table 2). The land cover map of subsequent years shows a consistent progression in the number of buildings through the time slices. By the year 2015, the built-up areas had increased drastically to about 7893 ha, which is about 1% of the total land area (Table 2, Figure 3 and Figure 4). The rate of built-up expansion however slowed down between 2010 and 2015. The reverse was the case for vegetation. There was a steady decrease in vegetation throughout the time slices examined. In 1990, vegetation occupied about 11.9% of the total area, with about 92,126 ha. This reduced to 75,409 ha in 2000 (9.7% of the study area). There was even a further decrease in 2010 and 2015, with 69,120 ha in 2010, and only 28,143 ha in 2015, representing 8.9% and 3.6% of total land, respectively (Table 1, Figure 3 and Figure 4).
A similar pattern of decline was observed for the wetland and oasis land cover class. In 1990, the wetlands and water oasis covered a total area of 56,563 ha (about 7.3% of the total area) (Table 2). Surprisingly, this increased by the year 2000 to about 57, 110 ha (about 7.4% of the total area). Nevertheless, there was a decline in 2010 and 2015. By the year 2015, wetland and oasis occupied 46,857 ha, representing about 6.1% of the study area.
Farmland remains the dominant land cover in the study area. It has consistently increased throughout the study period. In 1990, the farmland occupied about 591,175 ha (76% of the total land area). This progressed steadily to 621,410 ha by the year 2015, occupying 80.3% of the total land coverage (Table 2). Similarly observed, was a substantial advancement in sand dune features in the study area. Figure 5 shows the various degrees of sand dune progression in different locations across the study area (the location of subsets in the study area are shown in Figure 1). The coverage of sand dunes in 1990 was 31,369 ha, occupying only about 4.1% of the total area. This slightly increased within the next ten years to 35,663 ha, which is about 4.6% of the total landmass. Unexpectedly, there was a major increase over the second decade (2000–2010) when about 41,732 ha of land (about 5.4% of land area) was covered by sand dunes (Table 1, Figure 4 and Figure 5). More surprising, the progression over the next five years (2010–2015) almost doubled, with about 69,462 ha of land (up to about 9% of the total landmass) occupied by sand dunes. On average, our results reveal that the sand dune in the study area is progressing at a mean annual rate of 1524 ha (i.e., 15.2 km2).

3.2. Land Cover Conversions from 1990 to 2015

The largest conversion of land cover within the 25-year study period was from vegetated land to farmlands (about 62,411 ha; Table 3 and Figure 6). Only 394 ha of vegetated land was converted to built-up. About 331,412 ha of wetland and oasis have remained unaffected over the study period, while 996 ha of wetlands and oasis were converted to vegetation. Another noteworthy conversion is 17,270 ha of sand dunes to farmlands. Furthermore, only 0.2 ha of land has been converted from built-up to sand dunes.
Within the 25-year study period, 519,371 ha consistently remained farmlands. An area of 21,782 ha of vegetation and 33,142 ha of wetland and oasis also did not undergo a change in nature or characteristics. Furthermore, 2419 ha remained built-up, while 13,656 ha were consistently sand dunes (Table 3 and Figure 6). Likewise, about 54,455 ha of land was converted from farmland to sand dunes and 72 ha of sand dunes were converted to vegetation. Conversely, 1013 ha of vegetation were also converted to sand dunes, implying that there was more deforestation compared to afforestation.

3.3. Relationship of Land Covers Conversions and Climate Parameters between 1990 and 2015

The distributions of the mean NDVI values, with peaks, demonstrate a graduating decrease, especially from 2008 to 2015 (Figure 7). NDVI is a common vegetative index, it is used to estimate the density of greenness over a given land area. NDVI values are between +1 to −1, with the positive values 0–1 usually associated with vegetative surfaces, while vegetative values correlate with bare surfaces, water and built areas. With an increase in rainfall, our NDVI peak values should reflect a steady increase; however, this is showing a reverse, revealing a decrease in the later years when the rainfall pattern had increased in the region (Figure 7A). The curve in Figure 7B demonstrates a large standard deviation from 2008 to 2015, clearly revealing the disassociation between mean rainfall, temperature and NDVI peaks (vegetated surfaces). The decrease in vegetated areas and increase in bare surfaces cannot, therefore, be attributed to weather variables. The results of our NDVI trajectory pattern agree with our land cover analysis and statistical results.
We observed that the rainfall pattern in the study area changed from a total annual rainfall of 250 mm–350 mm from 1980–1993 to 340 mm–641 mm from 1994 to 2015 (Figure 8). Decreasing annual rainfall and increasing annual temperature trends in the study area were subsequently reversed to an increase in rainfall and lower temperatures, especially in 1994, 2005, 2012 and 2014. This trend of climate parameters compared with the rate of desertification during this period should have implied positive feedback for afforestation in the study area.
A statistical analysis of climate change and desertification indicators (using simple linear regression modelling) also suggests that over the study period (1990–2015), there was a weak or no relationship or association between climate change indicators and desertification indicators (namely declining vegetation, increasing sand dune formation and receding oasis and wetlands) (Figure 9A–E). Likewise, non-significant p-values are recorded, indicating lacking association across all climate change and desertification indicators in the Yunusari and Yusufari regions of Yobe State. The decrease in mean annual temperature had weak or no relationships with desertification trends represented by land cover/land use indicators, such as decreasing vegetation cover, intensified sand dune development and shrinking oasis and wetlands (Figure 9A,C,E). Results from this study also suggest that there is a weak or no relationship between an increase in the average annual rainfall amount and shrinking oasis and wetlands (Figure 9F). Although there is a strong positive relation between rainfall and all desertification indicators, this relationship, however, is negative, reflecting a decrease in wetland/oasis while rainfall increased, likewise vegetation. Likewise, an increase in rainfall did not translate to a decrease in sand dunes and bare lands.
Likewise, the distributions of the mean NDVI values, with peaks showing a graduating decrease, can be observed, especially from 2008 to 2015 (Figure 8, see also Figure 2). NDVI is a common vegetative index and is used to estimate the density of greenness over a given land area. NDVI values are between +1 to −1, with the positive values 0–1 usually associated with vegetative surfaces, while vegetative values correlate with bare surfaces, water and built areas. With an increase in rainfall, our NDVI peak values should reflect a steady increase, however, this is showing a reverse, revealing a decrease in the later years when the rainfall pattern had increased in the region (Figure 7A, see also Figure 2). The curve in Figure 7B displays a large standard deviation from 2008 to 2015, clearly revealing the disassociation between mean rainfall, temperature and NDVI peaks (vegetated surfaces). The decrease in vegetated areas and increase in bare surfaces cannot, therefore, be attributed to weather variables. The results of our NDVI trajectory pattern agree with our land cover analysis and statistical results.

3.4. Land Covers Probabilistic Projections for 2030 and 2045

Having observed past land-use conversions, the land cover change between 2010 and 2015 was used to project future probabilistic land cover conversion (2030 and 2045). This is based on the assumption that management and socio-economic practices remain the same (i.e., business as usual scenario). The probability that the land cover indicators sensitive to desertification in the study area will become desert by 2030 is very low with a prospect value of 0.13 for farmland areas, a value of 0.10 for vegetated areas and 0.03 for oasis and wetland areas (see Figure 10). Although, in the second projection for the year 2045, the likelihood that most of the farmlands might be converted to deserts increased to 0.18. The probability for most of the vegetated areas to be converted to sand dunes increased to 0.14, while that for oasis and wetland increased to 0.12.

4. Discussion

4.1. Land Cover Changes from 1990 to 2015

The results depict major land cover changes over the 25 years study period. The land cover start year (1990) coincides with the year Yobe State was carved out of Borno State, and Yunusari LGA was created. This period (1990) was characterised by a low concentration of built-up areas, as also revealed in our land cover map. The areas classified as buildings and tarmacs (built-up) in subsequent years demonstrate consistent progression. The rate of built-up expansion however slowed down between 2010 and 2015. This can be attributed to many factors, including desertification, insecurity and emigration (i.e., the Boko Haram insurgency/conflicts), and other associated socio-economic challenges at this time. Although, the reverse was the case for vegetation, with a consistent decrease throughout, especially from 2010 to 2015 (Table 1, Figure 3 and Figure 4). This period coincides with the years of security challenges in the state. Insecurity might have led to a neglect of the building sector. However, the massive reduction in vegetation cover over this same period is not unexpected, as poor residents will depend on the environment for their survival. This is in line with observations from other studies by [5,32], also reporting a decrease in vegetation in Yobe State.
A similar pattern of decline was observed for the wetland and oasis land cover class. Looking at the climate records (Figure 7 and Figure 8), this can be attributable to a slight increase in rainfall and decrease in temperature in the period, especially for the years preceding 1999 and 2000 (see Figure 7 and Figure 8). This is also in line with findings reported by Gadzama and Ayuba [12]; they also observed a drastic reduction and shrinking of wetlands and water bodies over the same periods. They attributed this to fluctuations in rainfall patterns, as well as an over-exploitation of surface water and groundwater for irrigation purposes.
Conversely, farmland remains the dominant land cover in the study area, with a consistent increase throughout the 25 years study period (see Figure 4 and Figure 5 and Table 2). This finding also corresponds with results from other studies [5,32]. Musa, [5], particularly asserted that intensified agricultural activities are the major factor influencing and aggravating desertification in the study area.
Another significant advancement is in the sand dune and bare areas; rising from only 4.1% of the total land area in 1990 to 4.6% in 10 years (2000), further increasing to 5.4% in another 10 years (2010) and surprisingly, 9% over the next 5 years (2010–2015). Elijah et al. [34], also using satellite data analysis, reported a drastic increase in sand dunes in the study area between 2010–2013. Cumulatively, our results demonstrate that sand dunes and bare areas over the 25 years study period have more than doubled from the start year. At this rate, it can be inferred that sand dunes may cover about 20% of the landmass by the year 2040. This implies that up to 130,000 ha of land might become desert if socio-economic activities and management practices remain the same and if the current no-policy framework persists. The Federal Ministry of Environment [15] similarly reported that between the period of 1976/1978 and 1993/1995 (19 years period), sand dunes increased by approximately 17% from 820 to 4830 km2. On average, our results reveal that the sand dune is progressing at a mean annual rate of 1524 ha (about 15.2 km2) in the study area. This corresponds with other findings, placing the annual estimated progression rate of desertification in the Sahara region at about 0.6 to 35 km per year [14,58].
While there is a consensus on the continuous advancement of dunes in the study area, different studies attributed the phenomenon to a variety of plausible causative factors. Amadi et al. [32] reported that the main cause of desertification in Yobe State is high solar radiation and pore space reduction in soils as a result of the trampling effects of overgrazing. However, they also attributed the aggravation of dune formation to insufficient rainfall and wind erosion. This calls for the intensification of government efforts aimed at reducing the spread and escalation of desertification in Nigeria. Though over the years, there have been combined efforts by international and regional organisations in combating desertification globally. According to the United Nations (UN) reports, an estimated USD 45 billion is disbursed annually in missions and programs to fight desertification [59]. There are also local and international efforts in Nigeria. In 1994, Nigeria signed the UN Convention to Combat Desertification, with national efforts to combat desertification in the affected areas. This includes the Arid Zone Afforestation Project (AZAP), the River Basin Development authorities (the RBDA, and the Federal and State Environmental Protection Agencies (FEPA/SEPA), and recently, the famous Great Green Wall Project [11]. Although reports have shown promising progress in combating desertification in many frontline states, e.g., the Sokoto, Katsina and Kano states [12], the appraisals that suggest such progress were in 1989. There is a need to update these progress reports, by using ground and remote sensing data and technologies. A general estimate of vegetative cover, provided by FORMECU in 1990, gave critical evidence of the serious vegetation changes and biodiversity loss, particularly in the northern part of Nigeria. This provided insights and forewarnings on the increasing magnitude of the problems of desertification in Nigeria. This is consistent with recent studies, as well as the results of our remote-sensing-based analysis. Other factors contributing to the exacerbation of desertification include a weak participation of different stakeholders in the decision-making and decision-taking value chains, poor regulation enforcement, as well as low budget allocation and financial commitment toward combating desertification and other environmental-related disasters [12]. If not properly addressed, it can lead to a further loss in biodiversity and species extinctions, reduced agricultural yields, higher unemployment and rural poverty rates, as well as a rise in social vices and civil conflicts (e.g., kidnapping, armed robbery, religious extremism, insurgency, land/territory grabbing, etc.), as reported in similar regions of the world [15], and which is currently escalating in Yunusari and Yusufari and other similar desert regions in Nigeria.

4.2. Land Cover Conversions from 1990 to 2015

The most significant land cover conversions under the study period and study area were from vegetated land to farmlands (Figure 6 and Table 3). Implying that inhabitants convert vegetated lands to farmlands for crop cultivation because these areas are perceived to be more fertile. Very few (394 ha) vegetated areas were converted into built-up areas. This is due to vegetation often serving as a shelter, carbon sink, sources of oxygen, and windbreaks around areas of human habitation in most settlements in Sub-Saharan Africa [60]. Most residents, therefore, do not remove trees during residential construction.
Wetlands and oases have remained largely unchanged from 1990 to 2015 (about 331,412 ha), however, about 996 ha of wetlands and oases were converted to vegetation. This might have been a product of natural regrowth as a result of favourable growth conditions (i.e., availability of water) or drying water bodies replaced by vegetation. Surprisingly, 17,270 ha of sand dunes was converted to farmlands. This is in line with our field observations in 2016, as we observed farming efforts on degraded lands. Moreover, according to Musa, [5], locals still make efforts to cultivate degraded lands/sand dunes as a result of poverty. This finding aligns with assertions by other scientists who claim that populations inhabiting degraded lands in developing nations live in abject poverty and depend largely on the natural environments [61]. About 0.2 ha was converted from built-up to sand dunes. This suggests that there is an abandonment of settlements and migration as a result of desertification and associated security challenges in the Yusufari and Yunusari area of Yobe State, Nigeria.
Within the 25-year study period, farmlands remained consistent, likewise, wetlands and oases did not undergo significant changes in nature or characteristics (Figure 6 and Table 3). In line with previous findings, a significant proportion of land was found to have been converted from farmland to sand dunes (54,455 ha). Musa, [5] reported that intensified agricultural activities are the major cause and escalator of desertification in the study area. Amadi et al. [32] and Mansur and Ismail [33] also reported that sand dune advancements were more rampant across a large expanse of agricultural farmlands and grazing lands. On a positive note, significant portions of sand dunes were converted to vegetation (72 ha), indicative of the progress of the various international, national, local and individual afforestation efforts. On the other hand, 1013 ha was converted to sand dunes, indicating greater deforestation compared to afforestation efforts. This may partly have been associated with the reliance of local communities in Nigeria on biomass as cooking energy. The inhabitants of the Yusufari and Yunusari communities mostly engage in farming, hunting, nomadic cattle rearing and fishing for their livelihoods. Most of these economic activities depend on the surrounding vegetated environment and landscapes. This further accelerates environmental degradation, food insecurity and poverty [61,62]. Furthermore, the lack of strict and enforceable land-use guidelines, as well as the low impact of previous international, national and local desert mitigation efforts, also play a role in Nigeria’s worsening desertification [16].

4.3. Relationship between Land Cover Conversions and Climate Parameters between 1990 and 2015

The meteorological records of the study area show a decline in temperature and an increase in annual rainfall in 1994, 2005, 2012 and 2014 (Figure 8). This trend of climate parameters, compared with the rate of desertification during the timestamps we analysed, should have implied positive feedback for afforestation in the study area. However, the reverse was the case, as there was further expansion of sand dune features. Expected reduced air and soil dryness from reduced temperature and increase rainfall did not translate to favourable conditions for natural vegetation regrowth. Likewise, the statistical analysis of climate parameters and desertification indicators also suggests that there was a weak or no relationship or association between climate change indicators (Figure 9). Even though the high R2 values obtained in Figure 9B,D may want to suggest that an increase in average annual rainfall could be responsible for vegetation loss and the advancement of bare surfaces/sand dunes under the arid conditions in the study area, in reality, this defies logic and is geomorphological unlikely or almost impossible from a geological point of view. While an increase in the average annual rainfall amount could be associated with vegetation loss and an increase in bare surfaces/sand dunes features in wetter regions with potentially higher run-offs and greater risks of rainfall-induced erosion, in arid regions with low rainfall, little or no run-offs and significantly high evapotranspiration rates, this is unlikely to be the case.
Our statistical results also suggest a weak or no relationship between an increase in the average annual rainfall amount and shrinking oasis and wetlands (Figure 9F). Actually, the opposite should be expected geologically or geomorphological, i.e., an increase in the average rainfall amount should recharge and extend the coverage of oasis and wetlands and not shrink it. Going by the observed mismatch between the results of the statistical analysis and prevailing geological and geomorphological understandings, we may want to infer that climate change is not the most important driver responsible for desertification in the study area and region. Although we used only four stamps within the 25-year time span in the study for repression, the climatic records reveal a general rise in rainfall within the entire 25-year period. We, however, assessed mean NDVI from 2000 to 2015 and the results of the NDVI likewise demonstrate a decline in the peak vegetative trajectories and also suggest that climatic parameters do not explain or account for desertification in the study area (Figure 7). This also aligns with claims by Musa [5] that desertification in Yobe State is not due to climatic elements alone but also due to human factors, such as over-cultivation, overgrazing, deforestation, tree felling, poor land use, etc. According to Gadzama and Ayuba [12] and Apata et al. [16] desertification may also be influenced by other factors, such as a lack of local awareness, absence of a political will and paucity of funding to support land reclamation and anti-desertification programs. It is important to also note that desertification can be further worsened by poverty, population increase and deliberate government policies, which also put immense burden and pressure on fragile landscapes and ecosystems [62], especially under climate change. In view of the highlighted remote sensing results, visualized climate records, statistical analysis and previous publications on the subject matter, it can be inferred that desertification in the study area is less a function of climate change and more a product of human activities driven by poverty and population growth. In light of the poverty and population growth issues in Nigeria, McCormick [2] brought to focus that environmental problems do not only result from unsustainable development initiatives and implementations alone, but also from the rapid increase in population and poverty. This often led to rural agriculturalists abandoning resource management practices and over-exploiting environmental resources accessible to them for the sustenance of livelihoods. In general, despite several intervention efforts in the past (from United Nations Environmental Programme (UNEP), Arid Zone Afforestation Project (AZAP), the River Basin Development Authorities (RBDA), Federal/State Environmental Protection Agency (FEPA/SEPA), and the Great Green Wall Project, etc.), our findings and other reports show that desert encroachment has only increased in the study area, and is gradually reaching proportions that should be considered as a major ecological disaster and a threat to the nation’s economy [63,64,65,66].

4.4. Land Cover Probabilistic Projections for 2030 and 2045

The probabilistic land cover projections of the area show a high likelihood of farmlands converted to sand dunes by 2030, and a very low threshold of increased desertification within the vegetated, oasis and wetland areas (see Figure 10). However, projections for 2045 show an increased probability of farmlands converted to sand dunes, and likewise, vegetated areas, oasis and wetlands becoming sand dunes. These probabilistic projections raise the need for more effective intervention programs.

5. Conclusions

The three major indicators of increasing aridity, namely the expansion of sand dunes, declining vegetation cover, and shrinking of wetlands and water bodies, have intensified in the study area over the 25-year study period analysed. The coverage of sand dunes has more than doubled from the start year. At the current rate, it can be inferred that sand dunes may cover about 20% of the present landmass of the study area by the year 2040. This implies that up to 130,000 ha of land might become sand dunes if the socio-economic activities and management practices remain as usual and if the current no-policy framework situation persists. Given the highlighted remote sensing results, NDVI time series trajectory, reconciled climate records, statistical analysis and previous literature, it can be inferred that desertification in the study area is less a product of climate change and more a function of human activities and factors leading to the conversion of land cover, e.g., unsustainable agricultural practices, such as the over-cropping of marginal or fragile land, overgrazing, poverty, population pressure and poor government policies. However, we strongly recommend further studies, with very comprehensive annual assessments of remote sensing data, climatic, socio-economic and land cover indicators using advanced machine learning approaches to highlight the local causes of desertification in the desertification front line states in Nigeria and other parts of Sub-Saharan Africa. Previous efforts at tackling deforestation in the study area have not yielded significant results. Further community engagement and participation in the afforestation and reforestation projects, and poverty alleviation programs (diversification) are needed to combat aridity in this region. Choices of native species that will enhance biodiversity on the one hand, and also take care of long-term local food, grazing reserve and energy security needs, should be guided by an understanding of the local and regional landscape ecology of the region. Examples of such previously identified woody species include Acacia senegal, Acacia nilotica, Balanite aegyptiaca, Callotropis procera, Azadirachta indica and Jatropha curcas. Suitable grass species may include Guinea grass, Pennisetum spp., Elephant grass, etc. To mitigate the pressure on the fragile vegetation in the study area, more efforts should be directed toward the establishment of woodlots, shelterbelts and grazing reserves. The adoption of agroforestry and sustainable energy-saving stoves will also help meet energy security needs and reduce pressures on the already sparse vegetation systems. The adoption of sustainable energy-saving stoves by women (e.g., Sosai energy) is particularly crucial in reducing fuelwood consumption and combating desertification, as the role of women is vital in sustainable environmental management [67]. The study area and Sahel region as a whole should be delineated as an emergency disaster zone, with intervention projects assigned strong priority in government budgeting cycles. This is because the area is one of the nation’s food baskets. Growing insurgency and armed conflicts in this area, migration and abandonment of settlements, and the crippling of one of the nation’s food baskets are significant consequences that accompany an increase in sand dune development. Combating desertification should therefore be assigned top priority in national planning. A review of current land hold and conversion trends, as well as the enactment of local and regional legislation and policies for addressing indiscriminate land use change, also need to be prioritised.

Author Contributions

Conceptualization, E.S.I., B.A. and S.B.S.; methodology, E.S.I., J.B.A. and B.A.; software, E.S.I.; validation, E.S.I., J.B.A. and B.A.; formal analysis, E.S.I., J.B.A., O.T.A. and B.A.; investigation, E.S.I., J.B.A., M.I.M., H.A.S. and B.A.; resources, B.A., B.A.D. and S.B.S.; data curation, E.S.I., J.B.A., M.I.M. and B.A.; writing—original draft preparation, E.S.I.; writing—review and editing, E.S.I., J.B.A., O.T.A., B.A.D., M.I.M., H.A.S., S.B.S. and B.A.; visualization, E.S.I., J.B.A., O.T.A. and B.A.D.; supervision, H.A.S., S.B.S. and B.A.; project administration, B.A. and S.B.S. All authors have read and agreed to the published version of the manuscript.

Funding

This research received no external funding.

Informed Consent Statement

Not applicable.

Data Availability Statement

All data supporting reported results and sources are as described in the manuscript.

Acknowledgments

The authors wish to acknowledge the contributions of the anonymous reviewers of this manuscript for their advice in improving the paper.

Conflicts of Interest

The authors declare no conflict of interest.

References

  1. Bauer, S. The Role of Science in the Global Governance of Desertification. J. Environ. Dev. 2009, 18, 3. [Google Scholar] [CrossRef]
  2. Johnson, P.M. Governing Global Desertification: Linking Environmental Degradation, Poverty and Participation; Ashgate Publishing: Farnham, UK, 2006; ISBN 978-0-7546-4359-3. Available online: https://books.google.de/books/about/Governing_Global_Desertification.html?id=da6vhzHEpf0C&redir_esc=y (accessed on 15 March 2019).
  3. Holtz, U. Implementing the United Nations Convention to Combat Desertification from a Parliamentary Point of View-Critical Assessment and Challenges Ahead. 2007. Available online: https://nanopdf.com/download/implementing-the-united-nations-convention-to-combat_pdf (accessed on 15 March 2019).
  4. Cornet, A. Desertification and its relationship to the environment and development: A problem that affects us all. In Ministère des Affaires Étrangères/Adpf, Johannesburg. World Summit on Sustainable Development; Comité Scientifique Français de la Désertification: Montpellier, France, 2002; pp. 91–125. Available online: http://www.csf-desertification.org/bibliotheque/item/desertification-and-its-relationship-to-the-environment-and-development (accessed on 18 March 2019).
  5. Musa, J. An Assessment of the Effects of Desertification in Yobe State, Nigeria. Conflu. J. Environ. Stud. 2012, 72–87. Available online: https://citeseerx.ist.psu.edu/viewdoc/download?doi=10.1.1.916.9869&rep=rep1&type=pdf (accessed on 24 March 2019).
  6. Lamprey, H.F. Report on the Desert Encroachment Reconnaissance in Northern Sudan, 21 October–10 November 1975; UNESCO: Paris, France; UNEP: Nairobi, Kenya, 1988; pp. 1–7, Republished in Desertification Bulletin 17. [Google Scholar]
  7. Mandal, R.B. (Ed.) Regional Dynamics of the Sahel. In Patterns of Regional Geography: An International Perspective; World Regions; Concept Publishing Company: New Delhi, India, 1990; Volume 3, p. 145. Available online: https://www.amazon.com/Patterns-regional-geography-international-perspective/dp/8170222893 (accessed on 13 March 2019).
  8. Kemp, D.D. The Environment Dictionary; Routledge: London, UK; New York, NY, USA, 1998; p. 96. Available online: https://www.routledge.com/The-Environment-Dictionary/Kemp/p/book/9780415127530 (accessed on 15 March 2019).
  9. Ci, L.; Yang, X. Desertification and Its Control in China; Springer: Berlin/Heidelberg, Germany, 2010; p. 10. ISBN 978-7-04-025797-7. Available online: https://link.springer.com/book/10.1007/978-3-642-01869-5 (accessed on 13 March 2019).
  10. Olagunju, E.T. Drought, desertification and the Nigerian environment: A review. J. Ecol. Nat. Environ. 2015, 7, 196–209. Available online: https://academicjournals.org/journal/JENE/article-abstract/4505E2154369 (accessed on 10 April 2022). [CrossRef] [Green Version]
  11. Gadzama, N.M.; Ayuba, H.K. On major environmental problem of desertification in Northern Nigeria with sustainable efforts to managing it. World J. Sci. Technol. Sustain. Dev. 2016, 13, 18–30. [Google Scholar] [CrossRef]
  12. Jaiyeoba, I.A. Environment in Africa Atlases: Nigeria. Les Ed. J. A Paris. 2002, 22–123. [Google Scholar]
  13. Tiffen, M.; Mortimore, M. Questioning desertification in dryland sub-Saharan Africa. Nat. Res. Forum 2002, 26, 218–233. [Google Scholar] [CrossRef]
  14. Federal Ministry of Environment of Nigeria. National Action Plan to Combat Desertification; Federal Ministry of Environment of Nigeria: Abuja, Nigeria, 2009.
  15. Abahussain, A.A.; Abdu, A.; Al-Zubari, W.K.; El-Deen, N.A.; Abdul-Raheem, M. Desertification in the Arab Region: Analysis of current status and trends. J. Arid Environ. 2002, 51, 521–545. [Google Scholar] [CrossRef]
  16. Apata, T.G.; Folayan, A.; Apata, O.M.; Akinlua, J. The Economic Role of Nigeria’s Subsistence Agriculture in the Transition Process: Implications for Rural Development. In Proceedings of the 85th Annual Conference, Agricultural Economics Society, Coventry, UK, 18–20 April 2011. [Google Scholar] [CrossRef]
  17. Lal, R. Land degradation and pedological processes in a changing climate. Soil Degrad. Proc. 2008, 12, 315–325. Available online: https://www.yumpu.com/en/document/view/49060726/land-degradation-and-pedological-processes-in-a-changing-climate (accessed on 20 March 2019).
  18. Ahmad, U.; Nasirahmadi, A.; Hensel, O.; Marino, S. Technology and Data Fusion Methods to Enhance Site-Specific Crop Monitoring. Agronomy 2022, 12, 555. [Google Scholar] [CrossRef]
  19. Hein, L.; de Ridder, N.; Hiernaux, P.; Leemans, R.; de Wit, A.; Schaepman, M. Desertification in the Sahel: Towards better accounting for ecosystem dynamics in the interpretation of remote sensing images. J. Arid Environ. 2011, 75, 1164–1172. [Google Scholar] [CrossRef]
  20. Glenn, E.; Stafford, S.M.; Squires, V. On our failure to control desertification: Implications for global change issues, and a research agenda for the future. Environ. Sci. Policy 1998, 1, 71–78. [Google Scholar] [CrossRef]
  21. Veron, S.; Paruelo, J.; Oesterheld, M. Assessing desertification. J. Arid Environ. 2006, 66, 751–763. [Google Scholar] [CrossRef]
  22. Hill, J.; Stellmes, M.; Udelhoven, T.; Röder, A.; Sommer, S. Mediterranean desertification and land degradation: Mapping related land use change syndromes based on satellite observations. Glob. Planet. Chang. 2008, 64, 146–157. [Google Scholar] [CrossRef]
  23. Symeonakis, E.; Drake, N. Monitoring desertification and land degradation over sub-Saharan Africa. Int. J. Remote Sens. 2004, 25, 573–592. [Google Scholar] [CrossRef]
  24. Bai, Z.G.; Dent, D.L.; Olsson, L.; Schaepman, M.E. Proxy global assessment of land degradation. Soil Use Manag. 2008, 24, 223–234. [Google Scholar] [CrossRef]
  25. Collado, A.D.; Chuvieco, E.; Camarasa, A. Satellite Remote Sensing Analysis to Monitor Desertification Processes in the Crop-Rangeland Boundary of Argentina. J. Arid Environ. 2002, 52, 121–133. [Google Scholar] [CrossRef]
  26. Li, J.; Yang, X.; Jin, Y.; Yang, Z.; Huang, W.; Zhao, L.; Gao, T.; Yu, H.; Ma, H.; Qin, Z.; et al. Monitoring and Analysis of Grassland Desertification Dynamics using Landsat Images in Ningxia. Remote Sens. Environ. 2013, 138, 13–26. [Google Scholar] [CrossRef]
  27. Yang, Y.; Wand, Z.; Li, j.; Gang, C.; Zhang, Y.; Odeh, I.; Qi, J. Comparative assessment of grassland degradation dynamics in response to climate change variation and human activities in China, Mongolia, Pakistan and Uzbekistan from 2000 to 2013. J. Arid Environ. 2016, 135, 164–172. [Google Scholar] [CrossRef]
  28. Owusu, A.B.; Cervo, G.; Luzzadder-Beach, S. Analysis of Desertification in the Upper East Region (UER) of Ghana Using Remote Sensing, Field Study, and Local Knowledge. Cartogr. Int. J. Geogr. Inf. Geovisualization 2013, 48, 22–37. [Google Scholar] [CrossRef]
  29. Ahmadi, H. Iranian Model of Desertification Potential Assessment (IMDPA); Faculty of Natural Resources, University of Tehran: Tehran, Iran, 2004; p. 268. [Google Scholar]
  30. Rasmy, M.; Gad, A.; Abdelsalam, H.; Siwailam, M. A dynamic simulation model of desertification in Egypt. Egypt. J. Remote Sens. Space Sci. 2010, 13, 101–111. [Google Scholar] [CrossRef] [Green Version]
  31. Silakhori, I.; Ownegh, M.; Sadoddin, A.S. Assessment of desertification risk in Sabzevar using IMDPA model. J. Envt. Sci. Tech. 2019, 91, 89–99. [Google Scholar]
  32. Akbari, M.; Ownegh, M.; Asgari, H.R.; Sadoddin, A.; Khosravi, H. Desertification risk assessment and management program. Glob. J. Environ. Sci. Manag. 2016, 2, 365–380. [Google Scholar] [CrossRef]
  33. Amadi, D.C.A.; Maiguru, A.; Zaku, S.; Yakubu, T. Pattern of Desertification in Yobe State of Nigeria. J. Environ. Sci. Toxicol. Food Tech. 2013, 5, 12–16. [Google Scholar] [CrossRef]
  34. Ahmad, U.; Alvino, A.; Marino, S. A Review of Crop Water Stress Assessment Using Remote Sensing. Remote Sens. 2021, 13, 4155. [Google Scholar] [CrossRef]
  35. Mansur, M.A.; Ismail, M.H. GIS-Based Quantitative Assessment of Desertification in Kebbi State Nigeria. In Proceedings of the International Conference on Sustainable Forest Development in View of Climate Change (SFDCC2016), Bandar Baru Bangi, Malaysia, 8–11 August 2016; Available online: http://a.xueshu.baidu.com/usercenter/paper/show?paperid=43261f9db8e84b709b16763ce6e7caa9 (accessed on 30 June 2020).
  36. Elijah, E.; Ikusemoran, M.; Nyanganji, K.J.; Mshelisa, H.U. Detecting and Monitoring Desertification Indicators in Yobe State, Nigeria. J. Environ. Issues Agric. Dev. Ctries. 2017, 9, 2141–2731. Available online: https://www.researchgate.net/publication/333561428_Detecting_and_Monitoring_Desertification_Indicators_in_Yobe_State_Nigeria (accessed on 23 June 2020).
  37. Titiola, K. Environment and Sustainable Agricultural Development in Nigeria; Flaghan Printing Press: Lagos, Nigeria, 1998; Available online: https://citeseerx.ist.psu.edu/viewdoc/download?doi=10.1.1.535.4291&rep=rep1&type=pdf (accessed on 30 June 2020).
  38. Nigerian Bureau of Statistics. Annual Abstract of Statistics 2010. Nigerian Bureau of Statistics: Federal Republic of Nigeria. 2010. Available online: http://ghdx.healthdata.org/record/nigeria-annual-abstract-statistics-2010 (accessed on 30 June 2020).
  39. Nigerian Bureau of Statistics. Annual Abstract of Statistics 2012. Nigerian Federal Republic of Nigeria. 2012. Available online: https://www.nigerianstat.gov.ng/pdfuploads/annual_abstract_2012.pdf (accessed on 30 June 2020).
  40. Burke, M.; Lobell, D.B. Satellite-based assessment of yield variation and its determinants in smallholder African systems. Proc. Natl. Acad. Sci. USA 2017, 114, 2189–2194. [Google Scholar] [CrossRef] [PubMed] [Green Version]
  41. Ibrahim, E.S.; Rufin, P.; Nill, L.; Kamali, B.; Nendel, C.; Hostert, P. Mapping Crop Types and Cropping Systems in Nigeria with Sentinel-2 Imagery. Remote Sens. 2021, 13, 3523. [Google Scholar] [CrossRef]
  42. Potere, D.; Schneider, A.; Angel, S.; Civco, D. Mapping Urban Areas on a Global Scale: Which of the Eight Maps Now Available Is More Accurate? Int. J. Remote Sens. 2009, 30, 6531–6558. [Google Scholar] [CrossRef]
  43. Trianni, G.; Lisini, G.; Angiuli, E.; Moreno, E.A.; Dondi, P.; Gaggia, A.; Gamba, P. Scaling up to National/Regional Urban Extent Mapping Using Landsat Data. J. Sel. Topics Appl. Earth Obs. Remote Sens. 2015, 8, 3710–3719. [Google Scholar] [CrossRef]
  44. Forget, Y.; Linard, C.; Gilbert, M. Supervised Classification of Built-Up Areas in Sub-Saharan African Cities Using Landsat Imagery and Open-Street-Map. Remote Sens. 2018, 10, 1145. [Google Scholar] [CrossRef] [Green Version]
  45. Forget, Y.; Shimoni, M.; Gilbert, M.; Linard, C. Mapping 20 Years of Urban Expansion in 45 Urban Areas of Sub-Saharan Africa. Remote Sens. 2021, 13, 525. [Google Scholar] [CrossRef]
  46. Bey, A.; Jetimane, J.; Lisboa, S.N.; Ribeiro, N.; Sitoe, A.; Meyfroidt, P. Mapping smallholder and large-scale cropland dynamics with a flexible classification system and pixel-based composites in an emerging frontier of Mozambique. Remote Sens. Environ. 2020, 239, 111611. [Google Scholar] [CrossRef]
  47. Erbek, F.S.; Özkan, C.; Taberner, M. Comparison of maximum likelihood classification method with supervised artificial neural network algorithms for land use activities. Int. J. Remote Sens. 2004, 25, 1733–1748. [Google Scholar] [CrossRef]
  48. Weih, R.C.; Riggan, N.D. Object-based classification vs. pixel-based classification: Comparative importance of multi-resolution imagery. Int. Arch. Photogramm. Remote Sens. Spat. Inf. Sci. 2010, 38, C7. Available online: https://www.isprs.org/proceedings/xxxviii/4-c7/pdf/Weih_81.pdf (accessed on 28 March 2019).
  49. Maulik, U.; Chakraborty, D. Remote sensing image classification: A survey of support-vector-machine-based advanced techniques. Trans. Geosci. Remote Sens. 2017, 5, 33–52. [Google Scholar] [CrossRef]
  50. Qiu, C.; Schmitt, M.; Mou, L.; Ghamisi, P.; Zhu, X.X. Feature importance analysis for local climate zone classification using a residual convolutional neural network with multi-source datasets. Remote Sens. 2018, 10, 1572. [Google Scholar] [CrossRef] [Green Version]
  51. Wilbert, L.; Shobha, S. Land cover classification of SSC image: Unsupervised and supervised classification using ERDAS Imagine. Int. Geosci. Remote Sens. Symp. 2004, 4, 2707–2712. [Google Scholar] [CrossRef]
  52. Olofsson, P.; Foody, G.M.; Stehman, S.V.; Woodcock, C.E. Making better use of accuracy data in land change studies: Estimating accuracy and area and quantifying uncertainty using stratified estimation. Remote Sens. Environ. 2013, 129, 122–131. [Google Scholar] [CrossRef]
  53. Yang, X.; Zheng, X.Q.; Lv, L.N. A spatiotemporal model of land use change based on ant colony optimization, Markov chain and cellular automata. Ecol. Model 2012, 233, 11–19. [Google Scholar] [CrossRef]
  54. Al sharif, A.A.; Pradhan, B. Monitoring and predicting land use change in Tripoli metropolitan city using an integrated markov chain and cellular automata models in GIS. Arab. J. Geosci. 2014, 7, 4291–4301. [Google Scholar] [CrossRef]
  55. Losiri, C.; Nagai, M.; Ninsawat, S.; Shrestha, R.P. Modeling urban expansion in Bangkok metropolitan region using demographic–economic data through cellular automata-markov Chain and multi-layer perceptron-markov chain models. Sustainability 2016, 8, 686. [Google Scholar] [CrossRef] [Green Version]
  56. Abdulla-AlKafy, M.D.; Nazmul, H.; Gangaraju, S.; Abdullah, A.; Nessar, U.; Abdullah, A.; Marium, A.; Golam, S. Cellular Automata approach in dynamic modelling of land cover changes using RapidEye images in Dhaka, Bangladesh. Environ. Chall. 2021, 4, 100084. [Google Scholar] [CrossRef]
  57. Eastman, J.R. IDRISI Selva Tutorial Manual Version 17, 2012; Clark University: Worcester, MA, USA, 2012; Available online: http://uhulag.mendelu.cz/files/pagesdata/eng/gis/idrisi_selva_tutorial.pdf. (accessed on 18 March 2019).
  58. Enoguanbhor, E.C.; Gollnow, F.; Nielsen, J.O.; Lakes, T.; Walker, B.B. Land Cover Change in the Abuja City-Region, Nigeria: Integrating GIS and Remotely Sensed Data to Support Land Use Planning. Sustainability 2019, 11, 1313. [Google Scholar] [CrossRef] [Green Version]
  59. Enoguanbhor, E.C.; Gollnow, F.; Walker, B.B.; Jonas, O.N.; Lakes, T. Simulating Urban Land Expansion in the Context of Land Use Planning in the Abuja City-Region, Nigeria. Geo J. 2020, 1–19. [Google Scholar] [CrossRef]
  60. Gadzama, N.M. Sustainable Development in the Arid Zone of Nigeria; Monograph Series, No. 1; University of Maiduguri Press: Maiduguri, Nigeria, 1995; p. 32. [Google Scholar]
  61. United Nations Environmental Program (UNEP). Atlas of Our Changing Environment; Division of Early Warning and Assessment (DEWA), UNEP: Nairobi, Kenya, 2008; Available online: https://na.unep.net/atlas/datlas/sites/default/files/unepsiouxfalls/atlasbook_1135/Kenya_Screen_Intro.pdf (accessed on 30 June 2020).
  62. Petersen, M.; Bergmann, C.; Roden, P.; Nüsser, M. Contextualizing land-use and land-cover change with local knowledge: A case study from Pokot Central, Kenya. Land Degrad Dev. 2021, 32, 2992–3007. [Google Scholar] [CrossRef]
  63. Nwokoro, C.V.; Chima, F.O. Impact of Environmental Degradation on Agricultural Production and Poverty in Rural Nigeria. Am. Int. J. Contemp. Res. 2017, 7, 6–14. Available online: https://www.semanticscholar.org/paper/Impact-of-Environmental-Degradation-on-Agricultural-Nwokoro-Chima/4bfeec90b749f146e9387905cd7ea95317d6142c (accessed on 18 July 2019).
  64. McCormick, J. Environmental Politics. In Developments in British Politics 4; Dunleavy, P., Gamble, A., Holliday, I., Peele, G., Eds.; Palgrave: London, UK, 1993. [Google Scholar] [CrossRef]
  65. Medugu, N.I. Nigeria and the Advancing Desert. Environmental Synergy World Press.com. 2009. Available online: https://environmentalsynergy.wordpress.com/2009/05/14/nigeria-and-the-advancing-desert/ (accessed on 29 June 2020).
  66. Okoli, J.N.; Ifeakor, A.C. An Overview of Climate Change and Food Security: Adaptation Strategies and Mitigation Measures in Nigeria. J. Educ. Pract. 2014, 5, 32. Available online: https://www.iiste.org/Journals/index.php/JEP/article/view/ (accessed on 18 March 2019).
  67. SREC. Projects: Sosai Renewable Energies Company. Available online: http://sosairen.org/projects.php (accessed on 6 February 2019).
Figure 1. Nigerian map illustrating the position of the study, with Google Earth satellite data capturing the case study area.
Geographies 02 00015 g001
Figure 2. Methodological flow chart.
Geographies 02 00015 g002
Figure 3. Land cover maps showing change in land cover of Yusufari and Yunusari LGAs over 25 years.
Geographies 02 00015 g003
Figure 4. Land cover change trend from 1990 to 2015.
Geographies 02 00015 g004
Figure 5. Subsets of sand dune progression in Yusufari and Yunusari LGAs over a 25-year period (see the location of subsets in the study area map, shown in Figure 1).
Geographies 02 00015 g005
Figure 6. Land cover conversion maps (vegetation and sand dune transformations from 1990 to 2015).
Geographies 02 00015 g006
Figure 7. The trajectory of NDVI, rainfall and temperature in the study area ((A) annual distributions mean NDVI, rainfall and temperature. (B) Trajectory of the relationship between rainfall, temperature and NDVI patterns from 2000 to 2015). (A) is presenting the annual distributions and changes of mean NDVI values (Y-axis), the distribution of temperature is presented in graduating shades of the blue (see legend for values for the interpretation of temperature values) and the mean of rainfall received in the region is described in the direction and positions of the dots in the X-axis. (B) is showing the relationship between annual mean NDVI, temperature and rainfall (mean depicted in blue line). The mean temperature is presented on the Y-axis, the mean of rainfall received in the region is described in the direction and positions of the doted blues on the X-axis and the mean NDVI here is presented in graduating shades of the blue dots (see legend for the interpretation of the dotted blue representing NDVI values). The grey curve in the chart describes the correlation or relationship of the three variables. A narrow curve shows a close relationship between weather variables and NDVI, while a wide grey shading reveals a deviation in relationships (especially around 2007–2008).
Geographies 02 00015 g007
Figure 8. Average annual rainfall amounts and mean temperature over the study area (circled red are corresponding years analysed with remote sensing data). Data Source: Nigerian Meteorological Agency (NIMET).
Geographies 02 00015 g008
Figure 9. Relationship between desertification indicators and climate variables. Black dots represents the respective class extracted from the 1990, 2000, 2010 and 2015 classifications of the satellite data.
Geographies 02 00015 g009
Figure 10. Probabilistic projections of sand dune in Yusufari and Yunusari.
Geographies 02 00015 g010
Table 1. A cross description of 2015 accuracy assessment.
Reference (Field Data)
Land CoverBare Surface/Sand DunesBuilt-UpFarmlandVegetationOasis/
Wetlands
TotalUser’s
Accuracy
Commission Error
Classified Image (Map)Bare surface/
sand dunes
514500600.850.15
Built-up034100350.970.03
Farmland4294221040.900.10
Vegetation012414480.850.15
Oasis/ Wetlands112453610.870.13
Producer’s accuracy0.750.940.840.760.87---
Omission Error0.250.060.160.240.13---
Overall accuracy0.81 (81%)-------
Table 2. Land cover changes from 1990 to 2015.
Land Cover1990
(ha)
%2000
(ha)
%2010
(ha)
%2015
(ha)
%
Bare Surface/
sand dunes
31,3694.135,6634.641,7325.469,4629
Built-up2519.80.34512.40.67527178931
Farmland591,17576.4601,11277.7601,04877.7621,41180.3
Vegetation92,12611.975,4099.769,1208.928,1433.6
Oasis/wetlands56,5637.357,1107.454,330746,8576.1
Total773,752100773,806100773,757100773,766100
This table provides a summary of land cover maps produced from 1990 to 2015, providing the distribution of land cover types in hectares and percentage of each land cover class for each time slice.
Table 3. Land cover conversions in Yusufari and Yunusari LGAs from 1990 to 2015.
Land Cover ConversionsArea (ha)
* Vegetation to Farmland62,411
Vegetation to Wetland and Oasis6432
Vegetation Unchanged21,783
* Vegetation to Bare/Sand dunes1013
* Vegetation to Built-Up394
Wetland and Oasis to Farmland21,922
Wetland and Oasis Unchanged33,142
Wetland and Oasis to Vegetation996
* Wetland and Oasis to Bare/Sand dunes309
Wetland and Oasis to Built-Up163
Farmland Unchanged519,371
Farmland to Wetland and Oasis7143
Farmland to Vegetation5265
* Farmland to Bare/Sand dunes54,455
Farmland to Built-Up4624
Bare/Sand dunes to Farmland17,270
Bare/Sand dunes to Wetland and Oasis69
Bare/Sand dunes to Vegetation72
Bare/Sand Dunes Unchanged13,656
Bare/Sand Dunes to Built-Up291
Built Up to farmland61
Built Up to Wetland and Oasis39
Built Up to Bare/Sand dunes0.2
Built Up Unchanged2419
Total773,298
* Conversions significant to desertification. This table provides a summary of land cover conversions in hectares from 1990 to 2015, providing insights to desertification indicators and drivers.
Publisher’s Note: MDPI stays neutral with regard to jurisdictional claims in published maps and institutional affiliations.

