Understanding Spatial Autocorrelation: An Everyday Metaphor and Additional New Interpretations
Abstract
:1. Introduction
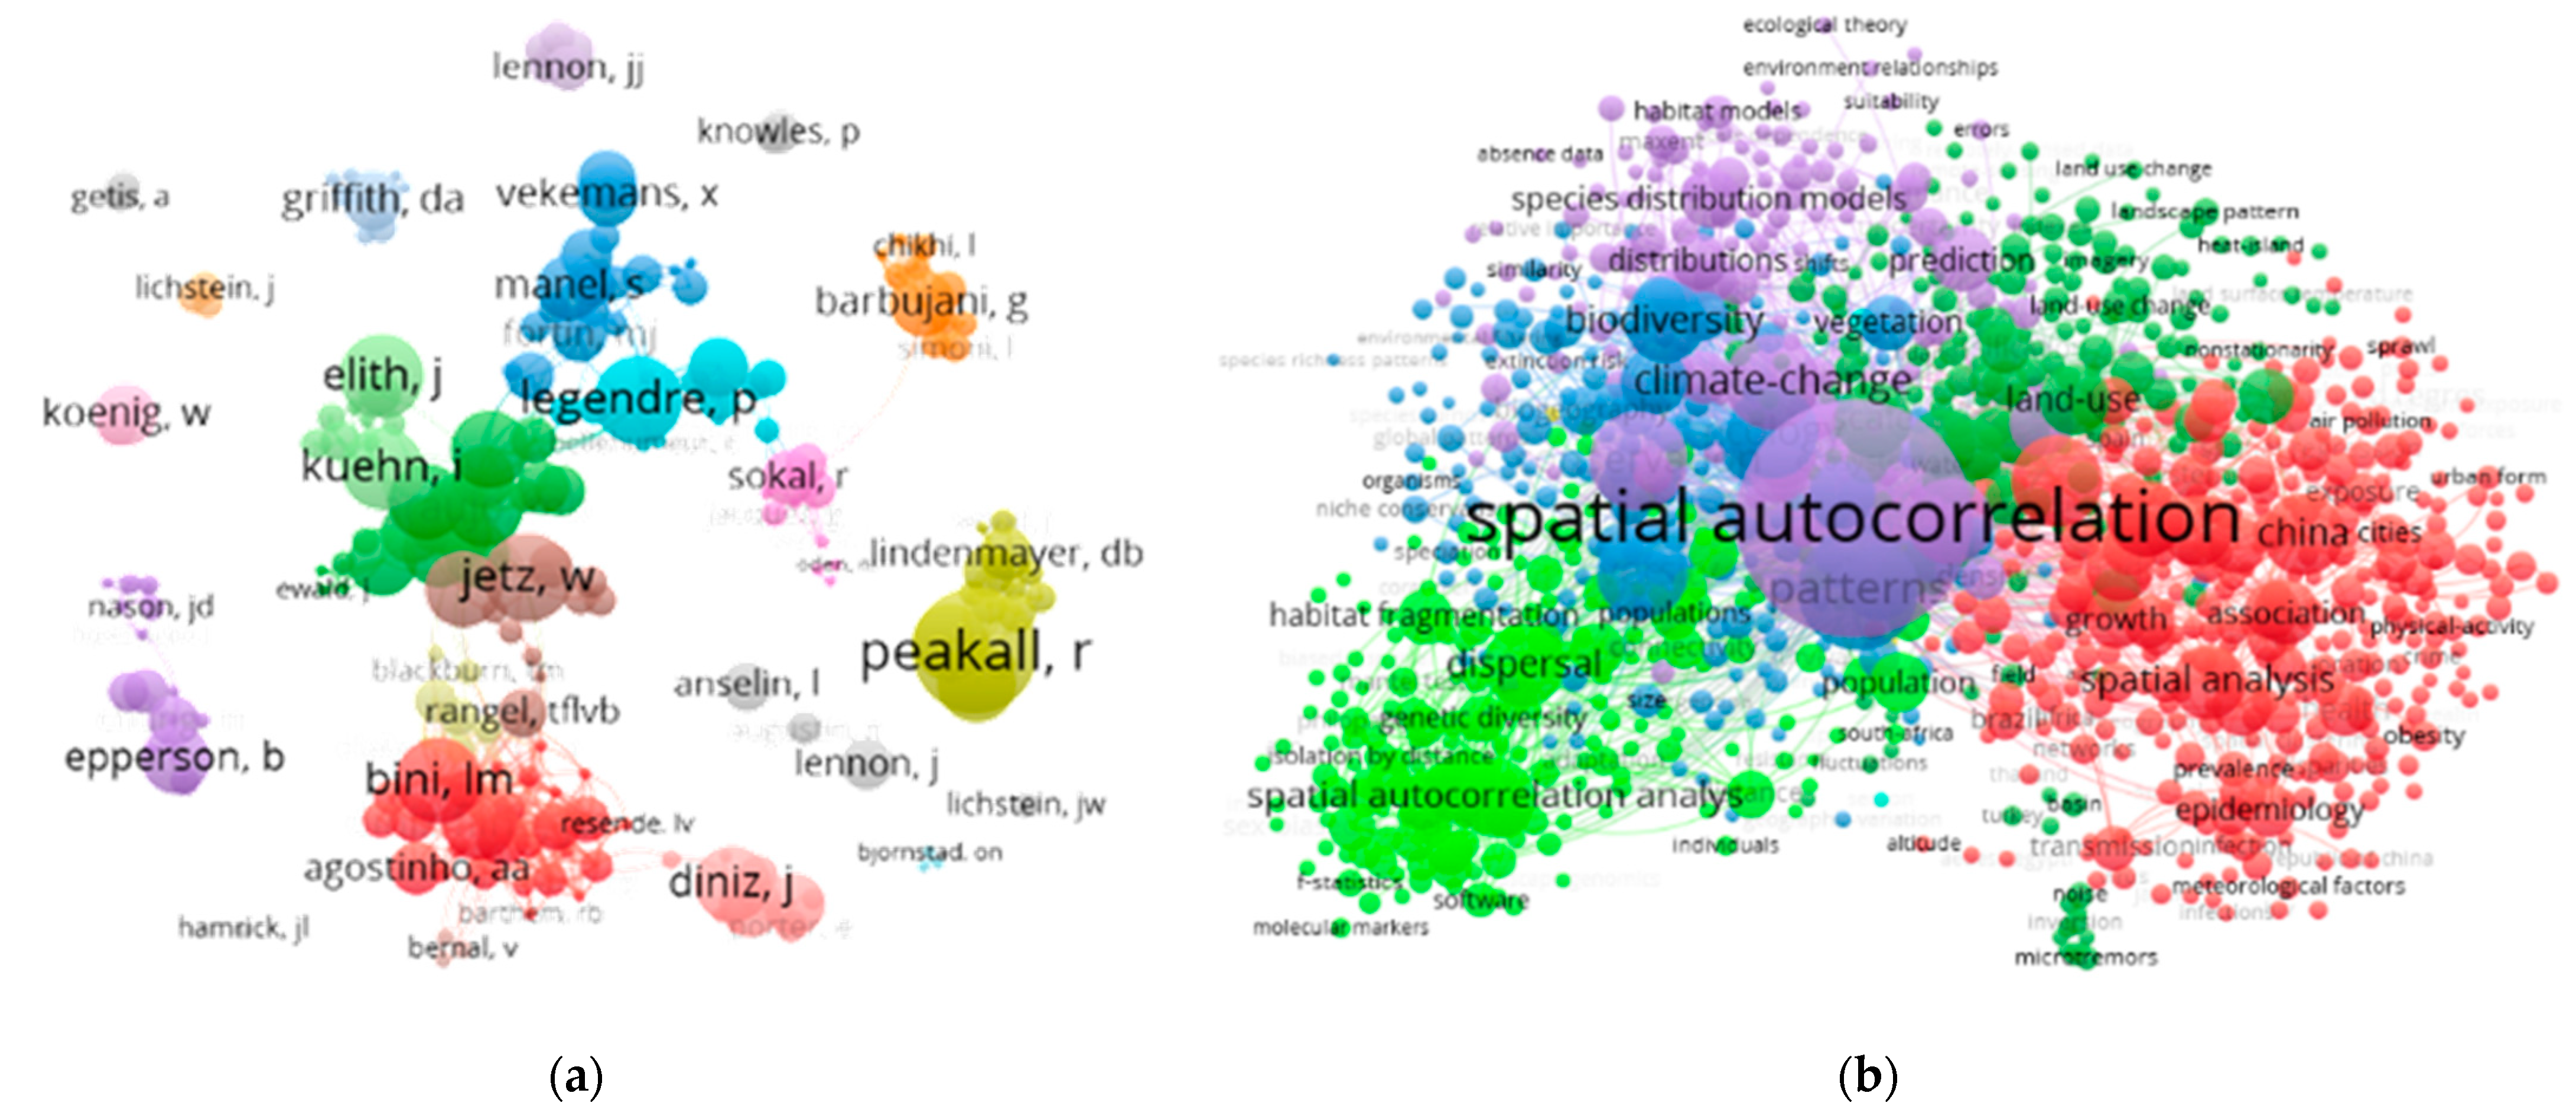
1.1. SA: An Important Geospatial Synoptic Statistic
1.2. SA and Geographic Scale/Resolution
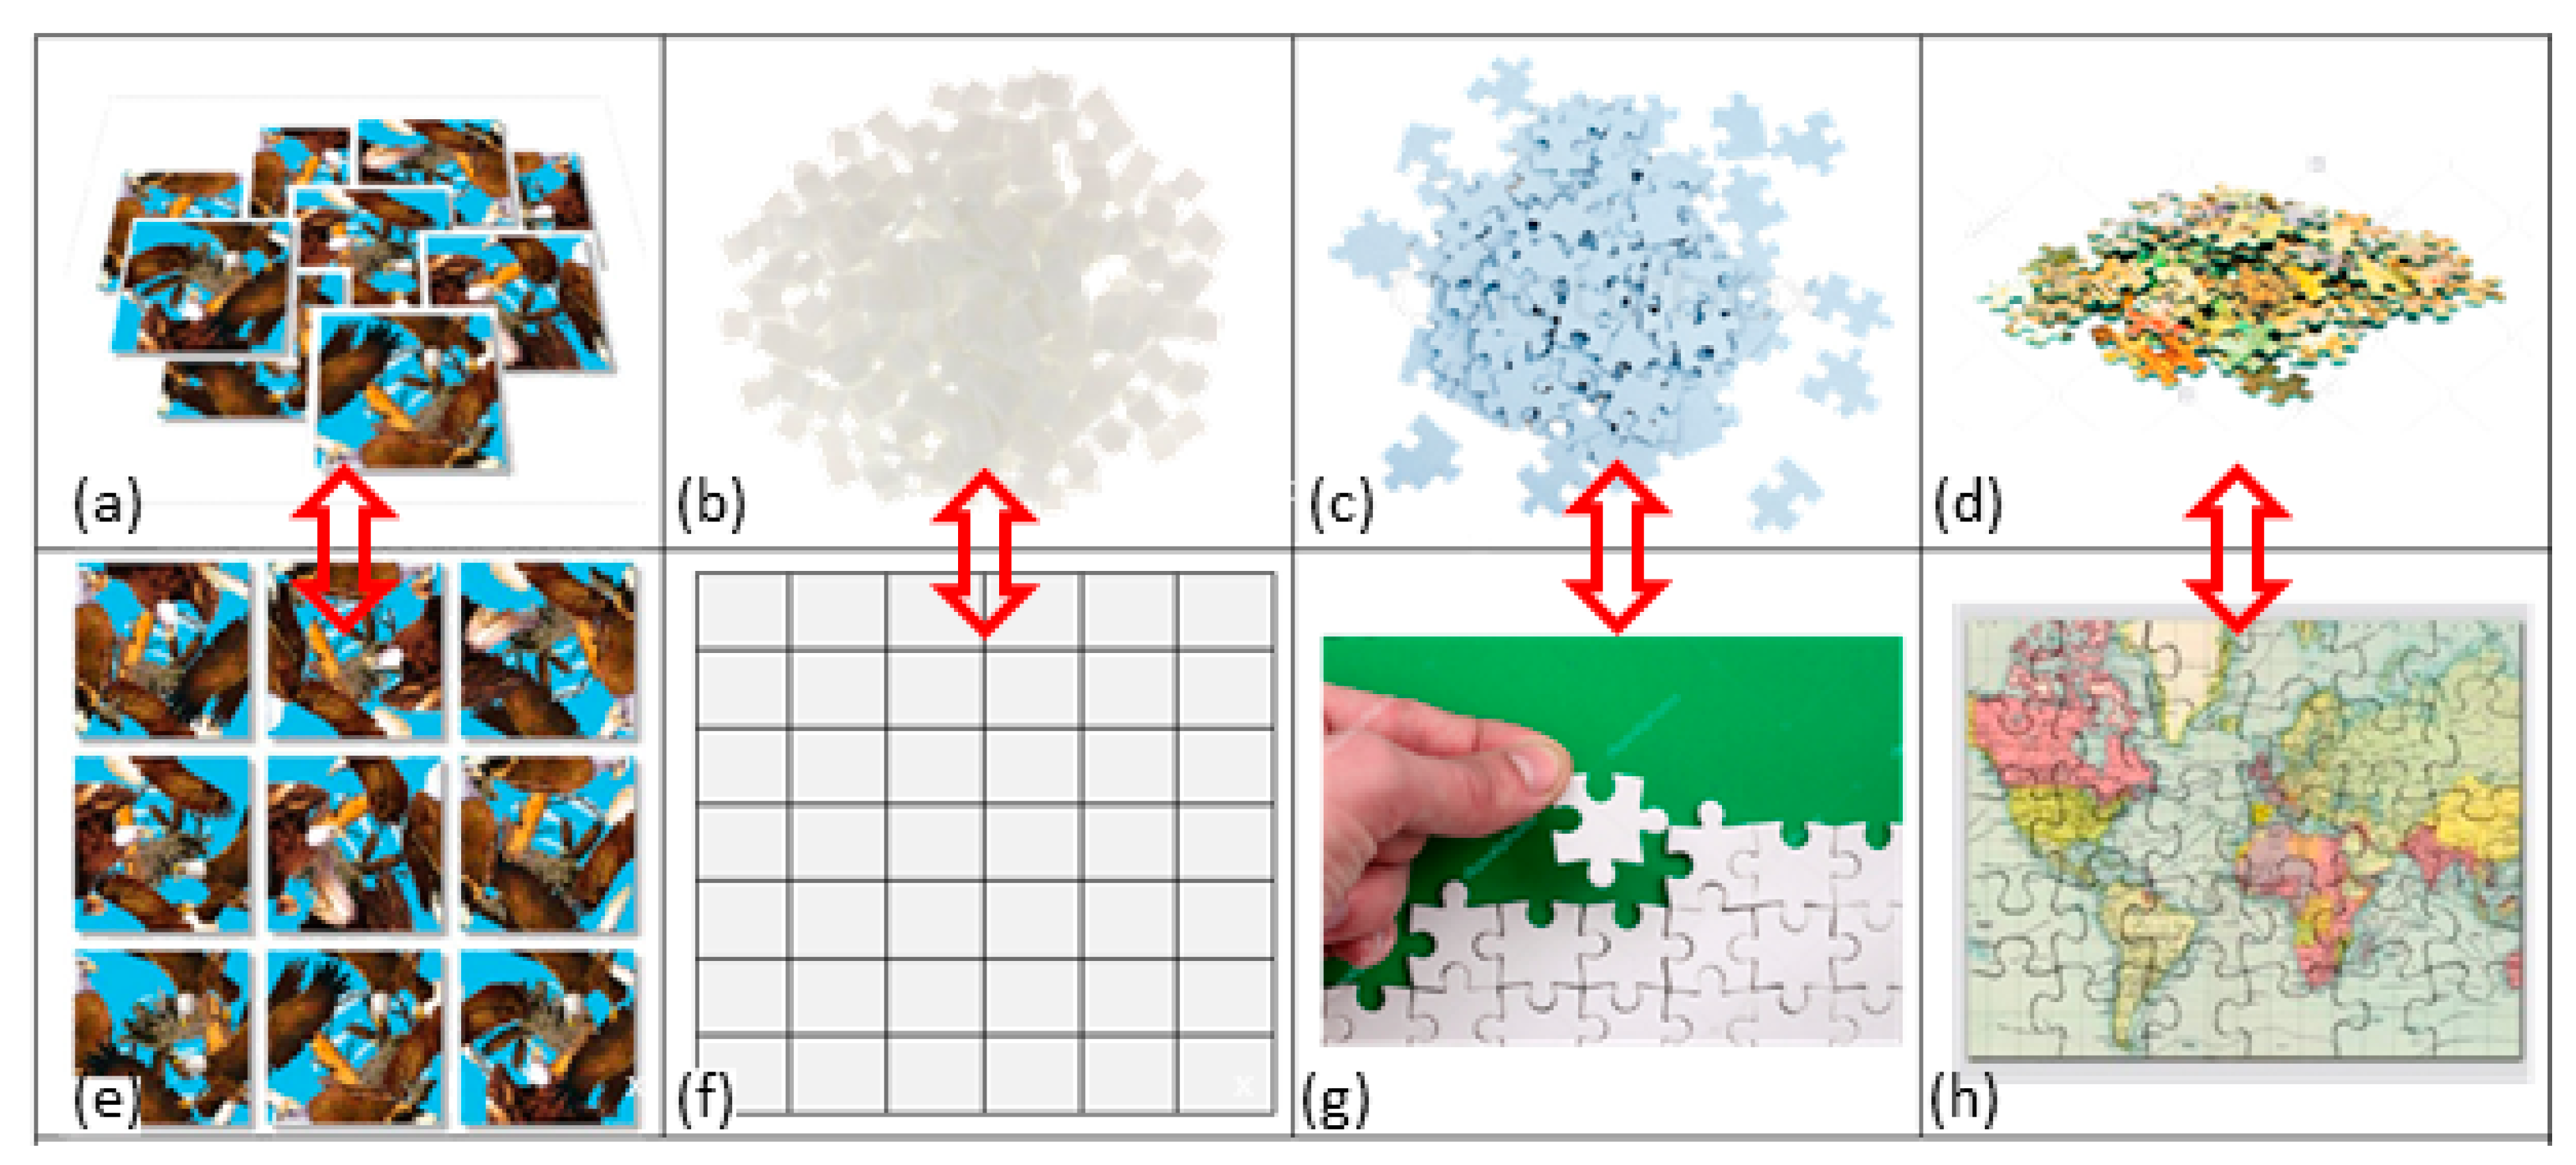
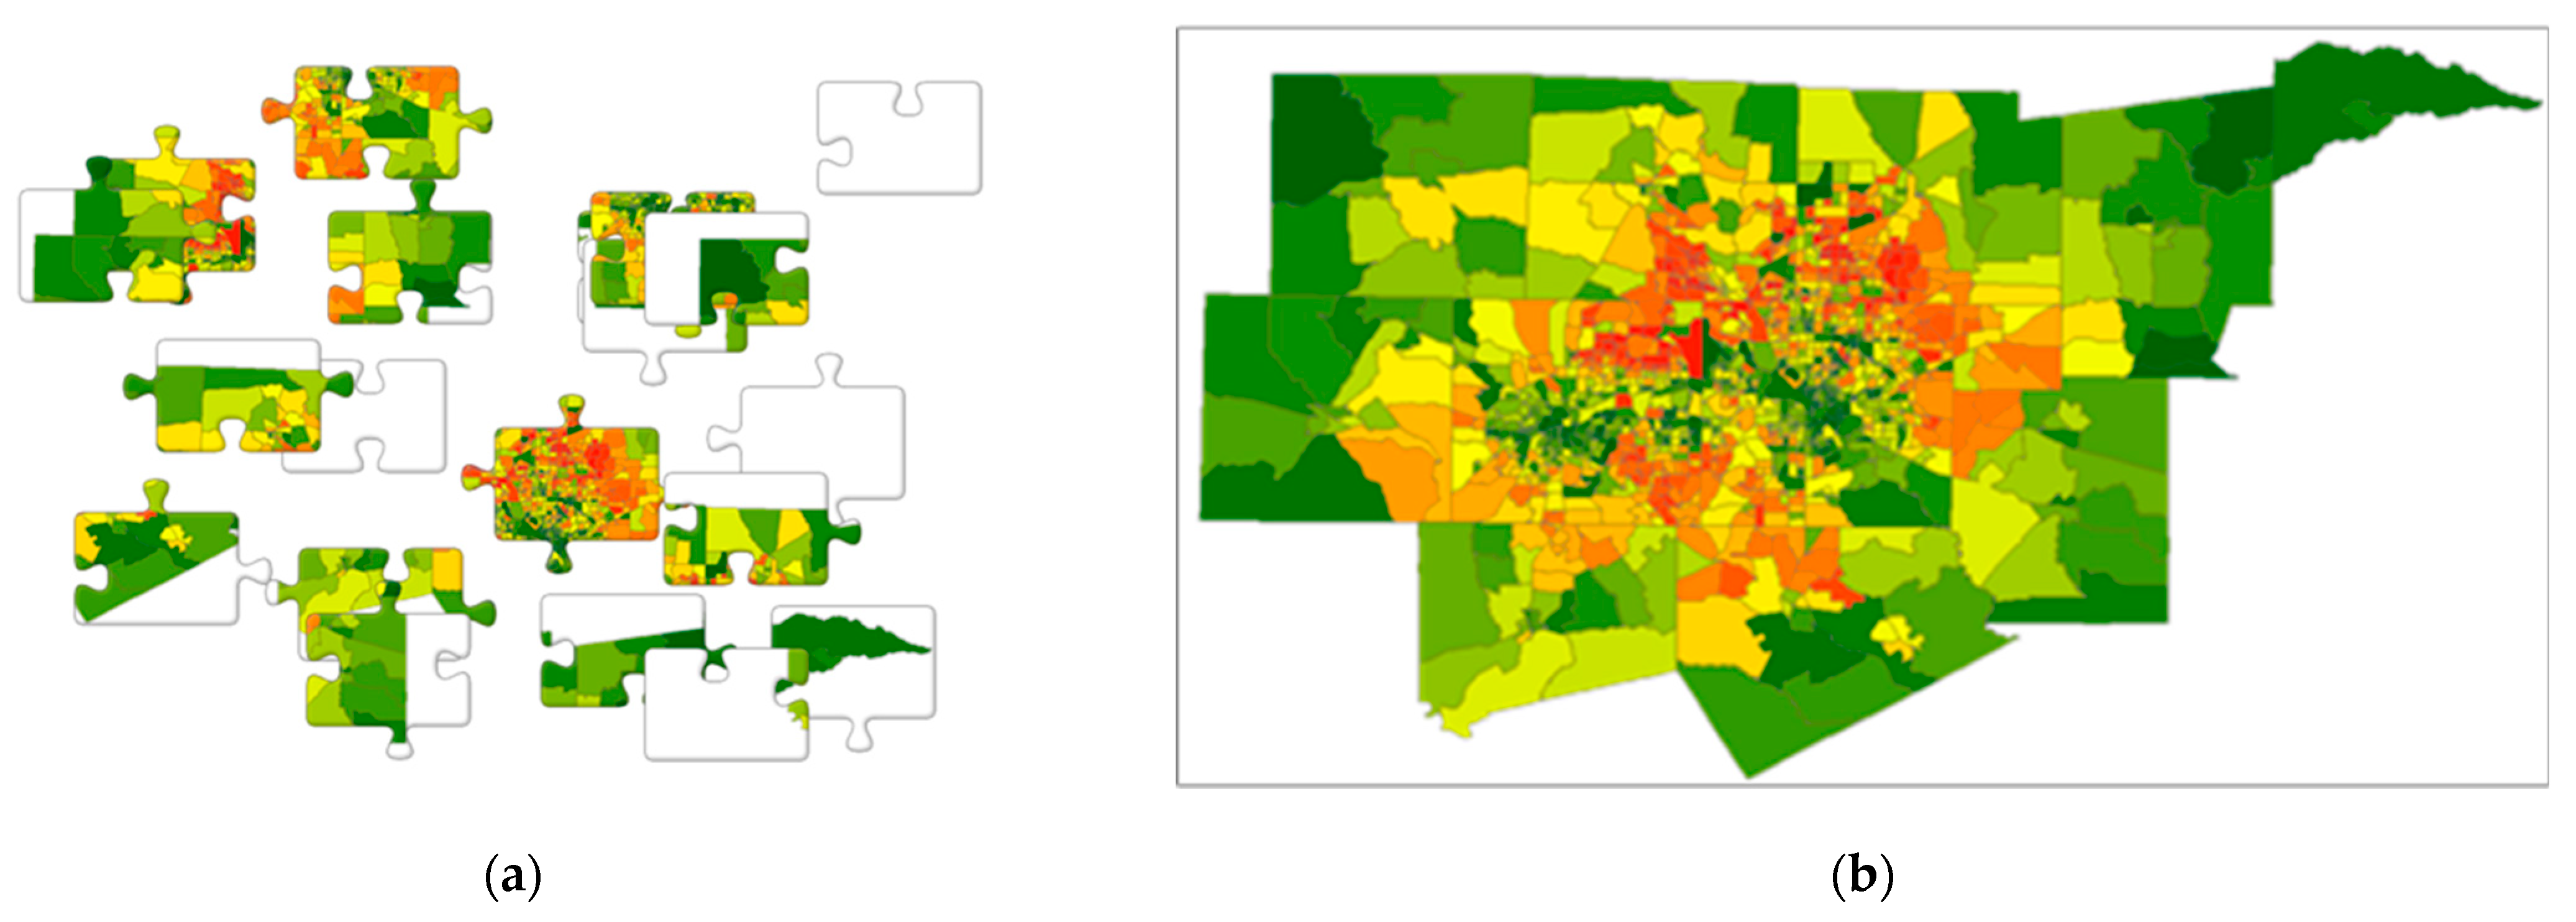
2. The Jigsaw Puzzle: An Everyday Object Metaphor
3. What Is SA? Illustrative SA Jigsaw Puzzle Cases
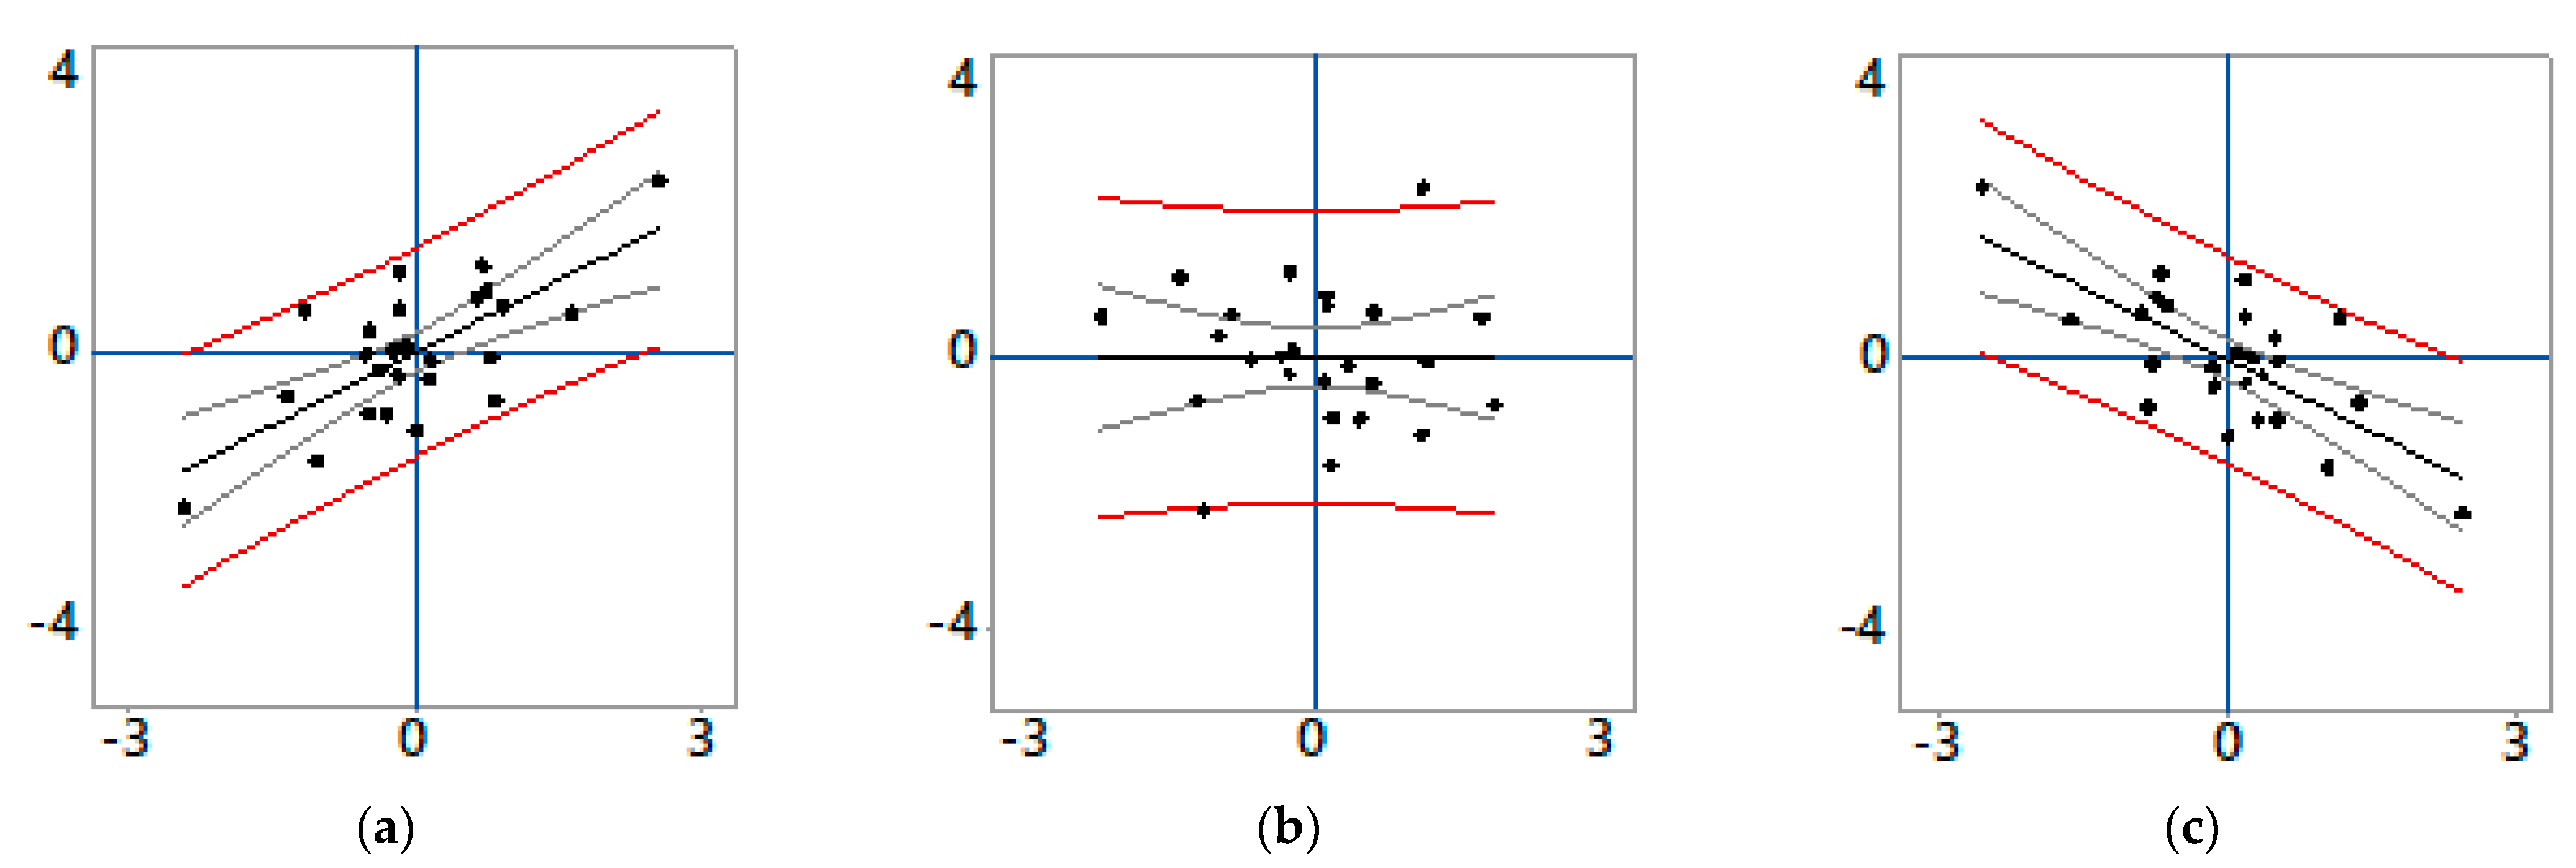
3.1. A Case of Zero SA
The 0/0 Conundrum
3.2. A Case of Pure Positive SA
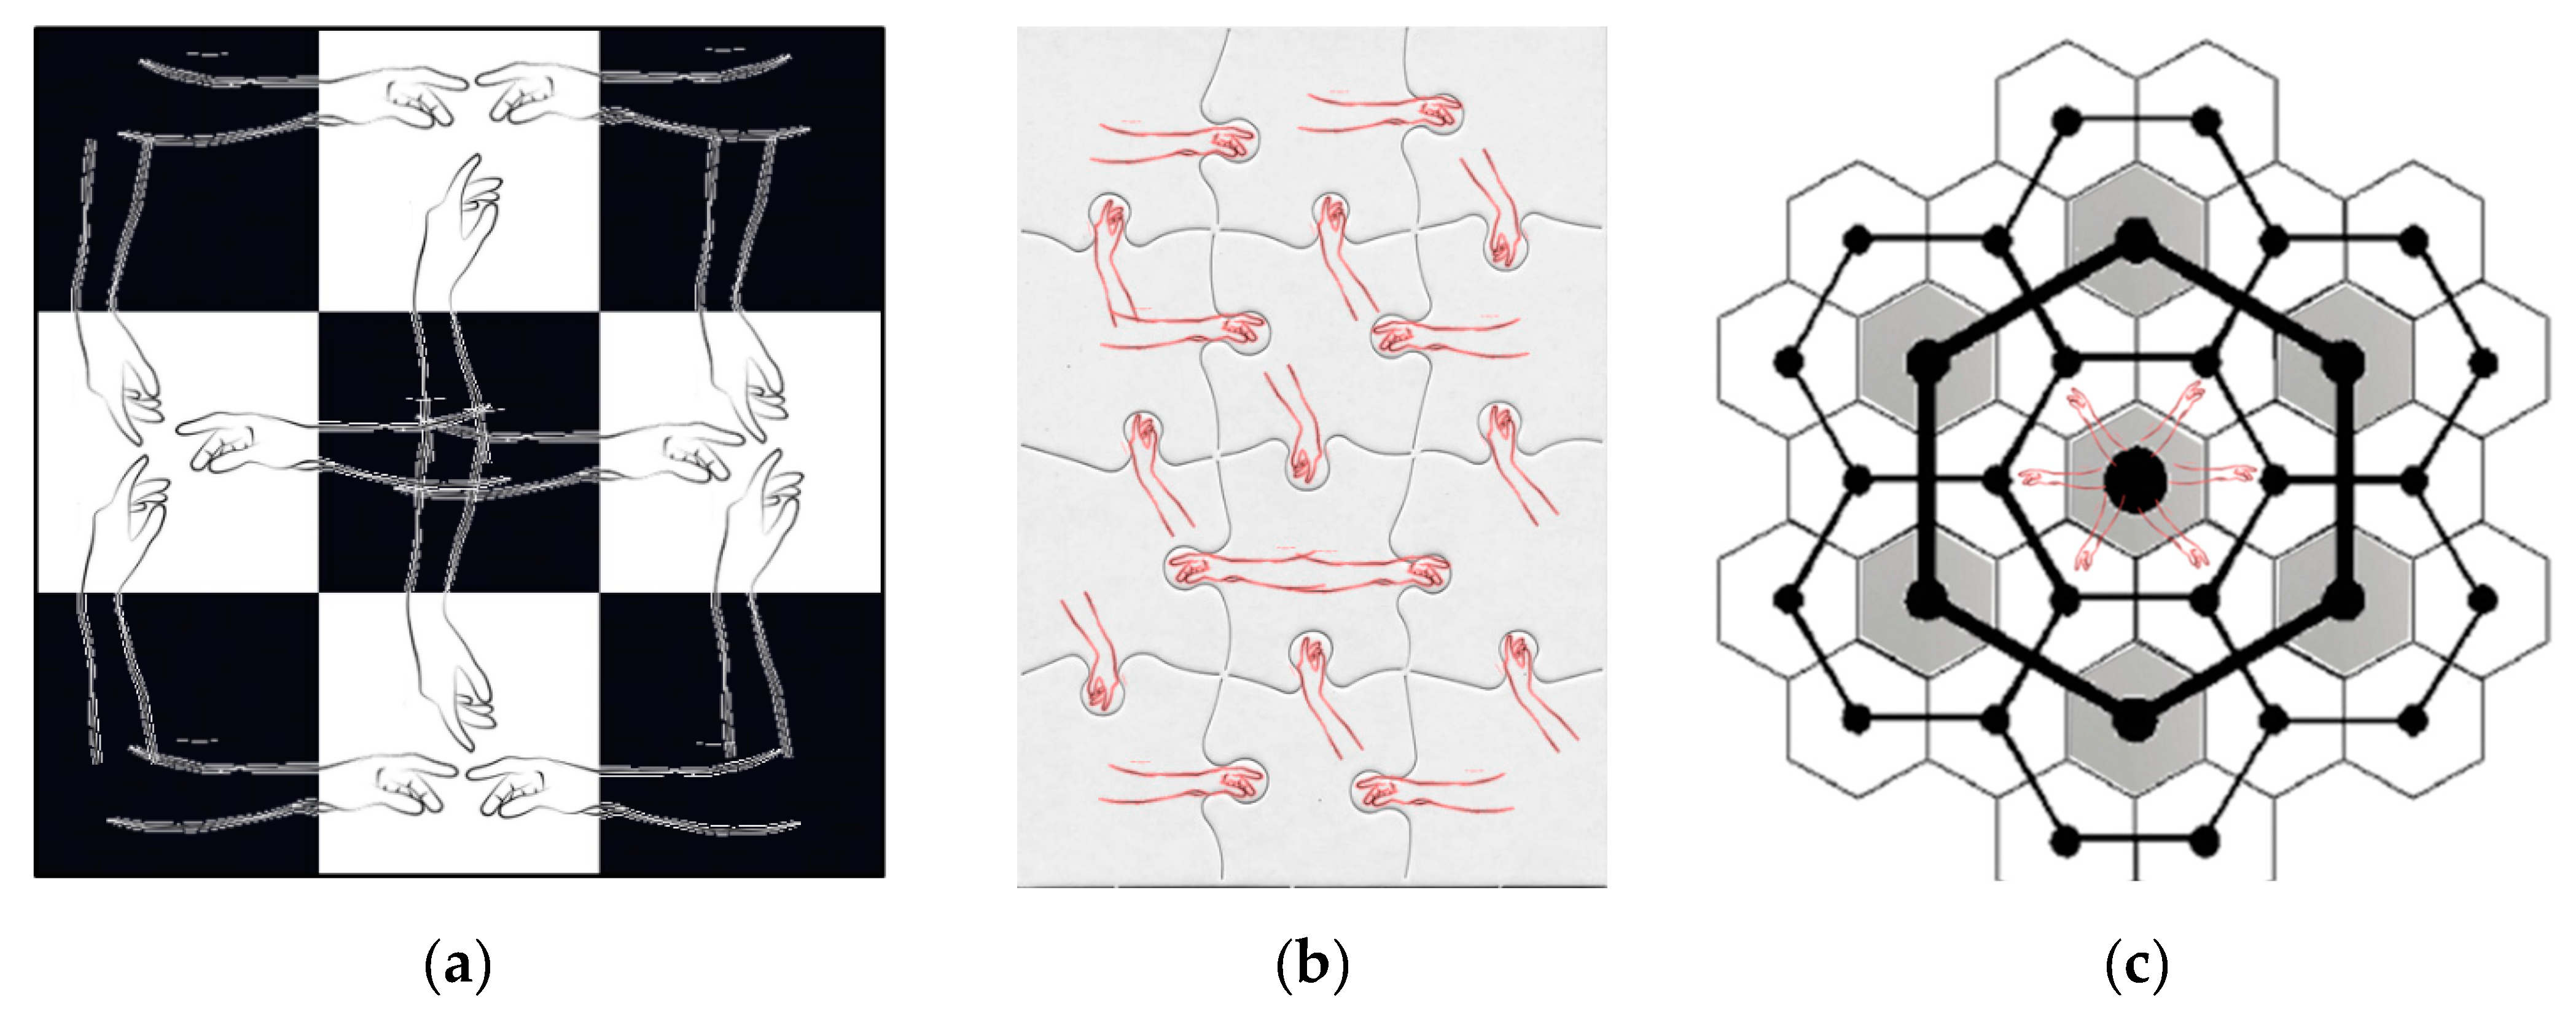
3.3. A Case of Pure Negative SA
3.4. A Positive–Negative SA Mixture Case
3.5. Some Necessary Remarks about SA
4. Materials and Methods: Yet More Faces of SA
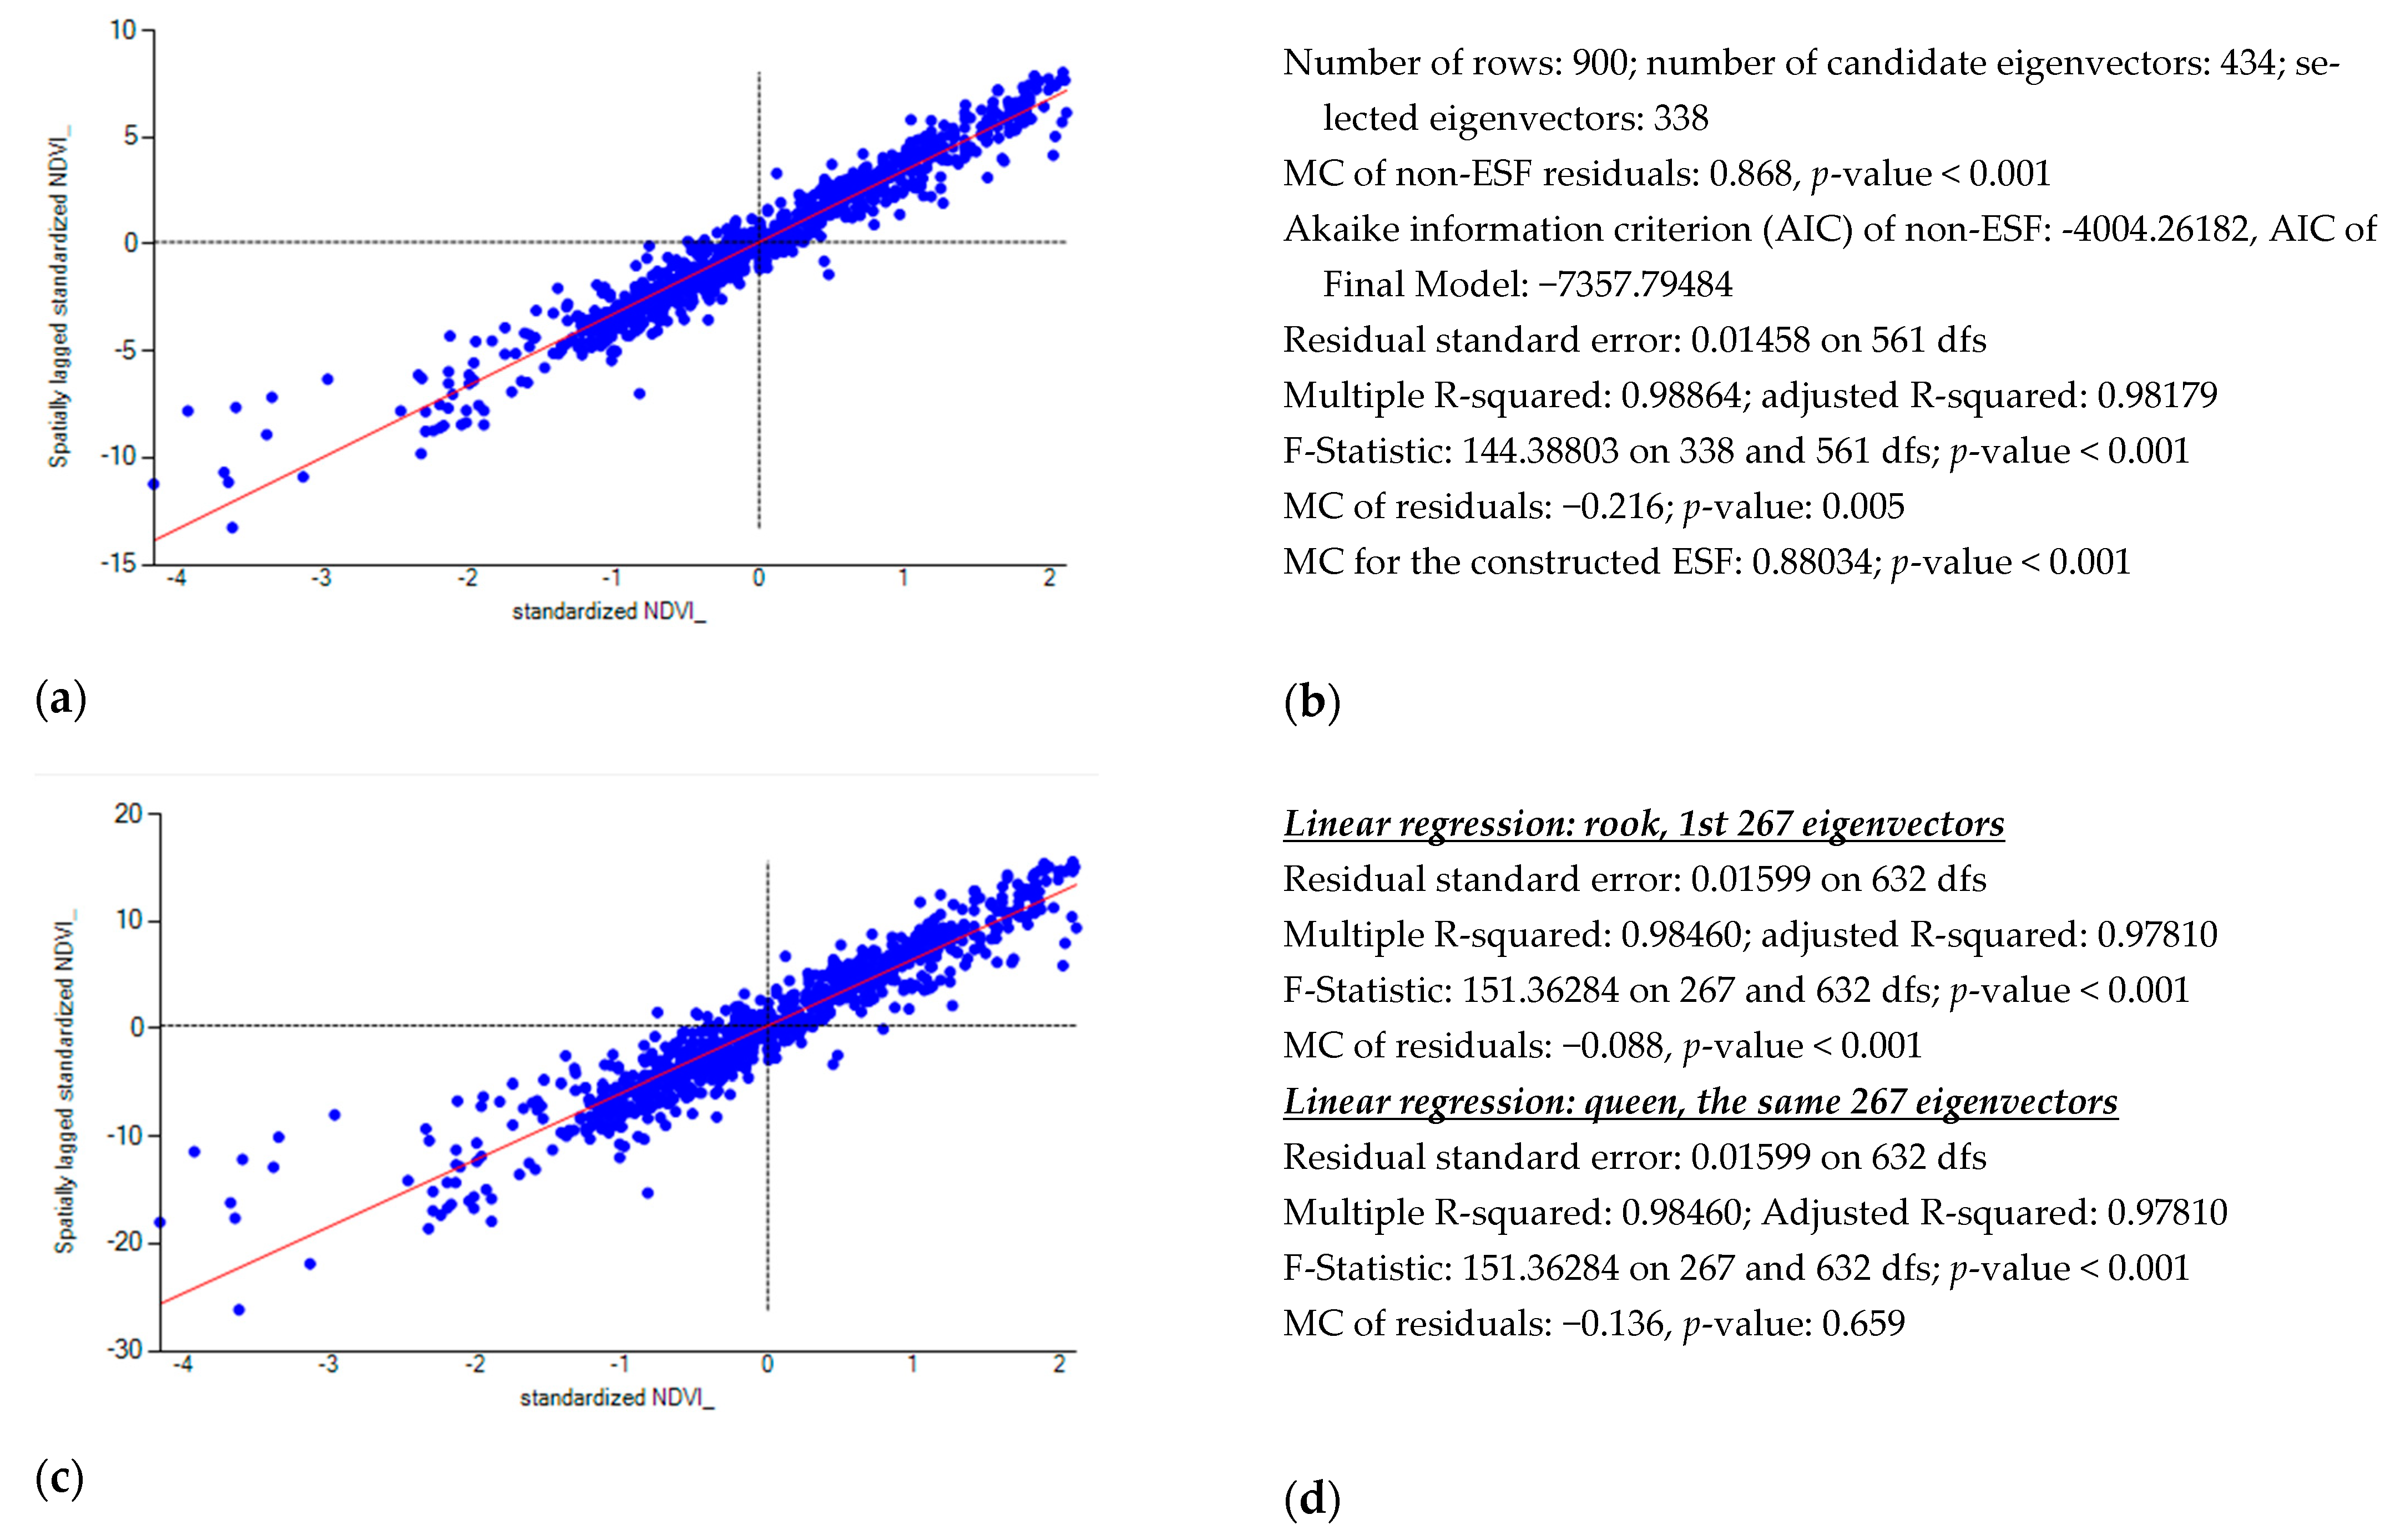
4.1. Remotely Sensed Data Results: The Case of Strong Positive SA
4.2. Socio-Economic/Demographic Data Results: The Case of Moderate Positive SA
4.3. Case Studies Discussion
5. Summary, Conclusions, and Implications
The north [of England] has wealthy suburbs, like South Wirral, west of Liverpool. They vote Labour. The south has impoverished pockets, like north-east Kent. They vote Conservative. It is as though political opinions derive from the air people breathe.
Funding
Data Availability Statement
Acknowledgments
Conflicts of Interest
References
- Salvati, L. Editorial: Introduction to a new open access journal by MDPI. Geographies 2020, 1, 1–2. [Google Scholar] [CrossRef]
- Griffith, D. Spatial autocorrelation is everywhere. In Our Geographical Worlds: Celebrating Award-Winning Geography at the University of Toronto 1995 to 2018; Macijauskas, J., Ed.; Department of Geography and Planning & Association of Geography Alumni, University of Toronto: Toronto, ON, Canada, 2022; pp. 1–11. [Google Scholar]
- Tobler, W. A computer movie simulating urban growth in the Detroit region. Econ. Geogr. 1970, 46, 234–240. [Google Scholar] [CrossRef]
- Williams, A. The Jigsaw Puzzle: Piecing Together a History; Berkley Books: New York, NY, USA, 2004. [Google Scholar]
- Monmonier, M. Air Apparent: How Meteorologists Learned to Map, Predict, and Dramatize Weather; University of Chicago Press: Chicago, IL, USA, 2000. [Google Scholar]
- Student. The elimination of spurious correlation due to position in time or space. Biometrika 1914, 10, 179–180. [Google Scholar]
- Yule, U. Why do we sometimes get nonsense-correlations between time series? A study in sampling and the nature of time series. J. R. Stat. Soc. 1926, 89, 1–69. [Google Scholar] [CrossRef]
- Neprash, J. Some problems in the correlation of spatially distributed variables. Proc. Am. Stat. J. 1934, 29, 167–168. [Google Scholar]
- Stephan, F. Sampling errors and interpretations of social data ordered in time and space. Proc. Am. Stat. J. 1934, 29, 165–166. [Google Scholar]
- Fisher, R. The Design of Experiments; Oliver and Boyd: Edinburgh, UK, 1935. [Google Scholar]
- Yates, F. The comparative advantages of systematic and randomized arrangements in the design of agricultural and biological experiments. Biometrika 1938, 30, 444–466. [Google Scholar]
- Moran, P. Notes on continuous stochastic phenomena. Biometrika 1950, 37, 17–23. [Google Scholar] [CrossRef]
- Geary, R. The contiguity ratio and statistical mapping. Inc. Stat. 1954, 5, 115–145. [Google Scholar] [CrossRef]
- Cliff, A.; Ord, J. Spatial Autocorrelation; Pion: London, UK, 1973. [Google Scholar]
- Journel, A.; Huijbregts, C. Mining Geostatistics; Academic Press: New York, NY, USA, 1978. [Google Scholar]
- Paelinck, J.; Klaassen, L. Spatial Econometrics; Saxon House: Farnborough, UK, 1979. [Google Scholar]
- Anselin, L. Spatial Econometrics; Kluwer: Dordrecht, Germany, 1988. [Google Scholar]
- Cressie, N. Statistics for Spatial Data; Wiley: New York, NY, USA, 1991. [Google Scholar]
- Haining, R. Spatial Data Analysis in the Social and Environmental Sciences; Cambridge University Press: Cambridge, UK, 1996. [Google Scholar]
- Anselin, L. Local indicators of spatial association LISA. Geogr. Anal. 1995, 27, 93–115. [Google Scholar] [CrossRef]
- Griffith, D. A family of correlated observations: From independent to strongly interrelated ones. Stats 2020, 3, 166–184. [Google Scholar] [CrossRef]
- Goodchild, M. Spatial Autocorrelation; Concepts and Techniques in Modern Geography 47; Geo Books: Norwich, UK, 1986. [Google Scholar]
- Odland, J. Spatial Autocorrelation; SAGE: Thousand Oaks, CA, USA, 1988. [Google Scholar]
- Getis, A. A history of the concept of spatial autocorrelation: A geographer’s perspective. Geogr. Anal. 2008, 40, 297–309. [Google Scholar] [CrossRef]
- Goodchild, M. What problem? Spatial autocorrelation and geographic information science. Geogr. Anal. 2009, 41, 411–417. [Google Scholar] [CrossRef]
- Griffith, D. What is spatial autocorrelation? Reflections on the past 25 years of spatial statistics. L’Espace Géographique 1992, 21, 265–280. [Google Scholar] [CrossRef]
- Haining, R. Spatial autocorrelation and the quantitative revolution. Geogr. Anal. 2009, 41, 364–374. [Google Scholar] [CrossRef]
- Legendre, P. Spatial autocorrelation: Trouble or new paradigm? Ecology 1993, 74, 1659–1673. [Google Scholar] [CrossRef]
- McMillen, D. Spatial autocorrelation or model misspecification? Int. Reg. Sci. Rev. 2003, 26, 208–217. [Google Scholar] [CrossRef]
- Luo, Q.; Hu, K.; Liu, W.; Wu, H. Scientometric analysis for spatial autocorrelation-related research from 1991 to 2021. ISPRS Int. J. Geo-Inf. 2022, 11, 309. [Google Scholar] [CrossRef]
- Griffith, D. Negative spatial autocorrelation: One of the most neglected concepts in spatial statistic. Stats 2019, 2, 388–415. [Google Scholar] [CrossRef]
- Griffith, D.; Agarwal, K.; Chen, M.; Lee, C.; Panetti, E.; Rhyu, K.; Venigalla, L.; Yu, X. Geospatial socio-economic/demographic data: The existence of spatial autocorrelation mixtures in georeferenced data—Part I & Part II. Trans. GIS 2022, 26, 72–99. [Google Scholar]
- Griffith, D. Spatial autocorrelation mixtures in geospatial disease data: An important global epidemiologic/public health assessment ingredient? Trans. GIS 2023, 27, 730–751. [Google Scholar] [CrossRef]
- Griffith, D.; Chun, Y. Evaluating eigenvector spatial filter corrections for omitted georeferenced variables. Econometrics 2016, 4, 29. [Google Scholar] [CrossRef]
- Pawley, M.; McArdle, B. Spatial Autocorrelation: Bane or Bonus? bioRxiv. 2018. Available online: https://www.biorxiv.org/content/10.1101/385526v1.article-info (accessed on 24 August 2023).
- Chou, Y. Map resolution and spatial autocorrelation. Geogr. Anal. 1991, 23, 228–246. [Google Scholar] [CrossRef]
- Zhang, B.; Xu, G.; Jiaoa, L.; Liua, J.; Donga, T.; Lia, Z.; Liu, X.; Liu, Y. The scale effects of the spatial autocorrelation measurement: Aggregation level and spatial resolution. Int. J. Geogr. Inf. Sci. 2019, 33, 945–966. [Google Scholar] [CrossRef]
- Rodrigues, A.; Tenedorio, J. Sensitivity Analysis of Spatial Autocorrelation Using Distinct Geometrical Settings: Guidelines for the Urban Econometrician. In Computational Science and Its Applications—ICCSA 2014; Murgante, B., Murgante, B., Misra, S., Rocha, A., Torre, C., Rocha, J., Falcão, M., Taniar, D., Apduhan, B., Gervasi, O., Eds.; Part III, LNCS 8581; Springer: Cham, Switzerland, 2014; pp. 345–356. [Google Scholar]
- Di, W.; Qingbo, Z.; Zhongxin, C.; Jia, L. Spatial autocorrelation and its influencing factors of the sampling units in a spatial sampling scheme for crop acreage estimation. In Proceedings of the 6th International Conference on Agro-Geoinformatics, Fairfax, VA, USA, 7–10 August 2017; pp. 1–6. [Google Scholar] [CrossRef]
- Mohan, P.; Zhou, X.; Shekhar, S. Quantifying resolution sensitivity of spatial autocorrelation: A resolution correlogram approach. In Geographic Information Science: GIScience 2012; Xiao, N., Kwan, M.-P., Goodchild, M., Shekhar, S., Eds.; Lecture Notes in Computer Science; Springer: Berlin/Heidelberg, Germany, 2012; Volume 7478, pp. 132–145. [Google Scholar] [CrossRef]
- Armstrong, B. Jigsaw puzzle cutting styles: A new method of classification. In Game Researchers’ Notes; American Game Collectors Association: Dresher, PA, USA, 1997. [Google Scholar]
- Bailey, T.; Gatrell, A. Interactive Spatial Data Analysis; Longman: Harlow, UK, 1995. [Google Scholar]
- Brualdi, R. Introductory Combinatorics, 5th ed.; Pearson: Upper Saddle, NJ, USA, 2010. [Google Scholar]
- Numbla, N. Automatic Jigsaw Puzzle Solver. 2015. Available online: https://nithyanandabhat.weebly.com/uploads/4/5/6/1/45617813/project_report-jigsaw-puzzle.pdf (accessed on 24 August 2023).
- Guerroui, N.; Séridi, H. Solving computational square jigsaw puzzles with a novel pairwise compatibility measure. J. King Saud Univ. Comput. Inf. Sci. 2020, 32, 928–939. [Google Scholar] [CrossRef]
- Eaton, B.; Lipsey, R. The non-uniqueness of equilibrium in the Löschian economic model. Am. Econ. Rev. 1976, 66, 77–93. [Google Scholar]
- Bunge, W. Theoretical Geography, 2nd ed.; Gleerup: Lund, Sweden, 1966. [Google Scholar]
- Lebart, L. Analyse statistique de la contiguite. Publ. L’institute Stat. L’universite Paris 1969, 18, 81–112. [Google Scholar]
- Diniz-Filho, J.; Bini, L.; Hawkins, B. Spatial autocorrelation and red herrings in geographical ecology. Glob. Ecol. Biogeogr. 2003, 12, 53–64. [Google Scholar] [CrossRef]
- Kao, Y.-H.; Bera, A. Spatial Regression: The Curious Case of Negative Spatial Dependence. In Proceedings of the IV International Scientific Conference: Spatial Econometrics and Regional Economic Analysis, Lodz, Poland, 13–14 June 2016; Kao, Y.-H., Three Essays on Spatial Econometrics with an Emphasis on Testing, unpublished doctoral dissertation; Department of Economics, University of Illinois at Urbana-Champaign: Urbana, IL, USA, 2016. [Google Scholar]
- Griffith, D.; Chun, Y.; Li, B. Spatial Regression Analysis Using Eigenvector Spatial Filtering; Elsevier: Cambridge, MA, USA, 2019. [Google Scholar]
- Griffith, D. Spatial Autocorrelation and Spatial Filtering: Gaining Understanding through Theory and Scientific Visualization; Springer: Berlin/Heidelberg, Germany, 2003. [Google Scholar]
- Koo, H.; Chun, Y.; Griffith, D. Integrating spatial data analysis functionalities in a GIS environment: Spatial analysis using ArcGIS Engine and R (SAAR). Trans. GIS 2018, 22, 721–736. [Google Scholar] [CrossRef]
- Griffith, D. Eigenfunction properties and approximations of selected incidence matrices employed in spatial analyses. Linear Algebra Its Appl. 2000, 321, 95–112. [Google Scholar] [CrossRef]
- Cliff, A.; Ord, J. Spatial Processes; Pion: London, UK, 1981. [Google Scholar]
- Getis, A.; Ord, J. Local spatial statistics: An overview. In Spatial Analysis: Modelling in a GIS Environment; Longley, P., Batty, M., Eds.; Geoinformation International: Cambridge, UK, 1996; pp. 261–277. [Google Scholar]
- Griffith, D. Hidden negative spatial autocorrelation. J. Geogr. Syst. 2006, 8, 335–355. [Google Scholar] [CrossRef]
- Arbia, G. Spatial Econometrics; Springer: Berlin/Heidelberg, Germany, 2006. [Google Scholar]
- Heckscher, C. Photuris Mysticalampas (Coleoptera: Lampyridae): A new firefly from peatland floodplain forests of the Delmarva Peninsula. Entomol. News 2013, 123, 93–100. [Google Scholar] [CrossRef]
- Schelling, T. Models of segregation. Am. Econ. Rev. 1969, 59, 488–493. [Google Scholar]
- Schelling, T. Dynamic models of segregation. J. Math. Sociol. 1971, 1, 143–186. [Google Scholar] [CrossRef]
- The Economist. Britain’s Great Divide: The Politics of North and South; The Economist: London, UK, 2013; Volume 407, p. 16. [Google Scholar]
- Liu, X.; Andris, C.; Desmarais, B. Migration and political polarization in the U.S.: An analysis of the county-level migration network. PLoS ONE 2019, 14, e0225405. [Google Scholar] [CrossRef]
- Igraham, C. California’s Epidemic of Vaccine Denial, Mapped. The Washington Post 27 January 2015. Available online: https://www.washingtonpost.com/news/wonk/wp/2015/01/27/californias-epidemic-of-vaccine-denial-mapped/ (accessed on 24 August 2023).
- Griffith, D. Eigenvector visualization and art. J. Math. Arts 2021, 15, 170–187. [Google Scholar] [CrossRef]



| Feature | Rook Adjacency Definition | Queen Adjacency Definition | ||
|---|---|---|---|---|
| SAR | SARMA ‡ | SAR | SARMA ‡ | |
| () | 0.820 (0.017) | 0.954 (0.014) | 0.844 (0.017) | 0.940 (0.018) |
| () | 0 | 0.498 (0.061) | 0 | 0.383 (0.075) |
| 0 | 0.812 | 0 | 0.826 | |
| Average lag-1 spatial correlation | 0.56 | 0.62 | 0.56 | 0.61 |
| pseudo-R2 | 0.643 | 0.647 | ||
| Residual zMC; residual zGR | −2.0; 1.8 | 1.7; 0.5 | −1.0; 0.9 | 1.5; 0.1 |
| Feature | Rook Adjacency Definition (SWM Elements Sum = 7074; MCmax ≈ 1.175) | Queen Adjacency Definition (SWM Elements Sum = 8494; MCmax ≈ 1.125) | ||||||
|---|---|---|---|---|---|---|---|---|
| Y | PSA | NSA | PSA + NSA | Y | PSA | NSA | PSA + NSA | |
| # eigenvectors | 0 | 204 (385) | 66 (400) | 270 (785) | 0 | 186 (365) | 41 (366) | 227 (731) |
| MC | 0.64 | 0.89 | −0.42 | 0.81 | 0.59 | 0.84 | −0.38 | 0.78 |
| GR | 0.37 | 0.21 | 1.48 | 0.27 | 0.37 | 0.21 | 1.48 | 0.25 |
| R2 | 0 | 0.750 | 0.052 | 0.802 | 0 | 0.730 | 0.038 | 0.768 |
| Residual zMC | 37.8 | −1.0 | 2.2 | 38.6 | 0.8 | 3.2 | ||
| Residual zGR | −14.3 | 0.7 | −1.2 | −14.5 | −0.3 | −2.0 | ||
| Feature | Rook Adjacency Definition (SWM Elements Sum = 7700; MCmax ≈ 1.111) | Queen Adjacency Definition (SWM Elements Sum = 8096; MCmax ≈ 1.152) | ||
|---|---|---|---|---|
| SAR | SARSM ‡ | SAR | SARSM ‡ | |
| () | 0.585 (0.025) | 0.988 (0.005) | 0.593 (0.025) | 0.988 (0.005) |
| () | 0 | 0.880 (0.022) | 0 | 0.877 (0.022) |
| 0 | 0.808 | 0 | 0.805 | |
| Average lag-1 spatial correlation | 0.31 | 0.38 | 0.31 | 0.39 |
| pseudo-R2 | 0.326 | 0.326 | ||
| Residual zMC | −2.4 | −0.1 | −2.3 | −0.1 |
| Residual zGR | −0.2 | −1.1 | −0.4 | −1.3 |
Disclaimer/Publisher’s Note: The statements, opinions and data contained in all publications are solely those of the individual author(s) and contributor(s) and not of MDPI and/or the editor(s). MDPI and/or the editor(s) disclaim responsibility for any injury to people or property resulting from any ideas, methods, instructions or products referred to in the content. |
© 2023 by the author. Licensee MDPI, Basel, Switzerland. This article is an open access article distributed under the terms and conditions of the Creative Commons Attribution (CC BY) license (https://creativecommons.org/licenses/by/4.0/).
Share and Cite
Griffith, D.A. Understanding Spatial Autocorrelation: An Everyday Metaphor and Additional New Interpretations. Geographies 2023, 3, 543-562. https://doi.org/10.3390/geographies3030028
Griffith DA. Understanding Spatial Autocorrelation: An Everyday Metaphor and Additional New Interpretations. Geographies. 2023; 3(3):543-562. https://doi.org/10.3390/geographies3030028
Chicago/Turabian StyleGriffith, Daniel A. 2023. "Understanding Spatial Autocorrelation: An Everyday Metaphor and Additional New Interpretations" Geographies 3, no. 3: 543-562. https://doi.org/10.3390/geographies3030028
APA StyleGriffith, D. A. (2023). Understanding Spatial Autocorrelation: An Everyday Metaphor and Additional New Interpretations. Geographies, 3(3), 543-562. https://doi.org/10.3390/geographies3030028


