

Estimating Riparian Water Movement in an Incipient Karst Landscape—Minnesota, USA

1
Department of Bioproducts and Biosystems Engineering, University of Minnesota, St. Paul, MN 55108, USA
2
Minnesota Department of Agriculture, Preston, MN 55965, USA
*
Author to whom correspondence should be addressed.
Geographies 2024, 4(1), 83-94; https://doi.org/10.3390/geographies4010006
Submission received: 10 October 2023
/
Revised: 24 November 2023
/
Accepted: 20 December 2023
/
Published: 1 February 2024
Abstract
:Understanding rain, ground, and surface water interactions in riparian zones is essential for hydrologic and environmental management. The novelty of this study lies in its revelation of isotopic shifts and consequent evaluation of hydrologic pathways and processes within the forested riparian zones of three distinct streams, valleys, and riparian systems in a carbonate-sandstone incipient karst landscape. We collected water samples from three southeastern Minnesota catchments: Trout Brook, Crystal Creek, and Bridge Creek. A Picarro L2130i was used to measure δ18O for oxygen, and δD for deuterium in units of ‰ (per mil). We estimated the global meteoric line for the study sites, built upon aquifer age dating, and explored aquifer transit time for the study sites using a simple seasonal amplitude model. The results showed small amplitudes for 2020 and 2021, suggesting that bedrock aquifer water was the primary source water with a mean core transit time greater than 10 years. All three catchments were different but had similar bedrock valley types and riparian sediment. The primary driving factor was the seasonal precipitation input mixing with existing water. In a normal to wetter year, the isotopic data showed larger amplitude shifts between seasons with trendlines that adjusted depending on the temperature of the new water additions. The proposed approach is valuable in revealing complex hydrologic processes and pathways and can contribute extensively to the planning and management of karst riparian systems.
1. Introduction
Systematic groundwater management, planning, and environmental impact prediction are critical to understanding groundwater and surface water dynamics. Karst aquifers have been recognized as a plentiful source of freshwater, sustaining people, agriculture, and ecosystems worldwide [1,2]. White defines approximately 15% of the Earth’s surface as “karst” [3]. Karst geography occurs where carbonate rocks develop caves, sinkholes, and conduits after undergoing dissolution [4]. Carbon dioxide (CO2) is abundant in soil compared to the atmosphere, and as water moves through the soil, some of the CO2 is pulled from the soil to create carbonic acid, which, over time, dissolves carbonate rock. Karst catchments exhibit a significant level of intricacy and diversity in their hydrological connectivity that can be broadly characterized by concentrated and dispersive water infiltration. Rapid turbulent flow over considerable distances occurs in mature subsurface conduit systems. Though the fundamental hydrological properties of karst systems are more commonly recognized, accurately quantifying the specific hydrological processes and their prevalence under varying hydrological conditions can be particularly challenging [5].
Not all karst terrains develop well-defined sinkholes and cave systems. The geography discussed in this paper is more focused on landscapes that lack extensive cave systems and have water movement and storage in riparian areas underlain with sedimentary deposits; thus, the term “incipient karst” best fits the focus of our work [6]. Depending on the conduit/cave size, their roughness index/irregularities, and water movement across the solutional enlarged fractures may typically be more laminar than turbulent flow. Therefore, owing to the disparity in the fracture extents, the hydrological processes of “incipient” karst cannot be equated to “Epikarst”. Epikarst typically supports a perched phreatic zone by retarding and storing infiltrating rainwater [7]. The incipient karst is constrained by aquitard force lateral movement of rainwater into streams [8]. This distinction is vital regarding riparian connectivity [9], as illustrated by our study results compared to Hu and others [10]. The study watershed considered in Hu and others [10] was set in dolomite and was similar to the karst geography of southeastern Minnesota (SEMN, the selected study area in this research) except the climatic and extent of karst formation. They did not recognize groundwater movement through fractures as the critical hydrologic pathway.
The study watersheds are located in southeastern Minnesota’s Driftless Area, an area of land not directly impacted by the most recent glaciation which occurred about 10,000 years ago [11,12]. This area has remarkably complex hydrogeologic processes with diverse land use and farming systems. The geology of the Driftless Area is comprised of alternating layers of carbonate bedrock, sandstone, and shale and includes karst features, such as dissolutionally enlarged fractures, subterranean conduits, sinkholes, and springs. These features are part of a hydrologic system that dictates and controls how surface water and groundwater interact, as explained by [13].
The predominant land use within this geographic area is agriculture, consisting mainly of dairy, hog, corn, soybean, and alfalfa production. The excessive use of fertilizer raises concerns regarding the subsequent nitrate levels [14]. Consequently, there is an urgent need for a comprehensive understanding and characterization of SEMN hydrological connectivity. Nitrate pollutants enter the groundwater through a complex process that includes slow infiltration into the rock matrix, fracture flow, and rapid conduit flow. Within the groundwater, these nitrates can travel considerable distances through conduits or remain stored in the rock matrix for extended periods, highlighting the need for a thorough understanding of their behavior [15].
Past research works have analyzed the use of naturally occurring environmental isotopes within karst landscapes for determining the subsurface and groundwater flow paths and water transit time using isotopic fractionation [5,10]. Guo and others [16] identified an intermittent karst spring’s recharge source, migration paths, and evolution process in China using stable hydrogen and oxygen isotopes and integrated water chemistry. Wang and others [17] performed weekly monitoring of the chemical characteristics and stable isotopes using 2017 and 2018 daily hydrologic data and analyzed seasonal recharge sources and processes in a dolomitic catchment. Setiawan and others [18] studied 50 hydrogeological features and analyzed the chemical–physical groundwater properties, stable isotopes of groundwater and rainwater, and major ions to characterize the karst hydrogeology of the Watuputih Hills region of Central Java, Indonesia. Previous age dating by the United States Geological Survey (USGS) [19] provides a strong understanding of hydraulic residence within the aquifer material but does not completely provide an understanding of mixing processes at the exchange interface. Depending on riparian land elevation and valley type, the headwaters of small streams can exhibit variable source area (VSA) theory (Figure 1), which means surface water can dominate the stream water composition [9]. The sampling location position, near the hillslope-valley floor divide compared to downstream riparian locations where channel and bank storage processes dominate, makes the use of VSA theory a worthwhile exercise. The VSA concept, pioneered by Hewlett and Hibbert [20] (as noted by McDonnel [21]), showed the various stages of flow and described the factors of influence.
Based on the work previously described above, we focused on the dynamic exchange of water that can occur in non-epikarst soils/sediments where under dryer climatic conditions older groundwater can play a more dominant role in the source and hydrologic pathway of resurgence into the stream. Yet, under climatic conditions that have been increasingly wet compared to past climatic records, larger volumes of rain or snowmelt are moving across the active riparian zone. Depending on stream characteristics, these increased volumes can dominate the stream’s source and type of water [9,22]. Thus, we aim to capture the water movement and intricacies of the hydrologic pathways and processes in, over, and through the different types of riparian zones found in SEMN. Compared to previous works, the primary focus of the current research is on the channel and riparian active floodplain to unearth the mixing processes at the riparian zones.
2. Study Area and Hydrologic Processes
In this study, we selected three small watersheds with sites that included springs and shallow riparian piezometers located in Trout Brook, a tributary to the Cannon River in Dakota County, Minnesota, Crystal Creek (Fillmore County) and Bridge Creek (Houston County), small watersheds located in the South Branch of the Root River watershed (Figure 2). All three watersheds contain deciduous forests that allow for snow accumulation compared to open row crop fields or even coniferous forests which enhance sublimation. Accumulated snow typically melts and infiltrates into the soil to recharge groundwater; however, if temperatures rise quickly, melted snow can runoff over frozen ground. However, if the temperatures rise quickly and stay warm into the night, then the snow will melt and runoff over frozen ground occurs [9]. We captured pre- and post-melt water runoff events in all three study watersheds. The spring thaw/melt should be considered a lower-magnitude, longer-duration event reflecting cold isotopically depleted water additions to both springs and streams. New rain can fall this time of year, but precipitation intensity is attenuated (or buffered) compared to summer rain because the rain particle size is generally soft and small compared to summer storm event rain.
The watersheds experience a cold and subhumid climate, apart from noticeable temperature differences between summer and winter, i.e., 22.7 °C/72.8 °F average temperature in summer (June to August) and −7.1 °C/19.2 °F in winters (December to February) [23]. The winters, through December till March, experience consistent snow cover, and the soil frost layer often exceeds 1 m depth for approximately 4 to 5 months in a year, which hampers the downward movement of infiltration of rainwater [13]. As documented in [24], the wettest months in the region occur in June, July, and August with peak groundwater recharge taking place in the spring (March to May) and fall (September to November) seasons, driven by the combined factors of snowmelt and precipitation.
Typically, in the forested portion of the studied watershed, our study streams flow due to a rise in the shallow water table in a concave landscape—also known as “Variable Source Area” (VSA) [25] Figure 1.
The largest annual flow event in these forested soils has historically been caused by soil thawing and snow melting, though this pattern may be changing. Rainfall data, provided by the MN Department of Natural Resources over the last decade show increasing rainfall in the summer months, leading to increased surface runoff. This is caused by short-duration but high-intensity rainfall events, where water delivery is faster than the infiltration rate of the soil. This is exacerbated in the intensively managed row-crop areas of the Crystal Creek study watershed where forest canopy interception does not occur.
3. Materials and Methods
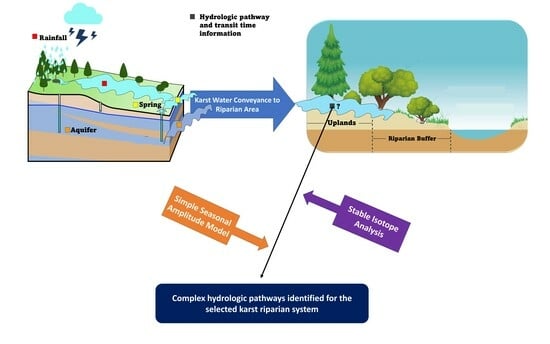
The stable isotopes of hydrogen and oxygen were used in this study to better understand source water at the interface of subsurface discharge to surface water streams—the riparian zone. The process entails water sample collections from the study sites followed by the laboratory analysis of samples for capturing the isotopic contents and finally conducting meteoric water sample study and transit time estimations for determining the composition and characteristics of the source water in the riparian zones (Figure 3).
3.1. Data Collection
The selection of sampling sites for this study involved a team of researchers from the University of Minnesota, U.S. Geological Survey (USGS), Minnesota Geological Survey (MGS), and Minnesota state agencies interested in tracking nitrate movement in groundwater. We coordinated with Jared Trost, USGS, who conducted a water age-dating study using methods developed by the USGS [26] and the Root River Field to Stream Partnership led by the Minnesota Department of Agriculture.
The data samples collected using vials and bottles provided by the Magner Lab were gauged for their temperature, specific conductance, pH, and dissolved oxygen (DO) using a typical YSI multiparameter sonde. Precipitation samples collected from study sites for isotopic analysis were sent to the UMN Lab to measure δ18O for oxygen, and δD for deuterium in units of ‰ (per mil) [10]. A subset of samples was also analyzed for major Anions, including Nitrate-Nitrogen, to compare the biogeochemical processes with the past chemical data (10 years old or more) collection [27] trends. HOBO pressure transducers were also placed in selected piezometers to track stage response over time to new precipitation.
3.2. Measurement of Stable Isotopes of Hydrogen and Oxygen
Isotope data measurement in this study differs from direct field-based concentration measurements typically carried out using inductive plasm or gas chromatograph mass spectrometry. We measured a ratio of heavy/enriched (extra neutron) to the light/depleted (typically 99.9% of most water) isotopes expressed as delta (or δ18O for oxygen, and δD for deuterium) in units of ‰ or per mil. The delta values tend to be negative unless the water is collected near the equator. The exceptionally light or depleted delta values are found near the north or south poles or high mountain peaks where the temperature is cool to cold, whereas heavy or more enriched water with extra neutrons tends to be found in the warmest places on Earth. Finally, the values were plotted against each other to express a water identity.
A slope (the Black Line, Figure 3 and Figure 4) represented using the 2nd equation is known as the Global Meteoric Water Line (MWL).
where is δD and is δ18O.
Depending on the precipitation location, all precipitation in the world can be located somewhere on the MWL [28]. Near the equator and sea level, the warmest temperatures occur giving rise to the most enriched water which can then move as a cloud over land masses. Because Minnesota is located between the Arctic and the Equator, we can observe unique combinations of isotopic water. Moreover, the differences occurring at the extremes referred to as “End Member” vs. “mixed” water or varying combinations of light and heavy water could be explained in terms of changes in season (summer vs. winter) and cloud banks (Arctic vs. Gulf air).
Another unique water signature can be derived from surface water that evaporates. The heavy hydrogen evaporates slightly faster than the heavy oxygen. It creates data that plot to the right of the MWL on a flatter slope, pointing to evaporative surface water as a unique fingerprint that guides hydrologic interpretation. This process is known as fractionation. Because the study areas have little or no lake/wetland features, we did not anticipate finding an evaporative signature in this study. We hypothesize that most water movement in SEMN will infiltrate and percolate through soil and rock. Apart from evapotranspiration, a portion of the precipitation will recharge groundwater.
Further, to estimate the mean transit time (T) or locational mixing for the defined system, typically a spring above the stream elevation, we applied a simple amplitude model (Equation (1)) used by Zhang and others [29], neglecting the assumption that all water leaving a spring was pure unmixed aquifer formation water.
where 1/ῳ is equal to the angular frequency of variation or (2π × 365 days), then multiplied by the square root of (A) the input (or precipitation) amplitude, divided by (B) the output amplitude of the discharging water squared minus 1.
4. Results
4.1. Riparian Hydrologic Pathways Identification Using Isotopic Shifts for Crystal Creek
The results (Figure 4) indicate a clear gradient of depleted water, beginning with the snowpack to the Crystal Creek Outlet, extending into more enriched locations on the MWL. Also, noticing the average of the samples’ stable isotopes for the studied location, we can find that Twin Springs data values are more depleted than Crystal Spring followed by Crystal Creek Outlet and Snowpack. By contrast, with the exception of a data point with −11 for δ18O and −80 for δD, the Crystal Spring data partially cluster around −9 for δ18O and −60 for δD.
The data in Figure 5 zoom closer to illustrate seasonal changes in Crystal Creek. The data for March 2019 plot together in a typical springtime location for southeastern Minnesota. Data for December of 2019 show more depleted water which then shifts to more enriched water in February of 2020 but with a similar trendline as the March 2019 trendline. The summer of 2020 is the most enriched water, but only slightly more than the February 2020 data. Then, the December 2020 data shift back to a depleted location. Lastly, the 2021 data plot between the summer of 2020 and December of 2020.
4.2. Riparian Hydrologic Pathways for Bridge Creek and Trout Brook
Similar to Figure 5 for Crystal Creek, the data plotted in Figure 6 show shifting with seasons, where December of 2019 is depleted but shifts to being more enriched in August 2020 and even more enriched in October 2020. February 2021 isotopic data plot between August and October 2020 with an average of −9.04 for δ18O and −60.8 for δD. Remarkably, the February 2021 data plots are nearly identical to the MWL. Perhaps the most observable comparison between Figure 6 and Figure 5 is the relative “tightness” of all the data compared to Figure 5 data. Averaging October 2020 and February 2021, the data show −8.96 for δ18O, and −59.94 for δD. These data all plot very close to the MWL.
Also, Figure 7 highlights the variation in isotopic composition in the samples collected during wetter and drought periods. As shown above, when drought conditions begin to dominate, the data values start moving closer to −60 for δD and −9 for δ18O, whereas for the rest of the year the data plot to the left. Further, it can be observed, as we move later in the year from May to September, that the data are continually enriched and follow a trend closer to the MWL. However, interestingly in August and September, we can find some shift backs of data with August occupying a position between May and July and some samples of September occurring close back to May.
4.3. Spring Aquifers Transit Time
When we remove the effects of the rapid hydrologic pathway depicted by the spikes, alter δD values (Figure 8), and examine the amplitude of change for the later portion of 2019, we can see a mean core aquifer transit time of 9 years. The mean core aquifer transit time jumps to 22 years in 2020. Twin Spring (C3) values in 2020 are slightly less at 16 years (Figure 8). For the Crystal Creek outlet (CCO) in 2020, the values jump around during any given datum and show no clear, consistent aquifer input pathway. Like other springs in this study, the Jerry Lee spring shows a doubling of mean core aquifer transit time from 2019–2020, or 5 years to 11 years, near the end of 2020. Trout Brook has multiple springs with a range of mean core aquifer transit time or hydraulic residence from 4.3 years to 21 years. Closer to the mouth of Trout Brook, Swede Spring showed a 17-year hydraulic residence.
5. Discussion
Seasonal oscillation and the associated hydrological processes along with monthly weather patterns influence the surface water isotopic composition. In extended drought, no new precipitation typically reveals a very strong aquifer influence with older water. The surface water close to the resurging groundwater can be nearly geochemically identical to the aquifer water. In contrast, wet weather conditions can have vital mixing components and produce a mixed signature of aquifer water, soil water, and new precipitation in the surface water that differs from a solo aquifer water signature.
The clustering of the majority of Crystal Spring data at (−9, −60), the regional aquifer average, suggests that the water at Crystal Spring primarily constitutes aquifer waters. The wide range of sample data spread across the MWL for Crystal Creek Outlet (CCO) in Figure 4 signifies that CCO has a significant change amplitude and observes a mixed discharge contributed by different signature sources. A range of depleted water at CCO also suggests the influence of seasonal temperature variations. The broader range covered by the data points at CCO confirms its contributions from both the Twin and Crystal springs; however, the sample points go further left, signifying an addition of colder snow melt water, i.e., the Snowpack. For the entire Crystal Creek time sequence from December 2019–March 2021, the maximum shift back could be noted for the year 2020 from Summer to December; this is primarily because of the new cold-water additions and validated on account of the relatively colder temperature of Minnesota in 2020 compared to 2019 [29]. The up–down fluctuation of the perceived isotopic composition from Summer 2020 to 2021 data presents the seasonal amplitude variation influenced by the temperatures of new water additions. The data plot also shows the absence of the data points to the right of the MWL with a fractionated signature, which indicates that stored lake or wetland water was not relevant to the system.
If we focus on a subset of data from the Crystal Creek system (Figure 6), it is clear that new water additions can be observed to spike and alter the δD values by more than one-third of the pre-event water (Figure 8). Note that the Crystal Creek Outlet was dominated by snowmelt inputs from the end of February to nearly the end of March 2021. This water appears to come from the Twin Springs system, primarily noticing the magnitude and direction amplitude shift in relation to Twin Spring water isotopic composition. Also, this rapid short-circuiting of new water mixing with pre-event water illustrates the difficulty of measuring aquifer water age in a multi-flow-path karst system. The significant leap in the mean core aquifer transit time from 9 to 22 years could be attributed to the drought conditions allowing aquifer water to dominate discharge at Crystal Spring. The average aquifer water age results obtained in this study are in consensus with [30]’s average aquifer water age range (from 10 to 30 years) derived from age dating. Also, the contribution of the Twin and Crystal Spring to Crystal Creek is validated by another study by Kuehner [31,32], where the use of the dye tracers has revealed that groundwater recharge is primarily locally derived, moves laterally through variable directions, and rates and returns to Crystal Creek as baseflow from three primary springs including two springs featured in this study.
Similarly, the data values for February 2021 (Figure 6) and an average of February and October 2021 (Figure 7) for the Bridge Creek and Trout Brook systems reflecting stronger aquifer signatures and little or no new water inputs can be explained. The tightness of the data plots for Crystal Creek and Bridge Creek remarks that Crystal Creek undergoes more active water mixing from different sources, including aquifers, soil, and rainwater, compared to the Bridge Creek system. The doubling of the mean core aquifer transit time for JLS spring, which flows to Bridge Creek (Section 4.3), likely shows the stronger influence of regional aquifer water. Numerous investigations [33,34] support our study findings by indicating that the springs supply groundwater to area streams like Bridge Creek. JLS is one of such springs featured in this study.
The isotopically depleted snowmelt and early spring rain of 2020 place the Trout Brook data to the left whereas the other data cluster towards the right in Figure 7, which signifies aquifer water as a driver for the Trout Brook system during drought. The extensive range (4.3 to 21 years) of mean core aquifer transit times exhibited by Trout Brook spring suggests the dynamic and easy mixing of new waters in its spring system.
6. Conclusions
Karst waters are a significant source of water for various activities and are crucial in systematic water resources and environmental planning and management. However, the hydrologic processes and pathways in the channel and riparian active floodplains contributed by the “incipient” karst are poorly understood for southeastern Minnesota’s (SEMN) karst landscapes. Thus, the present research identifies the intricacies of the water movement in the southeastern Minnesota (SEMN) riparian zones utilizing the stable isotope of hydrogen and oxygen. We selected several springs and shallow riparian piezometers from three small watershed locations in Dakota, Fillmore, and Houston Counties. This study’s findings are as follows: (i) Crystal Creek Outlet’s isotopic composition is notably influenced by snowmelt from the Twin Springs system; (ii) seasonal amplitude changes in Crystal Creek, Bridge Creek, and Trout Brook systems are linked to the temperatures of new water additions, primarily consisting of regional aquifer water during drought conditions; and (iii) data collected in late 2020 and 2021 show minimal surface water amplitude fluctuations, indicating that aquifer water is the primary source with mean core aquifer transit times ranging from over ten years to more than twenty years. These results are consistent with age-dating results from the USGS, providing validation for this study’s conclusions. Examining the hydrologic pathways and processes by integrating isotopic composition data with a simple amplitude model [28] and the Global Meteoric Water Line concept can significantly contribute to and transform the management of intricate karst riparian systems and enhance the precision of catchment management. The current analysis is limited by the amount of data available. However, clusters of data above the MWL in all case scenarios favor overlooking this defect. We recommend future research with longer duration and intensive data coverage to develop deeper insights into the different source contributors influencing the hydrologic processes and pathways in SEMN.
Author Contributions
Conceptualization, J.M.; methodology, J.M.; software, S.A.; formal analysis, J.M. and K.J.K.; writing—original draft preparation, J.M. and S.A.; writing—review and editing, S.A. and J.M.; supervision, J.M. All authors have read and agreed to the published version of the manuscript.
Funding
State of Minnesota, Environmental Natural Resources Trust Fund. Minnesota Department of Agriculture’s Root River Field to Stream Partnership and Clean Water, Land and Legacy Amendment.
Data Availability Statement
Publicly available datasets were analyzed in this study, see [18].
Conflicts of Interest
The authors declare no conflicts of interest.
References
- Goldscheider, N.; Chen, Z.; Auler, A.S.; Bakalowicz, M.; Broda, S.; Drew, D.; Hartmann, J.; Jiang, G.; Moosdorf, N.; Stevanovic, Z.; et al. Global Distribution of Carbonate Rocks and Karst Water Resources. Hydrogeol. J. 2020, 28, 1661–1677. [Google Scholar] [CrossRef]
- Li, Y.; Shu, L.; Wu, P.; Zou, Z.; Lu, C.; Liu, B.; Niu, S.; Yin, X. Influence of the Karst Matrix Hydraulic Conductivity and Specific Yield on the Estimation Accuracy of Karstic Water Storage Variation. J. Hydrol. 2023, 626, 130186. [Google Scholar] [CrossRef]
- White, W.B. Cave—Karst, Terrain, Distribution|Britannica. Available online: https://www.britannica.com/science/cave/Geographic-distribution-of-karst-terrain (accessed on 4 October 2023).
- Beynen, P.E. Karst Management; Springer: Dordrecht, The Netherlands, 2011; ISBN 978-94-007-1207-2. [Google Scholar]
- Rusjan, S.; Sapač, K.; Petrič, M.; Lojen, S.; Bezak, N. Identifying the Hydrological Behavior of a Complex Karst System Using Stable Isotopes. J. Hydrol. 2019, 577, 123956. [Google Scholar] [CrossRef]
- Aliouache, M.; Wang, X.; Jourde, H.; Huang, Z.; Yao, J. Incipient Karst Formation in Carbonate Rocks: Influence of Fracture Network Topology. J. Hydrol. 2019, 575, 824–837. [Google Scholar] [CrossRef]
- Bakalowicz, M. Chapter 45—Epikarst. In Encyclopedia of Caves, 3rd ed.; White, W.B., Culver, D.C., Pipan, T., Eds.; Academic Press: Cambridge, MA, USA, 2019; pp. 394–398. ISBN 978-0-12-814124-3. [Google Scholar]
- Runkel, A.C.; Tipping, R.G.; Meyer, J.R.; Steenberg, J.R.; Retzler, A.J.; Parker, B.L.; Green, J.A.; Barry, J.D.; Jones, P.M. A Multidisciplinary-Based Conceptual Model of a Fractured Sedimentary Bedrock Aquitard: Improved Prediction of Aquitard Integrity. Hydrogeol. J. 2018, 26, 2133–2159. [Google Scholar] [CrossRef]
- Brooks, K.N.; Ffolliott, P.F.; Magner, J.A. Hydrology and the Management of Watersheds, 4th ed.; Wiley-Blackwell: Hoboken, NJ, USA, 2012; ISBN 978-1-118-45974-4. [Google Scholar]
- Hu, K.; Chen, H.; Nie, Y.; Wang, K. Seasonal Recharge and Mean Residence Times of Soil and Epikarst Water in a Small Karst Catchment of Southwest China. Sci. Rep. 2015, 5, 10215. [Google Scholar] [CrossRef] [PubMed]
- Lusardi, B.A.; Dengler, E.L. Minnesota at a Glance: Quaternary Glacial Geology. 2017. Available online: https://conservancy.umn.edu/handle/11299/59427 (accessed on 19 December 2023).
- Runkel, A.C.; Steenberg, J.R.; Tipping, R.G.; Retzler, A.J. Geologic controls on groundwater and surface water flow in southeastern Minnesota and its impact on nitrate concentrations in streams. Minn. Geol. Surv. Open File Rep. 2014, 14, 70. [Google Scholar]
- Barry, J.D.; Runkel, A.C.; Alexander, E.C., Jr. Synthesizing multifaceted characterization techniques to refine a conceptual model of groundwater sources to springs in valley settings (Minnesota, USA). Hydrogeol. J. 2023, 31, 707–729. [Google Scholar] [CrossRef]
- Barry, J.; Larsen, M.R.; Tipping, R.G.; Alexander, S.C.; Alexander, E.C., Jr. Bear Spring Olmsted County, Minnesota; University Digital Conservancy: Minneapolis, MN, USA, 2018. [Google Scholar]
- Seltzer, C. Mineralogical Characterization of Subsurface Carbonate Rocks Located in Southeastern Minnesota. 2023. Available online: https://hdl.handle.net/11299/256252 (accessed on 19 December 2023).
- Guo, X.; Chen, Q.; Huang, H.; Wang, Z.; Li, J.; Huang, K.; Zhou, H. Water Source Identification and Circulation Characteristics of Intermittent Karst Spring Based on Hydrochemistry and Stable Isotope—An Example from Southern China. Appl. Geochem. 2022, 141, 105309. [Google Scholar] [CrossRef]
- Wang, F.; Chen, H.; Lian, J.; Fu, Z.; Nie, Y. Seasonal Recharge of Spring and Stream Waters in a Karst Catchment Revealed by Isotopic and Hydrochemical Analyses. J. Hydrol. 2020, 591, 125595. [Google Scholar] [CrossRef]
- Setiawan, T.; Syah Alam, B.Y.C.S.S.; Haryono, E. Hendarmawan Hydrochemical and Environmental Isotopes Analysis for Characterizing a Complex Karst Hydrogeological System of Watuputih Area, Rembang, Central Java, Indonesia. Hydrogeol. J. 2020, 28, 1635–1659. [Google Scholar] [CrossRef]
- USGS. Groundwater Age. 2019. Available online: https://www.usgs.gov/mission-areas/water-resources/science/groundwater-age#publications (accessed on 19 December 2023).
- Hewlett, J.; Hibbert, A.R. Factors Affecting the Response of Small Watersheds to Precipitation in Humid Areas. In International Symposium on Forest Hydrology; Pergamon Press: New York, NY, USA, 1967. [Google Scholar]
- McDonnell, J.; Hewlett, J.D.; Hibbert, A.R. 1967: Factors Affecting the Response of Small Watersheds to Precipitation in Humid Areas. In Sopper, W.E. and Lull, H.W., Editors, Forest Hydrology. Prog. Phys. Geogr. 2009, 33, 288–293. [Google Scholar] [CrossRef]
- Rai, S.; Srinivas, R.; Magner, J. Using Fuzzy Logic-Based Hybrid Modeling to Guide Riparian Best Management Practices Selection in Tributaries of the Minnesota River Basin. J. Hydrol. 2022, 608, 127628. [Google Scholar] [CrossRef]
- NOAA. National Oceanic and Atmospheric Administration. Available online: https://www.noaa.gov/climate (accessed on 5 October 2023).
- MSCO. High Density Radius Retrieval 071210. Available online: https://climateapps.dnr.state.mn.us/hidradius/radius_new.asp (accessed on 5 October 2023).
- Ritter, D.F.; Kochel, R.C.; Miller, J.R. Process Geomorphology, 5th ed.; Waveland Press Inc.: Long Grove, IL, USA, 2011; ISBN 978-1-57766-669-1. [Google Scholar]
- Jurgens, B.C.; Böhlke, J.K.; Haase, K.; Busenberg, E.; Hunt, A.G.; Hansen, J.A. DGMETA (Version 1)—Dissolved Gas Modeling and Environmental Tracer Analysis Computer Program; U.S. Geological Survey: Reston, VA, USA, 2020. [Google Scholar]
- Pencak, E.S.; Alexander, S.C.; Alexander, E.C. From Spring to Stream: Water Quality Analysis in Trout Brook, Dakota County, MN. 2018. Available online: https://conservancy.umn.edu/handle/11299/196199 (accessed on 19 December 2023).
- Zhang, L.; Magner, J.; Strock, J. Exploring a Climate Gradient of Midwestern USA Agricultural Landscape Runoff Using Deuterium (δD) and Oxygen-18 (δ18O). Water 2022, 14, 1629. [Google Scholar] [CrossRef]
- DNR. Weekly Snow Depth and Rank Maps. Available online: https://www.dnr.state.mn.us/climate/snowmap/index.html (accessed on 5 October 2023).
- Nieber, J.L. Setting Realistic Nitrate BMP Goals in Southeast Minnesota. 2022. Available online: https://experts.umn.edu/en/projects/setting-realistic-nitrate-bmp-goals-in-southeast-minnesota/fingerprints/ (accessed on 19 December 2023).
- Kuehner, K.J.; Green, J.A.; Barry, J.D.; Rutelonis, J.W.; Wheeler, B.J.; Kasahara, S.M.; Luhmann, A.J.; Alexander, E.C., Jr. Crystal Creek Dye Trace Report Fillmore County, Minnesota. Retrieved from the University of Minnesota Digital Conservancy. 2017. Available online: https://conservancy.umn.edu/handle/11299/188258 (accessed on 19 December 2023).
- Kuehner, K.J.; Green, J.A.; Wheeler, B.J.; Kashahara, S.P.; Luhmann, A.J.; Alexander, E.C., Jr. Water Tracing in the Crystal Creek Watershed in Minnesota. In Proceedings of the Geological Society of America Annual Meeting, Denver, CO, USA, 25–28 September 2016; Available online: https://gsa.confex.com/gsa/2016AM/webprogram/Paper283033.html (accessed on 19 December 2023).
- Barry, J.D.; Green, J.A. Report on the 2012–2013 traces conducted on Bridge Creek; MDNR: Lansing, MI, USA, 2014; Available online: https://files.dnr.state.mn.us/waters/groundwater_section/mapping/dyetrace/Houston_2013-2014_BridgeCreek_01Aug2016.pdf (accessed on 19 December 2023).
- Runkel, A.C.; Tipping, R.R.; Green, J.A.; Jones, P.M.; Meyer, J.R.; Parker, B.L.; Steenberg, J.R.; Retzler, A.J. OFR14-04, Hydrogeologic Properties of the St. Lawrence Aquitard, Southeastern Minnesota; Retrieved from the University of Minnesota Digital Conservancy; Minnesota Geological Survey: St Paul, MN, USA, 2014; Available online: https://hdl.handle.net/11299/165299 (accessed on 19 December 2023).
Figure 1.
Illustrates the VSA concept by depicting saturated area variations for a small, well-drained watershed. The white lines are the expression of the water table year-round, and the dark blue areas show the expansion of surface water expression after precipitation input and/or when evapotranspiration halts.

Figure 2.
The study area map highlights Dakota, Fillmore, and Houston Counties and the corresponding water sampling locations marked with the numbers 1, 2, and 3, respectively.
Figure 2.
The study area map highlights Dakota, Fillmore, and Houston Counties and the corresponding water sampling locations marked with the numbers 1, 2, and 3, respectively.

Figure 3.
Schematic representation of the methodology adopted in this study.

Figure 4.
A broad plot of δ18O and δD plotting along the global MWL (solid black line) and snow samples plotting to the far lower left.
Figure 4.
A broad plot of δ18O and δD plotting along the global MWL (solid black line) and snow samples plotting to the far lower left.

Figure 5.
A plot of δ18O and δD for Crystal Creek samples. The solid black line is the global MWL as described above. The dashed lines are trendlines for a given season, beginning with March of 2019 through March of 2021. Note the trendlines shift with every season.
Figure 5.
A plot of δ18O and δD for Crystal Creek samples. The solid black line is the global MWL as described above. The dashed lines are trendlines for a given season, beginning with March of 2019 through March of 2021. Note the trendlines shift with every season.

Figure 6.
A plot of δ18O and δD for Bridge Creek samples. The solid black line is the global MWL as described above. The dashed lines are trendlines for a given season beginning from December of 2019 through February of 2021. Note the trendlines shift with every season.
Figure 6.
A plot of δ18O and δD for Bridge Creek samples. The solid black line is the global MWL as described above. The dashed lines are trendlines for a given season beginning from December of 2019 through February of 2021. Note the trendlines shift with every season.

Figure 7.
A plot of δ18O and δD for Trout Brook samples. The solid black line is the global MWL as described above. The dashed lines are trendlines for a given season, beginning with May of 2020 through February of 2021. One October 2020 data point plots to the right of the MWL.
Figure 7.
A plot of δ18O and δD for Trout Brook samples. The solid black line is the global MWL as described above. The dashed lines are trendlines for a given season, beginning with May of 2020 through February of 2021. One October 2020 data point plots to the right of the MWL.

Figure 8.
The δD snow input at different locations within the Crystal system from the end of February to the end of March 2021, where C3 = Twin Spring, C1S = Crystal Spring, C3E = Twin Springs East, C3W = Twin Springs West, and CCO = Crystal Creek Outlet. (Non-published data of Kuehner, 2021).
Figure 8.
The δD snow input at different locations within the Crystal system from the end of February to the end of March 2021, where C3 = Twin Spring, C1S = Crystal Spring, C3E = Twin Springs East, C3W = Twin Springs West, and CCO = Crystal Creek Outlet. (Non-published data of Kuehner, 2021).

Disclaimer/Publisher’s Note: The statements, opinions and data contained in all publications are solely those of the individual author(s) and contributor(s) and not of MDPI and/or the editor(s). MDPI and/or the editor(s) disclaim responsibility for any injury to people or property resulting from any ideas, methods, instructions or products referred to in the content. |
© 2024 by the authors. Licensee MDPI, Basel, Switzerland. This article is an open access article distributed under the terms and conditions of the Creative Commons Attribution (CC BY) license (https://creativecommons.org/licenses/by/4.0/).
Share and Cite
MDPI and ACS Style
Aggarwal, S.; Kuehner, K.J.; Magner, J. Estimating Riparian Water Movement in an Incipient Karst Landscape—Minnesota, USA. Geographies 2024, 4, 83-94. https://doi.org/10.3390/geographies4010006
AMA Style
Aggarwal S, Kuehner KJ, Magner J. Estimating Riparian Water Movement in an Incipient Karst Landscape—Minnesota, USA. Geographies. 2024; 4(1):83-94. https://doi.org/10.3390/geographies4010006
Chicago/Turabian StyleAggarwal, Shubham, Kevin J. Kuehner, and Joe Magner. 2024. "Estimating Riparian Water Movement in an Incipient Karst Landscape—Minnesota, USA" Geographies 4, no. 1: 83-94. https://doi.org/10.3390/geographies4010006