1. Introduction
Unlike the highly input-dependent monocultures that make up a large portion of the food production system [
1,
2], diversified agroecosystems have the capacity to maintain ecosystem services, biodiversity, and farmer livelihoods representing a more sustainable alternative to monocultures [
3,
4,
5]. Coffee agroecosystems are ecologically, economically, and politically significant to the neotropics [
6]. Ecologically, coffee is significant because of the species richness it has the potential to promote. While there exists a gradient from which coffee is grown, ranging from unshaded monocultures to shaded polycultures and agroforestry systems, many coffee farms in the neotropics promote biodiversity by planting coffee in the shade of overstory vegetation. This overstory vegetation and other cultivated plants intercropped with coffee can provide habitat for wild flora and fauna and regulate ecosystem functions [
7,
8,
9]. Economically, a significant portion of the world’s coffee production takes place in Latin America [
10,
11,
12]. Because of the significant economic impact that coffee exports have on the neotropics, government policy has frequently encouraged high-intensity production at the expense of more ecologically sound agroecosystems [
13].
The advent of uncrewed aircrafts (UAs), or drones, means that remote sensing imagery can be captured with a much finer spatial resolution, on the order of tens of centimeters [
14], compared to satellites like Sentinel-2A MSI and Landsat 8 OLI, which have resolutions of 10–20 m and 30 m per pixel, respectively [
15]. In addition to the increased spatial resolution, drones have quicker revisit times and can be employed with greater ease and maneuverability given appropriate conditions The flexibility and increased spatial resolution of drones mean that UAs have the potential to create vastly more accurate land cover classifications. These advances in drone capabilities have the potential to better support diversified farming systems by providing a platform to monitor key agroecological features, such as biodiversity, soil health, or pests [
16].
While the use of finer-resolution uncrewed aerial vehicle (UAV) data may aid in improving classification of more diverse farms, researchers and other outside actors making these classifications should be aware of how their perceptions potentially impact classes of interest [
17]. In order to derive practical tools and analyses from classifications, farmers should be included in the mapping and classification of their land. This becomes especially important in diversified systems, as more nuances can exist in what does and does not constitute a “crop”. Working in partnership with farmers highlights how emphases on accuracy in certain land cover classes may differ between researchers and farmers, and how this can lead to alternative sources of bias. For example, Laso et al. (2023) note that the inclusion of “silvopastures” in their classification led to the potential underreporting of another class. However, in Laso et al. (2023), the inclusion of “silvopastures” was more relevant to farmers [
17].
In this project, we sought to understand how fine-resolution imagery enabled by advancing UAV technology may bolster management of diversified smallholder farms. We classified multispectral imagery taken by UAV over nine farms in the central western region of Puerto Rico and presented imagery and classified maps of given farms to farmers. After sharing imagery and maps with farmers, we interviewed the farmers to understand how data collected by UAVs can be used in ways that align with farmers’ expectations and needs. We synthesized the technical methodologies of remotely sensing diverse farms at a high resolution and the results of engaging farmers in the initial classification of their own land. In conducting this work, we acknowledge that use of UAVs has the potential to reinforce historical, asymmetric power dynamics between researchers and land stewards [
18]. By inviting land managers to review our initial classifications in interviews, we hope to take steps towards empowering communities as the experts in their own lands and de-emphasize the power dynamics between researchers and land managers.
2. Materials and Methods
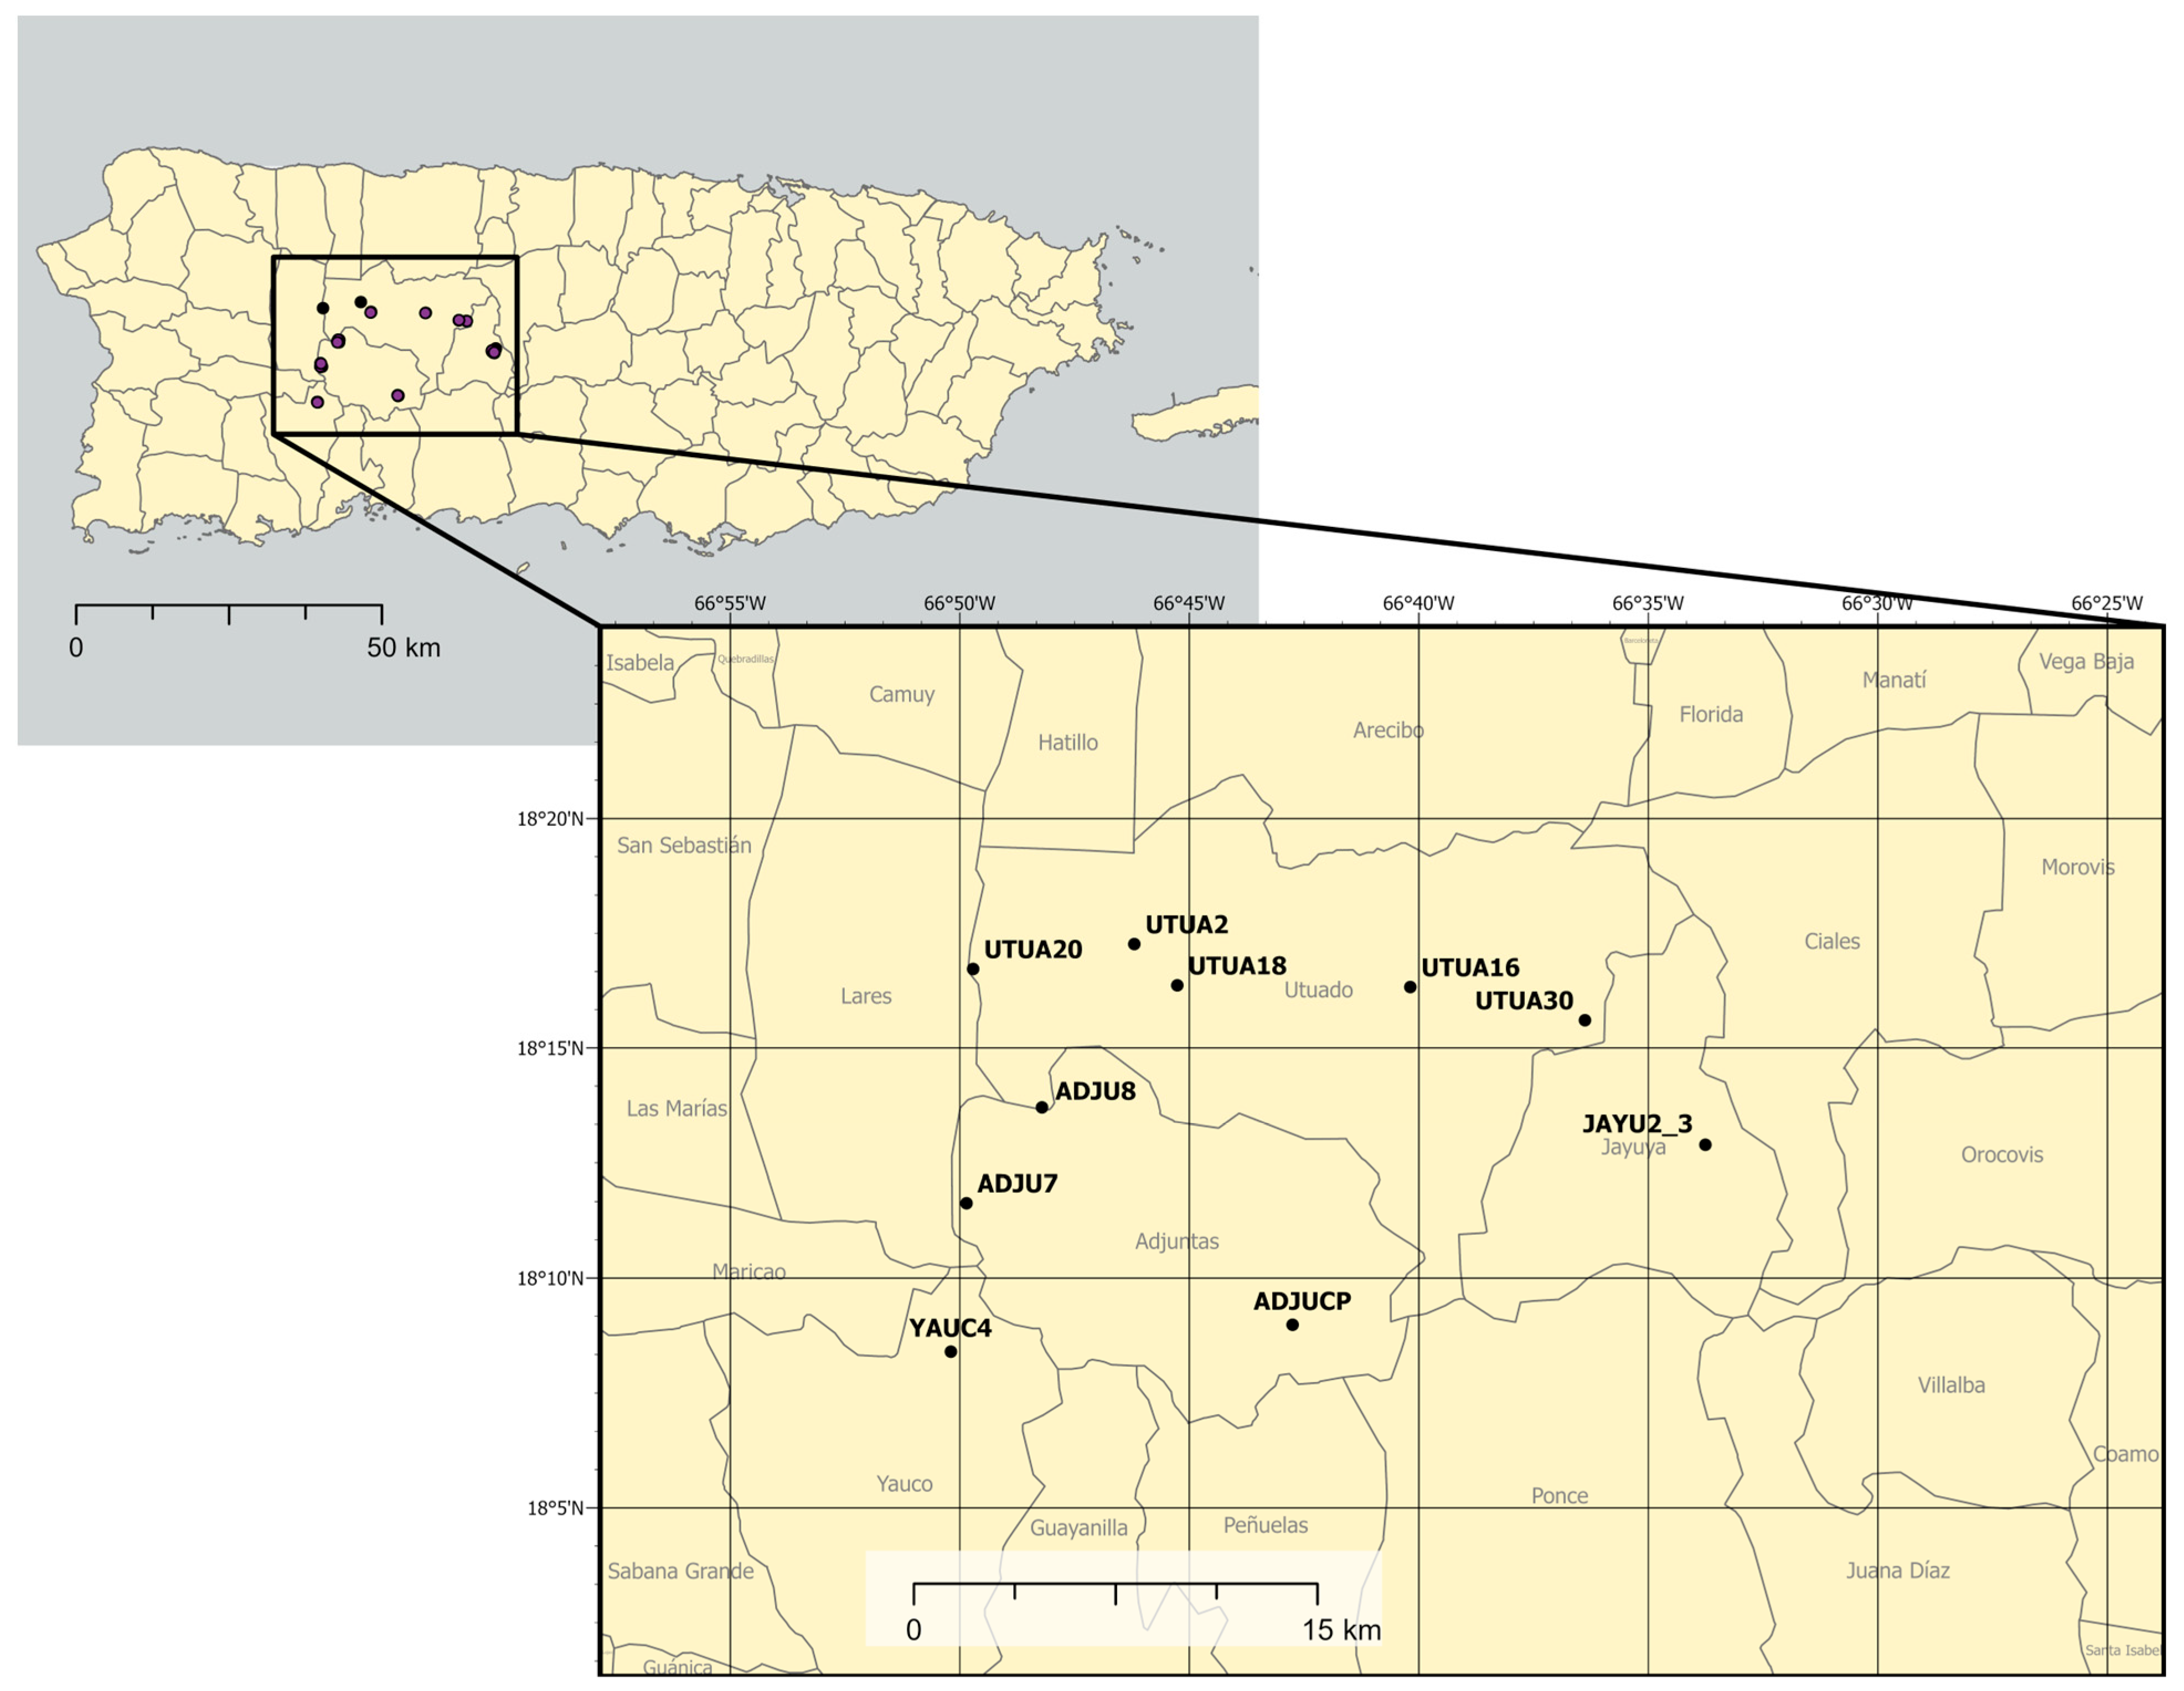
Our study took place in the coffee-growing mountainous areas of central-western Puerto Rico. More specifically, farms were surveyed in Utuado, Adjuntas, Jayuya, and Yauco (see
Figure 1). Farms in these regions experience between 177 and 229 cm of annual rainfall [
19] and are classified as submontane and lower montane wet forests [
20]. Soils present in the coffee-growing region include ultisols, inceptisols, and oxisols [
21]. Farms surveyed were a part of long-term coffee agroecosystem research in the region and spanned across a gradient of coffee production intensification [
8]. Coffee cultivation periods significantly vary in this region, but coffee is generally harvested in autumn. Other commonly found crops in these diverse agroecosystems include citrus trees, bananas, and plantains. The farms surveyed had an average slope of 15.4 degrees. Farms ranged from 0.8 to 56.7 hectares in size. More information can be found in
Table 1.
The uncrewed aircraft (UA) flights used in this study were conducted in 2022 to collect 10-band multispectral imagery. Before 2021, numerous preliminary data-gathering missions occurred with the use of fixed-wing and multirotor UAs. Ground data collection, which includes the GPS and plant characteristic data, occurred in 2021, 2022, and 2023. Interviews with farmers were conducted in May of 2023 and were subject to review and exemption approval by the Institutional Review Board (IRB) of the University of Michigan.
2.1. Ground Data Collection
Ground data collection was conducted in field campaigns in 2021, 2022, and 2023 to create control points to train and test land cover classification accuracy. We used the ESRI Collector or ESRI Field Maps smartphone app to capture data from a linked external GNSS receiver. In earlier campaigns, the Trimble R1 was used, and in later campaigns, a Bad Elf Flex was incorporated and used as a secondary GNSS receiver. Both of these external GNSS receivers were placed on a 2-m tall survey pole in order to assist in an appropriate satellite connection. Both external receivers increased GPS accuracy (as compared to integrated GPS in the smartphones used to capture data), but steep topography meant that strong connections to satellites were not always met, resulting in decreased GPS accuracy. The Trimble R1 Receiver typically receives submeter accuracy [
22], whereas the Bad Elf Flex receives 30–60 cm accuracy on average [
23]. Because of the steep topography, typically accuracies of below 1 m were accepted. On very few occasions, accuracies were accepted at around 1.5 m if a given surveyor had waited 5 min with no increase in accuracy.
At a given crop or plant of interest, the survey pole with attached external GPS was placed as close to the base of the plant as possible. Using a smartphone and either ESRI’s Field Maps or Collector, a GPS point was recorded. The data capture software recorded various types of information for each GPS point. If the plant of interest was coffee, information on the coffee leaf rust (CLR) and leaf miner level was recorded. Other information collected included the plant type, specific plant species if relevant, farm code, percent of plant covered by vines, notes about the surrounding canopy, date and time of point collection, and a photo of the plant or surroundings if desired.
2.2. Remote Sensing Flights with Uncrewed Aircraft
The uncrewed aircraft (UA) flights used in this study were conducted in mid-May of 2022 to collect 10-band multispectral imagery. UA work and subsequent method documentation were in accordance with the Federal Aviation Administration’s (FAA) 14 CFR Part 107 regulations. Highly variable topography within the coffee-growing region of Puerto Rico required significant mission and flight planning in order to collect quality multispectral and LiDAR data. Mission planning was completed prior to arrival in Puerto Rico, and included tasks such as identifying appropriate equipment and sensors for the specific terrain and creating standardized procedures. Google Earth Pro was first utilized to identify farm boundaries and areas within farms that may be of special interest, in addition to being used to identify potential divisions for farms that were too large to be imaged with a single drone flight.
A DJI Inspire 2 multirotor UA was outfitted with a multispectral imaging sensor. Multispectral imaging for relevant field campaigns was performed using a MicaSense RedEdge-MX Dual Camera Imaging System, which included 10 synchronized bands that spectrally overlapped with Sentinel-2A MSI and Landsat 8 OLI imagery (detailed in
Table 2).
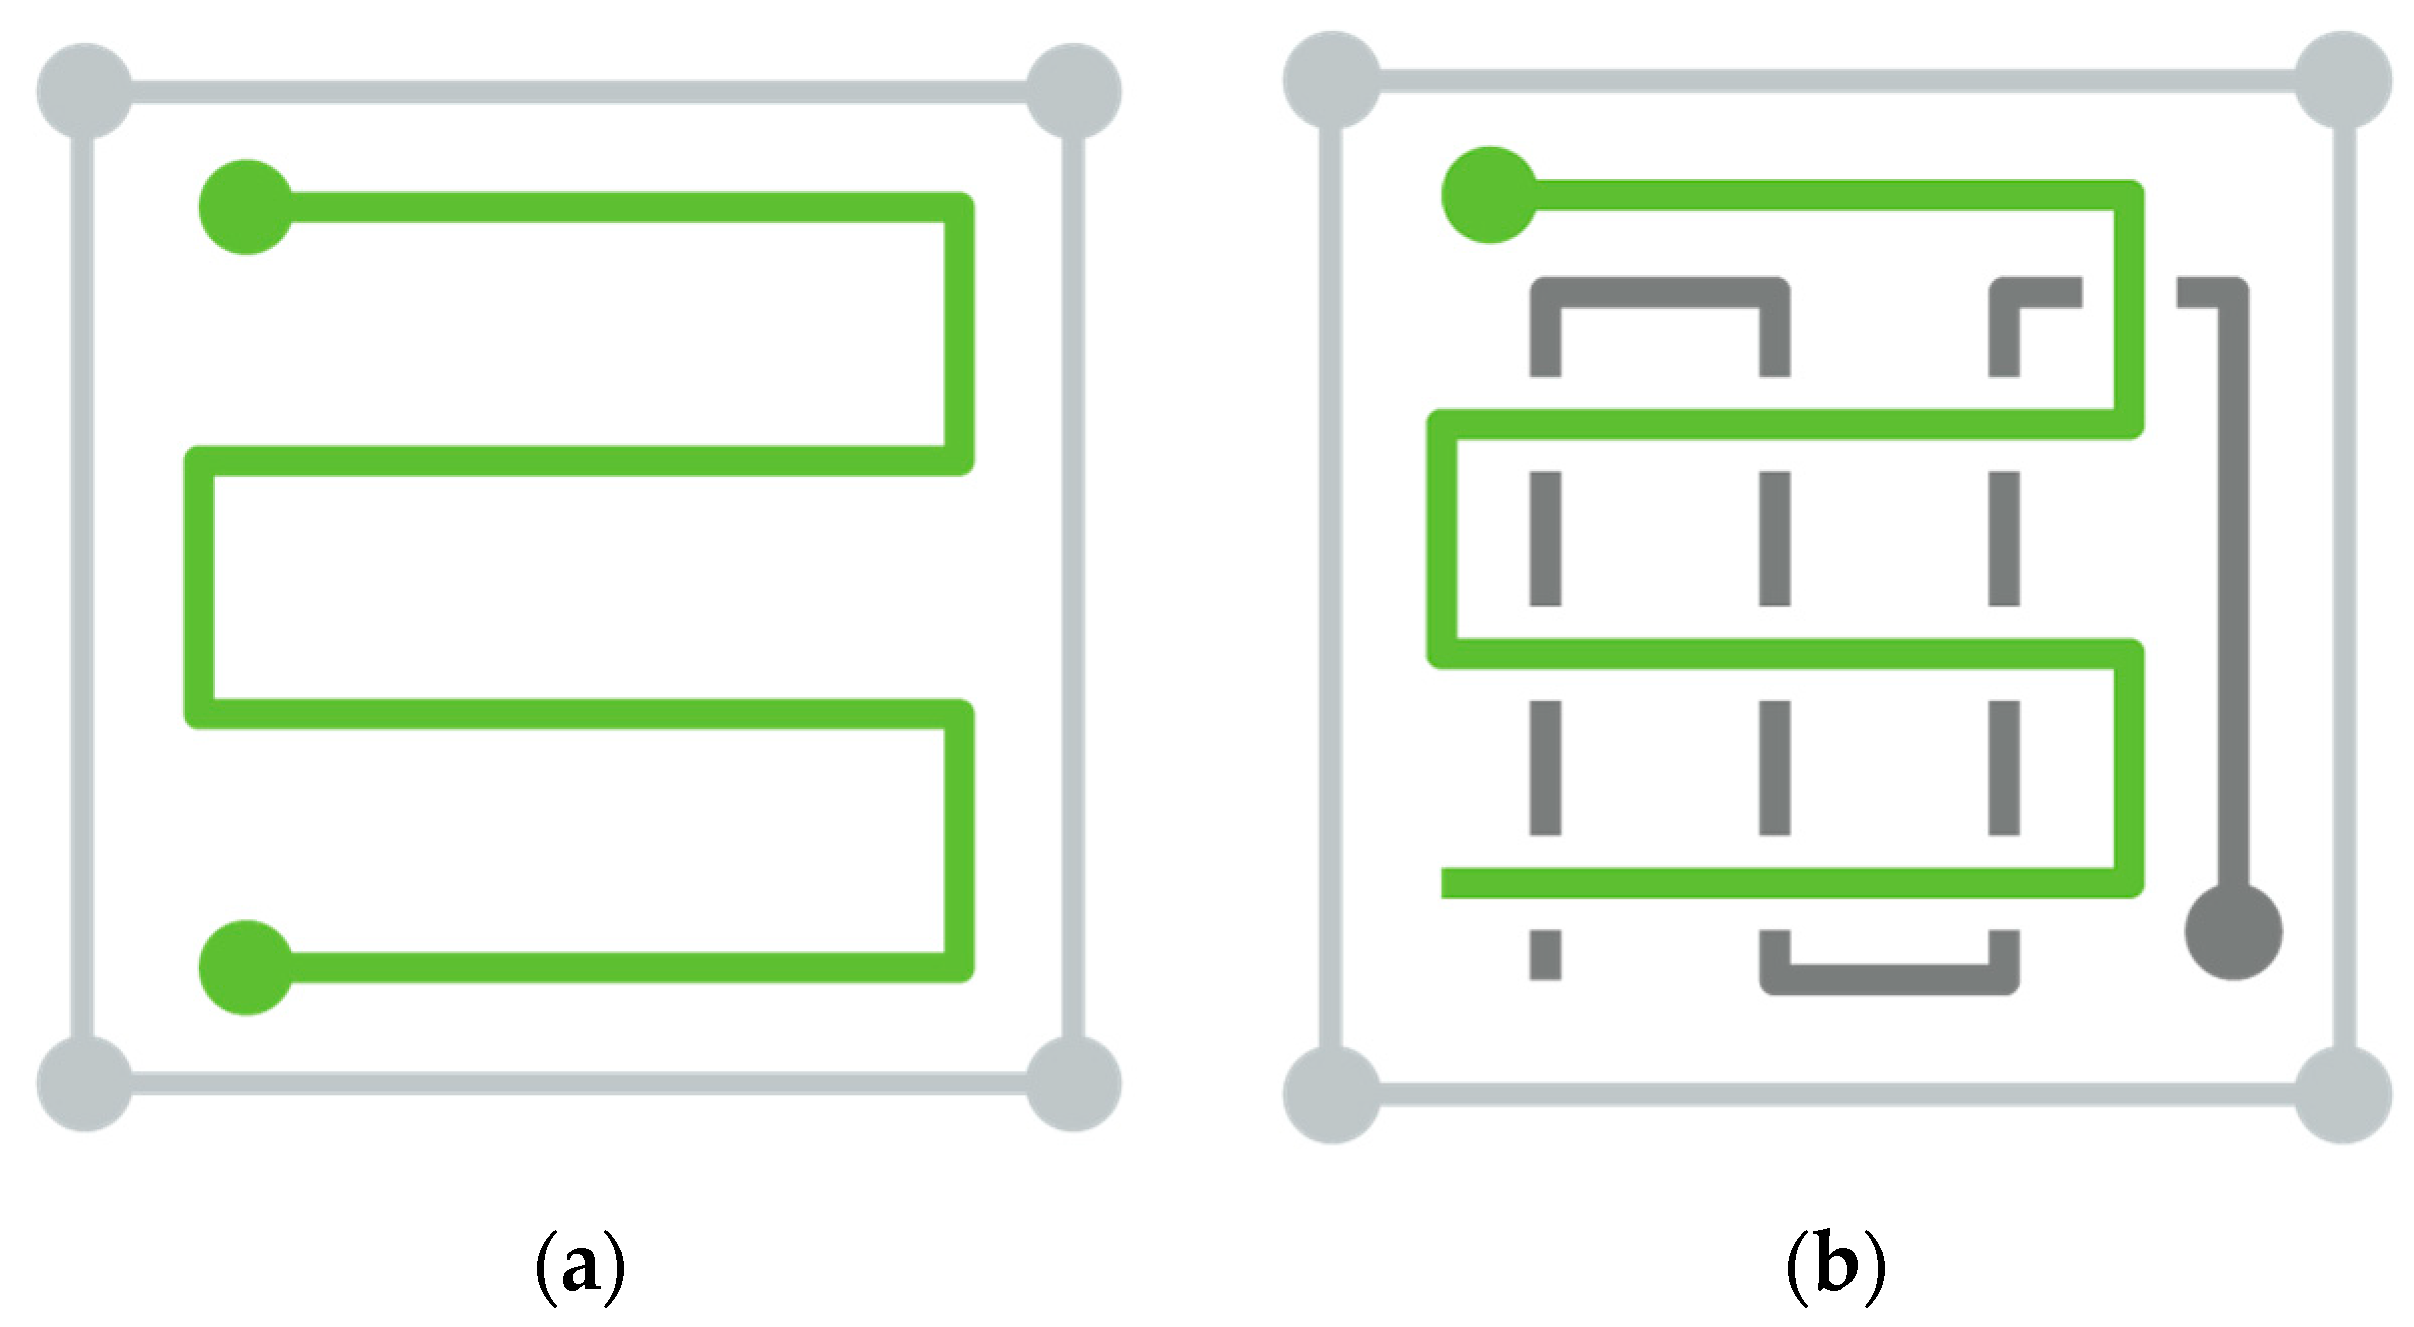
On site, a waypoint-defined flight plan was created in DJI Ground Station Pro on a mobile tablet. The size of the farm, data needs, and underlying surface were considered in determining whether a single or double grid (cross-hatch) flight pattern was flown (
Figure 2). Generally, larger farms were flown over as a single grid, as a double grid requires more flight time and therefore more battery life.
Prior to farm classifications, basic image processing was performed in Agisoft Metashape in order to create a georeferenced orthomosaic [
24]. The default processing utilized the GPS data generated by the UAS and MicaSense dual camera data capturing process, with no additional manual ground control point input. Reflectance calibration was performed, but no reflectance normalization was performed across flights or farms.
2.3. Image Processing and Classification
The 2022 images were pre-processed and classified for interviews with farmers in 2023. In order to run comprehensive, farm-level classifications, it was determined that for farms that had multiple multispectral images (UA flights), the various images should be mosaicked to create one image per farm. Mosaics were created in ERDAS IMAGINE using the MosaicPro tool, with an “overlay” overlap function specified, default “optimal seamline” generation option chosen, and color corrections set to “histogram matching”.
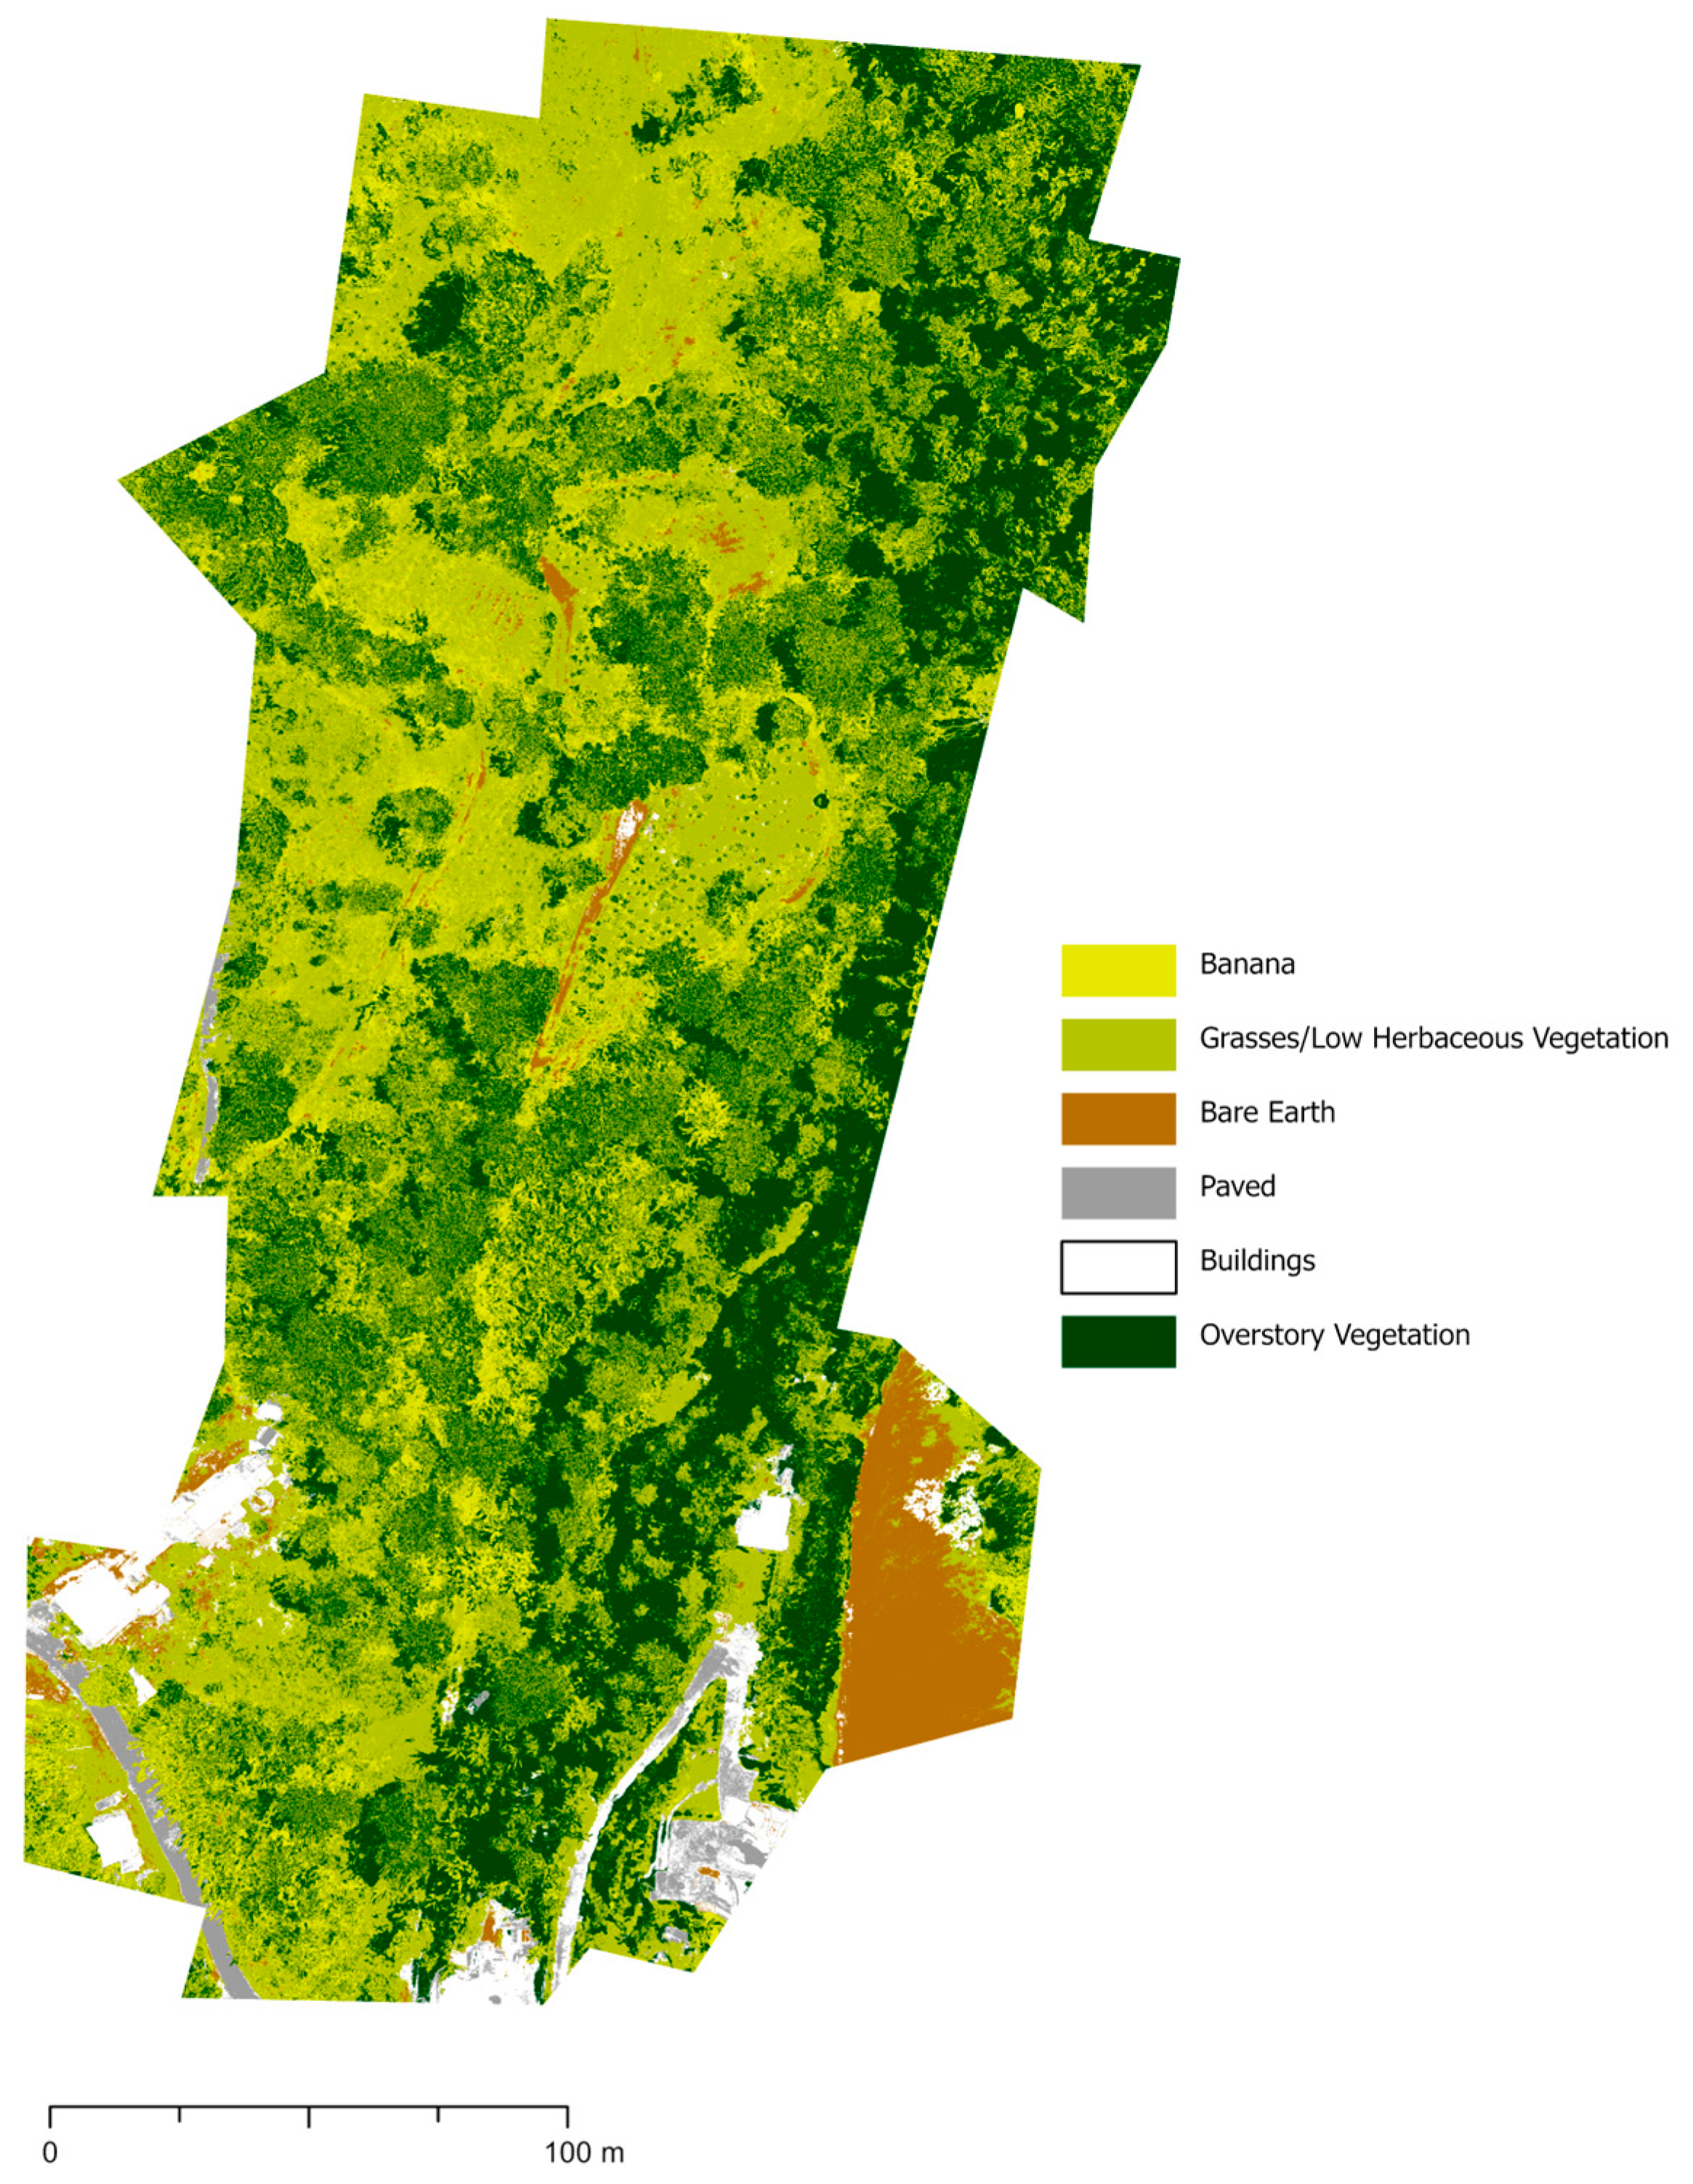
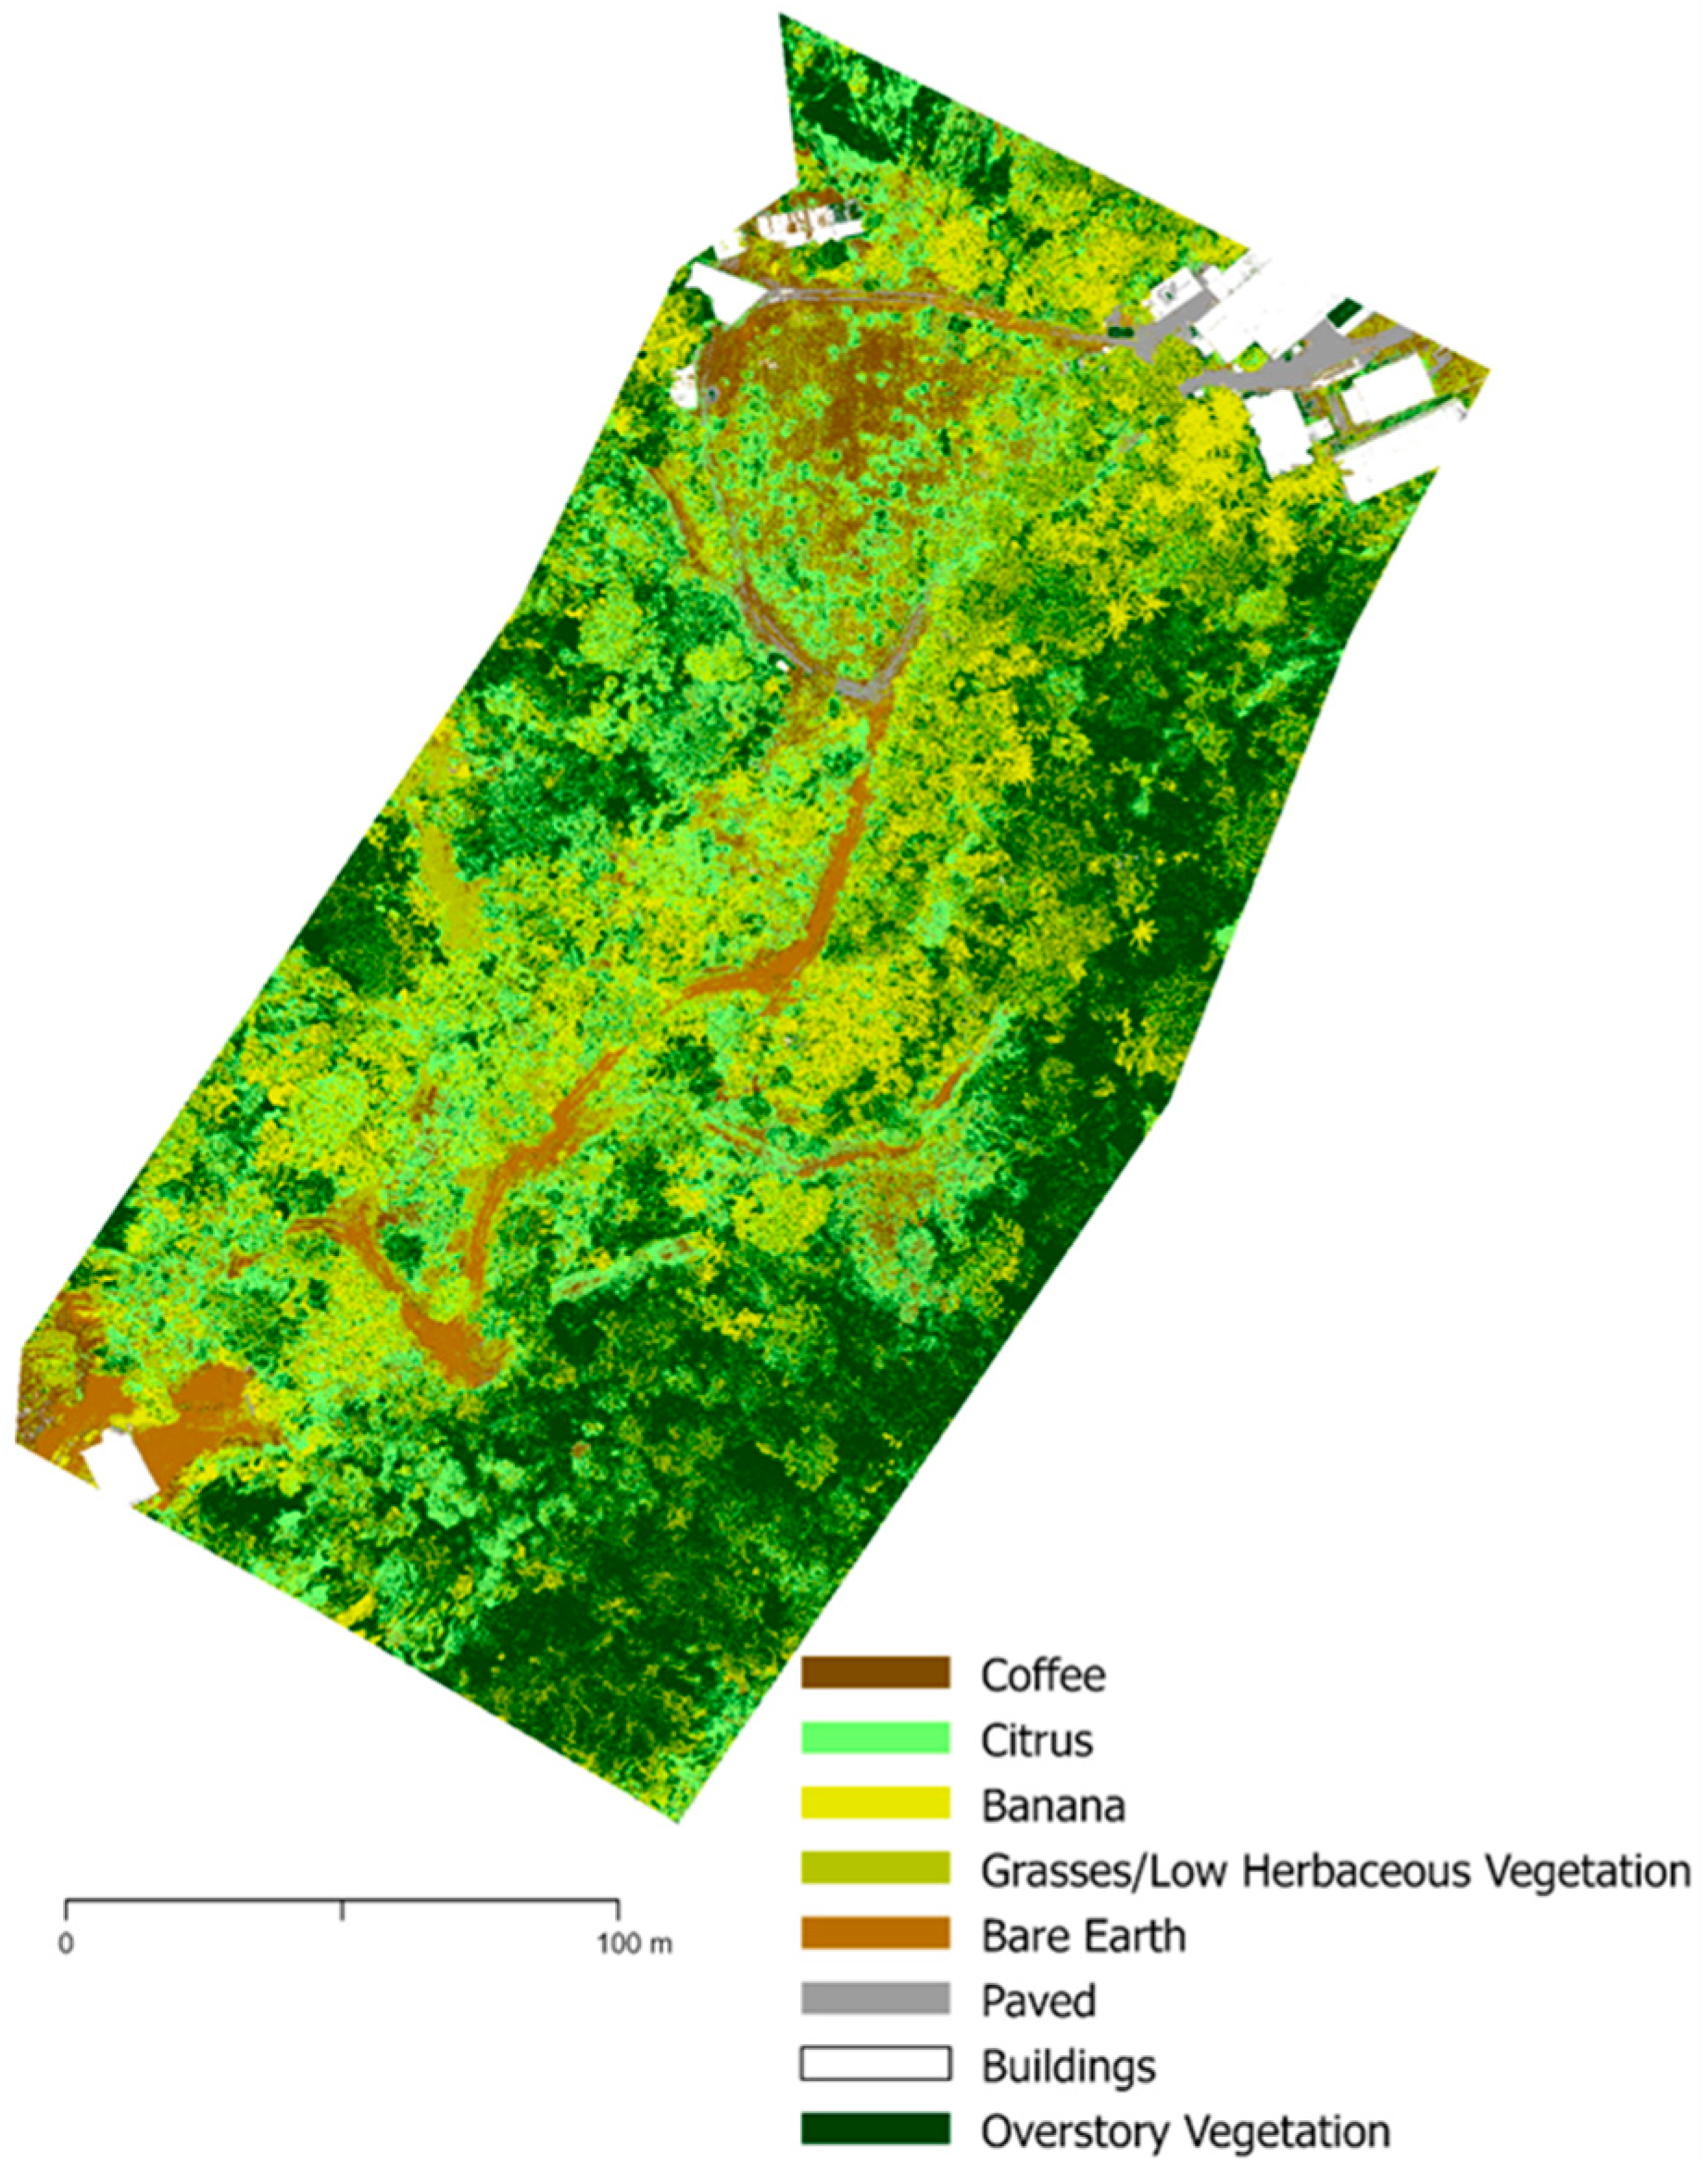
Pixel-based supervised classifications were run in ArcGIS Pro 3.1, sourced from Esri Inc., Redlands, CA, USA. After loading in the mosaicked farm image, the ground control points (GCPs) from three field campaigns were also layered on top. A classification schema was created to encompass the dominant crops and land cover types across the farms, based on previous visits. This schema included the following 10 classes: coffee, citrus, banana, palms, low herbaceous vegetation/grass, bare earth, pavement, buildings, water, and overstory vegetation. For each class, training site polygons were drawn using GCPs as a reference. For instance, if creating a training site for coffee, a polygon was drawn around whichever coffee plant(s) a GCP identified as coffee. For farms that may be larger, significant areas of land would have no GCPs. In order to create representative training sites across the entirety of a farm, polygons were drawn in areas without GCPs that were visually confirmed to match plants with associated GCPs. After creating ample training sites for each class within each farm, a support vector machine (SVM) classifier was run on the entirety of the farm. We expected that many farms may have a limited number of potential training and testing sites. Knowing this, we selected SVM because the classifier makes no assumptions about the data distribution [
25] and is less susceptible to an imbalance in training samples [
26].
After preliminary classifications were completed, interviews occurred, and analysis was finalized after the interviews. Accuracy assessments were run using testing created with the same process as the training sites. For each farm, roughly the same number of testing sites and training sites (0–15 sites depending on the farm and class) were created for a given class. As much as possible, testing sites did not overlap with previously created training sites, with a few exceptions. For instance, farms with water bodies typically only had one small pond, which meant there was little to no separation between training and testing sites for that class for that farm. Testing sites were used as reference data for the accuracy assessments, which were then run. We tested additional iterations of classifications utilizing principal component analyses (PCAs) to determine if accuracy was increased by the addition of more data (
Table 3). While the inclusion of PCAs in classifications did not ultimately improve classifications, the PCAs confirmed that 10 bands of imagery explained more than 98% of the variance.
2.4. Farmer Interviews
In May 2023, we conducted semi-structured interviews with farmers, land managers, and owners, with references made to the multispectral imagery and the classifications. For this purpose, we made posters of each farm’s multispectral imagery and classifications in ArcGIS Pro 3.1. These posters were then printed on 32″ × 40″ matte paper These interviews were conducted with the intention of better understanding land use history, farmers’ spatial relationships with their farms, and how remote sensing or land cover classifications may improve the management or understanding of such complex agroecosystems. Interviews were conducted onsite at farms, or at homes on farm property with teams of 2–3 researchers. Interviewees were asked if they consented to both the interview itself, as well as being recorded during the interview using an audio recorder. See
Appendix A for more information on the interview script.
Our interviews assumed that we would be referencing the printed orthomosaics and classifications, but many interviews also included walking areas of the farm with farmers as they pointed out specific crops or landmarks. Interview length varied greatly, with some interviews under an hour and others over two and a half hours. This length variation is primarily because interviews were farmer-guided, with respondents addressing topics they felt relevant. After a series of questions that were intended to orient researchers to the specifics of a given farm, the multispectral image was shown to the farmers. This was intended to show the farmers what the UA had collected, as well as compile any preliminary thoughts the farmers had on the UA itself. In earlier interviews, tracing paper was laid on top of the multispectral image, and farmers were encouraged to annotate any areas they felt important or of general interest. Annotating tracing paper was later removed as part of the interview process, as farmers were often more comfortable speaking generally about the land. After viewing the multispectral image, the classification image was brought out, and farmers were asked questions about the utility of the classification in their management. Viewing the classification map was largely considered to be the conclusion of the interview, and farmers were asked if they had any questions for the researchers. Both the multispectral imagery and the classification maps were left with interviewees at the conclusion of the discussions.
After the interviews were completed, they were uploaded into transcription software and transcribed in Spanish. Researchers then translated the transcriptions from Spanish to English, making corrections to the transcriptions where the software failed to capture any regional language differences or language not otherwise captured. A content analysis was run on the interviews, which included coding each interview transcript individually, as well as synthesizing notes from interviews that were not recorded. In order to conduct an effective content analysis, each theme was clearly defined by researchers. Examples or quotes from interviews were highlighted and sorted into relevant themes. Each example was again reviewed by researchers to ensure that a given example fit into the theme it was assigned to. Each theme was linked to a more generalized research finding from the interviews, and the relevance of each theme to the project at large was defined. Results were then summarized and put into a content matrix.
4. Discussion
We learned from our interviews with farmers how our maps could be improved in terms of accuracy and relevance. While diversified coffee agroecosystems have a myriad of potential land cover classes, we initially believed that fewer classification categories would support the legibility of the maps to farmers who might be unfamiliar with this format. However, many farmers noted that biodiversity and plants that they deemed important were absent from our maps. These exchanges underscore the importance of contextualizing the development of a classification workflow with local knowledge, as it can help identify critical problems that justify extra effort to provide a more relevant deliverable for farmers.
We obtained an average kappa value across all farms of 0.409, meaning that the classifiers, generally, were fair in comparison to a random classifier [
29,
30]. Many of the farms had a slight disagreement between overall accuracy and the kappa index; for instance, YAUC4 had an accuracy of 74% (or 0.74) and a kappa statistic of 0.51. In the case of all classification iterations in this paper, the overstory vegetation class often had more training and testing sites made of larger polygons, and therefore more pixels. While the higher amount of pixels of overstory vegetation may have skewed overall accuracy, the kappa statistic takes into account the relative impact of each class, meaning that it is not skewed by a single well-represented class [
27,
28,
31]. It is worth noting, in this paper and otherwise, that while overall accuracy and the kappa statistic are common ways to evaluate land cover classifications in the remote sensing field, more recent literature [
32,
33] has highlighted that confusion matrices are not entirely reliable and need to be analyzed with some understanding that the accuracies reported are not absolute.
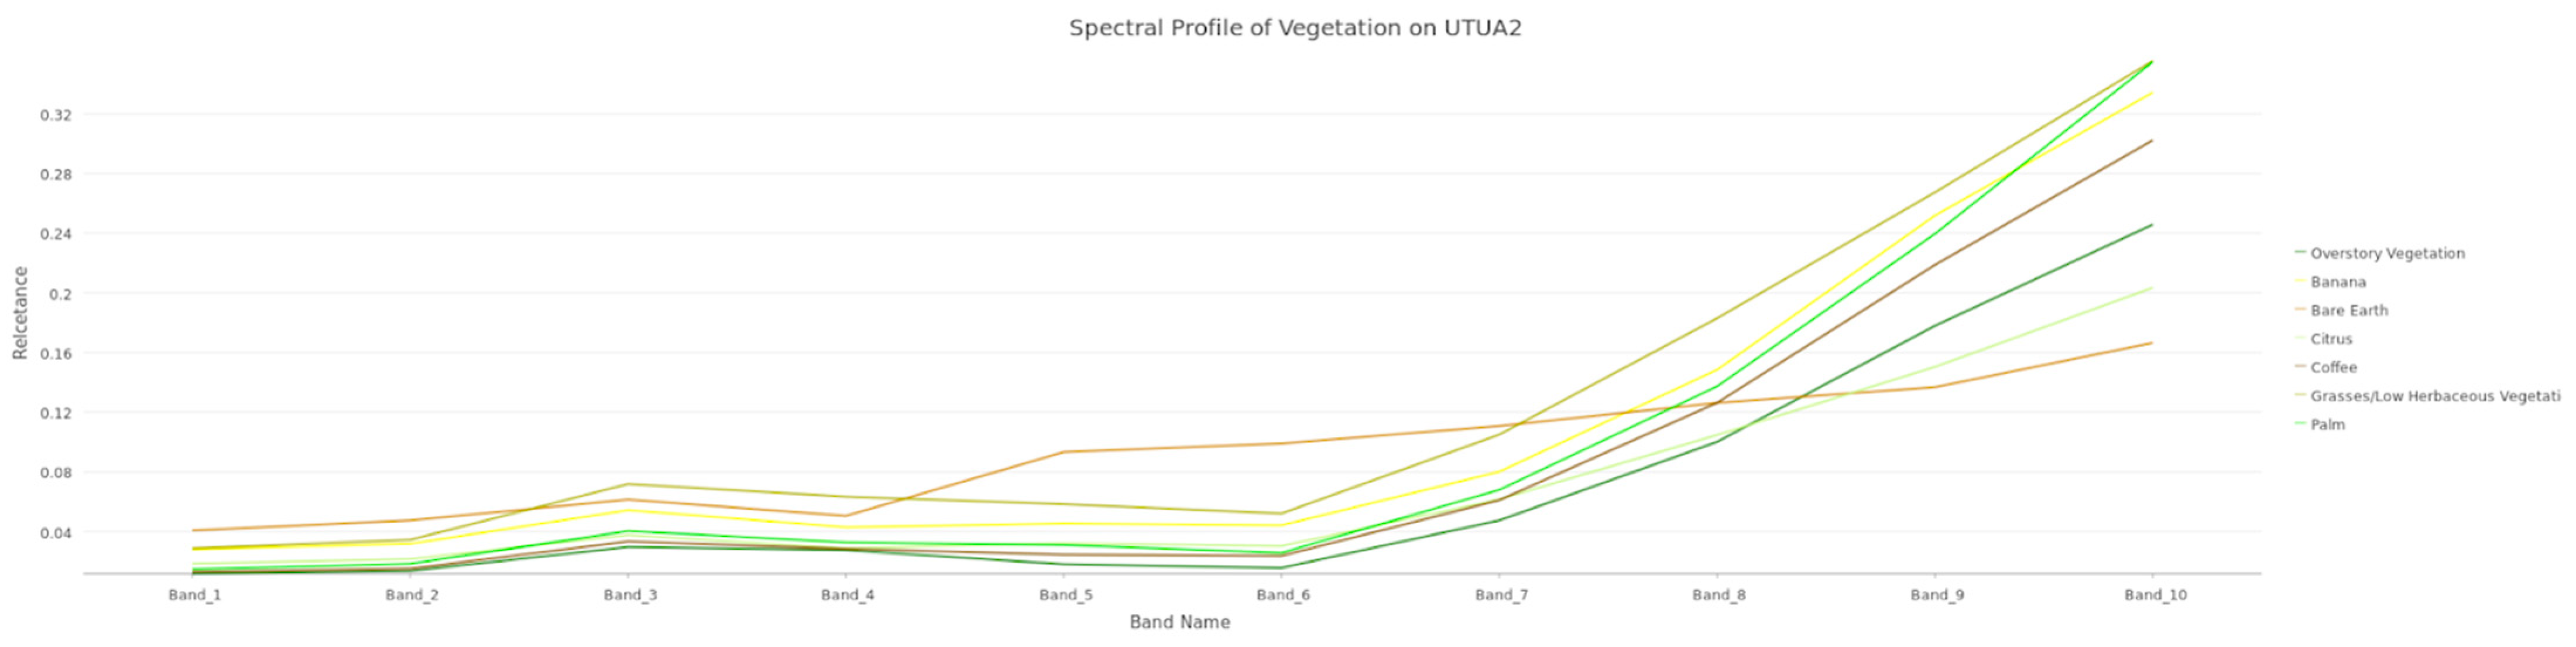
Somewhat expectedly, many of the vegetation classes (i.e., coffee, citrus, banana, palm, and overstory vegetation) were misclassified as other vegetation classes. Because these classes are spectrally similar, and because the initial classifications utilized all 10 bands, including those that had little separation between classes within the same band, it could be anticipated that there would be some confusion amongst these classes.
Figure 4 illustrates the spectral similarities across vegetation training classes. Another area of confusion was between the pavement and building classes. Across many of the farms, buildings and pavements were misclassified as one another, but were less often misclassified as bare earth and vegetation.
There exists a myriad of reasons why the land cover classifications of this paper may be considered “inaccurate”, many of which have been alluded to earlier in this discussion. One such reason may be the inability of researchers to distinguish land cover types in multispectral imagery. For instance, on many farms, coffee may be grown under the canopy cover of other vegetation. If all coffee ground control points were obscured by larger overstory vegetation, researchers would be unable to accurately draw training and testing sites. In addition, some classes present on farms, while relevant, lacked sufficient training and testing points due to their rarity. As an example, we trained the classifier to identify citrus in UTUA20, but found that the small number of citrus trees present meant testing sites were either generated on the same trees training was performed on, or testing was unable to be completed.
Our classification results could be improved with additional steps that were not available to us at the time but may benefit future studies. We were unable to conduct radiometric normalization prior to the image mosaicking process, which may have improved consistency across flights and farms [
34]. While histogram equalization was conducted during the mosaicking process, the resulting mosaics still had visible radiometric differences. For example, radiometric normalization could have reduced the bright spots present in one flight over ADJU7, which likely led to spectral imbalances that prevented us from successfully classifying the imagery of this farm. In addition, if radiometric normalization occurred earlier in the process, it may have been feasible to train the classifier on only one farm and then apply it across farms. This would reduce the work to create many training sites across farms in order to compensate for the radiometric discrepancies. Additionally, classifications may be improved by using ground control points in orthomosaic creation. During the processing of imagery in Agisoft Metashape, only the internal UA GNSS system was used to georeference raw images. By including ground control points collected with a more precise external GPS receiver in the image processing methodology, multispectral imagery may have been better aligned with ground control points collected for building training sites. More broadly speaking, the inclusion of more GCPs in creating training and testing sites may also improve classification accuracy. However, for some research, the time and labor needed to complete more ground truthing may not be justified by an increased overall accuracy.
Analyzing the interview recordings and notes allowed for a more nuanced understanding of the remote sensing work conducted in this study. It became very apparent during interviews that farmers and land managers were extremely excited to view, talk about, and keep the map printouts. Many remarked that the images of their farms were beautiful and were excited to display the printouts for others to see but were unsure of how the maps or products derived from the maps could be implemented in regular management. One farmer noted that they planned to hang imagery in a cafe for visitors to see, but when questioned about the utility of the map in their work, they indicated that they would instead be more interested in utilizing the drone to evenly distribute pesticides.
While the beauty and excitement of images and landcover classification maps are often overlooked as an aspect of utility in the remote sensing field, we understood this to be an extremely important subtheme, as it became more evident that farmers and researchers could build further rapport by addressing the beauty of the images and the farms that land managers work so hard to maintain. Connection building in the context of this paper is extremely relevant, as land cover classifications are regarded as an iterative process [
17]. By fostering better connections between researchers and farmers, we can more intimately understand the ways in which our work fits into farmers’ management and make adjustments to maps accordingly. In many of our interviews, interviewees often pointed out a lack of diversity or missing landmarks. Without having conversations with land managers, researchers are limited to making changes that may not be useful to farmers and instead only serve to increase classification accuracies for schemas that were flawed themselves.
Farmers who communicated to us that maps were lacking relevant information also had more difficulty orienting themselves during interviews. One farmer remarked that he had often regarded his land as a square parcel and viewing it as the roughly rectangular shape the imagery was captured as led him to become disoriented. The farmer also noted that he might have been able to orient himself in spite of his perception of the parcel, but only if landmarks he passed by daily had been included and labeled as such. When farmers are not able to orient themselves to the imagery, implementation of the maps in management becomes even farther fetched.
While many farmers indicated absent crop and vegetation diversity in the land cover classification map, we felt that sharing a more simplistic map first actually enhanced the feedback we received and farmers’ own understanding of the maps. Because the map shared was simpler, farmers noted specific areas where they were interested in seeing more detail, where they were practicing a given land management technique, or where they had a few personally relevant crops. In addition, we believe that the lack of detail present allowed for quicker orientation and better clarity of understanding of the maps. This was extremely important, as we understood that land managers had never seen their land displayed in this manner and needed some time to relate the imagery to land they were intimately familiar with.
Including interviews as part of this project greatly enhanced the findings of this paper and would enhance any future work in similar settings. Colloredo-Mansfield et al. found similar results in their work, noting that participatory drone mapping allowed researchers to ascertain broader and more relevant information about land management [
35]. In addition, Colloredo-Mansfield et al. found that producing land cover classification maps allowed them to understand sensitive areas of farms (e.g., where young plants were growing) and establish rapport between researchers and farmers. Following Colloredo-Mansfield et al. [
35], it is clear that our project would benefit from more knowledge sharing between researchers and farmers. One farmer noted during our interview that while she was extremely excited about participating in research, she was disappointed that she previously had no proof of the drones being on the property to share with a friend. By leaving her with the printout of the map and a description of the work we had done, the farmer may be more likely to continue working with researchers. In return, we received valuable feedback on the crops and vegetation relevant to her on her property. Similar land cover classification projects would benefit from additional iterations incorporating such feedback and knowledge-sharing.
The detailed nature of the high-resolution imagery was seemingly part of the interest that farmers had in interacting with the printouts. While the pixel-based supervised land cover classifications had fair accuracy, switching to an object-based classification would likely increase the overall average accuracy, as it is documented that object-based classifications perform better, especially at finer resolutions [
36]. However, the fine-resolution data presented in this paper came at a cost of increased processing power and time requirements for each step of image processing and classification. Object-based classifications may require even more computational power, especially at the segmentation step [
37].
Classification maps may also be enhanced with the addition of elevation or surface data, like LiDAR data that are collected together with the multispectral imagery, and could be the subject of collaborative data fusion projects. Farmers interviewed also often noted that they oriented themselves using peaks and valleys present on farms, something not reflected in the printout of the multispectral imagery or land cover classification maps. However, including data of this type may mandate a more dynamic format in which to present maps to farmers. While digital elevation and surface models are something many in remote sensing are familiar with, viewing elevation data on a 2D plane may still present some challenges for those who have not seen such maps before. This potentially could be remedied by creating a 3D model of the surface or elevation data and viewing it together with farmers on a computer.

 ,
, 


