

Neighborhood-Scale Wildfire Evacuation Vulnerability in Hays County, TX

Abstract
1. Introduction
2. Data and Methods
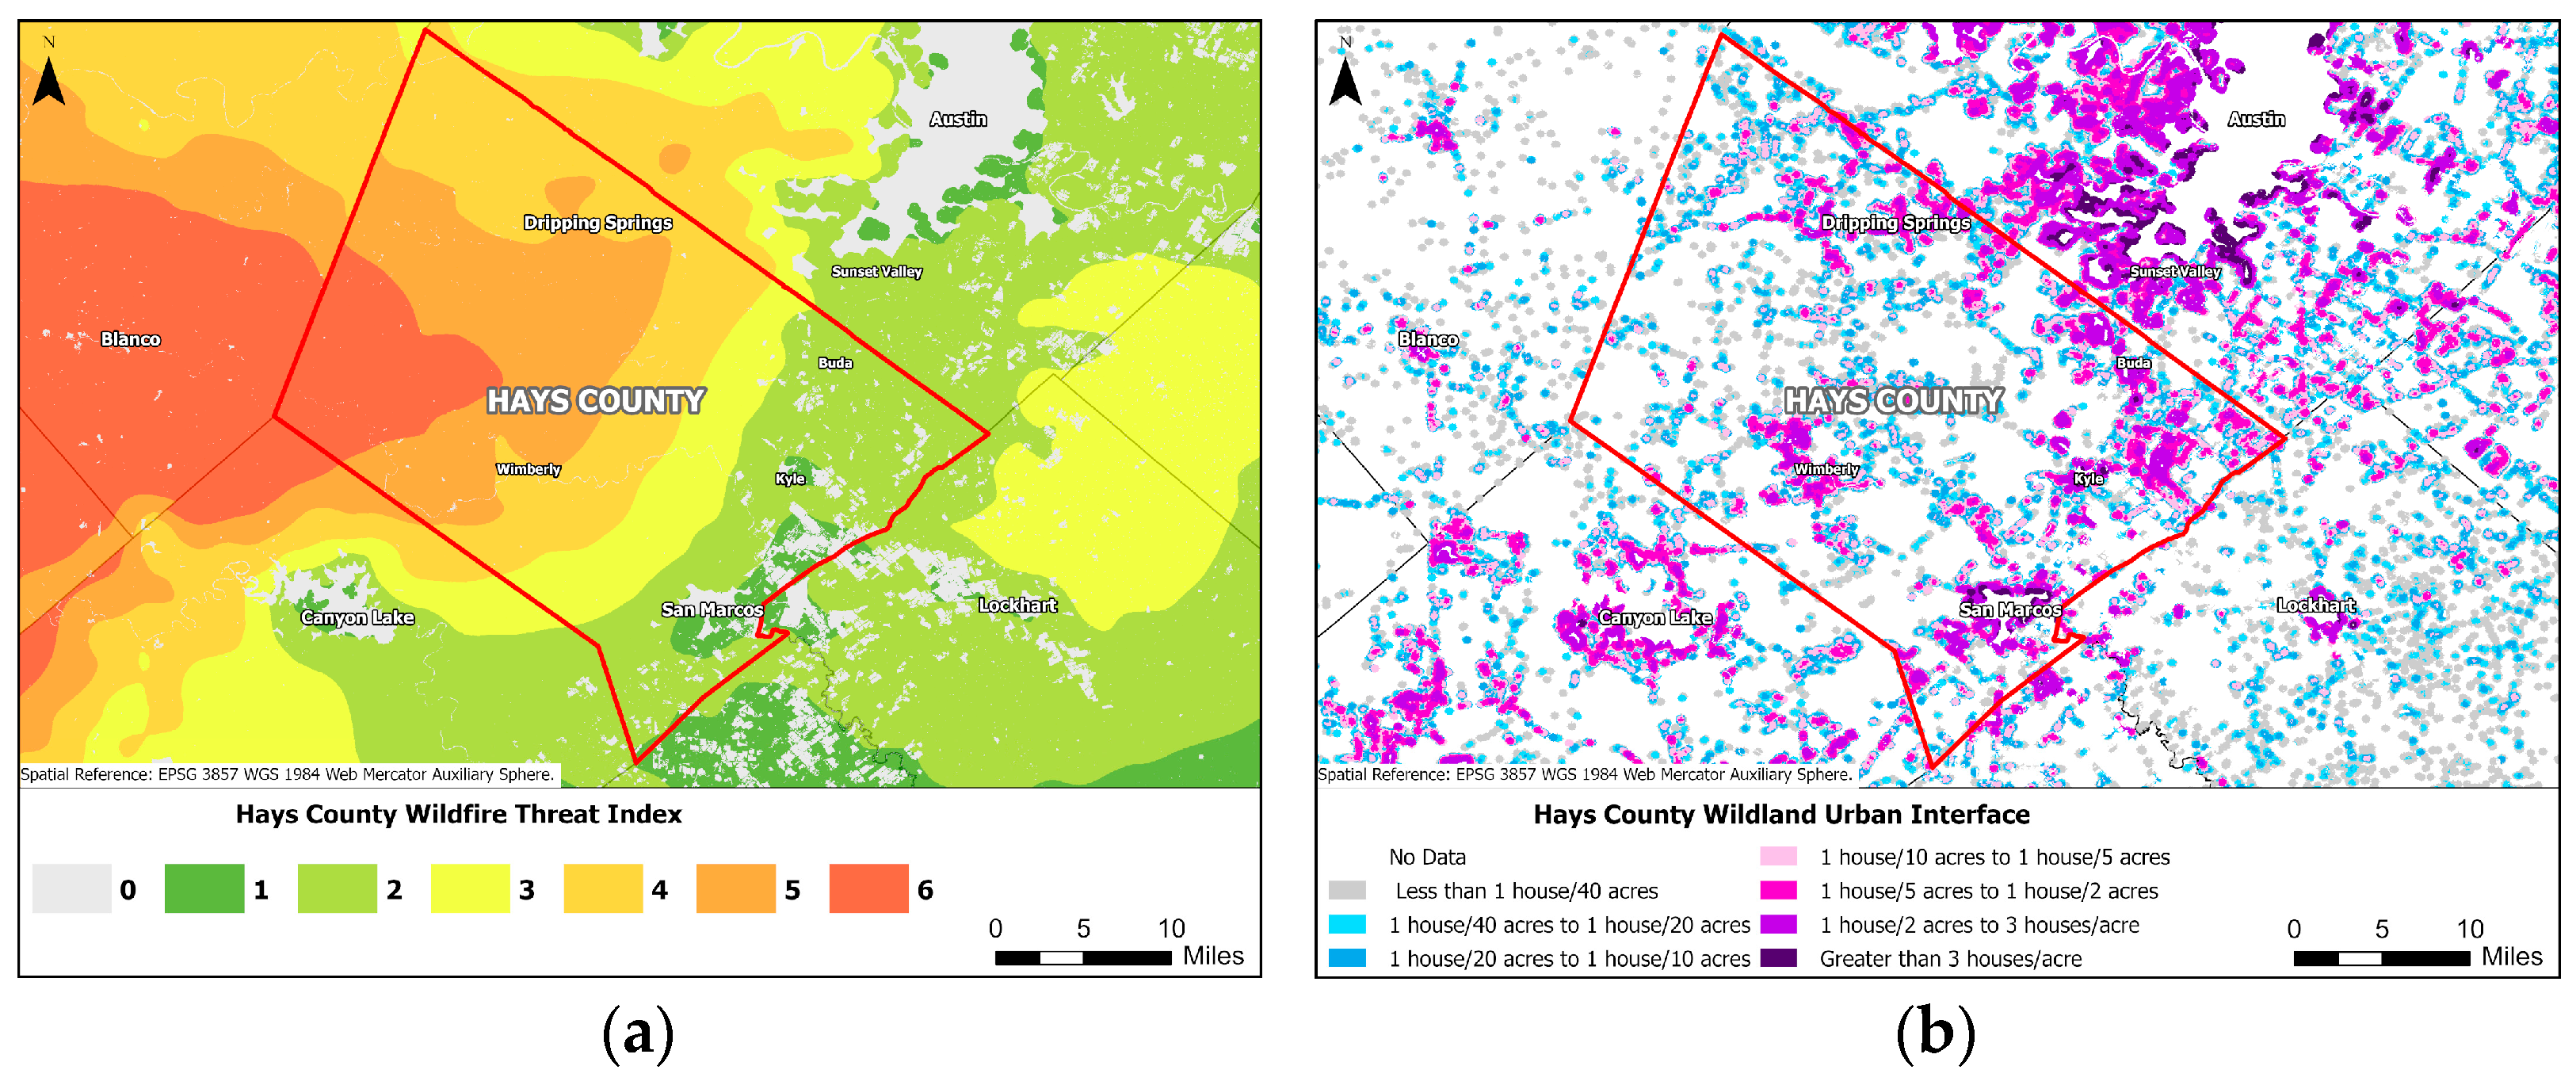
2.1. Study Area
2.2. Data
2.3. Analysis
- Calculate the household-to-exit ratio;
- Adjust the number of exits based on exit arrangement;
- Quantify the risk of wildfire at the neighborhood scale;
- Rank neighborhoods based on their combined risk of wildfire and constrained evacuation.
2.3.1. Calculate the Household-to-Exit Ratio
2.3.2. Adjust the Number of Exits Based on the Exit Arrangement
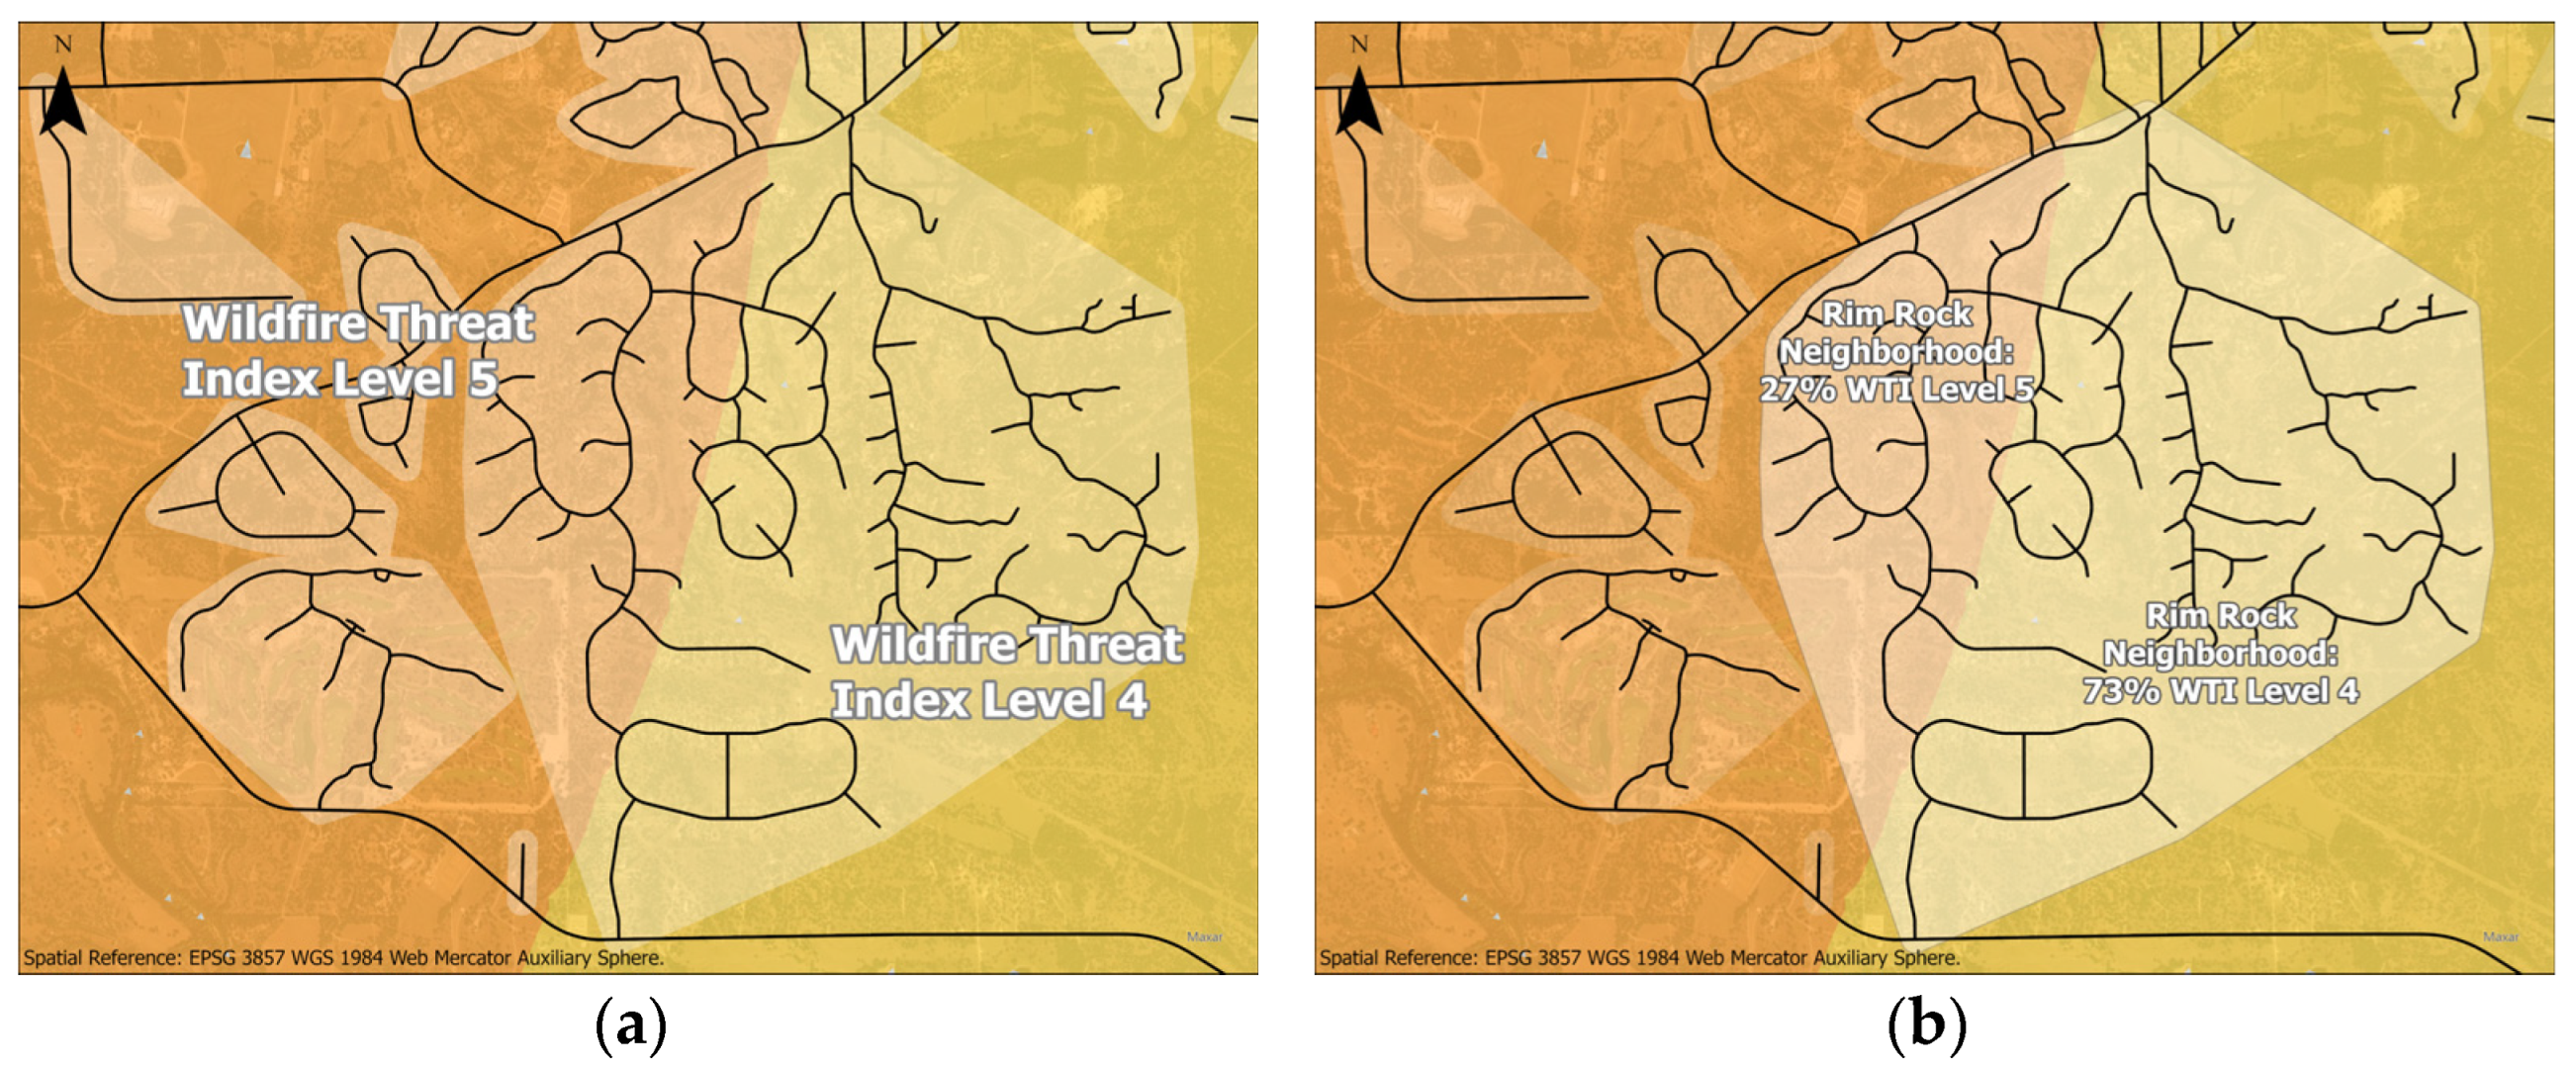
2.3.3. Quantify the Risk of Wildfire at the Neighborhood Scale
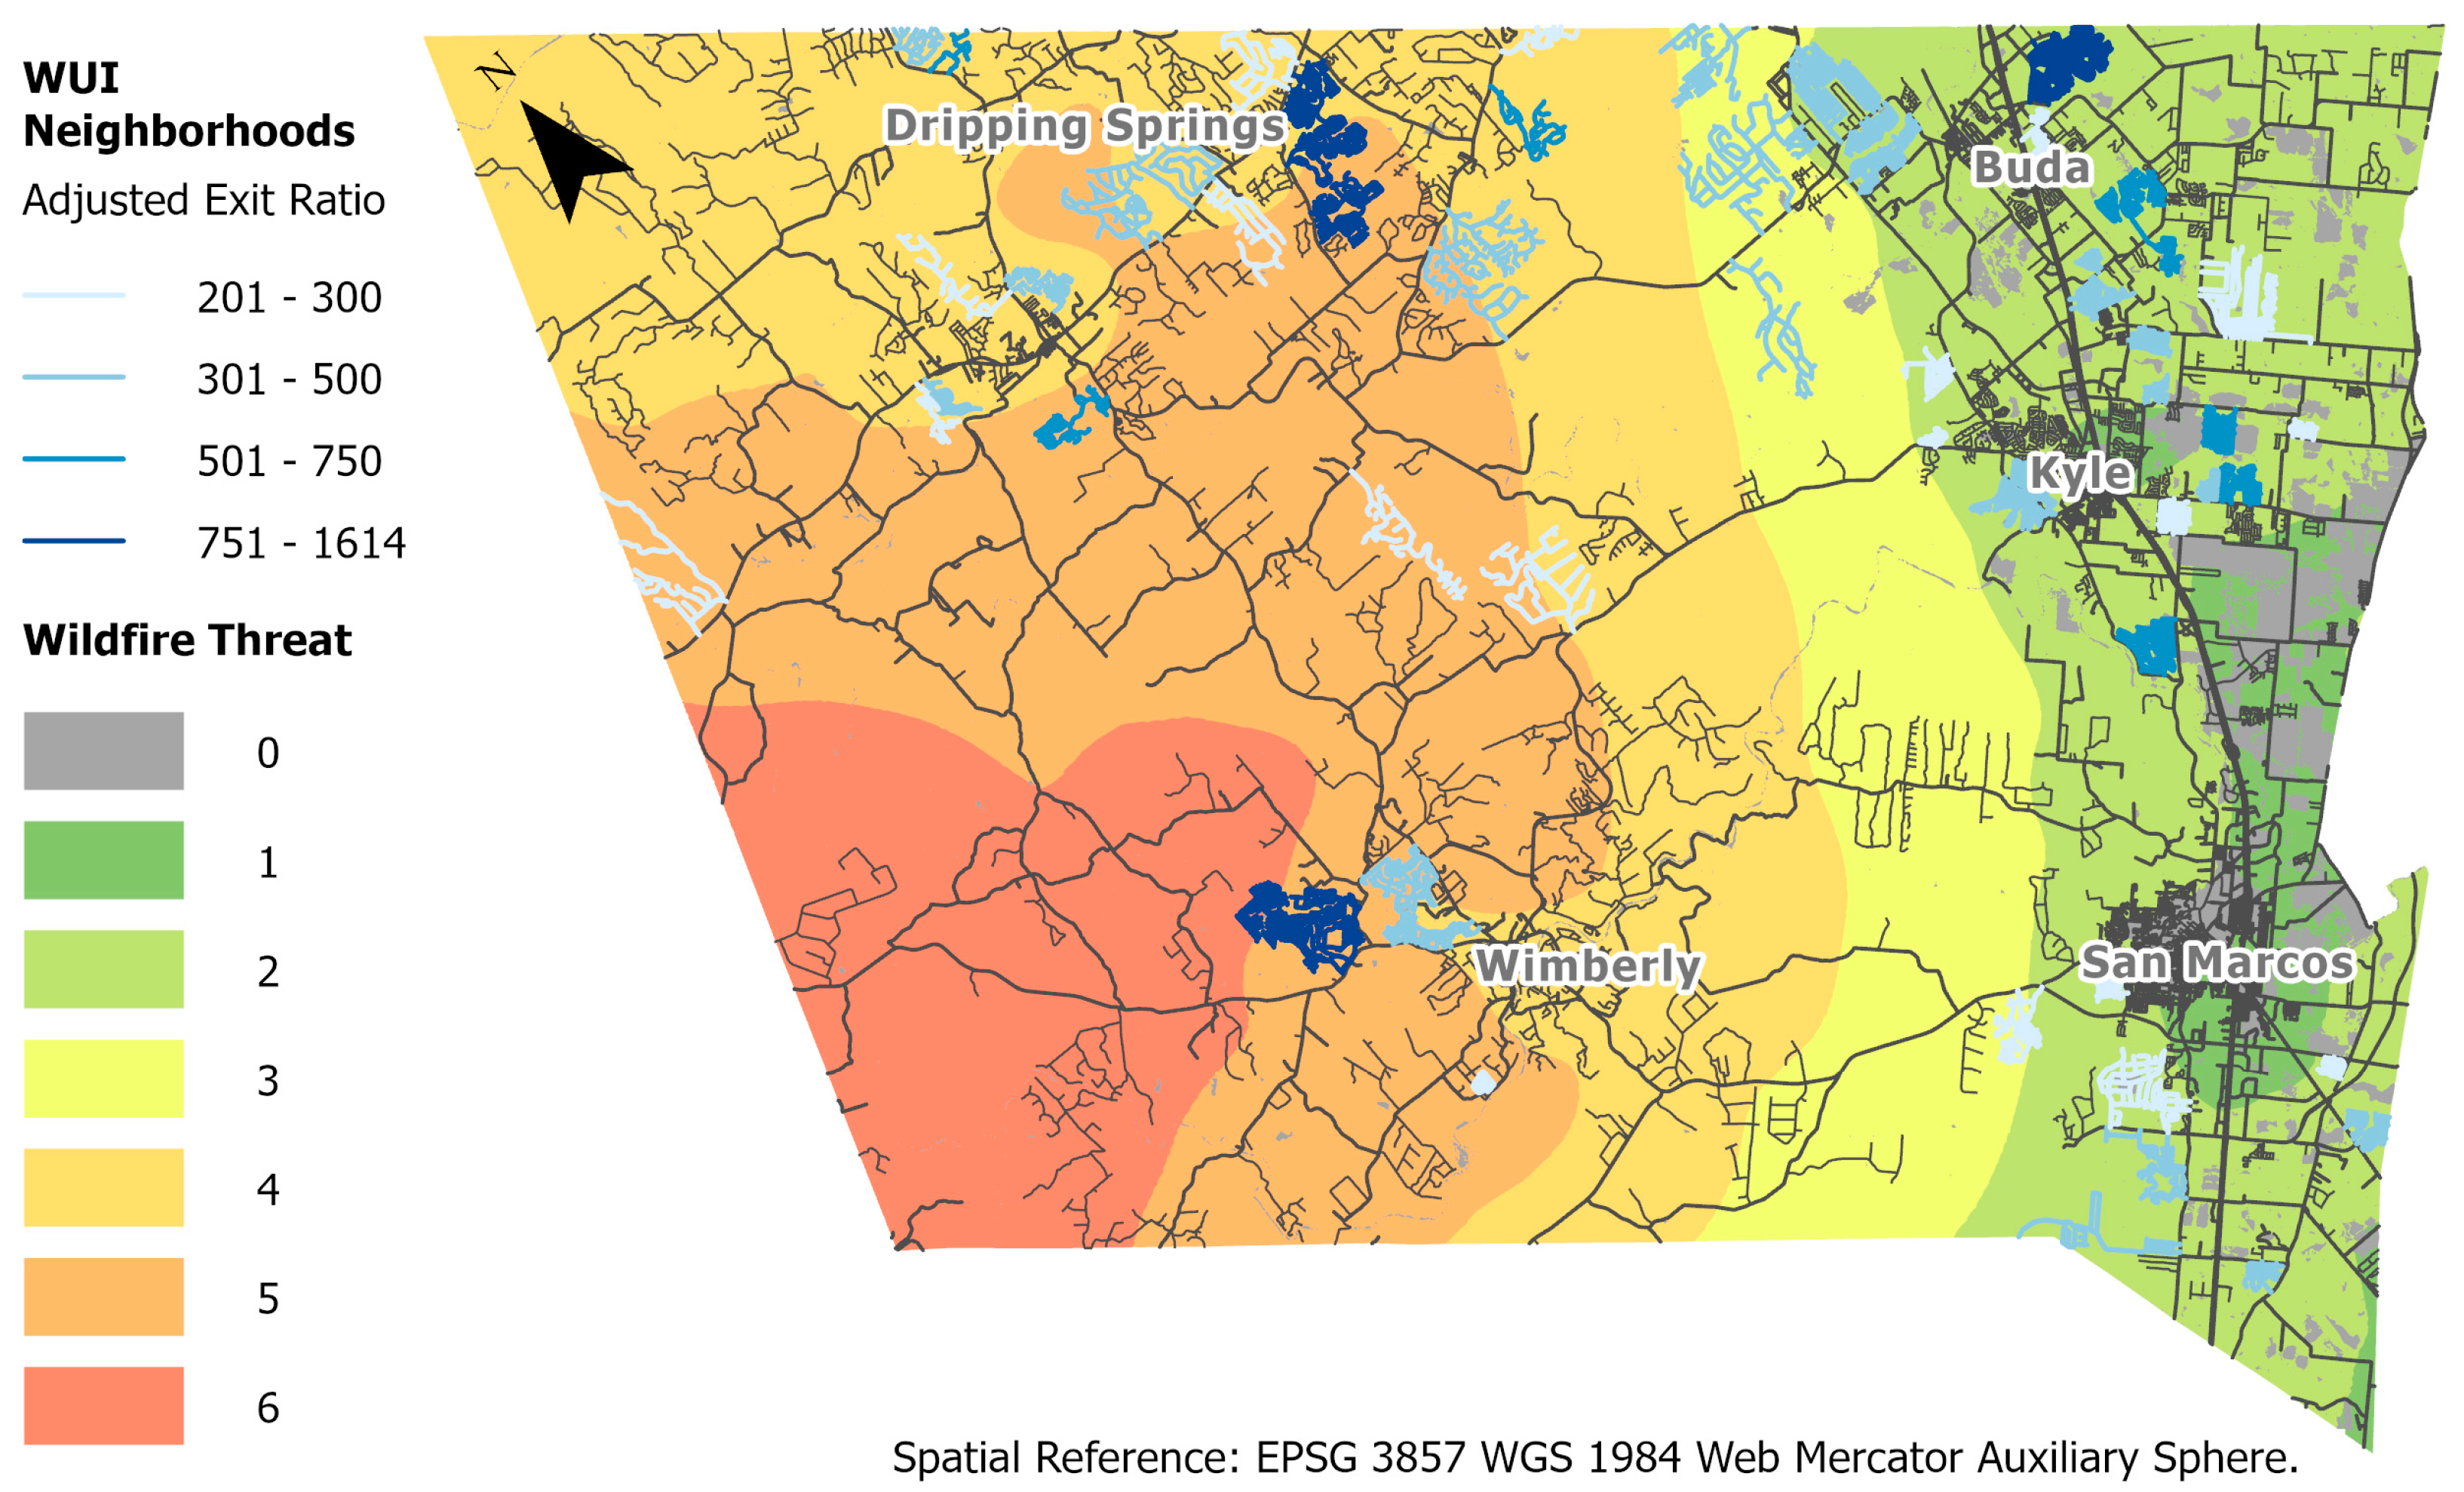
2.3.4. Rank Neighborhoods Based on Their Combined Risk of Wildfire and Constrained Evacuation
3. Results and Discussion
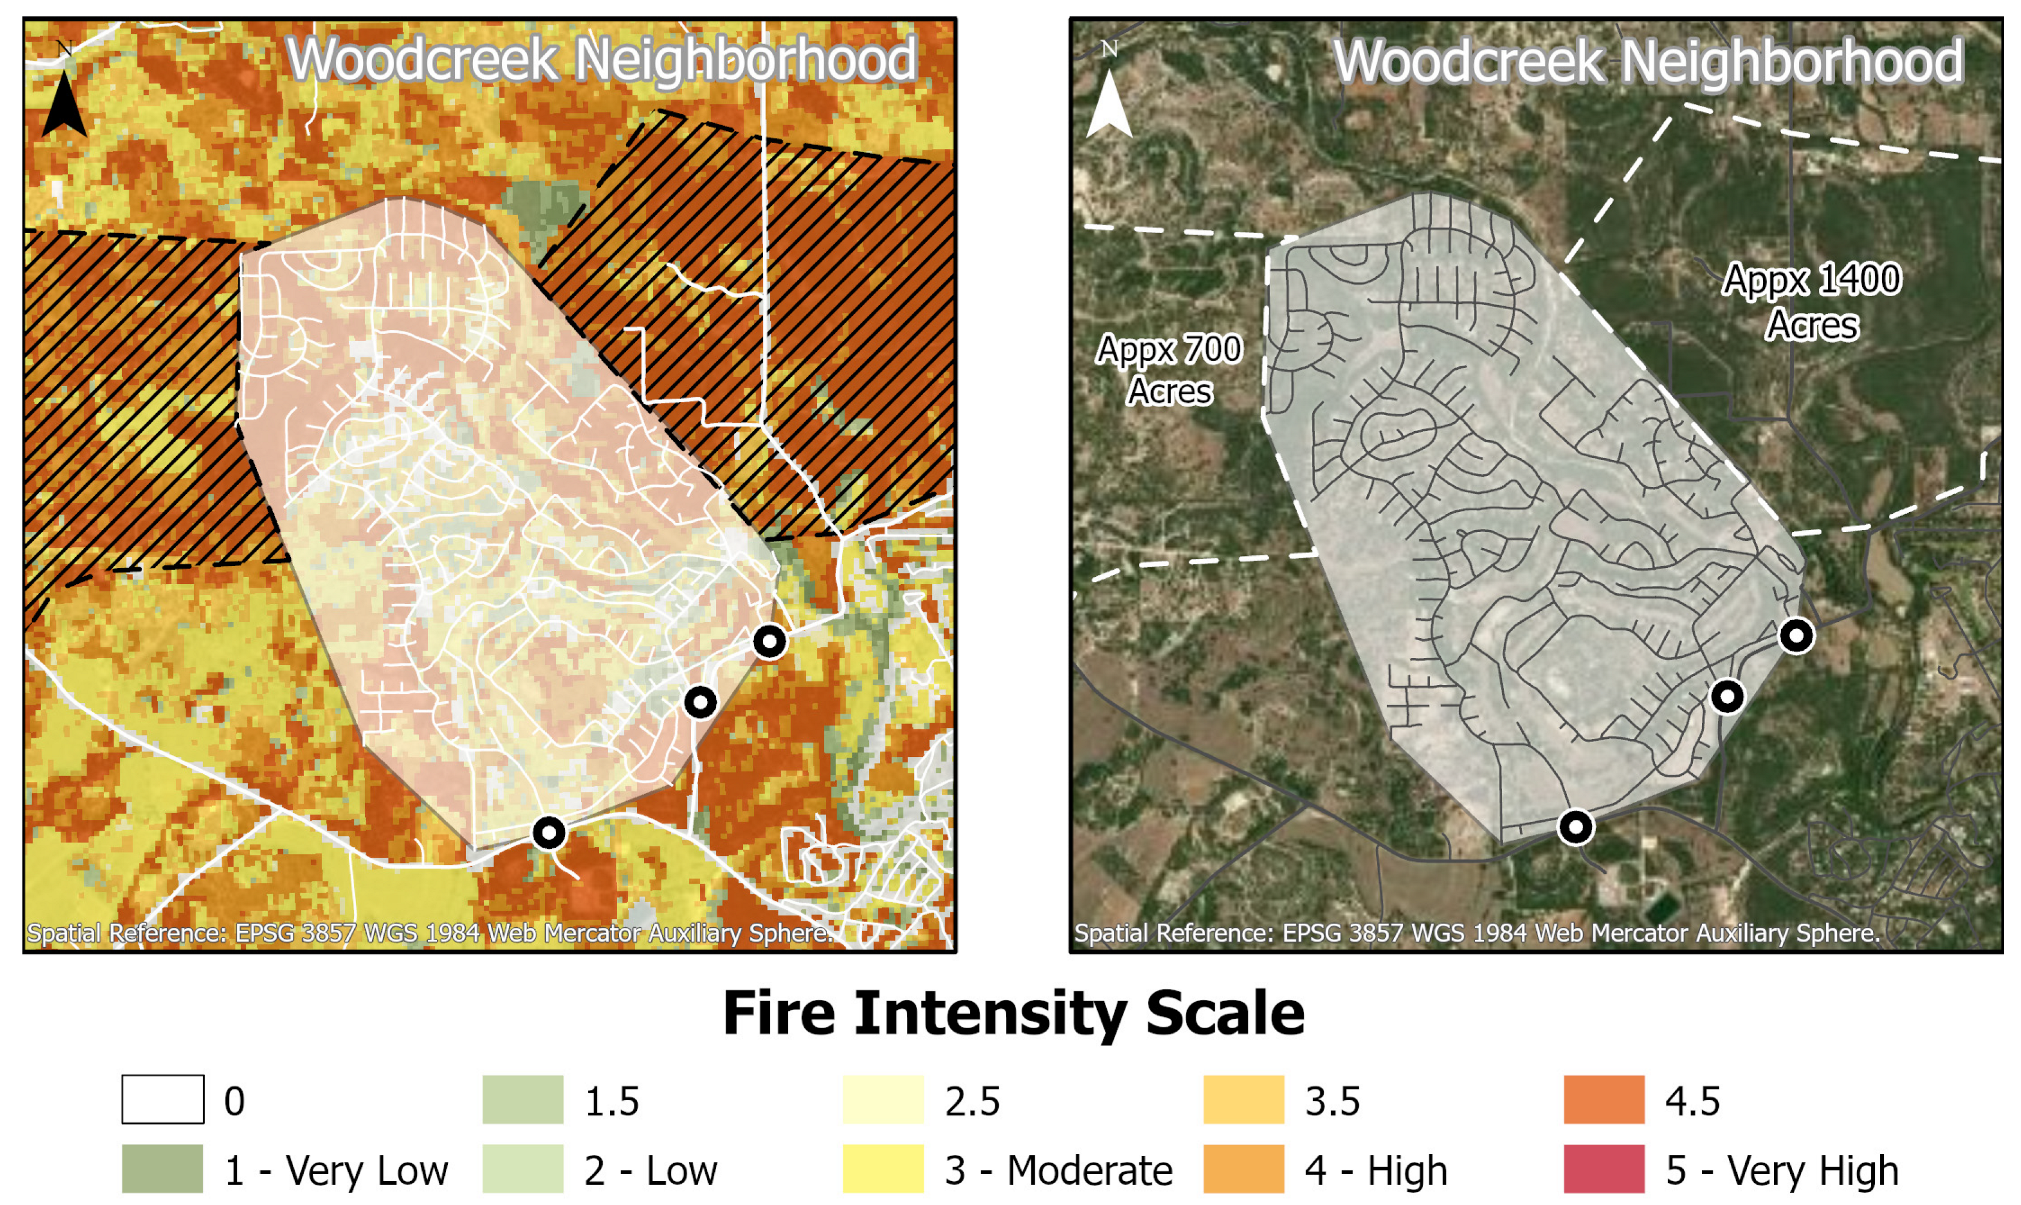
3.1. Additional Risk Factors
3.2. Limitations
4. Conclusions
Author Contributions
Funding
Data Availability Statement
Conflicts of Interest
References
- Balch, J.K.; Bradley, B.A.; Abatzoglou, J.T.; Nagy, R.C.; Fusco, E.J.; Mahood, A.L. Human-Started Wildfires Expand the Fire Niche across the United States. Proc. Natl. Acad. Sci. USA 2017, 114, 2946–2951. [Google Scholar] [CrossRef] [PubMed]
- Dennison, P.E.; Brewer, S.C.; Arnold, J.D.; Moritz, M.A. Large Wildfire Trends in the Western United States, 1984–2011. Geophys. Res. Lett. 2014, 41, 2928–2933. [Google Scholar] [CrossRef]
- Singleton, M.P.; Thode, A.E.; Sánchez Meador, A.J.; Iniguez, J.M. Increasing Trends in High-Severity Fire in the Southwestern USA from 1984 to 2015. For. Ecol. Manag. 2019, 433, 709–719. [Google Scholar] [CrossRef]
- Calkin, D.E.; Cohen, J.D.; Finney, M.A.; Thompson, M.P. How Risk Management Can Prevent Future Wildfire Disasters in the Wildland-Urban Interface. Proc. Natl. Acad. Sci. USA 2014, 111, 746–751. [Google Scholar] [CrossRef] [PubMed]
- Westerling, A.L. Increasing Western US Forest Wildfire Activity: Sensitivity to Changes in the Timing of Spring. Philos. Trans. R. Soc. B Biol. Sci. 2016, 371, 20150178. [Google Scholar] [CrossRef]
- Kramer, H.A.; Mockrin, M.H.; Alexandre, P.M.; Stewart, S.I.; Radeloff, V.C. Where Wildfires Destroy Buildings in the US Relative to the Wildland–Urban Interface and National Fire Outreach Programs. Int. J. Wildland Fire 2018, 27, 329. [Google Scholar] [CrossRef]
- Butler, K.; Butry, D.; Forney, G.P.; Johnsson, E.L.; Alexander, M.; Prasad, K. Wildland-Urban Interface (WUI) Fire Data Collection on Parcel Vulnerabilities; National Institution of Standards and Technology: Gaithersburg, MA, USA, 2021. [Google Scholar]
- CAL FIRE. CAL FIRE Top 20 Most Destructive California Wildfires. 2022. Available online: https://34c031f8-c9fd-4018-8c5a-4159cdff6b0d-cdn-endpoint.azureedge.net/-/media/calfire-website/our-impact/fire-statistics/top-20-destructive-ca-wildfires.pdf?rev=3f619258cab84b34b680ce521d615525&hash=6C6AD8F9377A31117DF437BBDBE68F07 (accessed on 24 July 2024).
- Maranghides, A.; Link, E.; Brown, C.U.; Walton, W.D.; Mell, W.; Hawks, S. A Case Study of the Camp Fire: Notification, Evacuation, Traffic, and Temporary Refuge Areas (NETTRA); National Institute of Standards and Technology: Gaithersburg, MD, USA, 2023; p. NIST TN 2252. [Google Scholar]
- Whelton, A.J.; Seidel, C.; Wham, B.P.; Fischer, E.C.; Isaacson, K.; Jankowski, C.; MacArthur, N.; McKenna, E.; Ley, C. The Marshall Fire: Scientific and Policy Needs for Water System Disaster Response. AWWA Water Sci. 2023, 5, e1318. [Google Scholar] [CrossRef]
- Cruz, M.G.; Sullivan, A.L.; Gould, J.S.; Sims, N.C.; Bannister, A.J.; Hollis, J.J.; Hurley, R.J. Anatomy of a Catastrophic Wildfire: The Black Saturday Kilmore East Fire in Victoria, Australia. For. Ecol. Manag. 2012, 284, 269–285. [Google Scholar] [CrossRef]
- Peace, M.; Ye, H.; Greenslade, J.; Kepert, J.D. The Destructive Sir Ivan Fire in New South Wales, Australia; Simulations Using a Coupled Fire—Atmosphere Model. Fire 2023, 6, 438. [Google Scholar] [CrossRef]
- Fromm, M.; Servranckx, R.; Stocks, B.J.; Peterson, D.A. Understanding the Critical Elements of the Pyrocumulonimbus Storm Sparked by High-Intensity Wildland Fire. Commun. Earth Environ. 2022, 3, 243. [Google Scholar] [CrossRef]
- Eftychidis, G. Mega-Fires in Greece (2007). In Encyclopedia of Natural Hazards; Bobrowsky, P.T., Ed.; Springer: Dordrecht, The Netherlands, 2013; pp. 664–671. ISBN 978-90-481-8699-0. [Google Scholar]
- Ribeiro, L.M.; Rodrigues, A.; Lucas, D.; Viegas, D.X. The large fire of Pedrógão Grande (Portugal) and its impact on structures. In Advances in Forest Fire Research 2018; Imprensa da Universidade de Coimbra: Coimbra, Portugal, 2018; pp. 852–858. ISBN 978-989-26-1650-6. [Google Scholar]
- Couto, F.T.; Santos, F.L.M.; Campos, C.; Andrade, N.; Purificação, C.; Salgado, R. Is Portugal Starting to Burn All Year Long? The Transboundary Fire in January 2022. Atmosphere 2022, 13, 1677. [Google Scholar] [CrossRef]
- Theobald, D.M.; Romme, W.H. Expansion of the US Wildland–Urban Interface. Landsc. Urban Plan. 2007, 83, 340–354. [Google Scholar] [CrossRef]
- Radeloff, V.C.; Helmers, D.P.; Kramer, H.A.; Mockrin, M.H.; Alexandre, P.M.; Bar-Massada, A.; Butsic, V.; Hawbaker, T.J.; Martinuzzi, S.; Syphard, A.D.; et al. Rapid Growth of the US Wildland-Urban Interface Raises Wildfire Risk. Proc. Natl. Acad. Sci. USA 2018, 115, 3314–3319. [Google Scholar] [CrossRef]
- Yuan, Y.; Wylie, A.G. Comparing Machine Learning and Time Series Approaches in Predictive Modeling of Urban Fire Incidents: A Case Study of Austin, Texas. ISPRS Int. J. Geo-Inf. 2024, 13, 149. [Google Scholar] [CrossRef]
- Radeloff, V.C.; Hammer, R.B.; Stewart, S.I.; Fried, J.S.; Holcomb, S.S.; McKeefry, J.F. The Wildland–Urban Interface in The United States. Ecol. Appl. 2005, 15, 799–805. [Google Scholar] [CrossRef]
- Stewart, S.I.; Radeloff, V.C.; Hammer, R.B.; Hawbaker, T.J. Defining the Wildland-Urban Interface. J. For. 2007, 105, 201–207. [Google Scholar] [CrossRef]
- Cova, T.J. Public Safety in the Urban–Wildland Interface: Should Fire-Prone Communities Have a Maximum Occupancy? Nat. Hazards Rev. 2005, 6, 99–108. [Google Scholar] [CrossRef]
- Wolshon, B.; Marchive, E. Emergency Planning in the Urban-Wildland Interface: Subdivision-Level Analysis of Wildfire Evacuations. J. Urban Plan. Dev. 2007, 133, 73–81. [Google Scholar] [CrossRef]
- Hammer, R.B.; Stewart, S.I.; Radeloff, V.C. Demographic Trends, the Wildland–Urban Interface, and Wildfire Management. Soc. Nat. Resour. 2009, 22, 777–782. [Google Scholar] [CrossRef]
- Jolly, W.M.; Cochrane, M.A.; Freeborn, P.H.; Holden, Z.A.; Brown, T.J.; Williamson, G.J.; Bowman, D.M.J.S. Climate-Induced Variations in Global Wildfire Danger from 1979 to 2013. Nat. Commun. 2015, 6, 7537. [Google Scholar] [CrossRef]
- Schoennagel, T.; Balch, J.K.; Brenkert-Smith, H.; Dennison, P.E.; Harvey, B.J.; Krawchuk, M.A.; Mietkiewicz, N.; Morgan, P.; Moritz, M.A.; Rasker, R.; et al. Adapt to More Wildfire in Western North American Forests as Climate Changes. Proc. Natl. Acad. Sci. USA 2017, 114, 4582–4590. [Google Scholar] [CrossRef] [PubMed]
- Cohn, P.J.; Carroll, M.S.; Kumagai, Y. Evacuation Behavior during Wildfires: Results of Three Case Studies. West. J. Appl. For. 2006, 21, 39–48. [Google Scholar] [CrossRef]
- Gill, A.M.; Stephens, S.L. Scientific and Social Challenges for the Management of Fire-Prone Wildland-Urban Interfaces. Environ. Res. Lett. 2009, 4, 034014. [Google Scholar] [CrossRef]
- Church, R.L.; Cova, T.J. Mapping Evacuation Risk on Transportation Networks Using a Spatial Optimization Model. Transp. Res. Part C Emerg. Technol. 2000, 8, 321–336. [Google Scholar] [CrossRef]
- Cova, T.J.; Theobald, D.M.; Norman, J.B.; Siebeneck, L.K. Mapping Wildfire Evacuation Vulnerability in the Western US: The Limits of Infrastructure. GeoJournal 2013, 78, 273–285. [Google Scholar] [CrossRef]
- Routley, J.G. East Bay Hills Fire: Oakland-Berkeley, California; Major Fires Investigation Project; United States Fire Administration; Federal Emergency Management Agency: Washington, DC, USA, 1991. [Google Scholar]
- Diskin, M.; Wyloge, E. Here’s Why so Many California Wildfire Evacuations Turn into Deadly Traffic Jams. Ventura County Star, 25 April 2019. [Google Scholar]
- Donovan, V.M.; Wonkka, C.L.; Twidwell, D. Surging Wildfire Activity in a Grassland Biome. Geophys. Res. Lett. 2017, 44, 5986–5993. [Google Scholar] [CrossRef]
- Donovan, V.M.; Crandall, R.; Fill, J.; Wonkka, C.L. Increasing Large Wildfire in the Eastern United States. Geophys. Res. Lett. 2023, 50, e2023GL107051. [Google Scholar] [CrossRef]
- Nielsen-Gammon, J.; Holman, S.; Buley, A.; Jorgensen, S.; Escobedo, J.; Ott, C.; Dedrick, J.; Van Fleet, A. Assessment of Historic and Future Trends of Extreme Weather in Texas, 1900–2036; Texas A&M University Office of the Texas State Climatologist: College Station, TX, USA, 2021; p. 44. [Google Scholar]
- Texas A&M Forest Service. Texas Wildfire Risk Assessment Summary Report—Hays County; Texas A&M Forest Service: College Station, TX, USA, 2022.
- Ye, H.; Brown, M.; Harding, J. GIS for All: Exploring the Barriers and Opportunities for Underexploited GIS Applications; University of Massachusetts Amherst: Amherst, MA, USA, 2013. [Google Scholar] [CrossRef]
- Göçmen, Z.A.; Ventura, S.J. Barriers to GIS Use in Planning. J. Am. Plann. Assoc. 2010, 76, 172–183. [Google Scholar] [CrossRef]
- Zhu, A.-X.; Zhao, F.-H.; Liang, P.; Qin, C.-Z. Next Generation of GIS: Must Be Easy. Ann. GIS 2021, 27, 71–86. [Google Scholar] [CrossRef]
- Sorensen, J.H.; Vogt, B.M.; Mileti, D.S. Evacuation: An Assessment of Planning and Research; Oak Ridge National Lab.: Oak Ridge, TN, USA, 1987. [Google Scholar]
- NRC. Criteria for Preparation and Evaluation of Radiological Emergency Response Plans and Preparedness; U.S. Nuclear Regulatory Commission: Rockville, MA, USA, 1980. [Google Scholar]
- Southworth, F. Regional Evacuation Modeling: A State-of-the Art Review; Oak Ridge National Lab.: Oak Ridge, TN, USA, 1991. [Google Scholar]
- Cova, T.J.; Church, R.L. Modelling Community Evacuation Vulnerability Using GIS. Int. J. Geogr. Inf. Sci. 1997, 11, 763–784. [Google Scholar] [CrossRef]
- Shababi, K.; Wilson, J.P. Scalable Evacuation Routing in Dynamic Environments. Comput. Environ. Urban Syst. 2018, 67, 29–40. [Google Scholar] [CrossRef]
- Manliguez, C.; Diche, Z.J.; Jimenez, M.J.; Agrazamendez, M.; Acosta, J. GIS-Based Evacuation Routing Using Capacity Aware Shortest Path Evacuation Routing Algorithm and Analytic Hierarchy Process for Flood Prone Communities. In Proceedings of the 3rd International Conference on Geographical Information Systems Theory, Applications and Management, Porto, Portugal, 27–28 April 2017; SCITEPRESS–—Science and Technology Publications: Setúbal, Portugal, 2017; pp. 237–243. [Google Scholar]
- URISA. Geospatial Fact Sheet: Addressing; URISA: Des Plaines, IL, USA, 2021. [Google Scholar]
- NENA. Data Structures Committee NENA Standard for NG9-1-1 GIS Data Model; National Emergency Number Association, Inc. (NENA): Alexandria, VA, USA, 2020. [Google Scholar]
- Weilbacher, E. U.S. Census Data Shows Hays County Is Fastest-Growing County in Nation. Available online: https://communityimpact.com/austin/san-marcos-buda-kyle/city-county/2021/09/12/us-census-data-shows-hays-county-is-fastest-growing-county-in-nation/ (accessed on 22 February 2022).
- Swanson, E.R. Physiographic Provinces of Texas. In Geo Texas; Texas A&M University Press: College Station, TX, USA, 1995; pp. 27–28. ISBN 978-0-89096-682-2. [Google Scholar]
- Hyndman, D.; Hyndman, W. Natural Hazards and Disasters; Cengage Learning: Boston, MA, USA, 2017; pp. 480–505. ISBN 978-1-305-58169-2. [Google Scholar]
- Sansom, A.; Armitano, E.R.; Wassenich, T. Water in Texas: An Introduction, Texas Natural History Guides; 1st ed.; University of Texas Press: Austin, TX, USA, 2008; ISBN 978-0-292-71809-8. [Google Scholar]
- Nielsen-Gammon, J.W.; Banner, J.L.; Cook, B.I.; Tremaine, D.M.; Wong, C.I.; Mace, R.E.; Gao, H.; Yang, Z.; Gonzalez, M.F.; Hoffpauir, R.; et al. Unprecedented Drought Challenges for Texas Water Resources in a Changing Climate: What Do Researchers and Stakeholders Need to Know? Earths Future 2020, 8, e2020EF001552. [Google Scholar] [CrossRef]
- Nielsen-Gammon, J.W. The Changing Climate of Texas. In The Impact of Global Warming on Texas; University of Texas Press: Austin, TX, USA, 2011; pp. 39–68. ISBN 978-0-292-72330-6. [Google Scholar]
- Jones, J.; Saginor, A.; Smith, B. 2011 Texas Wildfires Common Denominators of Home Destruction; Texas A&M Forest Service: College Station, TX, USA, 2013.
- Li, D.; Cova, T.J.; Dennison, P.E.; Wan, N.; Nguyen, Q.C.; Siebeneck, L.K. Why Do We Need a National Address Point Database to Improve Wildfire Public Safety in the U.S.? Int. J. Disaster Risk Reduct. 2019, 39, 101237. [Google Scholar] [CrossRef]
- City of Kyle. City of Kyle Code of Ordinances Section 53-33 General Requirements and Limitations; City of Kyle: Kyle, TX, USA, 2023; Available online: https://library.municode.com/tx/kyle/codes/code_of_ordinances?nodeId=PTIICOOR_CH53ZO_ARTIIZODIRE_DIV1GE_S53-33GERELI (accessed on 24 July 2024).
- City of San Marcos. San Marcos San Marcos Development Code Chapter 4 Zoning Regulations; City of San Marcos: San Marcos, TX, USA, 2021. Available online: https://www.sanmarcostx.gov/DocumentCenter/View/31094/San-Marcos-Development-Code---Ord-2021-88---Effective-November-3-2021?bidId= (accessed on 24 July 2024).
- Hays County Development Regulations. Table 721.02—Design Requirements Based on Roadway Classification; Hays County Development Regulations: Hays County, TX, USA, 2017. [Google Scholar]
- Maranghides, A.; Link, E.; Mell, W.; Hawks, S.; Wilson, M.; Brewer, W.; Brown, C.; Vihnaneck, B.; Walton, W.D. A Case Study of the Camp Fire—Fire Progression Timeline; National Institute of Standards and Technology: Gaithersburg, MD, USA, 2021; p. NIST TN 2135. [Google Scholar]
- Cohen, J. Preventing Disaster: Home Ignitability in the Wildland-Urban Interface. J. For. 2000, 98, 15–21. [Google Scholar] [CrossRef]
- Baker, M. WUI Code; Austin Fire Wildfire Division: Austin, TX, USA, 2019. [Google Scholar]


| Rank | Name | House Count | Adjusted Exits | Egress Ratio | Fire Risk Level | LON | LAT |
|---|---|---|---|---|---|---|---|
| 1 | WOODCREEK | 3228 | 2 | 1614 | 5 | −98.141 | 30.035 |
| 2 | HIGHPOINTE | 1041 | 1 | 1041 | 5 | −97.996 | 30.169 |
| 3 | CALTERRA | 515 | 1 | 515 | 5 | −98.099 | 30.173 |
| 4 | WOODCREEK GOLF | 1618 | 4 | 404 | 5 | −98.113 | 30.021 |
| 5 | LA VENTANA WEST | 290 | 1 | 290 | 5 | −98.045 | 30.095 |
| 6 | CEDAR OAKS MESA | 249 | 1 | 249 | 5 | −98.131 | 29.974 |
| 7 | S SUNSET CANYON | 246 | 1 | 246 | 5 | −98.021 | 30.182 |
| 8 | SHADY VALLEY | 203 | 1 | 203 | 5 | −98.220 | 30.209 |
| 9 | BELTERRA | 2041 | 2 | 1020 | 4 | −97.985 | 30.191 |
| 10 | DEER CREEK | 1327 | 2 | 664 | 4 | −98.049 | 30.275 |
| 11 | REUNION RANCH | 534 | 1 | 534 | 4 | −97.937 | 30.155 |
| 12 | ARROWHEAD RANCH | 422 | 1 | 422 | 4 | −98.123 | 30.197 |
| 13 | N SUNSET CANYON | 1253 | 3 | 418 | 4 | −98.038 | 30.208 |
| 14 | BIG SKY RANCH | 746 | 2 | 373 | 4 | −98.079 | 30.204 |
| 15 | WEST CAVE ESTATES | 323 | 1 | 323 | 4 | −98.060 | 30.277 |
| 16 | GOLDENWOOD | 938 | 3 | 313 | 4 | −97.974 | 30.137 |
| 17 | BUSH RANCH | 247 | 1 | 247 | 4 | −97.980 | 30.210 |
| 18 | ROLLING OAKS | 245 | 1 | 245 | 4 | −98.022 | 30.064 |
| 19 | ESCARPMENT | 467 | 2 | 234 | 4 | −97.917 | 30.171 |
| 20 | BUNKER RANCH | 221 | 1 | 221 | 4 | −98.129 | 30.196 |
| 21 | HERITAGE OAKS | 216 | 1 | 216 | 4 | −97.990 | 30.212 |
| 22 | SPRINGLAKE | 201 | 1 | 201 | 4 | −98.099 | 30.220 |
| 23 | SW TERRITORY | 463 | 1 | 463 | 3 | −97.884 | 30.139 |
| 24 | ELLIOTT RANCH | 637 | 2 | 318 | 3 | −97.895 | 30.112 |
| 25 | RUBY RANCH | 310 | 1 | 310 | 3 | −97.920 | 30.073 |
| 26 | LA CIMA | 268 | 1 | 268 | 3 | −97.999 | 29.895 |
| 27 | SUNFIELD | 3210 | 3 | 1070 | 2 | −97.802 | 30.079 |
| 28 | SHADOW CREEK | 1837 | 3 | 612 | 2 | −97.814 | 30.041 |
| 29 | BLANCO VISTA | 1606 | 3 | 535 | 2 | −97.894 | 29.949 |
| 30 | WATERLEAF | 1037 | 2 | 518 | 2 | −97.844 | 29.967 |
| 31 | CROSSWINDS | 503 | 1 | 503 | 2 | −97.816 | 30.024 |
| 32 | WHISPERING HOLLOW | 1497 | 3 | 499 | 2 | −97.862 | 30.090 |
| 33 | TRACE | 498 | 1 | 498 | 2 | −97.990 | 29.807 |
| 34 | KISSING TREE | 780 | 2 | 390 | 2 | −97.993 | 29.845 |
| 35 | CIMARRON | 1145 | 3 | 382 | 2 | −97.861 | 30.113 |
| 36 | SOUTHLAKE RANCH | 365 | 1 | 365 | 2 | −97.845 | 29.999 |
| 37 | KINGSWOOD | 362 | 1 | 362 | 2 | −98.019 | 29.841 |
| 38 | COTTONWOOD CREEK | 693 | 2 | 346 | 2 | −97.938 | 29.817 |
| 39 | CYPRESS FOREST | 1021 | 3 | 340 | 2 | −97.899 | 30.000 |
| 40 | CULLEN COUNTRY | 1015 | 3 | 338 | 2 | −97.860 | 30.097 |
| 41 | SUNSET RIDGE | 334 | 1 | 334 | 2 | −97.851 | 29.971 |
| 42 | KENSINGTON TRAILS | 667 | 2 | 334 | 2 | −97.837 | 30.010 |
| 43 | PURPLE MARTIN AVE | 319 | 1 | 319 | 2 | −97.835 | 30.035 |
| 44 | AMBERWOOD | 944 | 3 | 315 | 2 | −97.841 | 30.027 |
| 45 | HOMETOWN KYLE | 910 | 3 | 303 | 2 | −97.891 | 30.001 |
| 46 | BISHOP CROSSING | 569 | 2 | 284 | 2 | −97.969 | 29.889 |
| 47 | GREEN PASTURES | 851 | 3 | 284 | 2 | −97.809 | 30.004 |
| 48 | LAUREL ESTATES | 838 | 3 | 279 | 2 | −97.982 | 29.863 |
| 49 | POST OAK | 814 | 3 | 271 | 2 | −97.865 | 29.971 |
| 50 | THE RAILYARD | 525 | 2 | 262 | 2 | −97.804 | 29.995 |
| 51 | MOUNTAIN CITY | 241 | 1 | 241 | 2 | −97.892 | 30.039 |
| 52 | HIGHLANDS | 466 | 2 | 233 | 2 | −97.819 | 29.967 |
| 53 | STONERIDGE | 921 | 4 | 230 | 2 | −97.825 | 30.064 |
| 54 | ANTHEM | 221 | 1 | 221 | 2 | −97.905 | 30.026 |
| 55 | EL CAMINO REAL | 410 | 2 | 205 | 2 | −97.934 | 29.836 |
| 56 | MEADOW PARK | 205 | 1 | 205 | 2 | −97.819 | 30.072 |
| 57 | BUNTON CREEK | 1058 | 2 | 529 | 0 | −97.838 | 29.980 |
Disclaimer/Publisher’s Note: The statements, opinions and data contained in all publications are solely those of the individual author(s) and contributor(s) and not of MDPI and/or the editor(s). MDPI and/or the editor(s) disclaim responsibility for any injury to people or property resulting from any ideas, methods, instructions or products referred to in the content. |
© 2024 by the authors. Licensee MDPI, Basel, Switzerland. This article is an open access article distributed under the terms and conditions of the Creative Commons Attribution (CC BY) license (https://creativecommons.org/licenses/by/4.0/).
Share and Cite
Ramos, C.; Yuan, Y. Neighborhood-Scale Wildfire Evacuation Vulnerability in Hays County, TX. Geographies 2024, 4, 481-499. https://doi.org/10.3390/geographies4030026
Ramos C, Yuan Y. Neighborhood-Scale Wildfire Evacuation Vulnerability in Hays County, TX. Geographies. 2024; 4(3):481-499. https://doi.org/10.3390/geographies4030026
Chicago/Turabian StyleRamos, Chad, and Yihong Yuan. 2024. "Neighborhood-Scale Wildfire Evacuation Vulnerability in Hays County, TX" Geographies 4, no. 3: 481-499. https://doi.org/10.3390/geographies4030026
APA StyleRamos, C., & Yuan, Y. (2024). Neighborhood-Scale Wildfire Evacuation Vulnerability in Hays County, TX. Geographies, 4(3), 481-499. https://doi.org/10.3390/geographies4030026