Article

A Balloon Mapping Approach to Forecast Increases in PM10 from the Shrinking Shoreline of the Salton Sea

1
School of Public Health, Loma Linda University, Loma Linda, CA 92350, USA
2
Alianza Coachella Valley, 1515 6th St., Coachella, CA 92236, USA
3
Department of Environmental Sciences, College of Natural & Agricultural Sciences, University of California, Riverside, CA 92521, USA
*
Author to whom correspondence should be addressed.
Geographies 2024, 4(4), 630-640; https://doi.org/10.3390/geographies4040034
Submission received: 10 September 2024 / Revised: 12 October 2024 / Accepted: 12 October 2024 / Published: 17 October 2024
(This article belongs to the Special Issue Feature Papers of Geographies in 2024)

Abstract

:
Shrinking shorelines and the exposed playa of saline lakes can pose public health and air quality risks for local communities. This study combines a community science method with models to forecast future shorelines and PM10 air quality impacts from the exposed playa of the Salton Sea, near the community of North Shore, CA, USA. The community science process assesses the rate of shoreline change from aerial images collected through a balloon mapping method. These images, captured from 2019 to 2021, are combined with additional satellite images of the shoreline dating back to 2002, and analyzed with the DSAS (Digital Shoreline Analysis System) in ArcGIS desktop. The observed rate of change was greatly increased during the period from 2017 to 2020. The average rate of change rose from 12.53 m/year between 2002 and 2017 to an average of 38.44 m/year of shoreline change from 2017 to 2020. The shoreline is projected to retreat 150 m from its current position by 2030 and an additional 172 m by 2041. To assess potential air quality impacts, we use WRF-Chem, a regional chemical transport model, to predict increases in emissive dust from the newly exposed playa land surface. The model output indicates that the forecasted 20-year increase in exposed playa will also lead to a rise in the amount of suspended dust, which can then be transported into the surrounding communities. The combination of these model projections suggests that, without mitigation, the expanding exposed playa around the Salton Sea is expected to worsen pollutant exposure in local communities.

1. Introduction

The Salton Sea, California’s largest lake, is a critical yet shrinking ecosystem in the Imperial and Coachella Valleys [1]. As an endorheic basin (Figure 1), the Salton Sea has filled and evaporated multiple times over the past 1300 years [2,3]; historically, evaporation and inflows into this endorheic basin have fluctuated. Recently, water diversions mandated by the 2003 Quantification Settlement Agreement (QSA) have accelerated the sea’s decline [1]. As the shoreline recedes, the exposed lakebed (playa) generates airborne particulate matter (PM), posing respiratory health hazards for surrounding communities [4]. The Imperial and Coachella Valleys are already disproportionately burdened by air pollution from agricultural and industrial activities, exacerbating existing environmental injustices to underserved populations near the Salton Sea [5].
The retreating shoreline not only exposes emissive playa, but also concentrates pollutants within the shrinking water body. Agricultural return flows, which comprise about 90% of the Salton Sea’s inflow [6], carry high levels of nutrients like nitrogen and phosphorus. This nutrient-rich water, combined with wind-induced sediment resuspension, fuels excessive algal growth and disrupts the natural nutrient cycling in the water column [7]. As the sea recedes and concentrates these pollutants, the newly exposed playa becomes increasingly contaminated with agricultural runoff, creating a reservoir for several classes of contaminants that can be readily aerosolized and transported by wind into neighboring communities. This process can lead to a further loss of biodiversity, more frequent toxic algal blooms, and oxygen deficiency in the remaining surface waters [8], ultimately exacerbating the environmental challenges facing the Salton Sea ecosystem.
Because of the dry desert climate and the shallow elevation profile of the sea, the exposed playa generates particulates that are potentially spread by the wind [4]. Playa-like soil has been estimated to account for nearly 10% of total ambient PM10 in the region based on elemental analyses [9]. These estimates were calculated before the completion of the water transfer, implying that the contribution of exposed playa to ambient PM10 in the region is likely to increase as the emissive surface area continues to advance. Based on a projected 38% increase in exposed playa by 2030, PM10 concentrations in one case study were predicted to increase by an average of 11% and up to a factor of 10 in some areas [10]. Additionally, current models may not fully include other climate models on temperature increase, likely to exacerbate the Salton Sea’s water loss through evaporation and increase the exposed playa area.
This study tackles these environmental justice issues through an experimental approach emphasizing community engagement. In partnership with Alianza Coachella Valley (Alianza CV), a grassroots organization committed to environmental justice, we employ community science methodologies to track shoreline changes and project future playa expansion. Alianza CV directly involves impacted communities in the science process, amplifying their voices to be equal with study investigators. This brings the community to the same level and empowers them in decision-making that affects their health and well-being. This partnership arose from community groups at the North Shore Yacht Club site requesting more information on the potential health impacts of playa recession. These same groups are actively involved in the planning of a new recreational trail that will serve as a community amenity and playa dust suppression area.
This study combines historical satellite imagery analysis, community-led balloon mapping, and air quality modeling to answer research questions that could provide a vital policy tool to warrant further air quality protections for the nearby community. Specifically, this study seeks to investigate the health hazard outcome of a “do-nothing” scenario where the Salton Sea playa is allowed to recede without mitigation from infrastructure or the necessary proactive water policy. To predict the do-nothing outcome, this study will first investigate the rate of shoreline change, then forecast the new emissive playa area to be exposed, and then use a model for the air quality expected from emissive playa by the year 2040.
The air quality model will focus on a specific community near the Salton Sea shoreline, forecasting PM10 air quality levels for the next 20 years. The study aims to provide policymakers with objective data on local air quality, which could inform potential mitigation strategies and interventions if significant impacts are identified. The research questions are designed to address concerns raised by residents regarding the environmental impacts of the Salton Sea, ensuring that scientific findings are relevant to the needs and experiences of the local community. Furthermore, the recently implemented Imperial Irrigation District (IID) System Conservation Implementation Agreement (SCIA) is projected to further reduce inflows to the Salton Sea, accelerating shoreline recession and playa exposure. This highlights the urgent need for the continuous community-based and health agency monitoring of shoreline changes, such as those employed in this study, to accurately assess and project the impact of these developments on air quality and public health.

2. Materials and Methods
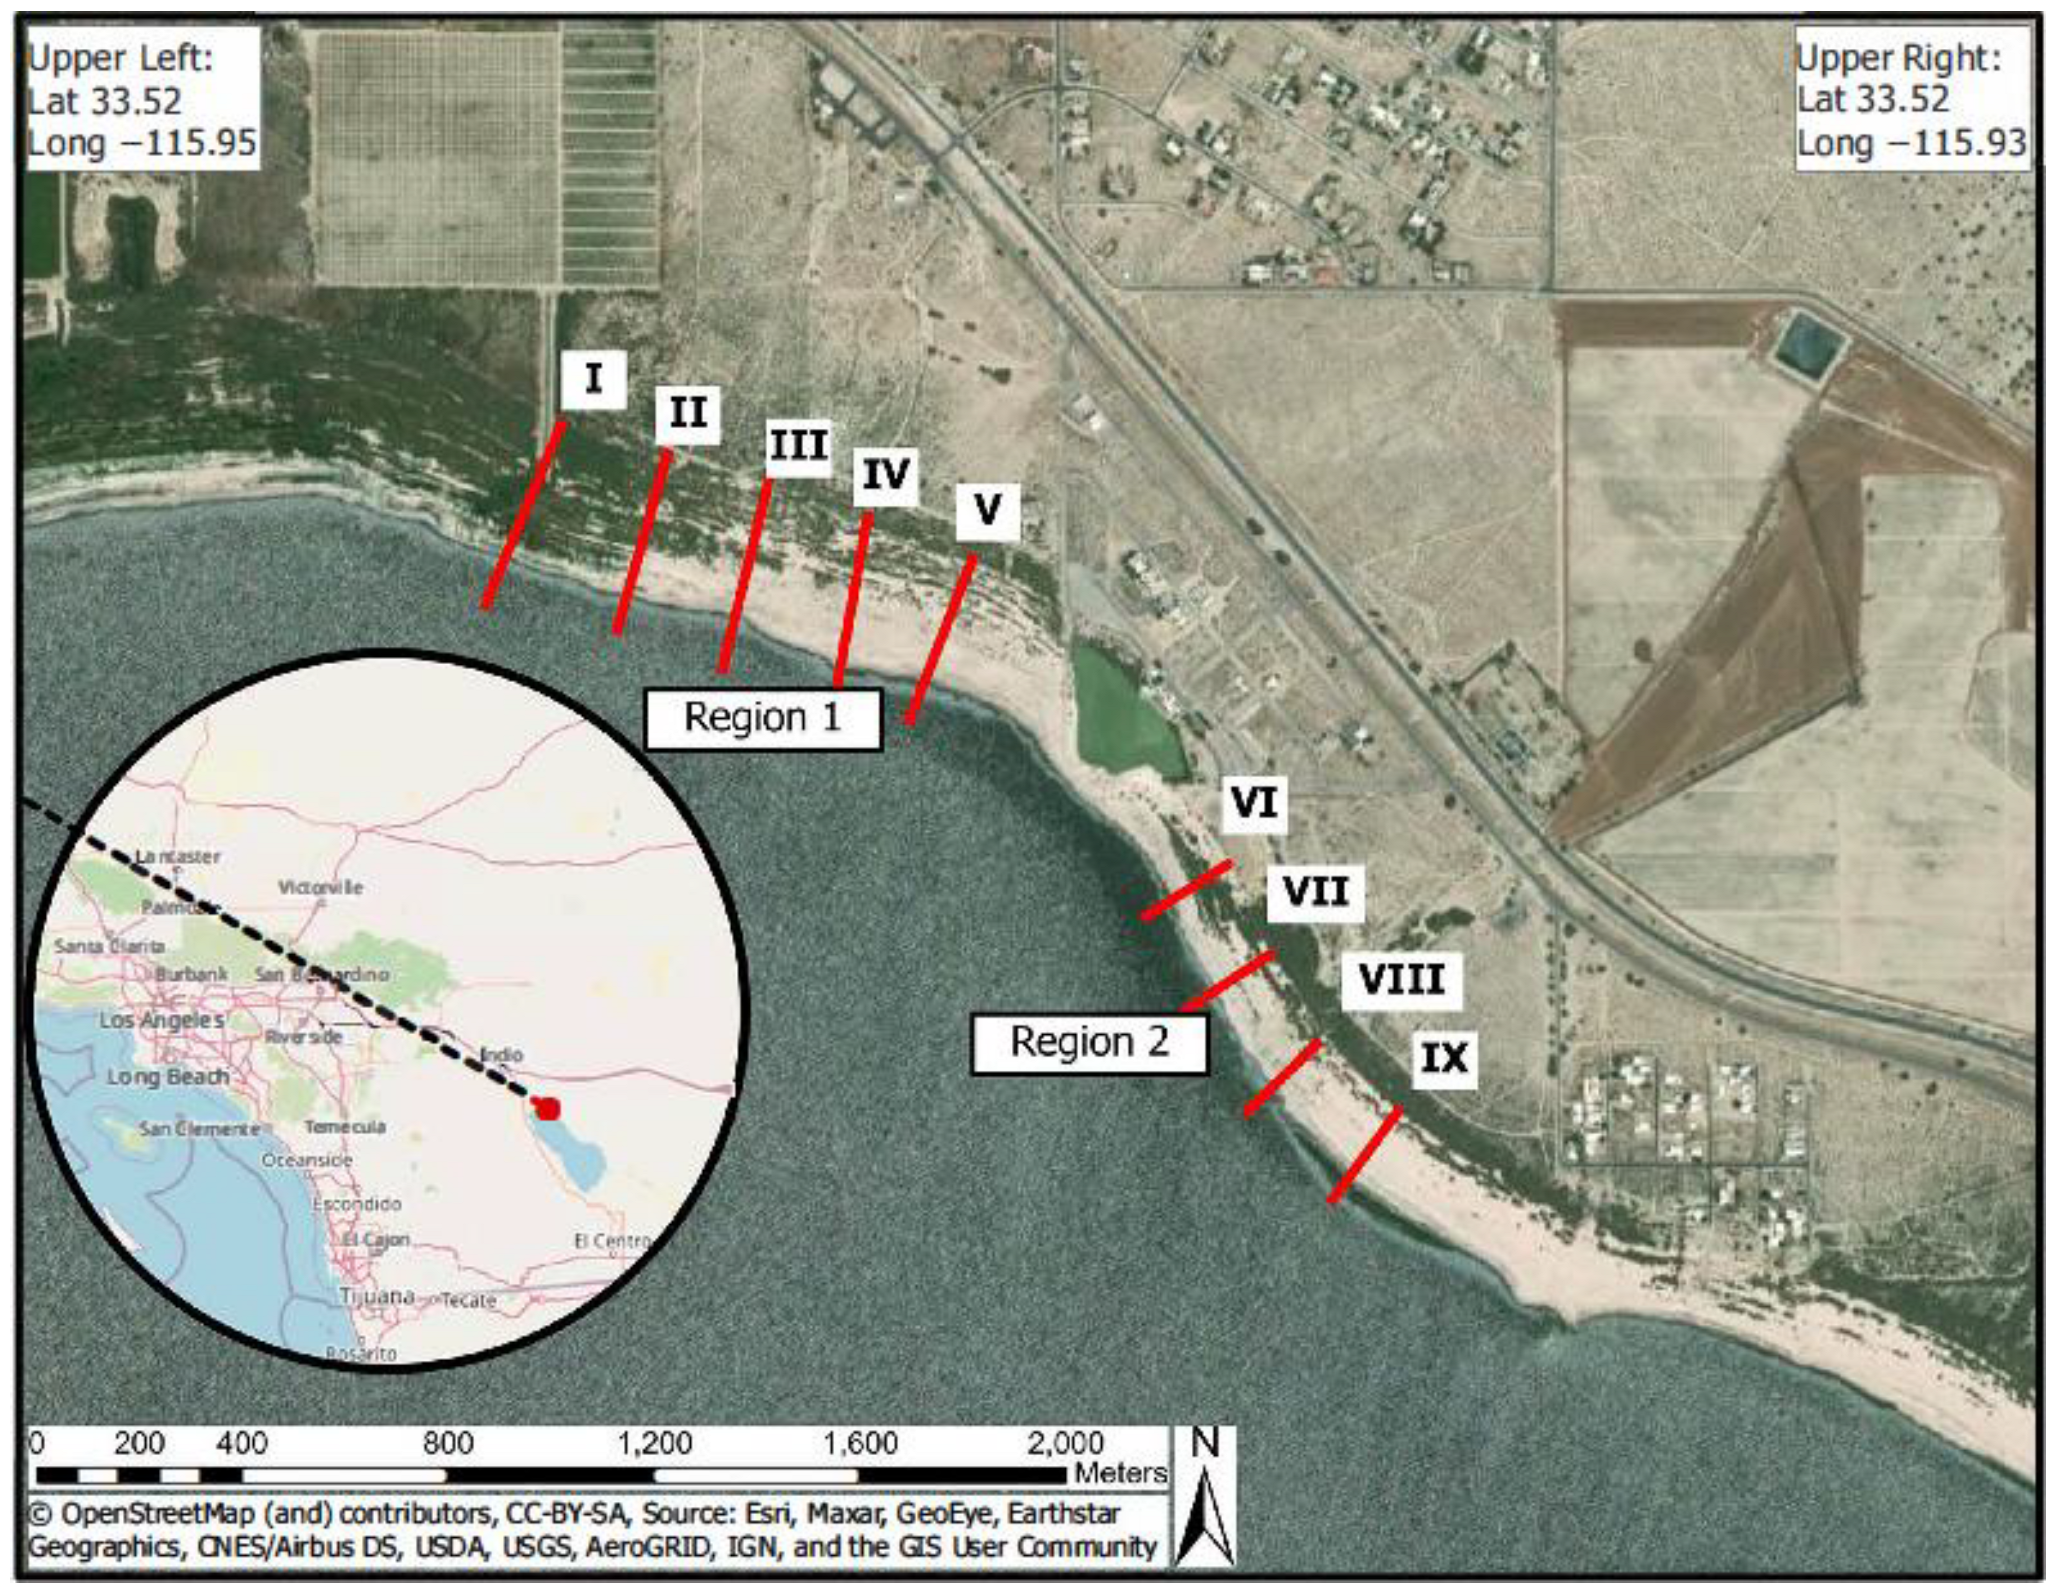
2.1. Study Area

This study focuses on the Salton Sea’s North Shore, particularly the area adjacent to the unincorporated community of North Shore in Riverside County, California (Figure 1). The area shown in Figure 1 includes the segments of the study area which is 2.4 km long and centered at 33°31′24″ N, 115°57′5″ W (Figure 1). This region is a critical area for our work due to its proximity to communities facing disproportionate environmental justice concerns associated with Salton Sea shoreline recession and the potential for increased dust emissions. Our community partners at Alianza CV played a significant role in selecting this region, as many members are familiar with the landscape and distinctly remember the moment in 2018 when the Salton Sea’s connection to the North Shore Yacht Club marina dried.

2.2. Community Methods

We recruited community scientists for this initiative from two sites. We held in-person meetings at the North Shore Yacht Club and the North Shore Community Park every Saturday at 11 am throughout the months of October through February in 2019 and 2020. These are heavily frequented areas by the local community where it is possible to recruit individuals to walk along the shoreline. Additionally, we worked with the Alianza Coachella Valley Youth Organizing Council, whose members include students interested in environmental justice. They were invited to come to the biweekly meetings for data collection. These community scientists and recruitment are further described in later work involving water quality [11].
The balloon-mapping program was first initiated after the community expressed concerns about the receding shoreline during their meetings at Alianza CV’s resilient Salton Sea community group. Staff at Alianza CV recommended a need for better understanding among community members of the receding shoreline, so they were key in choosing an area close to the community that was familiar. In addition to this, the community is very concerned about the dust coming from the Salton Sea, so we proposed a post-processing model to forecast air quality in a do-nothing scenario. We proposed to answer the community concerns and to assist the community with new data for advocacy based on the concern that the state was not prioritizing dust mitigation measures.

2.3. Data Sources and Image Acquisition

To comprehensively analyze shoreline changes and their impacts, we combined satellite imagery data with other imagery data obtained through the public lab’s kit and method for balloon mapping [12]. Historical satellite imagery was obtained through Google Earth Pro, which included several Landsat satellite images spanning from 2002 to 2018 [13]. This temporal dataset allowed us to track shoreline recession over the same time that mitigation water was made available to the Salton Sea through the QSA between 2002 to 2021.
The community science balloon mapping used the public lab’s method [12] for deploying a helium-filled weather balloon with a camera suspended beneath. In collaboration with Alianza Coachella Valley, we implemented this community science approach using balloon mapping between August 2018 and August 2021. Community members employed the public lab’s mapping kit and built a custom picavet rig (Figure 2) to configure the camera and capture high-resolution, georeferenced aerial images of the shoreline. We then processed these images using WebODM software [14], using the default profile settings with a resolution set to 0.5 cm/pixel. That software produced orthorectified TIFF images. This was visualized in the WebODM and then imported to ArcGIS 10.7 (ESRI, Redlands, CA, USA). This provided detailed shoreline data for 2018 through 2021 to complement the satellite imagery.

2.4. Image Processing and Analysis

The georeferenced images from balloon mapping and satellite imagery were exported to ArcGIS 10.7 and georeferenced to overlap historical images over the exact same position. Images were aligned using four ground control points that contained the same coordinates in each map. We compiled a geodatabase from the extracted shoreline positions with an estimated baseline position that represented the point at which the shoreline change began for the two regions (Figure 3). We used the U.S. Geological Survey Digital Shoreline Analysis System (DSAS) as an extension to ArcGIS software to compute the rate of change at specified intervals along defined transects. There were eighteen transects cast along the two regions with 10 on Region 1 and 8 on Region 2, keeping transects at a 100 m distance interval. To facilitate the visualization and presentation of the shoreline change results across numerous transects, we grouped the 18 transects into 9 segments (5 in Region 1 and 4 in Region 2). The transects were cast perpendicular to each of the historic shorelines from the baseline to allow the calculation of the end point rate (EPR), net shoreline movement, and the linear regression rate (LRR) [15,16] (Crowell et al., 2005; Genz et al., 2007). We used these three data analysis techniques to analyze the rate of shoreline change. The NSM is the distance between the oldest and the youngest shoreline in each transect, and the EPR is the division of NSM by the time elapsed between the oldest and youngest dates. The LRR method fits a least square regression line to the shoreline position points in each transect. The points where the shorelines intersect in each transect are plotted, and a linear regression equation is calculated:
y = b + rx,
where y is the distance in meters, b is the distance from the baseline (y-intercept), r is the rate of change (slope of the fitted line), and x represents the year. Uncertainty for the rate is considered for a confidence interval of 95%. Negative values for NSM and LRR indicate a recession of the shoreline. We also calculated an R-squared statistic (R2) as the coefficient of determination to indicate the percentage of variance in the data that is explained by the regression.

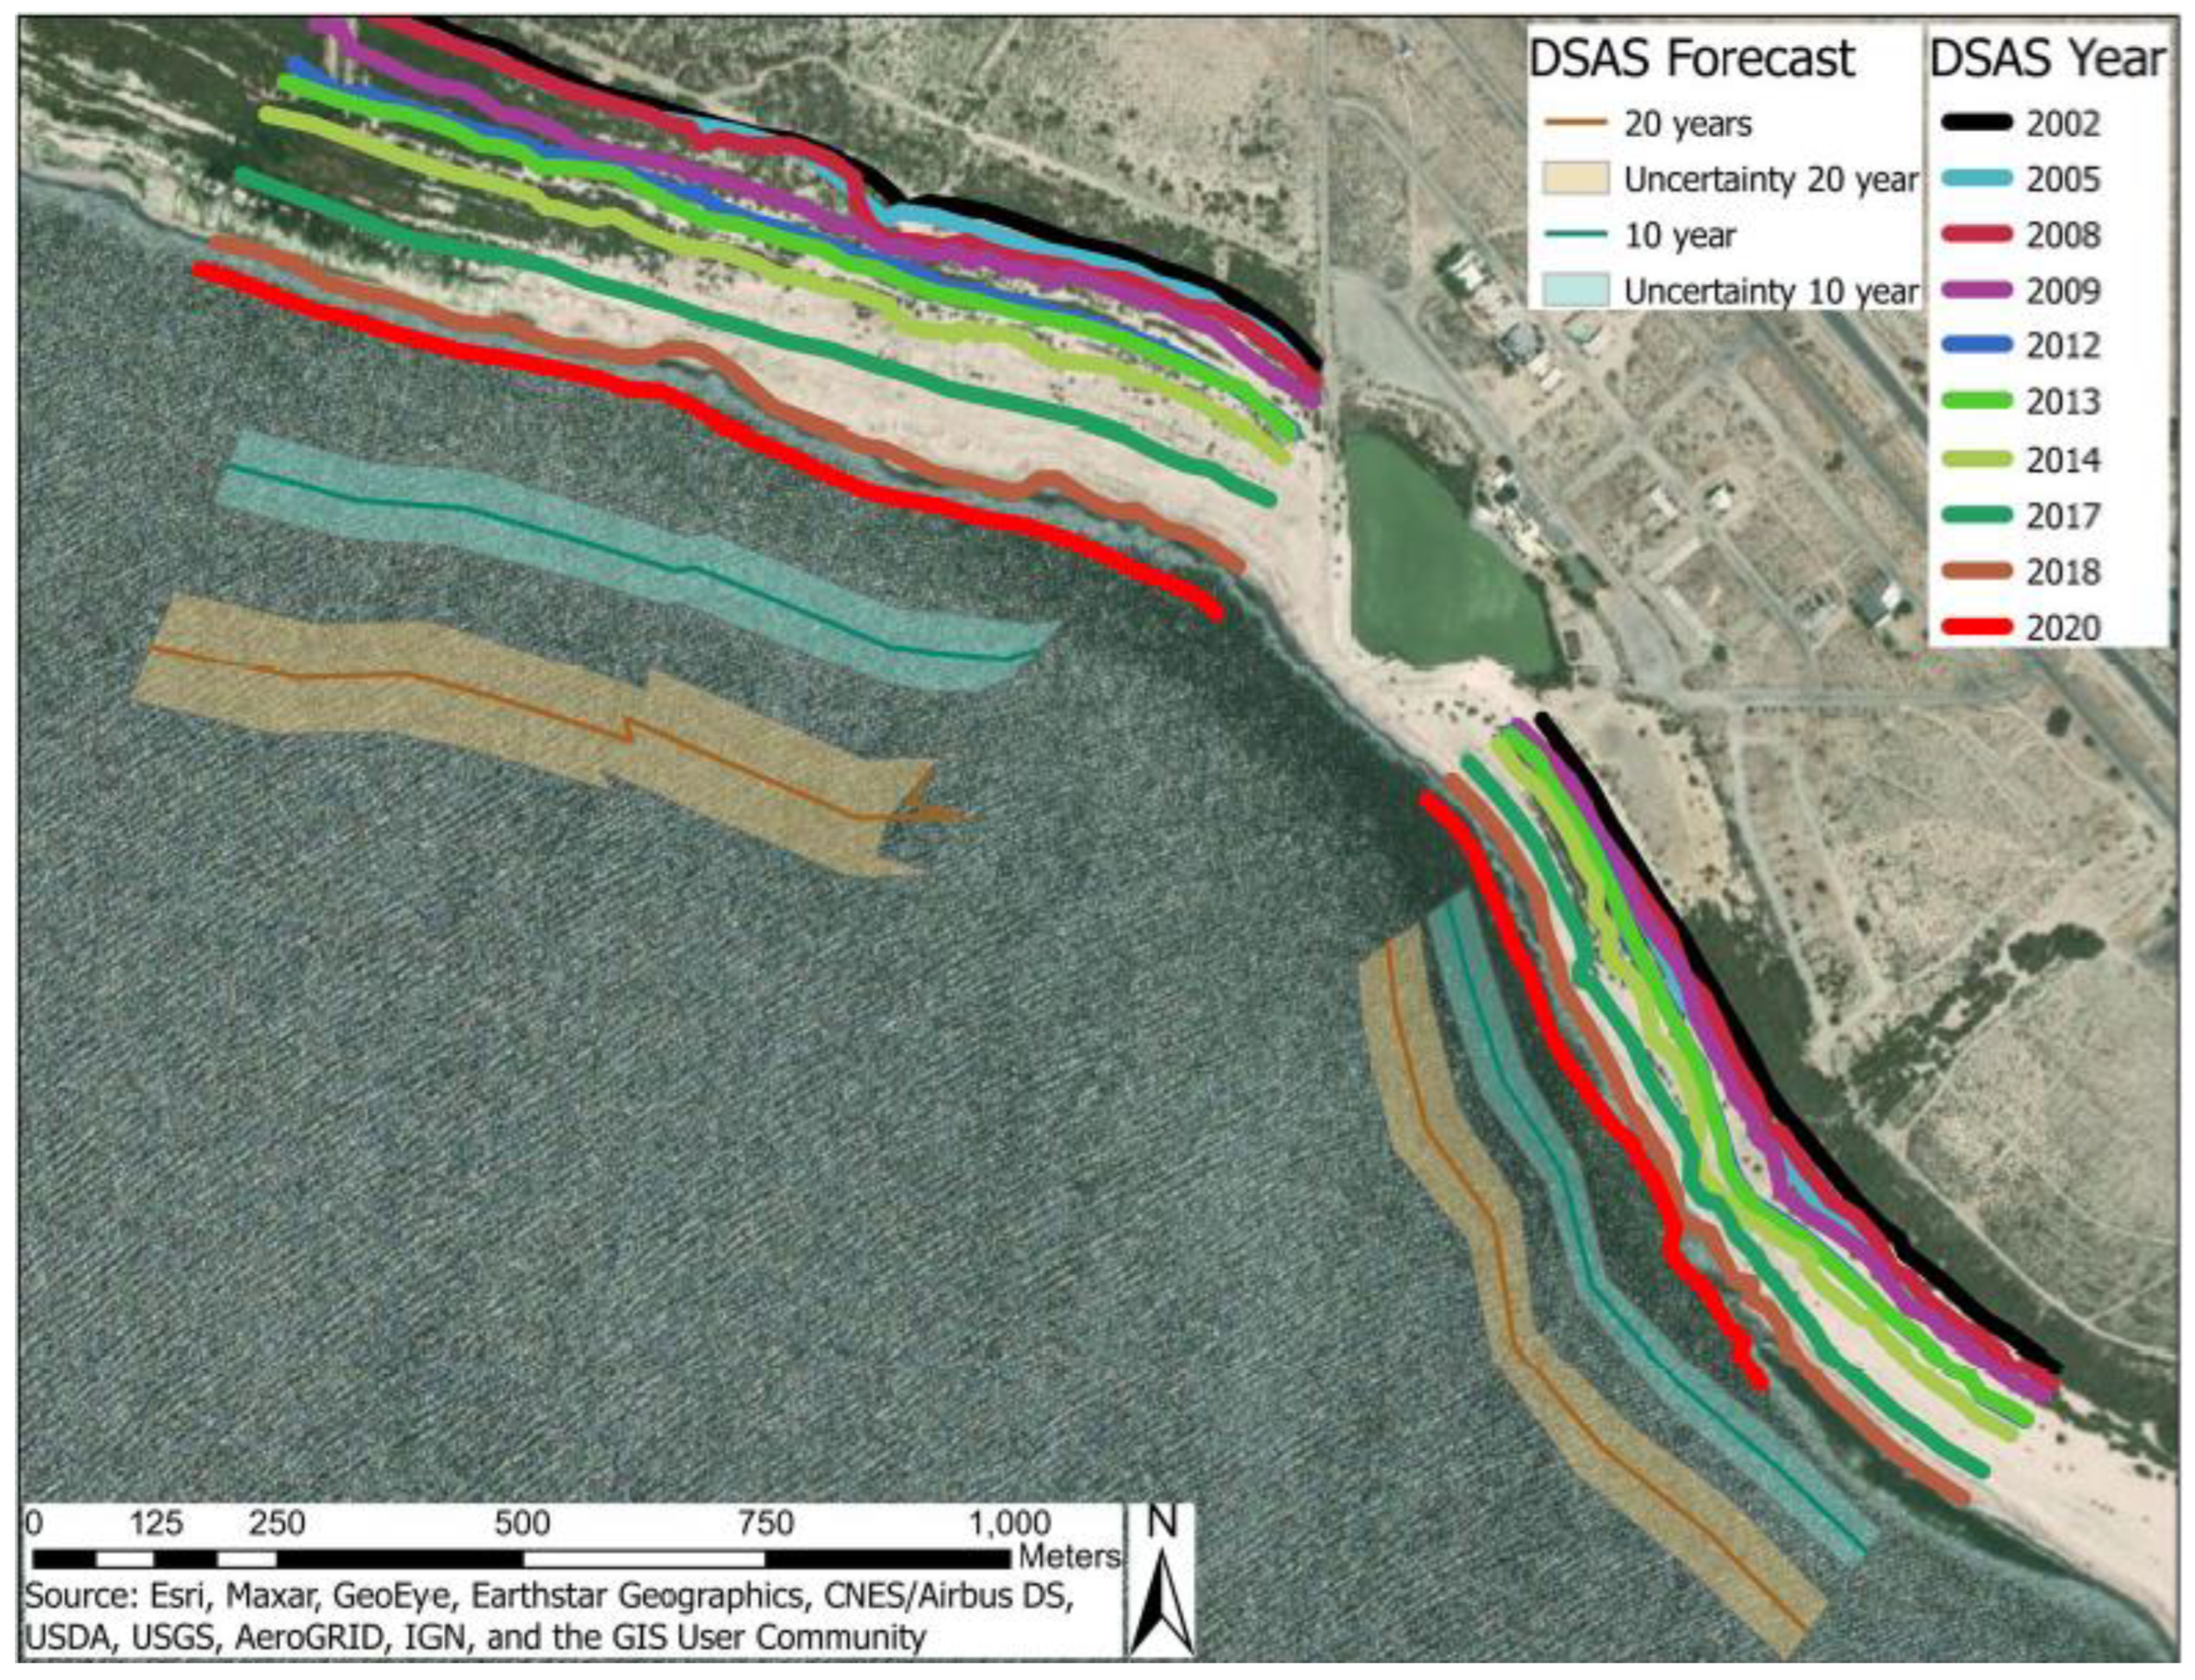
2.5. Shoreline Forecasting

Shoreline forecasts were calculated for 10 and 20 years into the future, based on the historical shoreline positions of our data. We calculated this forecast in DSAS by applying the Kalman filter [17], which combines observed shoreline positions with model-derived positions. The calculation uses the linear regression rate previously calculated and also estimates an uncertainty level. The limitations of this method are that it assumes a linear regression through past shoreline positions and does not consider other factors such as the bathymetry of the lake and wind.

2.6. PM10 Forecasting

We combined the 2041 shoreline forecast with a PM10 forecast by converting the new shoreline into a gridded percent land fraction as an input dataset. We used this to drive high-resolution WRF-Chem simulations to predict winds and potential PM10 dust emissions from the forecasted emissive playa. WRF-Chem, a regional-scale air quality and chemical transport model, has been used previously to examine dust in the Salton Sea basin [10]. Here, we examine a dust event on 22 June 2016 as a case study to examine potential PM10 contributions to dust levels in local communities as a result of ongoing shoreline exposure. To this end, we began with base emissivity data derived from a global high-resolution sediment supply map [18], and then modified the input grid cells at the north and south side of the North Shore Yacht Club to represent the observed and expected changes from 2000 to 2041. We then constructed a three-tiered nested domain centered around the Salton Basin with 15 km, 5 km, and 1 km horizontal resolutions, respectively, and simulated dust emissions and transport for three days, from 21 June to 23 June 2016. The resulting PM10 output was compared between base and modified cases to determine the expected impacts of increased surface exposure under high-wind conditions. We focused on those grid cells including dust emitted from the examined surfaces and calculated hourly increases in this plume as a function of the distance from the surfaces themselves, providing an estimate for the magnitude and range of transported increases.

3. Results

3.1. Shoreline Monitoring

We cast transects from the baseline through the shorelines at an interval of 100 m for the two areas of interest. We averaged the results of NSM and EPR of every pair of transects, with the results presented on Table 1. The NMS for Region 1 ranged from 295.7 to 314.0 m of distance, and the EPR ranged from 16.07 to 17.59 m per year in Region 1. Region 2 had a range for NSM of 146.1 to 172.2 m of distance, and an EPR of 8.35 to 10.13 m per year.
In Table 2, we present the results of NSM and EPR again for the two regions and nine segments, separated by the range of years 2002 to 2017, and 2017 to 2020. We separated these years to show the period when the Quantification Settlement Agreement (QSA) policy ended concerning input waters to the Salton Sea. The results show that the NSM and EPR differ between the two time periods with the post-QSA 3-year time-period having a greater EPR than the previous 15 years. The EPR for the post-QSA 2017 to 2020 period ranged for Region 1 from 34.94 to 43.44 m per year, while it ranged from 11.52 to 13.89 m per year for the 2002 to 2017 period.

3.2. Shoreline Forecasting

Figure 3 shows the 2030 and 2040 forecasts with uncertainties for the two regions studied. These forecasts are based on the previous shorelines and transects’ EPR from the years 2002 to 2020. Table 3 presents the forecast distances from the oldest shoreline (2002) to the 2031 and 2041 predictions. In Region 1, the forecast distance is an average of 150.73 m in 2031 from the current shoreline in 2020, and 332.06 m in 2041 from the current 2020 shoreline.

3.3. PM10 Forecasting

We used the additional land presented in Figure 3 to forecast the future PM10 emissions that could originate from this newly exposed land. As shown in Figure 4, the increased PM10 levels due to the additional shoreline exposure within the study area (represented in the model by changes to 2 km2 in the input dataset) were the highest in grid cells within 5 km of the modified shoreline (with average and maximum increases of 1.5 µg m−3 and 8.2 µg m−3, respectively). However, these increases remained potentially impactful at greater distances as well. For grid cells located 5–10 km away, the average and maximum increases were 0.68 µg m−3 and 2.4 µg m−3, while for distances of 10–40 km, these values were 0.4 µg m−3 and 1.5 µg m−3. Although these hourly increases are relatively small compared to the total concentrations measured and modeled during this particular dust storm (with daily average PM10 at nearby air quality monitoring stations exceeding 100 µg m−3), two important considerations must be noted. First, this case study examines the impacts of changes to only a small section of the shoreline. Increased exposure will occur to some extent across the entire Salton Sea shoreline, making these increases an extremely low-end estimate for total increases over time. Second, dust emitted from the newly exposed lakebed may have a unique composition, and therefore health impacts, compared to the predominant dust sources in and around the Salton Sea region. While the total dust suspended from these surfaces may represent a relatively small fraction of ambient PM10, it may be disproportionately impactful on human health due to chemical and biological contaminants from the Salton Sea [9] that are hypothesized as a source in new research that is investigating potential factors contributing to respiratory health impact in Salton Sea communities [19].

4. Discussion

Our community science imagery analysis showed that the north part of the Yacht Club had an increase in land from 2002 to 2020 with an average of almost 300 m, and a rate of change per year averaging almost 17 m. The south area of the Yacht Club saw an average increase in land of 161 m, and an average rate of change per year of 9.38 m. The difference between the two areas may be related to the different bathymetry of the lake as the southern Region 2 in this study has a steeper incline than the Region 2 area north of the Yacht Club.
We separated the analysis of the rate of change into two different periods with the period of 2002 to 2017 representing the period before and during the QSA and the 2017 to 2020 period representing the time after the QSA mitigation waters were discontinued. The observed rate of change is much greater during the period of 2017 to 2020 after the QSA, compared to the rate of change for the 2002 to 2017 time period. The north part of the Yacht Club had an average 38.44 m per year increase in land during the post-QSA 2017 to 2020 period, with 12.53 m per year for the 2002–2017 time (Table 2). Based on these observed changes, we can see that there was a substantial increase in the rate of change in the post-QSA years.
Our shoreline-change DSAS analysis shows an increase in the playa exposed of over 150 m in the north region of the Yacht Club in 2031 and 332 m in 2041. For the south part of the Yacht Club, the forecasts are 77.7 m for 2031 and 170 m for 2041. More study is needed to determine how our forecast compares to the Imperial Irrigation District (IID)’s hydrological model prediction of over 75 thousand acres by 2031 if no restoration measures are taken [20]. This reduction in the shoreline will be exacerbated by the IID’s August 2024 System Conservation Implementation Agreement (SCIA) [21] that will cut an estimated additional 700,000 acre feet from the inflows to the Salton Sea. Only one additional model is recently available to note that an additional 13,000 acres will be exposed over and above what would normally happen with the QSA.
Our findings align with recent research [22] that highlights the disproportionate impact of pollution on disadvantaged communities near the Salton Sea. Their study found that pollution levels began to rise around 2011, coinciding with the Imperial Irrigation District’s water transfer to San Diego, the increased lakebed exposure, and the subsequent dust pollution. Our research contributes to this understanding by similarly causally linking the modeled playa exposure to heightened PM10 air pollution in vulnerable communities near the shoreline. Our WRF-CHEM model can also serve as a source of variation to forecast the timing of exposed playa and resultant PM10 exposure in a local context specific to the North Shore community.
While more work is necessary to optimize atmospheric modeling in the region, the WRF-Chem results offer some indication of possible air quality consequences that could be expected from retreating shorelines in the region. The emissivity of the exposed playa, especially under bombardment from external dust sources during strong wind events, is one important source of uncertainty deserving additional attention. A full analysis of wind direction and strength under diverse synoptic conditions is also necessary to obtain a complete picture of the exposure risk magnitudes, spatial extent, and temporal patterns. However, this case study suggests that the magnitude and spatial range of ambient dust enhancement are both potentially significant for local communities, especially when extrapolated to the full expected migration of Salton Sea shorelines. The 2 km section of the Salton Sea included in this study represents a shoreline familiar to many community members, but is only a 0.0095 fraction of the entire Salton Sea shoreline. Future work could expand upon these methods to project the increases in PM10 dust across the full Salton Sea perimeter. This type of community science initiative could be continued as a new relevant method for communities to monitor the new unknown shoreline reduction that has begun with the August 2024 implementation of the SCIA.

5. Conclusions

We used a community science balloon mapping method to collect data regarding the shoreline reduction in the Salton Sea in a selected area around the Yacht Club, North Shore, CA. The community science method allowed us to build the capacity of local residents by including them as stakeholders in the scientific process. The results presented in this study demonstrate a pathway by which a community science program can actively monitor the ongoing change in a lake shoreline with outputs that can be used in advanced predictive models. The monitoring through the community science process allowed us to observe that the restricted inflows during the QSA period and the much lower inflows during the post-QSA period allowed the shoreline to recede a total of over 300 m in the northern Region 1 and over 160 m in the southern Region 2. These changes occurred from 2002 to 2020; however, from 2017 to 2020, the yearly rate of change in the northern Region 1 has more than tripled from that for the years 2002 to 2017. Similarly, the southern Region 2 studies almost quadrupled the yearly rate of change from 2017 to 2020 (27.15 and 7.13 m). Our future projections using the DSAS show that the 10- and 20-year shorelines will advance another 150 m and 332 m, respectively, for Region 1 (Table 3).
Our study acknowledges that the DSAS model, while valuable for shoreline forecasting, operates under certain assumptions that may not fully encompass the complexities of shoreline change. Specifically, the model assumes a linear regression through historical shoreline positions. This approach may not fully capture the influence of localized factors like wind patterns, wave action, and erosion, which can significantly impact shoreline dynamics. Additionally, while our analysis focused on a specific period (2002–2021) and a relatively small area near the North Shore Yacht Club, extrapolating these findings to other areas of the Salton Sea should be performed cautiously. The Salton Sea exhibits diverse shoreline characteristics and varying degrees of human impact, which could influence the rate and pattern of shoreline recession in different locations.
These observed and forecasted changes in the shoreline, and the additional WRF-Chem projections of PM10, present the need for continued monitoring of the Salton Sea shoreline in tandem with environmental health assessments and projections of dust impacts. Without mitigation, the continued recession of the Salton Sea shoreline and the resulting increase in PM10 concentrations pose significant risks to the health and well-being of nearby communities. This could manifest as increased respiratory illnesses, such as the increased asthma prevalence that the area is already experiencing [23] or more frequent school absences that will occur with increased respiratory issues [24]. State and federal agencies should consider current and potential health consequences when developing strategies to address the challenges facing the Salton Sea.

Author Contributions

Conceptualization, R.G.S. and S.D.H.; methodology, R.G.S. and S.A.W.; software, S.A.W. and W.C.P.; formal analysis, R.G.S., J.G. and W.C.P.; resources, S.D.H.; data curation, R.G.S. and W.C.P.; writing—original draft preparation, R.G.S.; writing—review and editing, R.G.S.; visualization, W.C.P.; project administration, R.G.S.; funding acquisition, S.D.H. All authors have read and agreed to the published version of the manuscript.

Funding

This research was funded by the California Endowment for the award titled: “School of Public Health—Improving Community Health” Award number 20181972.

Data Availability Statement

All orthophotos used to construct the models in this document are stored on local hard drives at Loma Linda University. Any requests for these raw files can be sent to [email protected]. We also used the generally available maps and data from the paper cited here [10].

Acknowledgments

The authors acknowledge the project and structure that the Alianza Coachella Valley provided in completing this study. Other community partners included Olivia Rodriquez and Patricia Leal who were key in logistical support while conducting the community science project. We also acknowledge the Konkuey Design Initiative and Lauren Elachi for partner conceptualization of the project. We acknowledge Isabella Arzeno-Soltero of the University of California Los Angeles for review and interest. This work contributes to the Salton Sea Environmental Time Series Community Science program housed within Alianza Coachella Valley. This research was conducted as part of the ongoing work at the Loma Linda University Environmental Microbiology Research Laboratory.

Conflicts of Interest

The authors declare no conflicts of interest. The funders had no role in the design of the study; in the collection, analyses, or interpretation of data; in the writing of the manuscript; or in the decision to publish the results.

References

  1. Tompson, A.F.B. Born from a Flood: The Salton Sea and Its Story of Survival. J. Earth Sci. 2016, 27, 89–97. [Google Scholar] [CrossRef]
  2. Wilke, P.J. Late Prehistoric Human Ecology at Lake Cahuilla Coachella Valley, California; University of California Archaeological Research Facility: Berkeley, CA, USA, 1978. [Google Scholar]
  3. Waters, M.R. Late Holocene Lacustrine Chronology and Archaeology of Ancient Lake Cahuilla, California. Quat. Res. 1983, 19, 373–387. [Google Scholar] [CrossRef]
  4. King, J.; Etyemezian, V.; Sweeney, M.; Buck, B.J.; Nikolich, G. Dust Emission Variability at the Salton Sea, California, USA. Aeolian Res. 2011, 3, 67–79. [Google Scholar] [CrossRef]
  5. Voyles, T.B. The Settler Sea: California’s Salton Sea and the Consequences of Colonialism; University of Nebraska Press: Lincoln, NE, USA, 2021; ISBN 978-1-4962-1673-1. [Google Scholar]
  6. Schwabe, K. The Salton Sea: An Introduction to an Evolving System and the Role of Science. Calif. Agric. 2022, 76, 4–7. [Google Scholar] [CrossRef]
  7. Lee, M.-C.; Stenstrom, M.K. Water Quality Mitigation Strategy Analysis of the Salton Sea, California, Using the Delft-3D modeling suite. Front. Sustain. Resour. Manag. 2023, 2, 1178038. [Google Scholar] [CrossRef]
  8. Lan, J.; Liu, P.; Hu, X.; Zhu, S. Harmful Algal Blooms in Eutrophic Marine Environments: Causes, Monitoring, and Treatment. Water 2024, 16, 2525. [Google Scholar] [CrossRef]
  9. Frie, A.L.; Dingle, J.H.; Ying, S.C.; Bahreini, R. The Effect of a Receding Saline Lake (The Salton Sea) on Airborne Particulate Matter Composition. Environ. Sci. Technol. 2017, 51, 8283–8292. [Google Scholar] [CrossRef] [PubMed]
  10. Parajuli, S.P.; Zender, C.S. Projected Changes in Dust Emissions and Regional Air Quality due to the Shrinking Salton Sea. Aeolian Res. 2018, 33, 82–92. [Google Scholar] [CrossRef]
  11. Centeno, D.; Arzeno-Soltero, I.; Delgado, A.; Freilich, M.; Marquez, C.; Montgomery, Q.; Palomino, A.; Penalber, G.; Sinclair, R.; Taboada, J. Salton Sea Environmental Work and the Importance of Community Science. Oceanography 2023, 36, 136–137. [Google Scholar] [CrossRef]
  12. Balloon Mapping: How to Make Your Low-Flying Satellite. Available online: https://geojournalism.org/2013/08/balloon-mapping-how-to-make-your-own-low-flying-satellite/ (accessed on 4 October 2020).
  13. Google Earth. (n.d.). Google Earth Pro Satellite Imagery Maps from 2002–2018 for the North Shore Yacht Club, Thermal, Riverside County, California, USA 33°31′06″ N 115°56′20″ W. Available online: https://earth.google.com/web/@33.51850527,-115.93987189 (accessed on 27 August 2021).
  14. OpenDroneMap. (n.d.). OpenDroneMap 3.0.5 Documentation and Getting Started. Available online: https://docs.opendronemap.org/installation/#quickstart (accessed on 27 August 2021).
  15. Crowell, B.W.; Bock, Y.; Sandwell, D.T.; Fialko, Y. Geodetic Investigation into the Deformation of the Salton Trough. J. Geophys. Res. Solid Earth 2013, 118, 5030–5039. [Google Scholar] [CrossRef]
  16. Genz, A.S.; Fletcher, C.H.; Dunn, R.A.; Frazer, L.N.; Rooney, J.J. The Predictive Accuracy of Shoreline Change Rate Methods and Alongshore Beach Variation on Maui, Hawaii. J. Coast. Res. 2007, 2007, 87–105. [Google Scholar] [CrossRef]
  17. Himmelstoss, E.A.; Henderson, R.E.; Kratzmann, M.G.; Farris, A.S. Digital Shoreline Analysis System (DSAS) Version 5.0 User Guide; U.S. Geological Survey: Reston, VA, USA, 2018.
  18. Parajuli, S.P.; Zender, C.S. Connecting Geomorphology to Dust Emission through High-Resolution Mapping of Global Land Cover and Sediment Supply. Aeolian Res. 2017, 27, 47–65. [Google Scholar] [CrossRef]
  19. Biddle, T.A.; Yisrael, K.; Drover, R.; Li, Q.; Maltz, M.R.; Topacio, T.M.; Yu, J.; Del Castillo, D.; Gonzales, D.; Freund, H.L.; et al. Aerosolized Aqueous Dust Extracts Collected near a Drying Lake Trigger Acute Neutrophilic Pulmonary Inflammation Reminiscent of Microbial Innate Immune Ligands. Sci. Total Environ. 2023, 858, 159882. [Google Scholar] [CrossRef] [PubMed]
  20. CH2MHILL. Salton Sea Hydrological Modeling and Results; CH2MHILL: San Diego, CA, USA, 2018. [Google Scholar]
  21. Imperial Irrigation District. News & Resources, IID Acts to Protect Colorado River, Salton Sea with New Conservation Agreement. Available online: https://www.iid.com/Home/Components/News/News/1207/30 (accessed on 20 August 2024).
  22. Abman, R.; Edwards, E.C.; Hernandez-Cortes, D. Water, Dust, and Environmental Justice: The Case of Agricultural Water Diversions. Am. J. Agric. Econ. 2024, 1–18. [Google Scholar] [CrossRef]
  23. Farzan, S.F.; Razafy, M.; Eckel, S.P.; Olmedo, L.; Bejarano, E.; Johnston, J.E. Assessment of Respiratory Health Symptoms and Asthma in Children near a Drying Saline Lake. Int. J. Environ. Res. Public Health 2019, 16, 3828. [Google Scholar] [CrossRef] [PubMed]
  24. Mendoza, D.L.; Pirozzi, C.S.; Crosman, E.T.; Liou, T.G.; Zhang, Y.; Cleeves, J.J.; Bannister, S.C.; Anderegg, W.R.L.; Robert, P.I. Impact of Low-Level Fine Particulate Matter and Ozone Exposure on Absences in K-12 Students and Economic Consequences. Environ. Res. Lett. 2020, 15, 114052. [Google Scholar] [CrossRef]
Figure 1. Map of the North Shore area of the Salton Sea, CA, with coastline segments (transects) used during this study in two different regions (North and South Yacht Club).
Geographies 04 00034 g001
Figure 2. A balloon mapping rig flying above the North Shore of the Salton Sea shown with a picavet holding a GoPro7 and suspended by three mylar sleeping bag balloons.
Geographies 04 00034 g002
Figure 3. An output from DSAS analysis in ArcGIS showing an area in North Shore Salton Sea with historical shoreline positions, which enabled the calculation shoreline change statistics. The final data used for the DSAS were in 2021, with the 2020 line shown here for reference in the image. The DSAS was used to show future shoreline positions with uncertainty bands for the 2031 and 2041 forecasts.
Geographies 04 00034 g003
Figure 4. Boxplots of the projected increase in PM10 concentrations in 2041 from a WRF-Chem model that uses the increase in land area of a 2-square-kilometer area as calculated from the DSAS model.
Geographies 04 00034 g004
Table 1. The net shoreline movement (NSM *) values and the end point rate (EPR **) in shoreline changes within the nine-study shoreline segments during the 2002 to 2019 period.
RegionsShoreline SegmentNet Shoreline Movement (m)Average NSMEnd Point Rates (m/year)Average EPR
Region 1I−313.98297.46−17.5916.66
II−286.89−16.07
III−295.73−16.57
IV−299.60−16.78
V−291.10−16.30
Region 2VI−146.12161.26−8.359.38
VII−161.33−9.22
VIII−172.17−9.83
IX−165.44−10.13
* The NSM is the distance (in meters) between the oldest and the youngest shorelines for each transect. ** The EPR is calculated by dividing the distance of shoreline movement (meters per year) by the time elapsed between the oldest and the most recent shoreline.
Table 2. The net shoreline movement values (in meters) and the end point rates (in meters per year) in shoreline changes within the nine-study shoreline segments during the 2002 to 2017 and 2017 to 2019 period.
Shoreline SegmentNet Shoreline Movement (m)
2002–2017
End Point Rates (m/year)
2002–2017
Net Shoreline Movement (m)
2017–2020
End Point Rates (m/year)
2017–2020
I−209.55−13.89−97.63−35.28
II−188.70−12.51−96.67−34.94
III−190.83−12.65−107.36−38.80
IV−182.62−12.10−109.98−39.74
V−173.85−11.52−120.21−43.44
VI−79.83−5.29−63.91−25.55
VII−98.83−6.55−69.88−27.94
VIII−120.66−8.00−68.28−27.30
IX−131.15−8.69−59.53−23.80
Table 3. Forecast for the years 2031 and 2041 in the two regions of study, with the average distance in meters from the first shoreline (2002) and the current shoreline (2020).
RegionsForecast YearAverage Distance in Meters from 2002 ShorelineAverage Distance in Meters from 2020 Shoreline
Region 12031447.6150.7
2041628.9332.1
Region 22031237.977.7
2041330.1169.9
Disclaimer/Publisher’s Note: The statements, opinions and data contained in all publications are solely those of the individual author(s) and contributor(s) and not of MDPI and/or the editor(s). MDPI and/or the editor(s) disclaim responsibility for any injury to people or property resulting from any ideas, methods, instructions or products referred to in the content.

