Article

Combining Geographic Information Systems and Hydraulic Modeling to Analyze the Hydraulic Response of an Urban Area Under Different Conditions: A Case Study to Assist Engineering Practice

by
Panagiota Galiatsatou
1,*,
Panagiota Stournara
1,
Ioannis Kavouras
1,
Michail Raouzaios
2,
Christos Anastasiadis
3,
Filippos Iosifidis
3,
Dimitrios Spyrou
1 and
Alexandros Mentes
1
1
Executive Division of Strategic Planning, Hydraulic Works & Development, Thessaloniki Water Supply and Sewerage Company S.A. (EYATH S.A.), 54622 Thessaloniki, Greece
2
Drinking Water and Sewerage Engineer, 67000 Strasbourg, France
3
Hydromanagement Consulting Ltd., 54624 Thessaloniki, Greece
*
Author to whom correspondence should be addressed.
Geographies 2025, 5(2), 17; https://doi.org/10.3390/geographies5020017
Submission received: 28 January 2025 / Revised: 15 March 2025 / Accepted: 26 March 2025 / Published: 2 April 2025

Abstract

:
Detailed hydraulic modeling of a water distribution network (WDN) in an urban area is implemented therein, based on data from geoinformatic tools (GIS), to investigate and analyze the network’s hydraulic response to different scenarios of operation. A detailed mapping of the water meters of the consumers in the urban district is therefore conducted in the frame of a District Metered Area (DMA) zoning. Different consumptions according to water meters and patterns of daily water demand, resulting from both theoretical and measured data from a limited number of smart meters, are used in the hydraulic simulations. The analysis conducted assists common engineering practice to identify critical locations for constructing new hydraulic infrastructure, resulting in the restructuring and reorganization of the DMA, assisting to face existing and common problems of WDNs within the general framework of DMA design and efficient water management. A case study on the WDN of Efkarpia, located in the city of Thessaloniki, Greece, satisfying the principal design criteria of DMAs, is presented in this work, under both normal and emergency conditions. Hydraulic analysis is performed based on different scenarios, mainly consisting of different consumptions according to water meters and different demand patterns, all resulting in high pressures in the southern part of the DMA. Hydraulic simulations are then performed considering two basic operating scenarios, namely the operation of the old DMA of Efkarpia and a new DMA, which is reduced in size. The two scenarios are compared in terms of estimated pressures in the studied area, as well as in terms of energy consumption in the upstream pumping station. The comparisons reveal that the new DMA outperforms the old one, with a large increase in the pressure at nodes where low pressures were assessed in the old DMA, a reduction in daily pressure variation up to 45%, and quite significant energy savings assessed around 21.6%.

1. Introduction

The principal aim of urban water management is to provide a safe and reliable water supply to consumers while maintaining, at the same time, the sustainability of this water supply. Water distribution networks (WDNs) should therefore be built and properly maintained to provide consumers with water of adequate quantity and quality that meets the defined standards. Considering that WDNs worldwide are aging and deteriorating, the main problems appearing in managing them include water losses, reduction in the structural integrity of the network (the network’s ability to resist high internal and external pressures), decreases in their available water capacity, and the water quality degradation caused by water moving through the water supply system [1]. The above, combined with increasing demands in these systems, which also increase stresses on natural water resources, necessitate efficient management of available water reserves and related infrastructure. The division of the WDN into sealed, or hydraulically isolated, subzones (District Metered Areas—DMAs) can significantly assist effective and sustainable water resource management.
A DMA is a discrete area of a water distribution system, usually created by the closure of valves or the complete disconnection of pipe work in which the quantities of water entering and leaving the area are metered [2]. A DMA is normally supplied through a single metered line, therefore allowing for the total inflow to be measured [3,4]. Kanakoudis and Tsitsifli [1], Thornton et al. [3], and Gomes et al. [5], among others, present the basic design criteria of DMAs. Recognizing their critical role in improving water network efficiency, different techniques have been developed in the literature to design DMAs, combining statistical tools with hydraulic simulators or optimization and decision-making tools [6,7,8,9,10]. Kowalska et al. [11] presented the division of a selected water supply network into DMAs using the DMA-Tool available in the Bentley WaterGEMs software, combined with hydraulic simulation to evaluate the DMA division performance.
Hydraulic simulation models of WDNs are mathematical approximations of real-world systems, able to predict the behavior of actual water networks, and have been increasingly applied by water utilities and researchers for planning, designing, and managing, and detecting leakages in WDNs [8,12,13,14,15,16,17,18,19,20,21,22,23,24]. Galiatsatou et al. [17] combined hydraulic modeling using Bentley WaterGEMs v.23 software and minimum night flow analysis to assess and reduce leakages in a WDN of a small settlement in Greece. Mentes et al. [18] used WaterGEMs to develop a hydraulic simulation model for Thessaloniki’s aqueducts to model the present operating state of the network, as well as its response to emergency conditions resulting from a failure occurring in one of the two aqueducts of the city. Mekonnen [19] used WaterGEMs to evaluate the hydraulic performance and physicochemical water quality parameters of the WDN in Dangila town, Ethiopia. Combining hydraulic modeling and Geographic Information System (GIS) tools can significantly assist the sustainable operation and management of WDNs. Kuma and Abate [20] used a WaterGEMs hydraulic model integrated with a GIS to understand the hydraulic performance of a WDN, achieving higher accuracy in estimating the hydraulic parameters of the system. Obura et al. [21] coupled GIS and hydraulic modeling to sustainably manage a WDN based on the pressure-dependent demand algorithm (PDA), supporting the achievement of several targets of Sustainable Development Goal (SDG) 6 of the United Nations Agenda 2030. Dongare et al. [22] combined GIS, remote sensing, and hydraulic modeling to analyze and design water distribution systems, emphasizing the necessity of using new technologies to solve problems and improve the efficiency of the systems. GIS tools can significantly contribute to the accurate geospatial allocation of end-user nodal demands and field measurements while setting hydraulic models of WDNs, critically contributing to the increased reliability of hydraulic simulations for real-time decision support [23,24,25,26].
The main objective of this research is to develop a detailed hydraulic model for a hydraulically isolated area of the water supply system of Thessaloniki, Greece, in the absence of real-time hydraulic measurements and water demand data. This will enable us to assess the hydraulic behavior of existing infrastructure under different operating scenarios of consumers’ water demand and DMA size and organization, and to understand the main hydraulic characteristics of the system, as well as its response to both normal and emergency conditions. On this basis, this study combines GIS tools and hydraulic modeling, attempting to assist common engineering practice by identifying critical locations to construct new hydraulic infrastructure, confronting common problems of WDNs, and improving their energy efficiency, as well as managing available water reserves.

2. Materials and Methods

2.1. Study Area

The water demand needs in the city of Thessaloniki, located in northern Greece, are covered by three resources: (i) surface water from the Aliakmonas river, (ii) source water from the Aravissos springs, and (iii) groundwater from water supply boreholes in the plain of Thessaloniki. The above water resources provide potable water to the conurbation of Thessaloniki via the central aqueducts of Aliakmonas, conveying water from the Aliakmonas river to the Thessaloniki Water Treatment Plant (TWTP) and from there to several high- to medium-elevation tanks, and transporting water from the Aravissos springs and water supply boreholes to a central pumping station in the southwest of the city and from there to moderate- and low-elevation tanks. Therefore, the head tanks of the conurbation are supplied by water either from a single aqueduct (Aliakmonas or Aravissos) or from both aqueducts. Figure 1 presents a map of the study region with a representation of the different tank zones in the conurbation of Thessaloniki, highlighting the location of the DMA of Efkarpia. The figure shows the location of the TWTP, water tanks (light blue cylinders), and pumping stations (green rectangles) in the conurbation. EYATH S.A. is the second biggest water supply and sewerage company in Greece, managing the entire water supply system of the city of Thessaloniki. A detailed description of the water supply system of Thessaloniki’s aqueducts is included in the study by Mentes et al. [18].
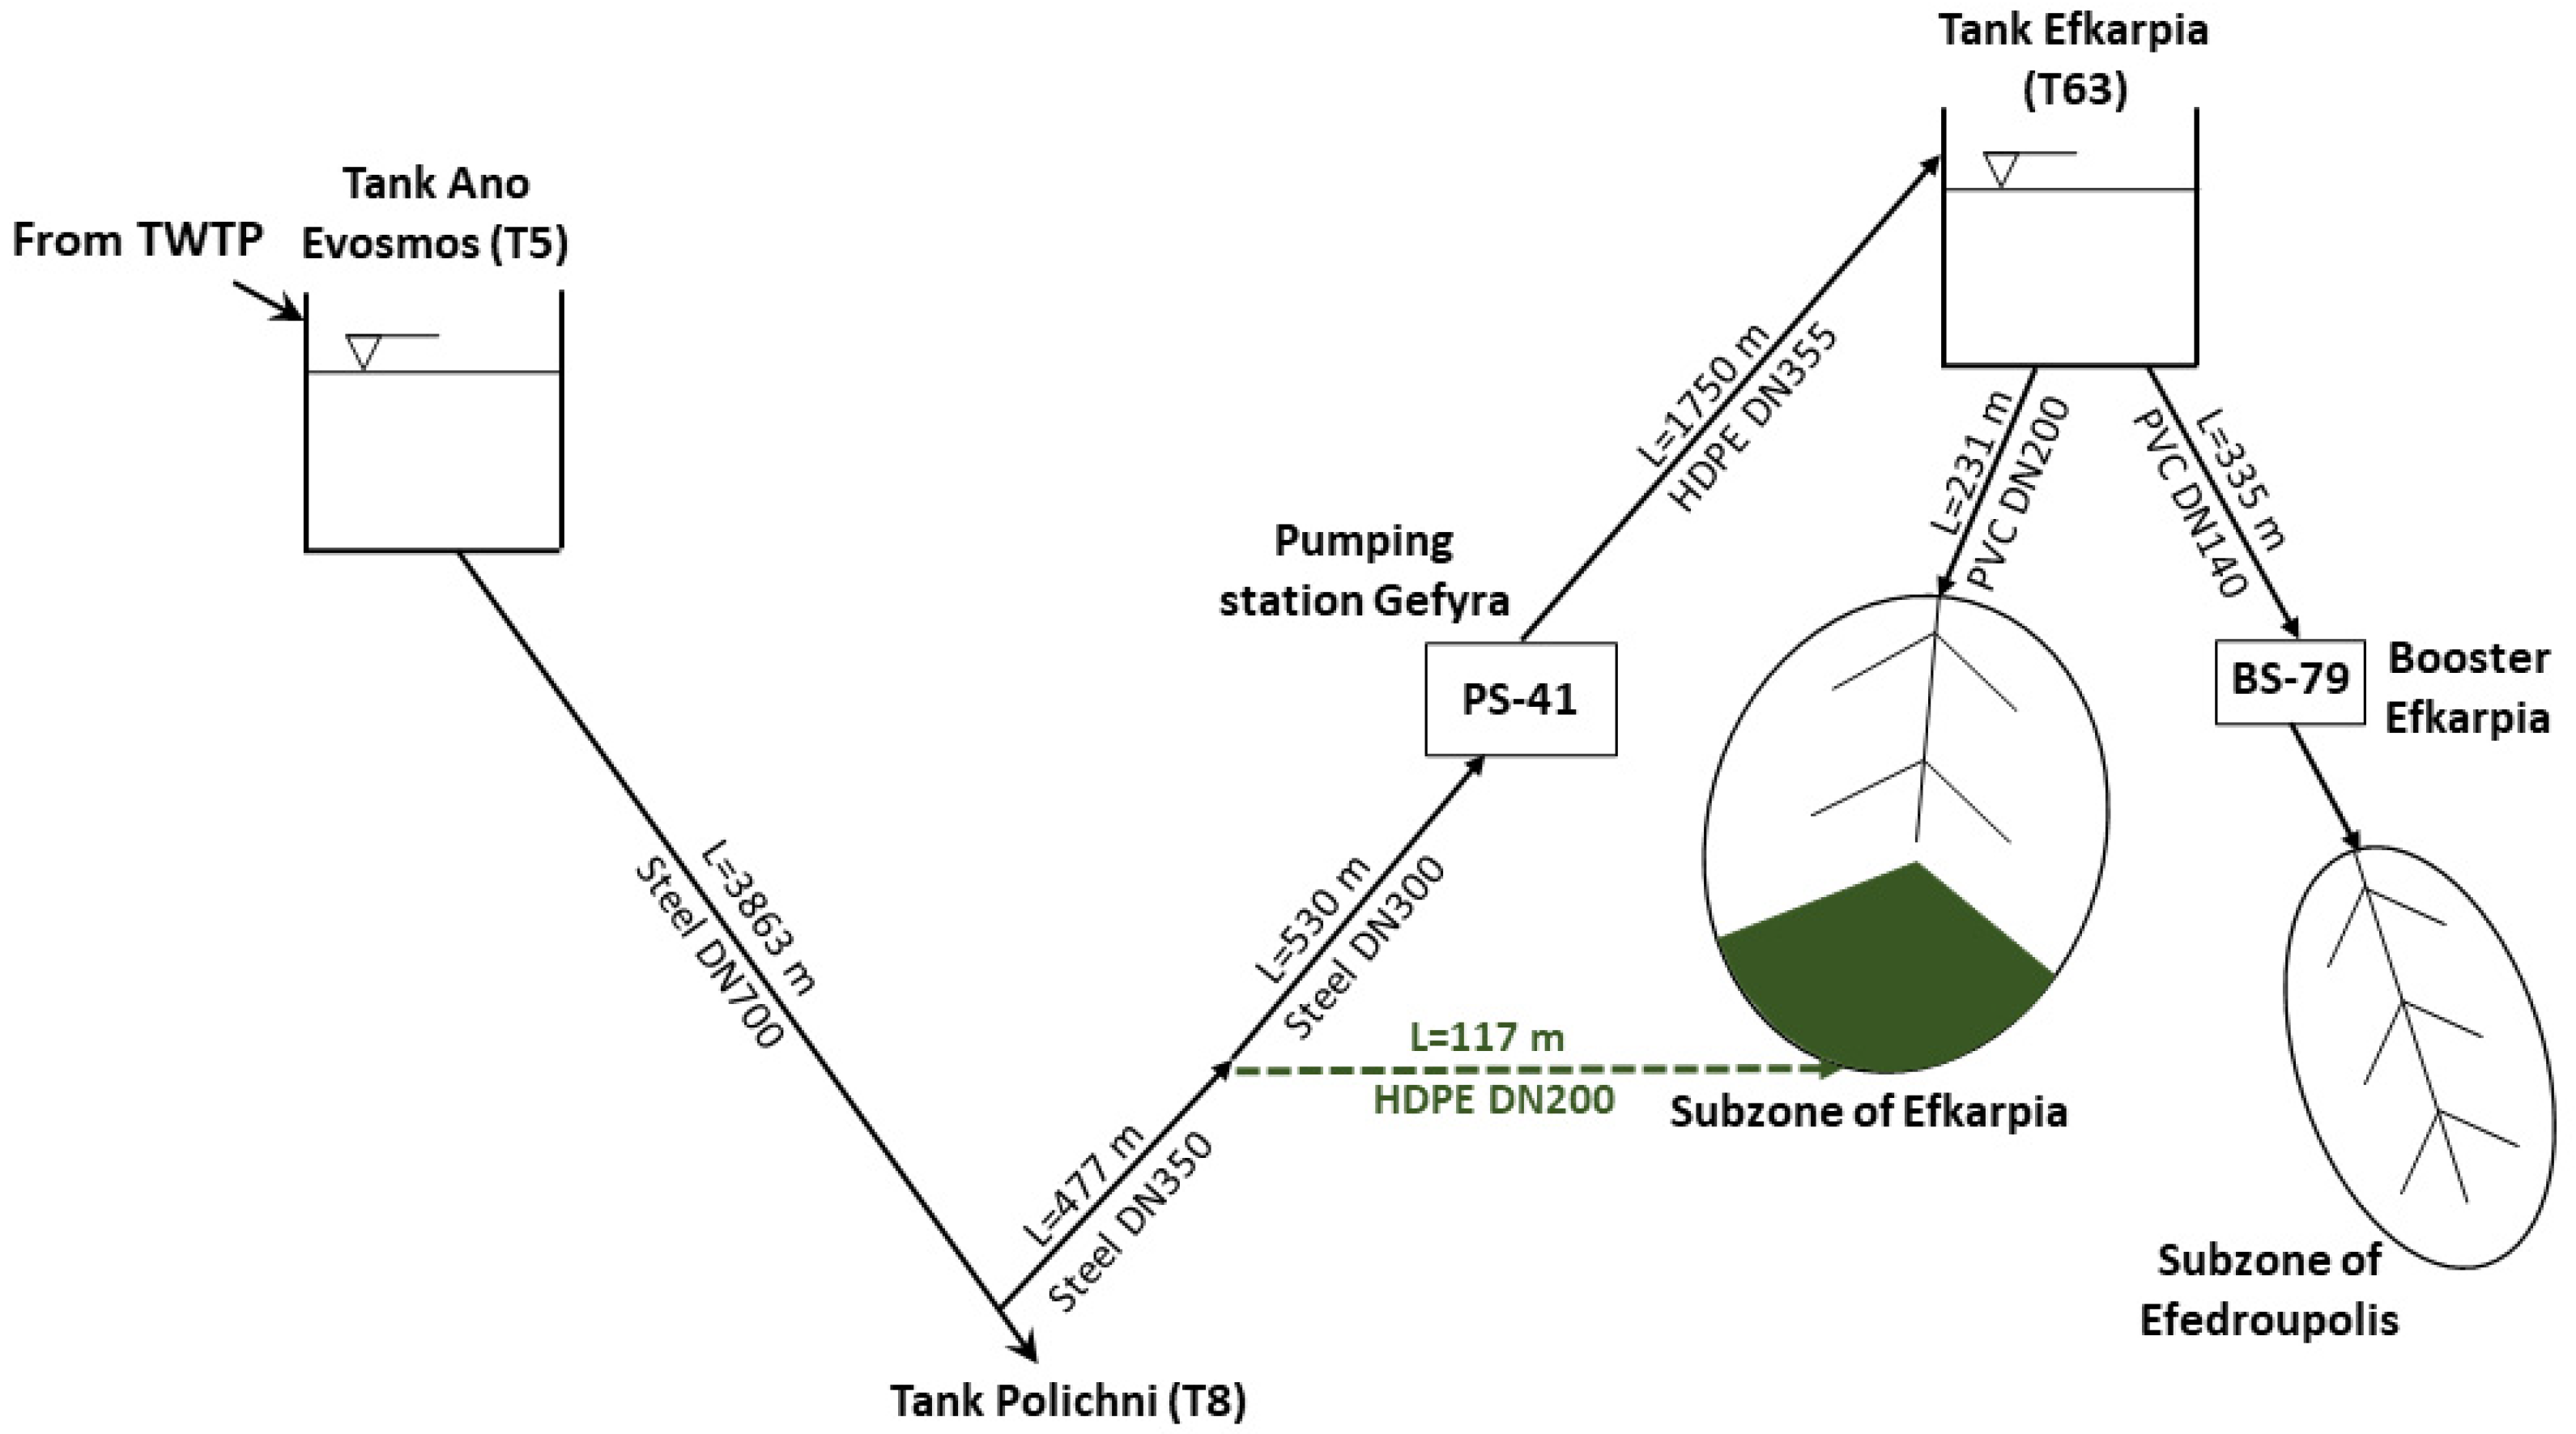
The DMA of Efkarpia is located in western Thessaloniki, and it is demarcated by the head tank of Efkarpia (T63). Water needs in the DMA are covered solely by the Aliakmonas aqueduct. More specifically, water from the TWTP is transported to the central pumping station of Ionia and from there to a number of tanks located in the moderate- to high-altitude areas of the city, including the tank of Ano Evosmos (T5). Water from T5 is then pumped to T63, through the pumping station of Gefyra (PS41), by means of a DN355 HDPE eduction pipe about 1750 m in length, covering a drop of about 80 m. The DMA of Efkarpia consists of two subzones: the subzone of Efkarpia and that of Efedroupolis. The subzone of Efkarpia is supplied by a DN200 PVC pipe about 231 m in length, while the subzone of Efedroupolis is supplied by a DN140 PVC pipe about 335 m in length through the booster of Efkarpia (BS79). Different hydraulic (i.e., high leakages and pipe breaks) and management issues observed in the low-elevation area of the Efkarpia subzone led to the construction of new pipes in the study area, creating a new DMA in the Efkarpia district. The new pipes ensure that the lower-elevation area of the Efkarpia subzone will be directly supplied from T5 through a DN200 HDPE pipe of about 117 m. At the end of 2022, the new DMA of Efkarpia became fully operational and replaced the old DMA. The new DMA of Efkarpia will be justified and substantiated in this work, assisting common engineering practice in solving common hydraulic problems and improving management issues. Figure 2 presents the main elements of the described hydraulic system supplying the DMA of Efkarpia. The green elements in Figure 2 represent the transition from the old to the new DMA of Efkarpia.
The hydraulic operation of the water distribution system of the DMA of Efkarpia is determined by the water elevation at the head tank of Efkarpia—T63 (ground elevation 147.6 m), ranging within the interval [148.8, 151.4] m. The tank T63 is characterized by a rectangular cross-section with an active volume of approximately 450 m3. The WDN of the Efkarpia district consists mainly of PVC pipes with diameters ranging from DN63 to DN200, with a majority of DN90 and DN110 pipes. The head tank T63 is supplied by the pumping station of Gefyra (PS41), with a ground elevation of about 70 m. The pumping station PS41 consists of two identical pumps operating in parallel, with one pump operating on a daily basis during normal conditions. Each pump has a flow Qnom = 123.0 m3/h and a manometric head Hm = 120.0 m. As presented in Figure 2, the hydraulic system of Efkarpia DMA, bounded by the head tank T63, includes the subzones of Efkarpia and Efedroupolis. The booster BS79, which pumps water to the subzone of Efedroupolis, has a maximum efficiency at a flow Q = 17.1 m3/h and a manometric head Hm = 57.1 m. Figure 3 presents the old and new DMAs of the Efkarpia district. The basic hydraulic infrastructure (tank, pumping station, booster, main pipes, and water connection points) is also included.
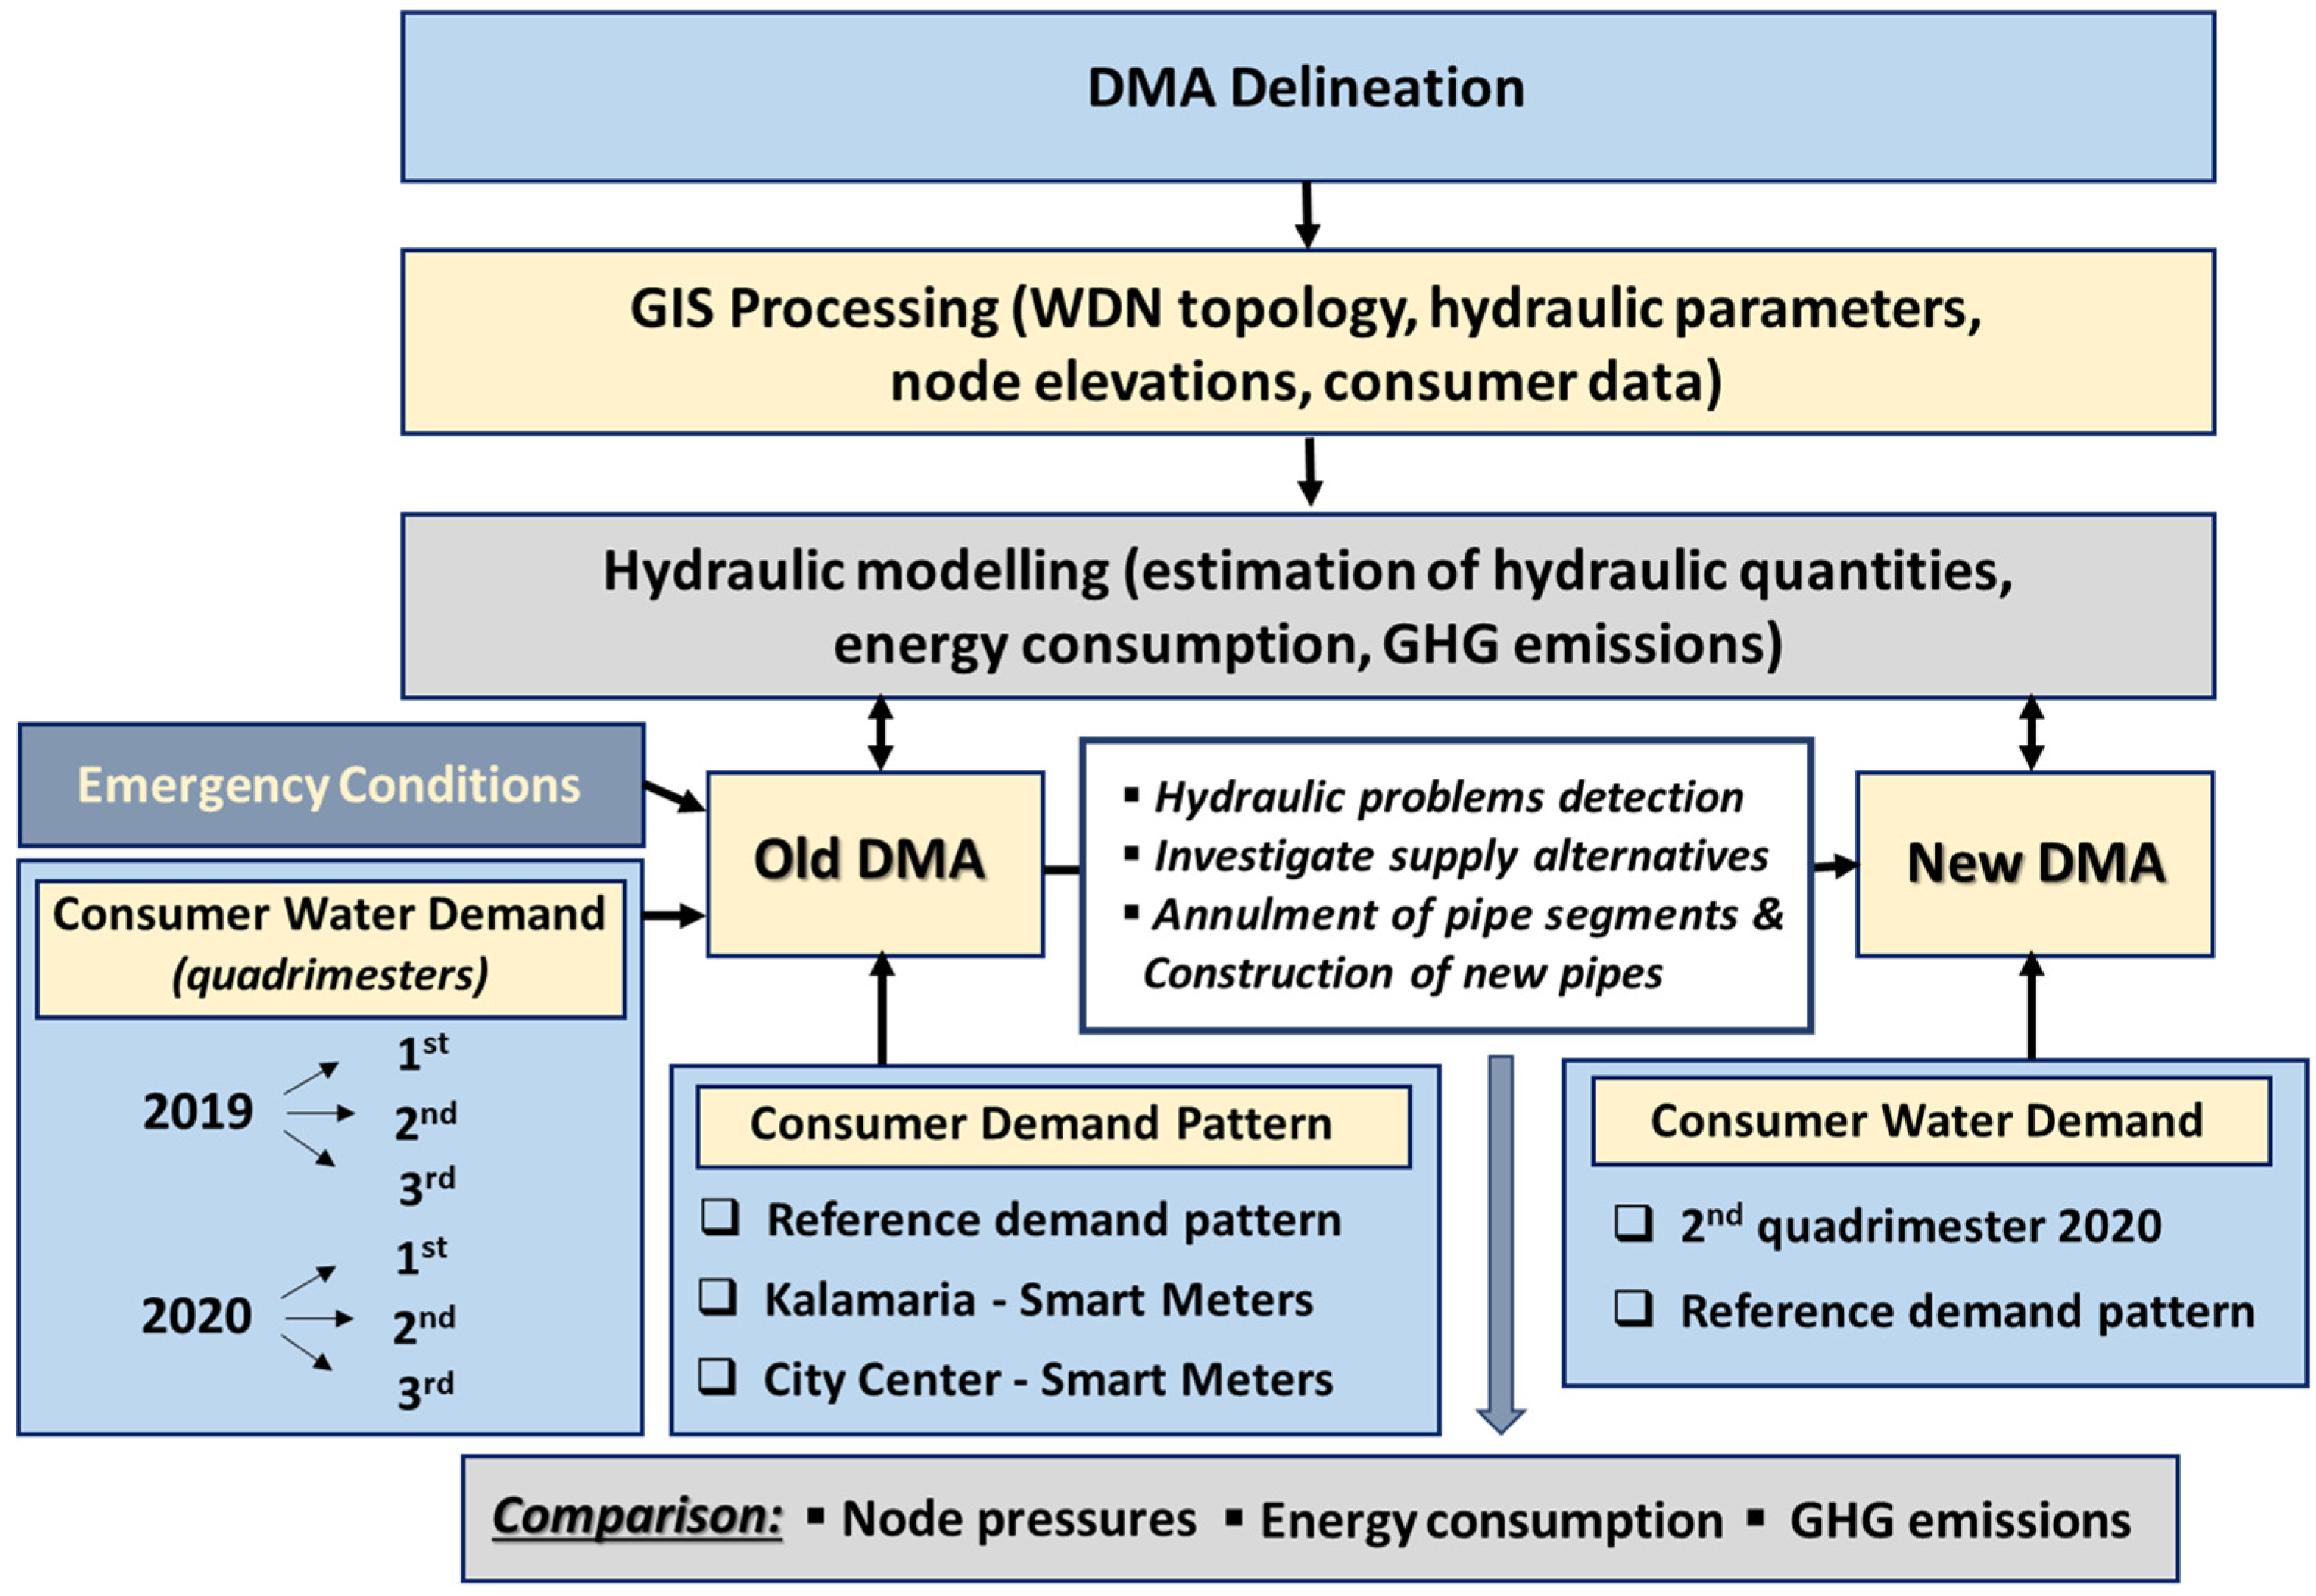
The present work focuses on a detailed description of the hydraulic system of the Efkarpia district in Thessaloniki, Greece, which satisfies the principal design criteria of DMAs. At this point, there exist no real-time measurements of the hydraulic parameters in the WDN of Efkarpia. The topology of the DMA’s WDN is first set using modern GIS tools. Information on end-users’ water volume consumption corresponding to quadrimester periods was acquired from existing databases of Thessaloniki’s Water Supply and Sewerage Company (EYATH) S.A. Water consumption data were also georeferenced to assess the hydraulic loading of the WDN. The hydraulic boundary conditions of the DMA were acquired from an existing hydraulic model of Thessaloniki’s aqueducts [18]. The hydraulic model of the DMA was created in OpenFlows WaterGEMs by Bentley [27], which is built upon the hydraulic engine of EPANET v.2.2. software, providing a user-friendly environment to analyze, design, and optimize water distribution systems. The hydraulic model was calibrated based on the total flow rates entering the zone and pressure measurements at selected nodes. Hydraulic simulations of the calibrated WDN were performed, investigating and analyzing different scenarios of the system’s operation, mainly consisting of different consumptions found at the water meters of the DMA and different demand patterns. The hydraulic response of the DMA under emergency conditions was also examined. Hydraulic modeling was also performed considering two basic operating scenarios, namely the operation of the old DMA of Efkarpia and of the new DMA, resulting from newly constructed pipes in the area. The two basic scenarios were compared in terms of estimated pressures in the study area, as well as in terms of energy consumption in the upstream pumping station. Figure 4 presents a schematic diagram of the methodology followed in this work.

2.2. GIS Processing

The Geographic Information System (GIS) is a powerful information network technology for displaying, analyzing, and managing spatial data. GIS tools can be used for mapping the network topology, geometry, and critical infrastructure of WDNs, as well as with both hydraulic simulation and optimization models, enabling the organization and management of input data to the models, and the visualization of results in a concise and user-friendly environment.
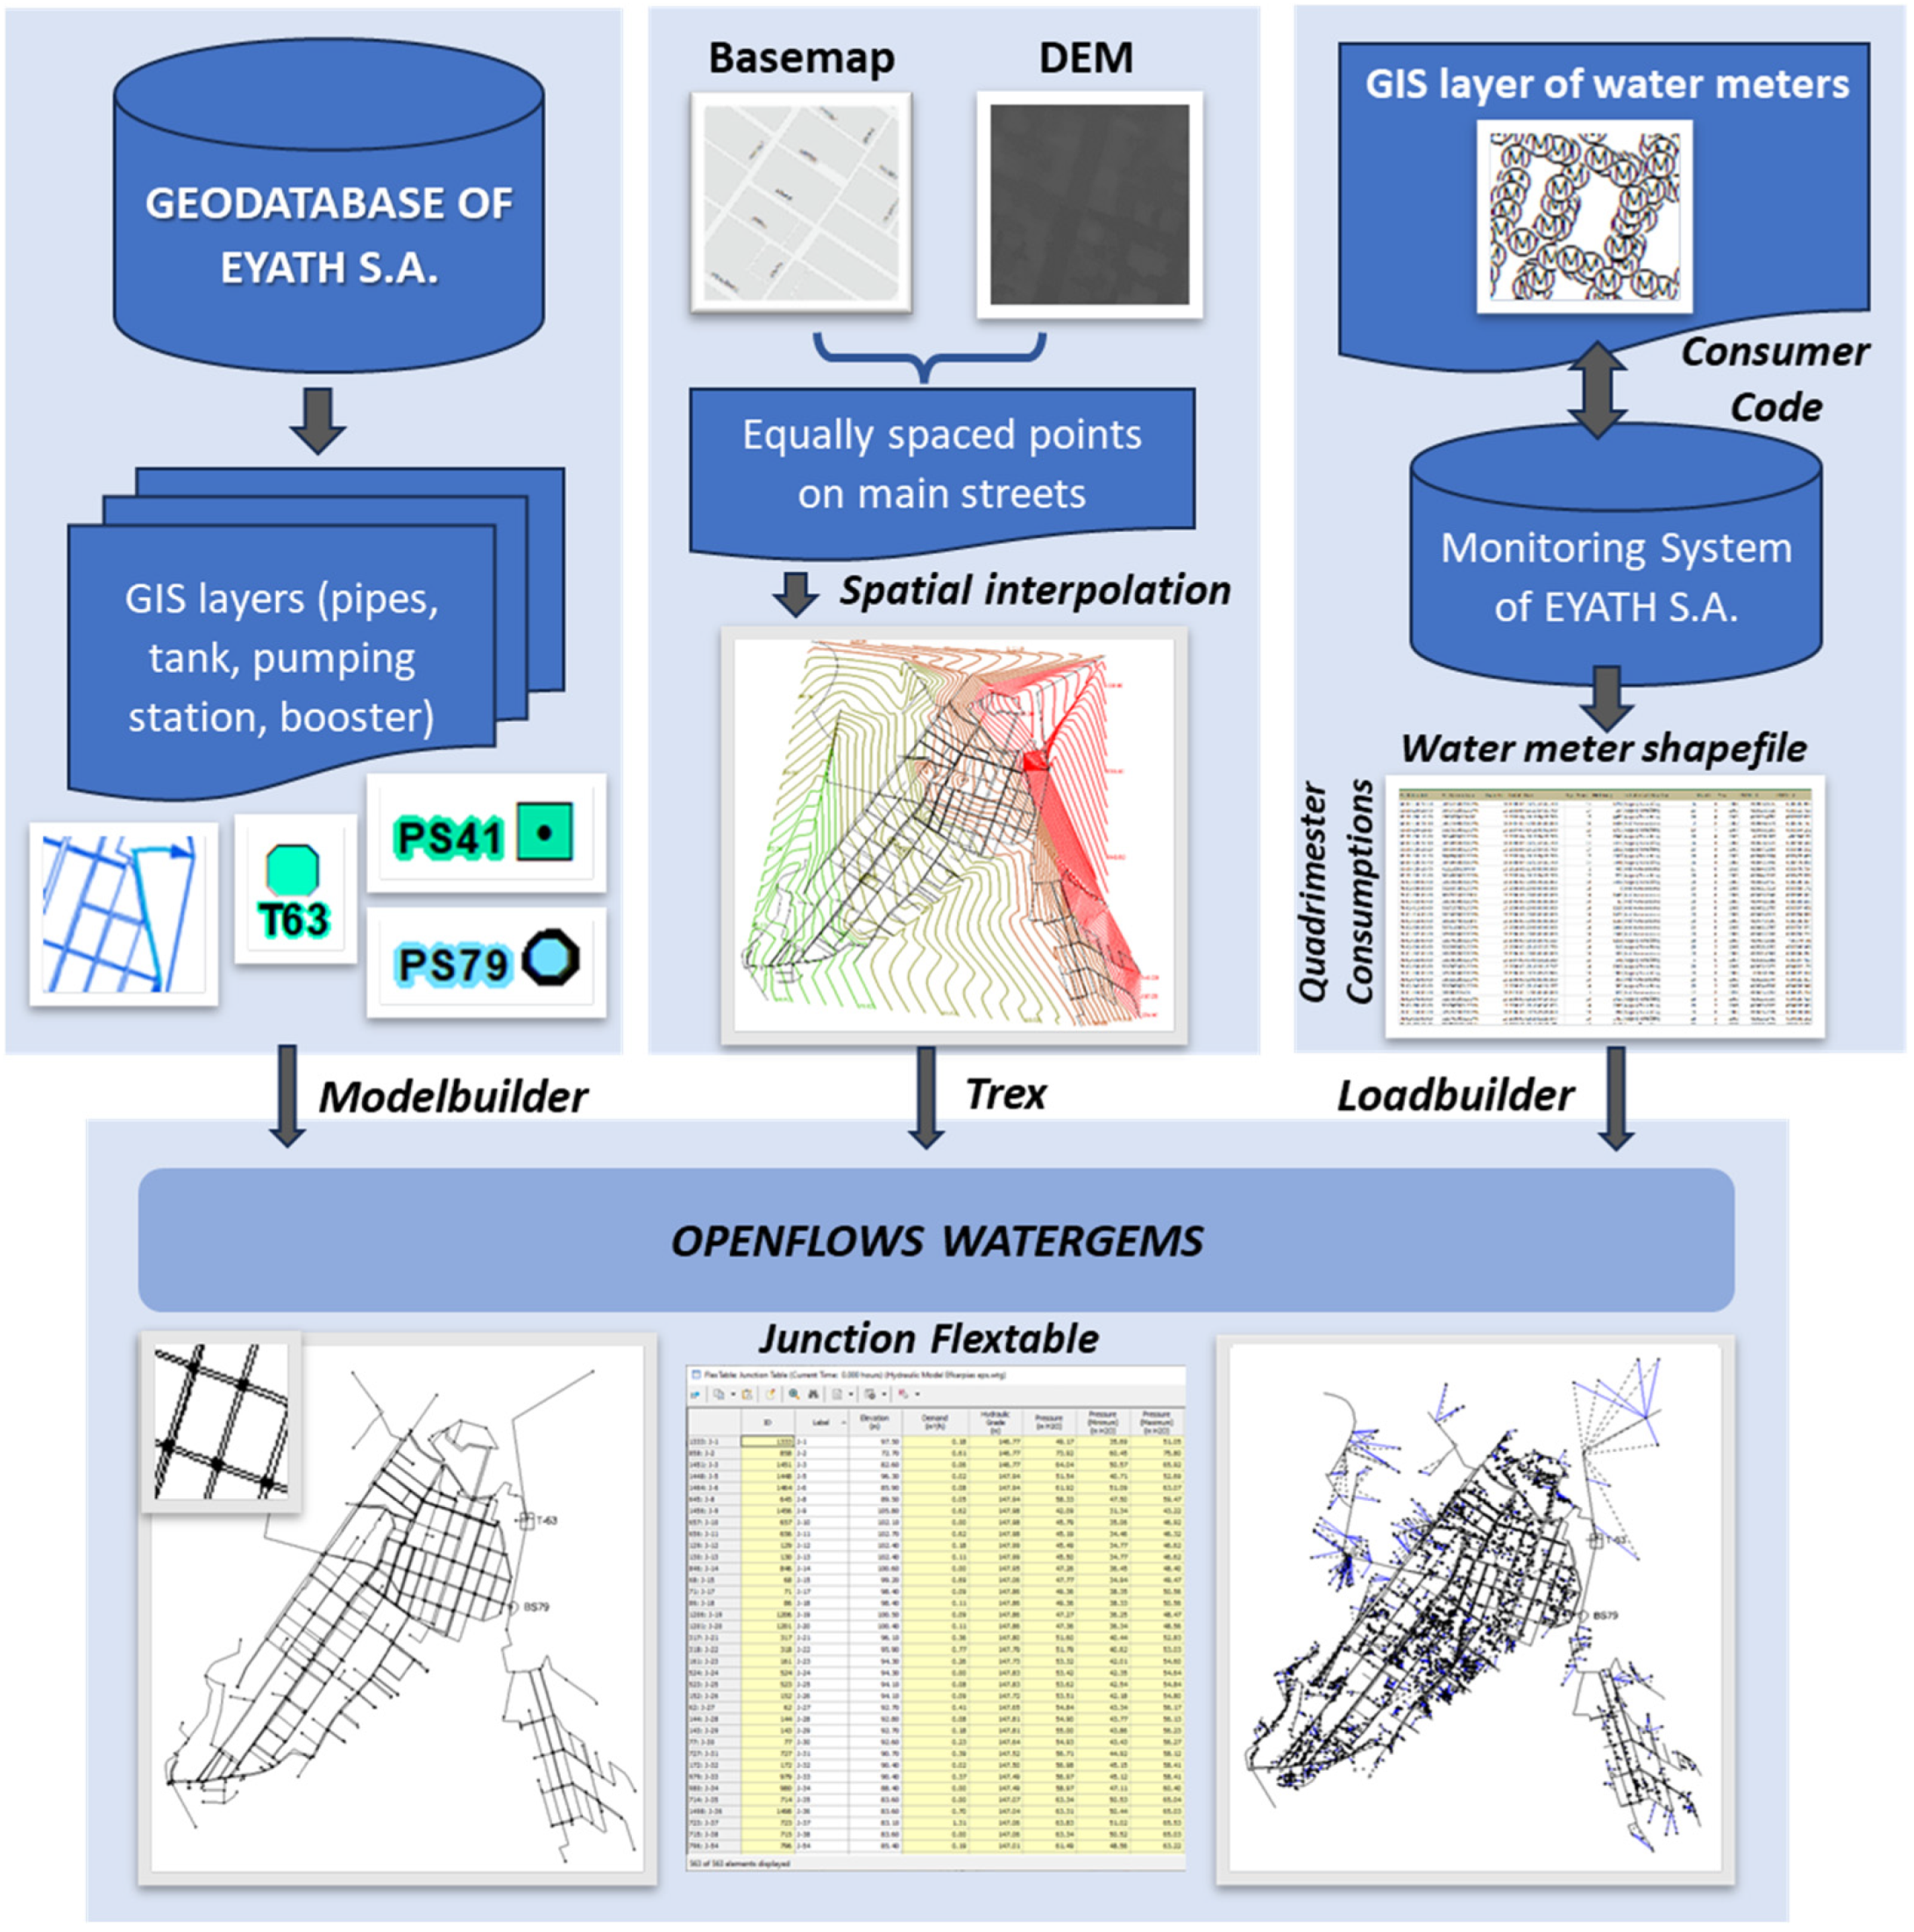
Τhematic GIS layers of (i) network pipes (pressure and gravity pipes), (ii) water tanks, and (iii) pumps and pumping stations were inserted in WaterGEMs [27] to perform hydraulic simulations. The network pipe layer of this study consists of the pressure main (main eduction pipe) from PS41 to T63, as well as pipes downstream of the T63 head tank, and includes information about the pipes’ technical characteristics (length, material, diameter). The water tank layer contains information about the technical and hydraulic characteristics of T63: the shape of the tank’s cross-section and its dimensions, its ground and base elevation, and the minimum and maximum elevations of water stored in the tank. Similarly, the layer of pumps and pumping stations includes technical and hydraulic information on PS41 and BS79: their ground elevation, head-flow curves of the pumps, and pump efficiency data, when available. Both the water tank and pump/pumping station layers include coordinate information on their exact location stored in their attribute tables. These layers are depicted in Figure 3. Shapefiles including all relevant features were extracted from the thematic GIS layers and inserted in OpenFlows WaterGEMs software using the Modelbuilder wizard [27].
Elevation information (on network nodes) was acquired from the DEM (Digital Elevation Model) available in EYATH S.A.’s GIS database. To eliminate all large objects and obstacles that can significantly differentiate node elevations of the DEM from ground elevations, a simple interpolating procedure was applied: (i) a basemap of the study area was superimposed onto the available DEM, (ii) DEM elevations were acquired for equally spaced points in the middle of all main streets in the study area, (iii) a spatial interpolation procedure was applied to assess the ground elevation map in the study area, and (iv) the constructed spatial map was inserted into OpenFlows WaterGEMs software and the Trex wizard [27] was used to automatically assign elevations to the network nodes. The geostatistical procedure used in this work to generate ground surface elevations was kriging [28]. This procedure can generate a surface from a scattered set of data point elevations. The main advantage of the method is that it performs some kind of optimization to find the best estimation method for generating the elevation surface. This method is recommended when the selected data points are characterized by a known spatially correlated distance or directional bias [29].
In this work, detailed mapping of the available water meters in the study area was conducted. The water meter GIS layer was created based on field data collected automatically during water meter readings. Each water meter was spatially geolocated, bearing a unique consumer code assigned to its consumer. The water meter layer was also complemented with information on water meter coordinates and addresses, which was used to crosscheck the exact water meter location with information included in the monitoring system of EYATH S.A., based on each unique consumer code. Quadrimester consumption data were then collected from the company’s monitoring system for all consumer codes in the area of interest. Subsequently, the water consumption data for the time periods of interest were added as daily averages (in quadrimesters) to all water meters in the GIS layer constructed. After relevant processing, a shapefile including all water meter information (consumer codes, addresses, coordinates, and quadrimester water consumption) was extracted and inserted into OpenFlows WaterGEMs software using the Loadbuilder wizard [27]. Customer meters are assigned directly to the nearest pipe (perpendicularly), and demands are distributed to the adjacent nodes. The workflow of the described procedure is shown in Figure 5.

2.3. Hydraulic Simulation and Analysis

2.3.1. Hydraulic Model Set-Up and Calibration

Hydraulic models are efficient decision support tools for managing WDNs. The flow and hydraulic conditions in the models are governed by basic equations, namely the conservation of mass, the energy conservation, and the head loss equation. The head loss continuity law states that the difference in energy between two points is equal to the frictional and minor losses and the energy added to the flow in the components of the system between these points. This condition can be represented in a matrix form for all network loops [30]:
Δ h = Λ r T h r + Λ c T h c
where Δh is the vector of pipe head losses, hr is the vector of tank and reservoir heads, hc is the vector of nodal heads, Λr is a nr × b fixed-grade node incidence matrix, Λc is a nc × b connection nodes incidence matrix, nr is the number of tank and reservoir nodes, nc is the number of junction nodes, and b is the total number of links/pipes. Head losses between nodes i and j are usually expressed in the following form [30]:
Δ h i j = h i h j = R i j q i j β
R i j = K L i j C 1.852 D i j 4.871
where hi and hj are the heads at nodes i and j, respectively, qij is the pipe flow, β is the flow power exponent, and Rij is the pipe hydraulic resistance assessed in Equation (3) using the Hazen–Williams equation. In Equation (3), the factor K is 10.69 when qij is in (m3/s), Lij is the pipe length (m), C is the friction factor, and Dij is the pipe internal diameter (mm).
Hydraulic simulations in this work, for both the old and new DMAs of the Efkarpia district, were performed using Bentley OpenFlows WaterGEMs [27] in extended period simulation (EPS) mode for a typical day interval. Boundary conditions for all hydraulic simulations, such as total inflow from T5 and characteristic elevations in the head tank T63, were acquired from the hydraulic model of Thessaloniki’s aqueducts, described in detail in [18]. The maximum daily demand of the old DMA of Efkarpia was assessed to be around 108 m3/h [18], while according to the daily demand pattern for suburban tank zones presented in [18], the peak hourly demand of the old DMA reached 154.5 m3/h. It should be noted that since there are no high-temporal-resolution consumption data in the area, all consumers (mainly residential and a few commercial users) are assumed to have the same daily demand pattern. This demand is then divided among the different consumers in the DMA, based on the available consumptions for defined quadrimester measuring intervals. In this work, consumption data for the years 2019 and 2020 were used. From 2021 onwards, the old DMA of Efkarpia transitioned to new operating states following the construction of new pipes in the southern part of the zone, until it achieved its operation as the new DMA of Efkarpia at the end of 2022. The three quadrimesters of each year n refer to the following periods: (i) from December of year n − 1 to March of year n (1st quadrimester), (ii) from April to July of year n (2nd quadrimester), and (iii) from August to November of year n (3rd quadrimester). The four-month period from April to July 2020, referred to as the 2nd quadrimester of 2020, was used as a basis scenario to calibrate the hydraulic model of the Efkarpia district because the total consumption in this period was measured to be higher than the others and because most field measurements in the area were conducted during this interval. The average daily demand of the 2nd quadrimester of 2020, resulting from summing the consumptions of all water meters in the area, was increased by almost 25% to account for losses in the WDN and then multiplied by a peak demand factor almost equal to 2.5 to estimate peak demand during a typical day. However, it should be noted that the estimation of water demand is characterized by high uncertainty, and is expected to decrease significantly by replacing old conventional water meters with new sophisticated ones.
To simulate the response of the old DMA of Efkarpia and to calibrate its hydraulic model, a steady-state calculation was initially performed. All consumer meters were geo-allocated in the created hydraulic model (see Section 2.2) with demands estimated from their measured average daily demands in the 2nd quadrimester of 2020 multiplied by a peak demand factor equal to 3.1 (also accounting for water losses in the network). The peak demands of all consumer meters were then allocated to the nearest pipe of the WDN and then distributed to the pipe’s start and end nodes using a weighted distance approach.
The accuracy of a WDN hydraulic model depends critically upon two uncertain parameters, namely the nodal demands and the pipe roughness coefficients [31,32], which are not directly measurable. To assess nodal demands, measured data of water consumption for each period of measurements (quadrimester periods) and a daily demand pattern included in [18] were utilized, as described above. Regarding the calibration of pipe roughness coefficients, different techniques have been developed in recent years, ranging from simple ones, such as trial-and-error and empirical methods [33], or explicit methods [34], to implicit or optimization methods [35,36,37,38,39]. In this work, due to the unavailability of SCADA measurements in the water distribution system of Efkarpia, calibration of the WDN was performed manually based on in situ pressure measurements at selected nodes of the network. Pressures measured at twelve nodes of the network, covering the entire study area, were finally selected to be used for the calibration of the hydraulic model, due to inconsistencies or measuring errors encountered in the entire set of measurements. Such measurements were obtained in the morning during the hours of peak demand, while very few measurements were also obtained during the night. Difficulties in conducting in situ pressure measurements in the WDN of Efkarpia significantly reduced the available resources for calibrating the constructed hydraulic model, which also emphasized the need to install appropriate pressure-measuring equipment in the network to assist in more reliable model calibration and also enable the validation of the hydraulic model. To calibrate the hydraulic model of the Efkarpia district, pipe roughness coefficients in the area were adjusted to minimize the disparities between the pressure simulations and observations. It should be noted that the hydraulic behavior of the subzone of Efedroupolis is principally governed by the operation of booster PS79. The total measured water consumption in Efedroupolis is a small part of the total water consumption in the old DMA of Efkarpia, hardly reaching 5%.
Hydraulic simulations in the old DMA of Efkarpia were also performed for an emergency scenario applied in case of failure in the aqueduct of Aliakmonas, supplying T63 with water during normal operating conditions of the system. The boundary conditions for this scenario were obtained from [18]. The intermittent water supply schedule for this emergency scenario was created based on the assumption that tank zones supplied solely by the aqueduct of Aliakmonas during normal conditions will receive water through the aqueducts’ central infrastructure, while the aqueduct of Aravissos will supply the rest of the tank zones in the urban tissue. Two distinct phases were considered in this scenario: (i) the first 19 h of the crisis, until the tank downstream of the TWTP empties, and (ii) an intermittent water supply schedule following the first 19 h of 4.25 h continuous water supply followed by a 3.75 h cut-off [18]. The analysis conducted avoids pressure-dependent demands, considering a demand satisfaction ratio, defined as the ratio of the available to the required flow, equal to one during water supply periods, assisting in achieving the main objectives of water distribution management under abnormal conditions [18]. The hydraulic simulation for this scenario was performed for a period of 67 h (two days plus 19 h to use water stored in the system’s tanks).

2.3.2. Hydraulic Simulation Using Consumption Data from Smart Meters

To quantify the uncertainty in the daily variation pattern of water demand in Efkarpia DMA, measured data from installed smart meters in other areas of Thessaloniki city were analyzed and used in this work. Smart meters enable the water supplier to have access to real-time data of both the water supply in the network and the water consumption of end-users [40], thus allowing detailed modeling of water demands in the hydraulic model of the WDN, and therefore assisting in reducing uncertainty associated with both demand values and patterns. In the framework of the SMART-WATER research project [41,42,43], a unified system was developed including smart water meters coupled with smart water valves installed in selected areas of Thessaloniki, combined with real-time telemetry and remote-control services. The main goals of the SMART-WATER project, conceptualized in a five-layer unified generic architecture, included the following: (i) feedback of water usage, (ii) water management, (iii) data processing and visualization, (iv) device connectivity and data management, and (v) smart automated metering and remote control [42].
The pilot study of the SMART-WATER project was implemented in two areas in Thessaloniki, namely an area in the urban center of Thessaloniki and a second one in Kalamaria, in the eastern part of the city [43,44,45]. The abovementioned areas were selected based on the existing urban structure and their geomorphology, focusing especially on the results of the visibility analysis tests performed to detect appropriate locations from which antennas are visible to an adequate extent, and ensuring that the equipment installed would span geographically in a continuous manner and would remain inside the visibility coverage of the antennas [43]. The project financially supported the installation of one hundred smart meters and associated smart water valves, where a smart meter and a smart water valve constituted a set of equipment for installation for a single consumer. The sample of one hundred consumers was divided into two parts, consisting of fifty consumers in the city center and fifty in Kalamaria. Consumption data used in this work were available for all consumers in the two study areas on an hourly time step, covering the period from August to November 2020, corresponding to the third quadrimester of 2020. Data in each area (urban center and Kalamaria) were processed separately. Hourly total demand was first extracted by summing the observed data of the smart meters. Days containing missing data or distinct outliers were eliminated from the analysis. Outliers are observations that differ significantly from the majority of observations in the time series [46]. They can possibly be attributed to errors due to hardware issues. A simple way to detect such erroneous values is the z-score method [43]. After removing missing data and outliers, the hourly observations were averaged for the remaining days of the sample and then divided by the average water demand of the entire study interval. This simple procedure was followed to acquire hourly demand patterns within a typical day interval, considering that the consumption data used were acquired from smart meters installed in two areas of the urban fabric of Thessaloniki, other than the one studied in this work, and also covered a limited number of consumers in these areas.

2.3.3. Energy Consumption and Savings

Climate change and its predicted impacts on water resources related to the threats of water scarcity and desertification are expected to put significant pressure on water management measures and policies, highlighting the significance of effective water stress mitigation measures and of evaluating these policies in terms of climate change mitigation [47,48,49]. Recently, the estimation of carbon footprint (CF), defined as “the total amount of greenhouse gas (GHG) emissions directly and indirectly caused by an activity or accumulated over the life stages of a product” [50,51], has started receiving considerable attention. To quantify the CF, the global warming potential (GWP) of six GHGs (CO2, CH4, N2O, SF6, HFCs, and PFCs) identified in the Kyoto Protocol, representing the ratio between the heating caused by the specific GHG over a specific interval and the heating caused for the same period by an equal amount of CO2, was used [52]. Methodologies to assess CF are still evolving, even if the ISO/TS 14067 [53] suggests using the Life Cycle Assessment (LCA) as an appropriate methodology. The LCA assesses the environmental performance of a product or service at every stage of its life cycle, based on evaluating the emissions produced, as well as the consumption of resources [52,53,54,55,56,57,58,59].
Water supply systems mainly include five distinct stages, namely water intaking, water transferring, treatment, distribution, and reaching the system’s end-users (domestic water use, other water use and rivers, lakes or other water bodies). The water distribution process involves the transporting and distributing of treated water through a network of pipes until it reaches the network’s end-users. In case a pump is used for distributing water in the network, based on the principle of energy conservation, energy use can be assessed as follows [60]:
E = ρ g h Q 3.6 × 10 6 × η × t
where E is the energy used for pumping (kWh), ρ is the water density (kg/m3), Q is the water flow (m3/h), g is the acceleration of gravity (m/s2), h is the head of the pump (m), η is the pump efficiency, and t is the pump operating time (h).
The urban water cycle was reported to account for 3–10% of the global warming potential by direct and indirect GHG emissions in many European countries [61]. Stokes and Horvarth [62] used a hybrid LCA to assess the energy and air emission effects of water supply systems in the USA to aid the decision-making process on LCAs of U.S. water provision systems. Four water sources were analyzed in this research, namely imported water, seawater desalination, brackish groundwater desalination, and recycled water (the recycled water system produces nonpotable water). Based on the LCA results of their base case study, a defined quantity of 1 m3 of imported water produces 1093 g equivalent CO2/m3, 1.9 g NOx/m3, 0.4 g PM/m3 and 2.9 g SOx/m3. From the results presented in this study, imported water seems to be preferable from an emission point of view to all desalinated water alternatives.
In the ECAM tool [63], developed within the Water and Wastewater Companies for Climate Mitigation (WaCCliM) project, GHG emissions are assessed to be consistent with the Intergovernmental Panel on Climate Change (IPCC), and water supply and sanitation service levels and energy performance are quantified by means of the IWA (International Water Association) and some additional performance indicators. The tool is recommended as a source of valuable information for identifying the stages within the urban water cycle where GHG emissions could be reduced and energy savings could be increased [64]. In this tool, GHG emissions are counted in terms of CO2 equivalents. The energy requirements are converted into GHG emissions using a conversion factor based on the specific country’s electricity mix [63]. The emission factor for grid electricity in Greece, considered in this study, is set at 0.45 kg CO2eq/kWh [65].
According to Lin and Kang [66], a basic carbon emission hotspot in water supply systems is the energy consumption from pumping. In their study, they evaluated the potential of energy reduction in different pumping systems of WTPs, introducing three innovative indicators to estimate the energy-use efficiency in pumping: (i) pumping efficiency, (ii) power consumption per pump lift, and (iii) specific energy consumption. The specific energy consumption, used in this work to compare the energy-use efficiency in pumping for the old and new DMAs of Efkarpia, refers to the daily energy used per unit volume of water:
s p e c i f i c   e n e r g y   c o n s u m p t i o n = c o n s u m e d   e n e r g y   ( k W h ) f l o w   r a t e   ( m 3 h )
The pumping of water in the water supply chain constitutes a principal source of energy consumption. Old pumps that have in most cases exceeded their service lifetime and operate at low efficiencies, or pumping stations that are poorly designed or maintained, can cause significant energy losses in the water supply network. Mainly focusing on the pumps of a water supply system, energy efficiency can be achieved by the following: (i) obtaining optimal design and operation of pumps, and (ii) scheduling pump stations to operate based on optimal controls.

3. Results

Calibration of the hydraulic model of the old DMA of Efkarpia was performed under steady-state conditions based on consumption data of the second quadrimester of 2020 (see Section 2.3.1). Pressures were measured manually at installed water connection points close to the selected nodes of the WDN. The locations of measurements were identified to cover the entire study area in a satisfactory manner. Measurements conducted close to nine nodes of the Efkarpia subzone and three of the Efedroupolis subzone were finally used in the calibration process. During the WDN calibration process, the pipe roughness coefficients were adjusted to comply with the available pressure measurements, also considering the age of the pipes in the network. The results of the calibration process were judged to be quite satisfactory, with pressure differences in the Efkarpia subzone ranging within ±8%. Higher pressure errors, reaching 15%, were assessed at the selected nodes in the Efedroupolis subzone. The increased differences between the measured and simulated pressures in the Efedroupolis subzone could imply high unaccounted-for water in the area. Unaccounted-for water in the Efedroupolis subzone can be caused by illegal water connections on the network, water theft, water consumption measuring errors, and/or leakages in the WDN. The Hazen–Williams coefficient (Equation (3)) for the pipes in the WDN of Efkarpia was assessed in the range of 80–110, with the coefficient for the majority of pipes fixed at 90. The roughness coefficients for the main eduction pipes of the system (from PS41 to T63) were acquired from the hydraulic model of Thessaloniki’s aqueducts [18].

3.1. Hydraulic Model Results for Different Consumer Demands

After calibrating the model of the old DMA of Efkarpia, EPS hydraulic simulations were performed for a typical day interval using consumption data for all three quadrimesters of 2019 and 2020. All hydraulic simulations start at 6:00 a.m., considering that the water level in most tanks of EYATH S.A.’s aqueducts is at its maximum during the early morning hours [18]. Figure 6 presents the daily variation in pressure for the three quadrimesters of 2019 and 2020 at selected nodes of Efkarpia’s WDN.
The lowest pressures were found in the northern part of the DMA, while the highest pressures were found in the southern part of Efkarpia’s subzone and in the subzone of Efedroupolis. The second quadrimester of 2020 is the period of lowest pressures in the entire WDN of Efkarpia. Comparing the three quadrimesters of 2019 with those of 2020, it is generally noticed that lower pressures are assessed in the latter, caused by higher water demands in the study area. Periods of higher water demands in Efkarpia DMA can be partly attributed to lockdowns imposed by the Greek state during the COVID-19 pandemic. In the high-elevation area north of the head tank T63 of the system (Figure 6a), pressures were found to be up to 44% lower in the second quadrimester of 2020 with respect to the same period in 2019. The respective pressure differences reached almost 8.5% and 20% for the first and third quadrimesters. For the network node examined in Figure 6b, the relative differences in pressures for the three periods of 2020 and 2019 are lower, reaching 9% for the second quadrimester. In the southern edge of the Efkarpia subzone (Figure 6c), pressures were found to be up to 8% lower in the second quadrimester of 2020 with respect to the same period in 2019. For the network node examined in the subzone of Efedroupolis (Figure 6d), pressures were found to be up to 17.5% lower in the second quadrimester of 2020 with respect to the same period in 2019.
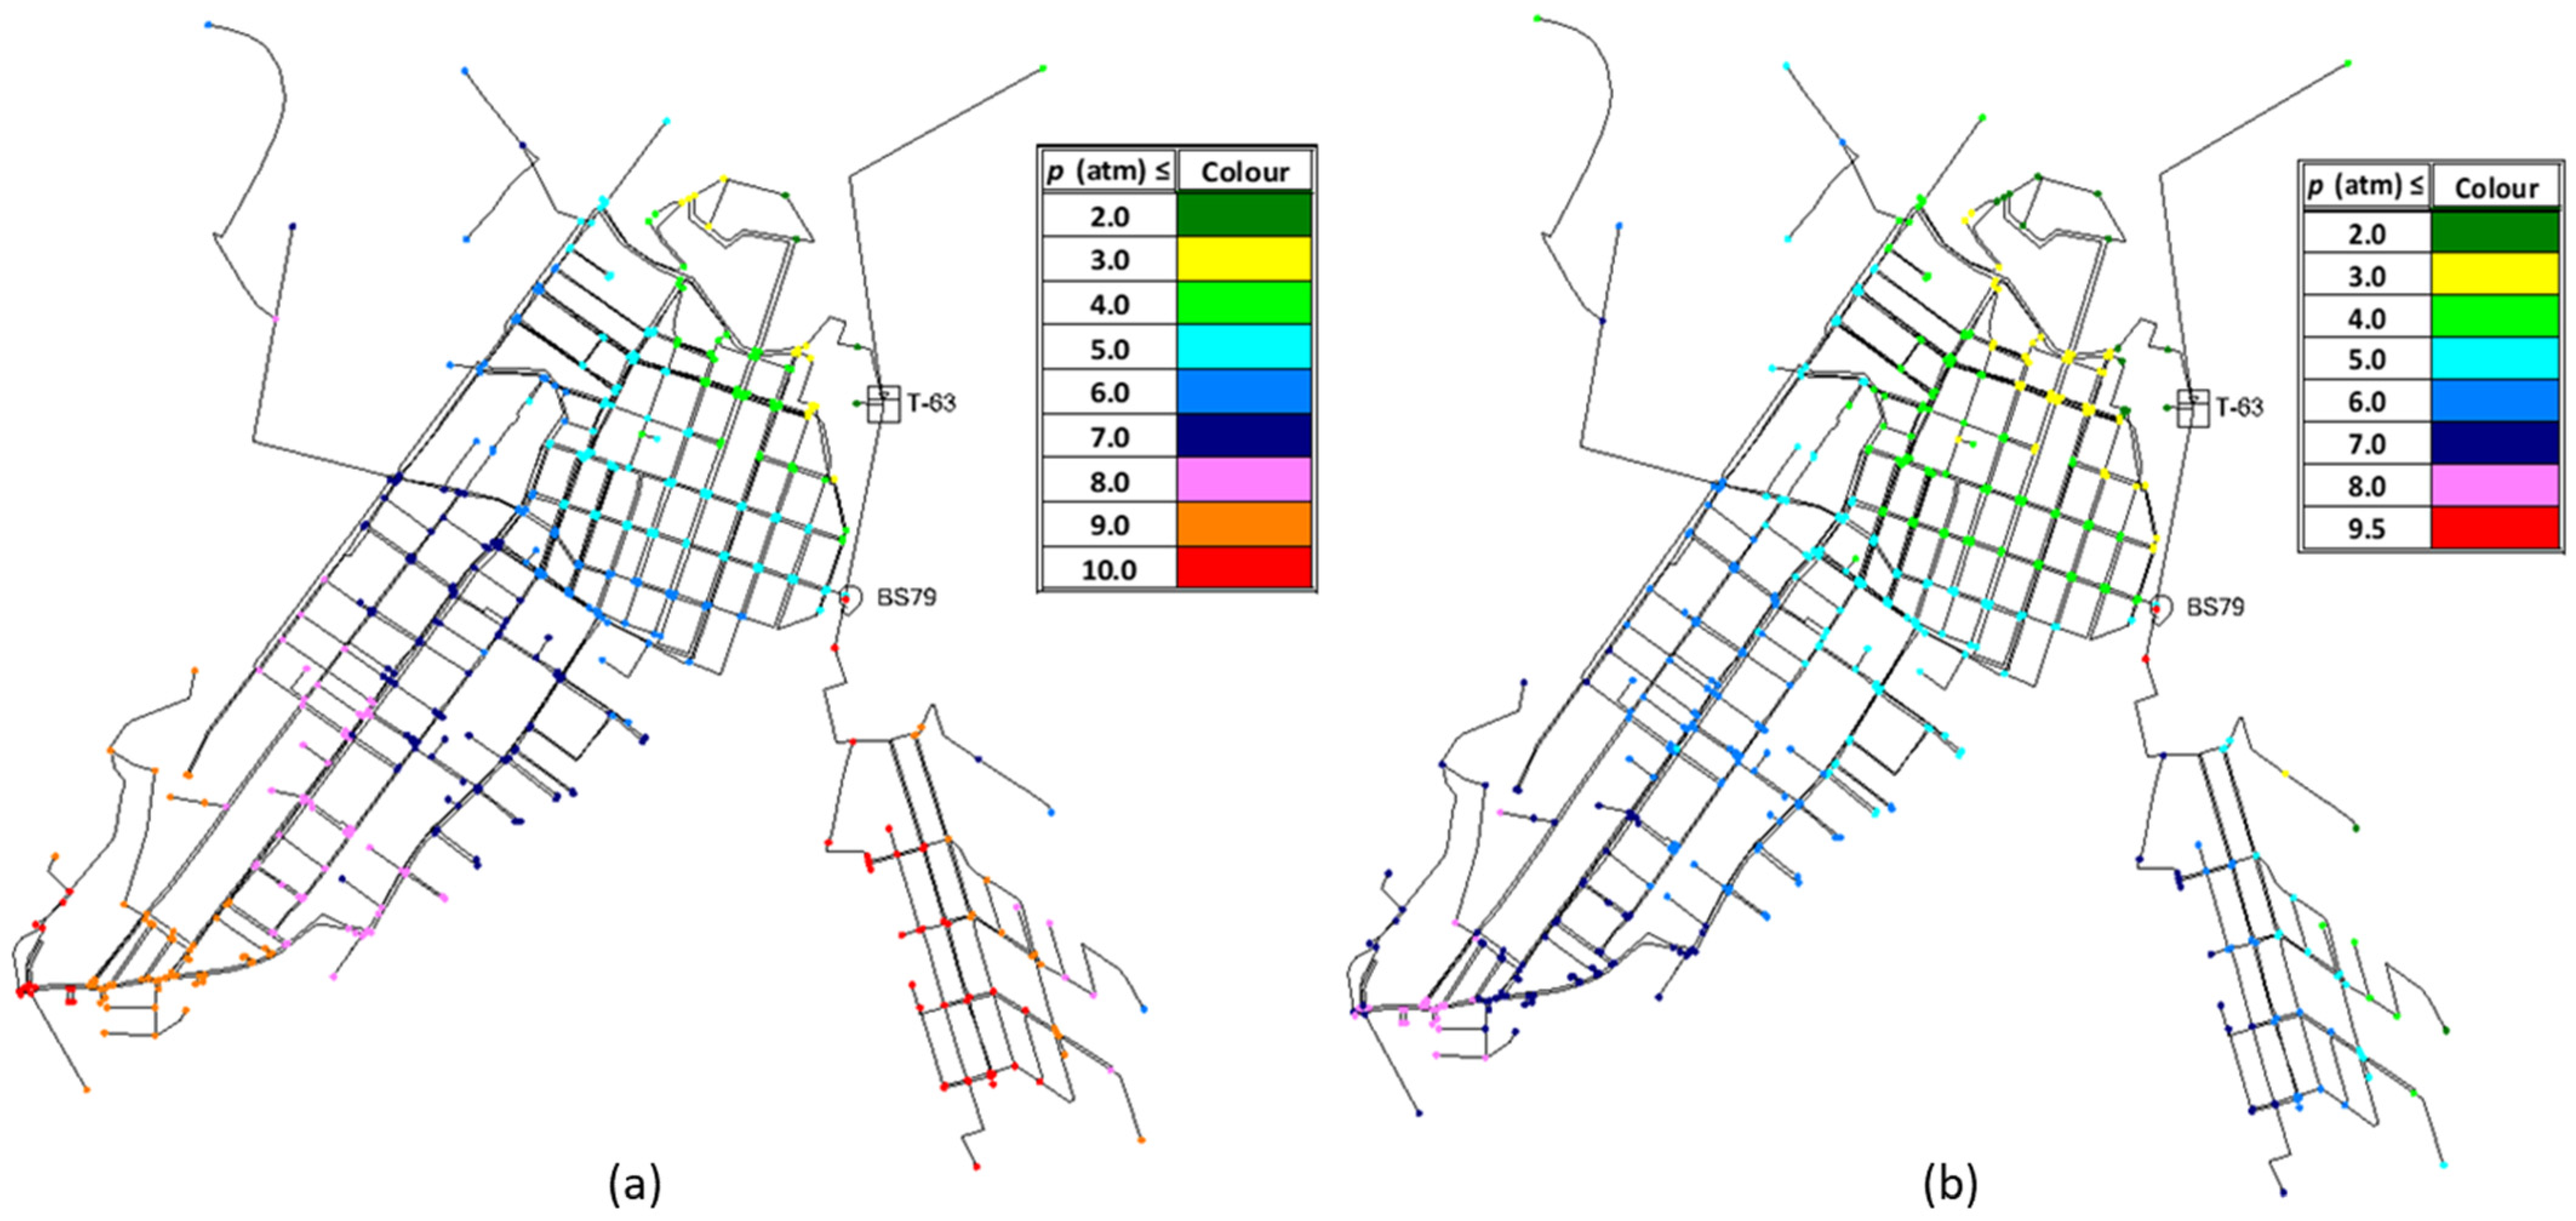
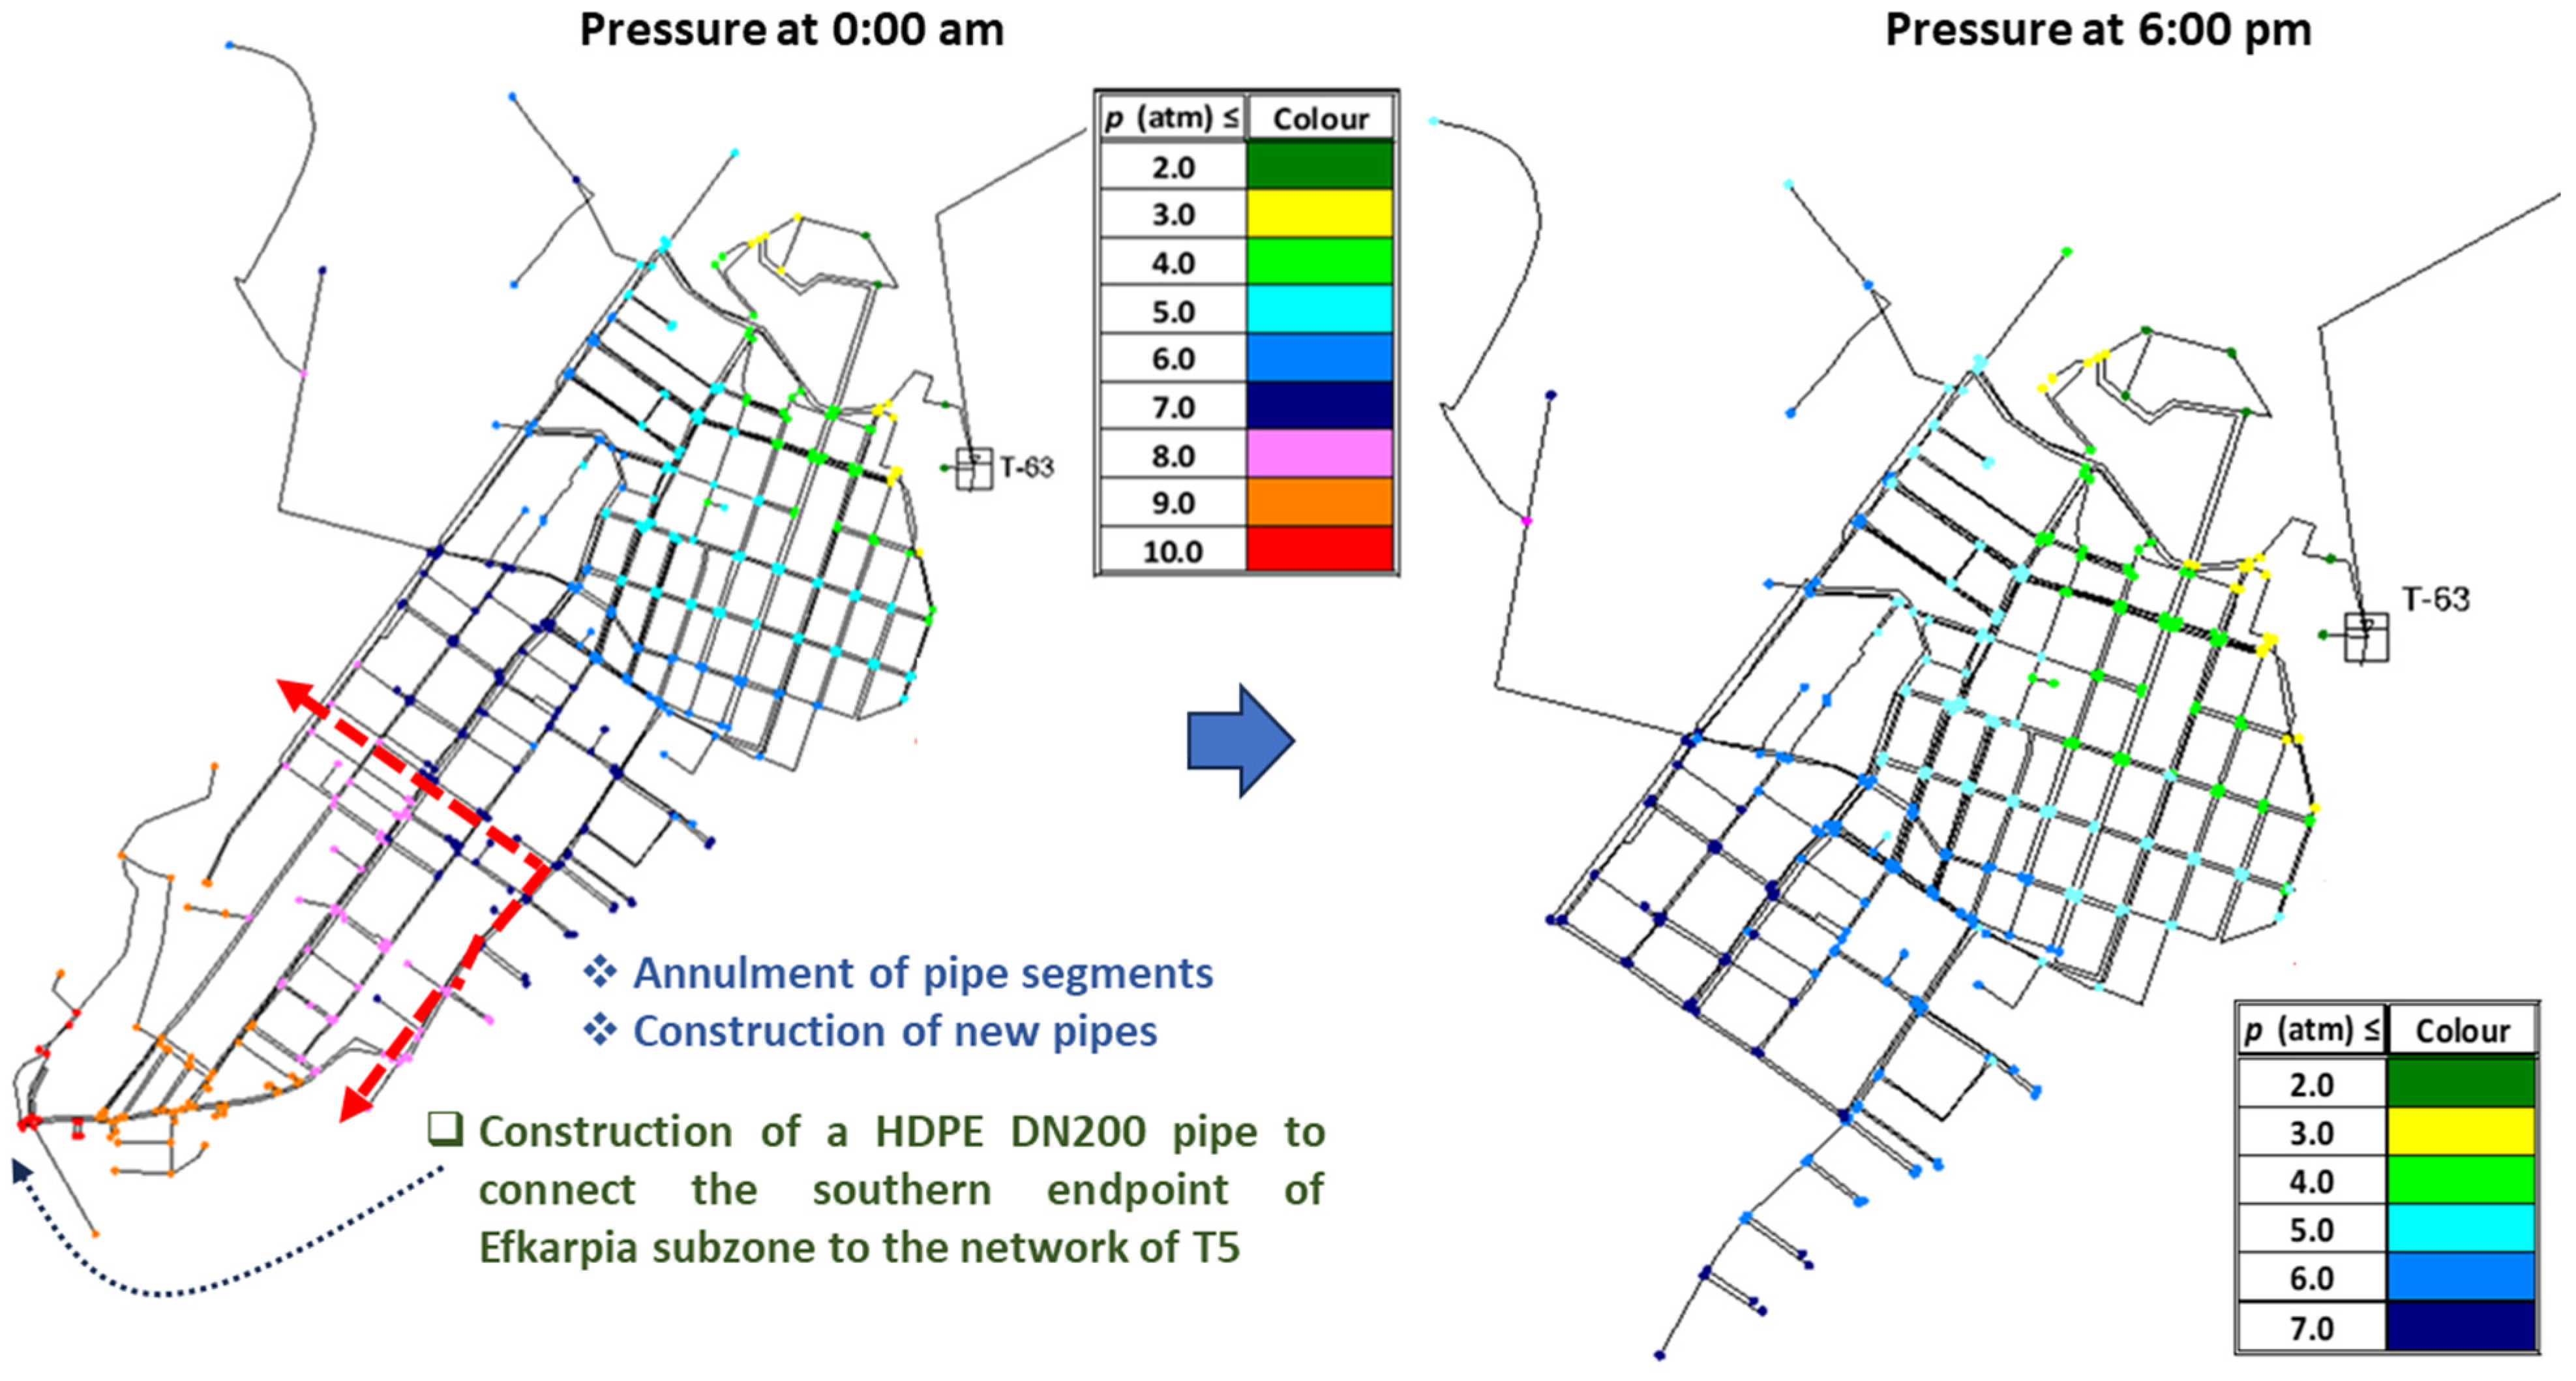
Figure 7 presents color-coded pressure estimates in the WDN of Efkarpia DMA at 0:00 a.m. (Figure 7a) and 6:00 p.m. (Figure 7b), the times of the minimum and peak total water flow in the WDN, respectively, for the consumption data of the second quadrimester of 2020. It can be noticed from both figures that the DMA of Efkarpia comprises distinct pressure zones: (i) the high-elevation area north of the head tank T63, (ii) the central part of the Efkarpia subzone where moderate pressures develop, (iii) the southern low-elevation part of the Efkarpia subzone, and (iv) the subzone of Efedroupolis. The highest pressures in the hydraulic system of Efkarpia were found in the southern part of the Efkarpia subzone, as well as in the subzone of Efedroupolis. At the southern part of the subzone of Efkarpia, characterized by lower elevations, water pressures during the hours of minimum consumption (minimum night flow) reach 10 atm, increasing energy use and leakages, as well as the frequency of pipe breaks in the system [17]. In the subzone of Efedroupolis, where high pressures are also assessed at minimum night flow, there are serious concerns that water demand is underestimated due to measurement errors and unauthorized consumption issues, contributing to unaccounted-for water which impacts EYATH S.A. in loss of revenue and resources. However, due to the limited contribution of its water demand to the total water demand of the Efkarpia DMA, and due to its topographic and WDN peculiarities, our focus concentrates on the high pressures assessed in the southern part of the Efkarpia subzone. Apart from the low-elevation area in the southern part of the Efkarpia subzone, there also exists a high-elevation area north of T63, where quite low pressures develop (dark green nodes in Figure 7). Few consumers in this area use in-line boosters to confront pressure problems created within the day.
Pressures at peak demand (Figure 7b) are significantly reduced compared to those corresponding to minimum water demand (Figure 7a), with reductions reaching 73% at high-elevation nodes (dark green nodes) north of T63. The minimum pressure reductions are estimated to be around 13% in the central part of the subzone of Efkarpia, close to BS79, while the average pressure reductions are estimated to be around 25.5%. Distinct node pressure zones exist in the DMA of Efkarpia: (i) the lower-pressure zone north of T63 (dark green nodes) with pressures lower than 2 atm, falling below 0.5 atm at the highest-elevation nodes at peak demand time, (ii) the central part of the subzone of Efkarpia with pressures ranging between 2.5 atm and 5.5 atm at peak demand (yellow, light green, and light blue nodes), (iii) the southern part of the subzone of Efkarpia with pressures higher than 5.5 atm at peak demand (dark blue, pink, and red nodes), and (iv) the subzone of Efedroupolis (there exist few high-elevation nodes in this subzone) with pressures at peak demand less than 7 atm. It is mentioned again here that the pressures in the subzone of Efedroupolis are highly doubtful, due to the low total water demand in the area according to the records of EYATH S.A. The spatial distribution of the pressure zones in the DMA of Efkarpia for the other two quadrimesters of 2020, as well as for all three quadrimesters of 2019, is similar to that presented in Figure 7 and is omitted herein for the sake of brevity. In general, there are small differences in the magnitude of nodal pressures among the different quadrimesters, with lower pressures found for the second quadrimester of 2020, henceforth referred to as the reference period. At the peak demand time, nodal pressures in the network were assessed to be around 11.2%, 7.4%, 7.6%, 9.3%, and 4.6% higher than those of the reference period for the first, second, and third quadrimesters of 2019 and for the first and third quadrimesters of 2020, respectively. However, higher differences are assessed for some high-elevation nodes, where low pressures usually develop. These differences reach almost 89%, 57.8%, 61.3%, 73.9%, and 35%, for the different quadrimesters examined, with the highest values assessed north of T63 or in the subzone of Efedroupolis. During the minimum night flow, differences in pressure among the different quadrimesters are low, hardly approaching 2.5%. The pumping station PS41 operates for almost 14.8 h on a regular daily basis to cover the water needs of the old DMA of Efkarpia.

3.2. Hydraulic Model Results for Different Demand Patterns

Following the simple methodology described in Section 2.3.2, the coefficient of daily variation in water demand was extracted using consumer data from the SMART-WATER research project. This coefficient ranges in the intervals [0.28, 1.61] and [0.24, 1.62] in the areas of the city center of Thessaloniki and Kalamaria, respectively, with more evident differences between the two patterns observed between 10 am to 2 pm and 3 pm to 7 pm. These two patterns are complementary to the reference demand pattern presented in [18], to compare the response of the WDN of the Efkarpia district to different consumer habits. Therefore, the hydraulic model of the old DMA of Efkarpia was also run with the previously mentioned profiles for the variation in water demand within a day. Figure 8 presents the daily variation in pressure in the old DMA of Efkarpia at selected nodes of the network for the three different profiles of water demand: (i) the demand profile for the suburban areas presented in [18], henceforth called the reference demand profile (blue profile), (ii) the demand profile extracted based on smart-meter data for Kalamaria (green profile), and (iii) the demand profile extracted based on smart-meter data for the city center (purple profile). The four selected nodes in Figure 8 correspond to a high-elevation node north of T63 (Figure 8a), a node in the central part of the Efkarpia subzone close to T63 (Figure 8b), a low-elevation node in the southern part of the Efkarpia subzone (Figure 8c), and a node in the Efedroupolis subzone (Figure 8d). The pressure estimates presented in Figure 8 refer to the reference period (second quadrimester of 2020) simulations. For the profile of Kalamaria, nodal pressures in the system assessed during the time of peak demand are up to 36.7% lower than those of the reference demand profile, while the average pressure reduction among all nodes of the WDN is about 5.4%. The highest differences were assessed for the high-elevation nodes in the subzone of Efedroupolis, as well as north of T63. Negligible differences were, however, assessed at a few nodes close to BS79. At the minimum night flow, the pressure differences are lower, hardly reaching 6.7% at the high-elevation nodes north of T63. For the profile of the city center of Thessaloniki, nodal pressures in the system assessed during the time of peak demand are up to 62.7% lower than those of the reference demand profile, while the average pressure reduction among all nodes of the WDN is about 10.5%. The highest differences are again assessed for the same nodes as for the water demand profile of Kalamaria. At the minimum night flow, the pressure differences hardly reach 2% at the highest-elevation nodes in the subzone of Efedroupolis.

3.3. Hydraulic Model Results for an Emergency Scenario

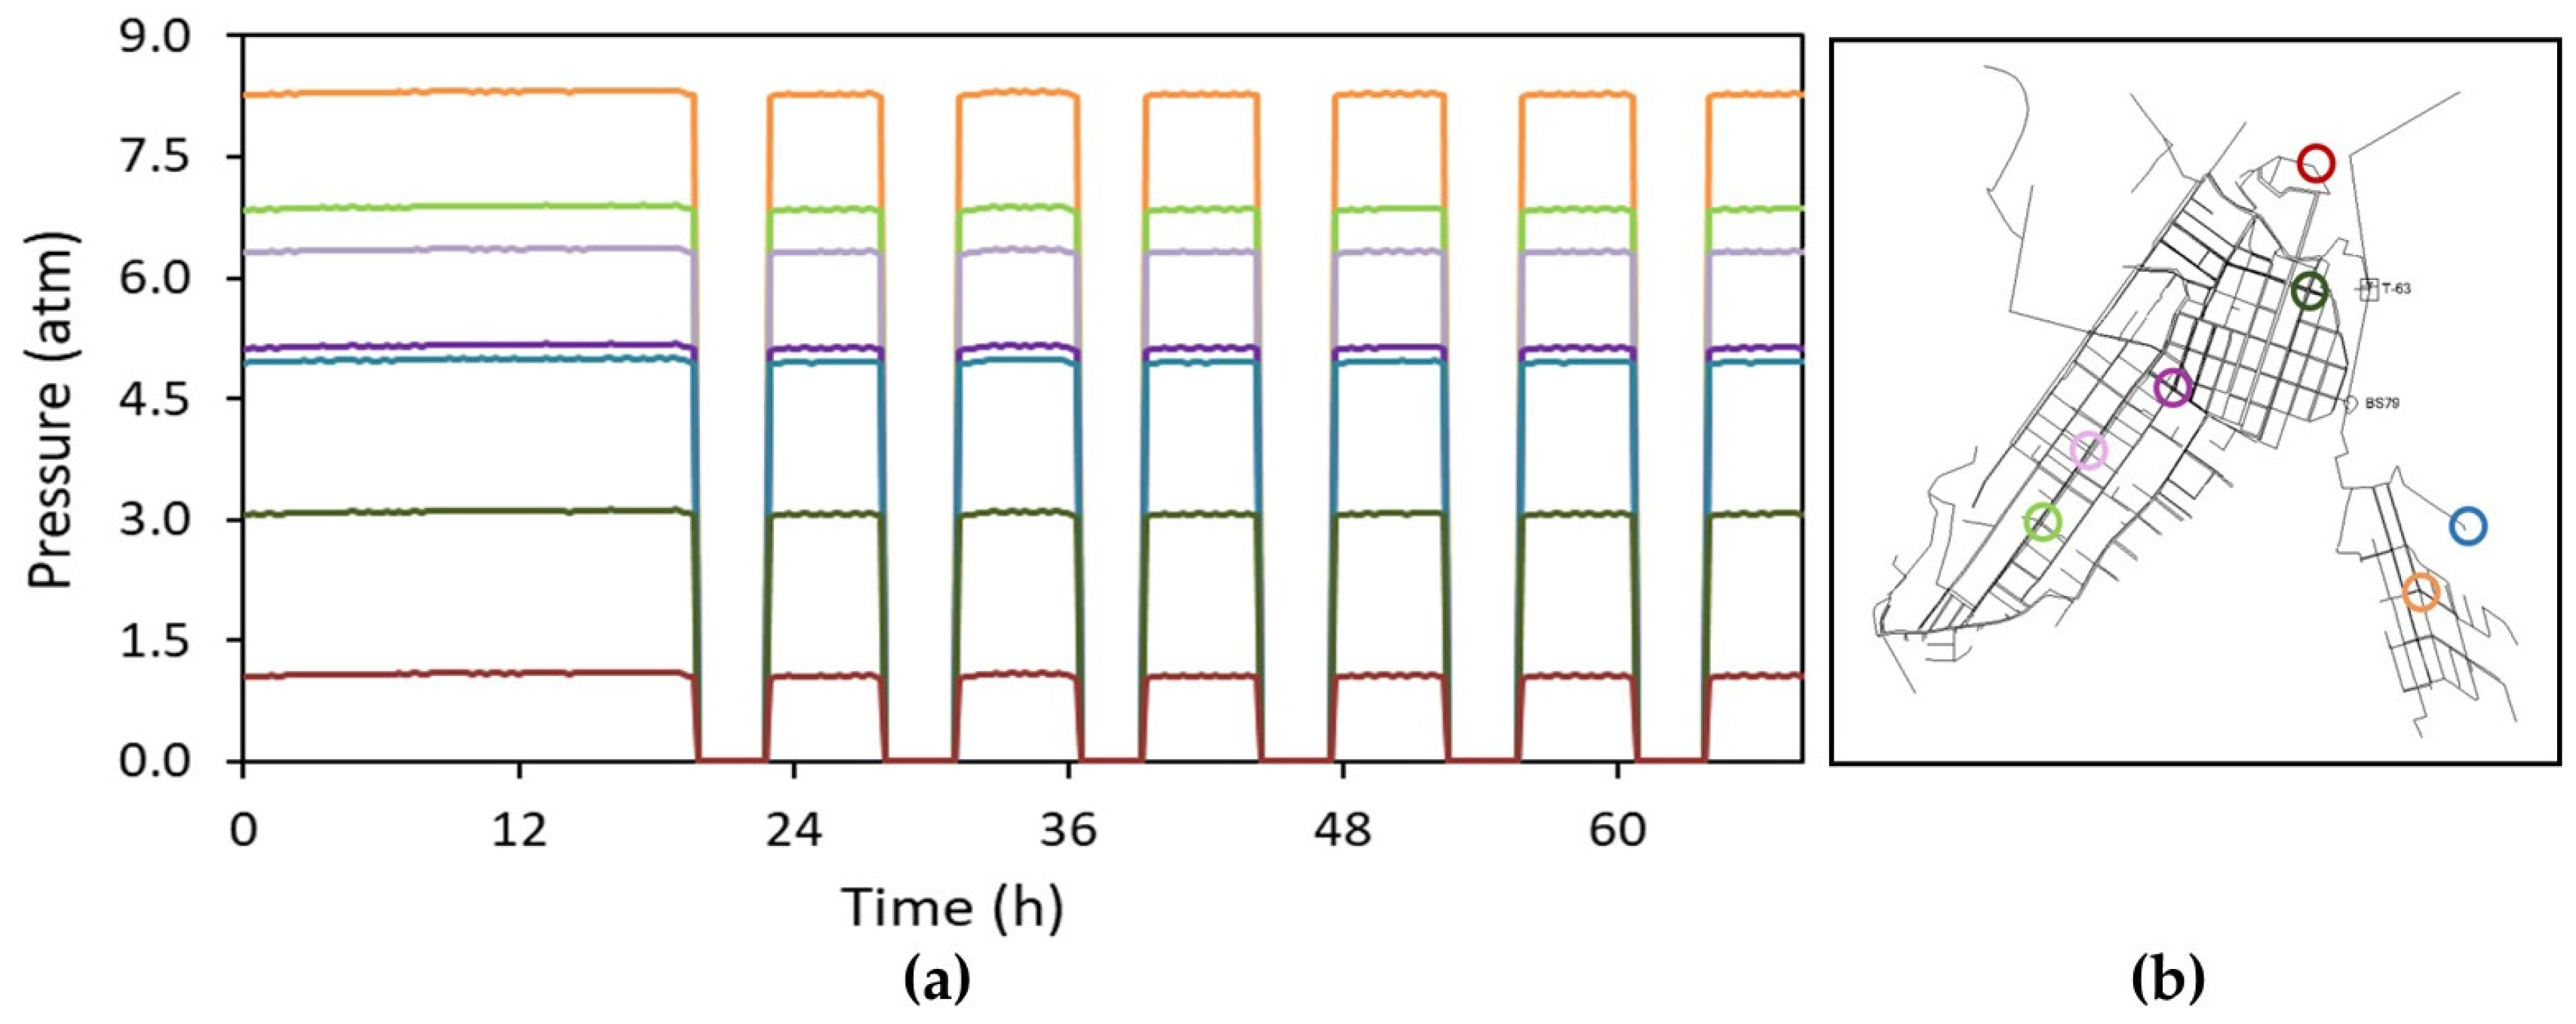
Hydraulic simulations in the DMA of Efkarpia were also performed for an emergency scenario applied in case of failure in the aqueduct of Aliakmonas (see Section 2.3.1). The boundary conditions for this scenario were obtained from [18]. The hydraulic simulations for this scenario were based on an intermittent water supply schedule of 4.25 h continuous water supply followed by a 3.75 h cut-off, following the first 19 h of the emergency. Hence, the hydraulic simulation for this scenario was performed for a period of 67 h. Figure 9 presents the pressure estimates (Figure 9a) at the selected nodes (Figure 9b) of the old DMA of Efkarpia for this emergency scenario.
Based on the results extracted in [18], the daily water supply in the old DMA of Efkarpia reaches 61.2% of the time of regular water supply (≈14.7 h/day), slightly exceeding the target percentage set for all tank zones in this emergency scenario (≈53%). All demand nodes of the system follow the hydraulic schedule assessed for this tank zone (T63 zone), characterized by continuous water supply for the first 19.6 h, followed by alternating periods of 3.4 h cut-off and 4.8 h of continuous water supply. It should be noted that the pressure estimates are constant for all WDN nodes due to the assumption of a fixed water demand in the entire tank zone during the emergency scenario simulation time. From all nodes shown in Figure 9, the highest pressures were observed for the low-elevation nodes in the southern part of the Efkarpia subzone and in the Efedroupolis subzone, while the lowest values were assessed for the high-elevation nodes north of T63.

3.4. Transition to the New DMA of the Efkarpia District

High pressures in the southern part of the subzone of Efkarpia, especially during the hours of minimum night flow (the results of the numerical simulation in Figure 7 confirm this), created the need to design and construct new pipes and annul existing pipe segments in the study area, therefore forming a new DMA in the Efkarpia district (Figure 2 and Figure 3). The lower-elevation area in the southern part of the district is therefore detached from the old DMA and is supplied from another head tank of the system (tank T5). The elevation of T5 is almost 30 m lower than that of T63, ensuring that the lower-elevation area of the Efkarpia subzone will not develop pressures higher than 7 atm during the minimum night flow. Tank T5 has a large active volume and supplies a gravity-fed water system, fulfilling the pressure requirements of its tank zone. The lower-elevation part of the Efkarpia subzone is now attached to the tank zone of T5 (it is a small part compared to the existing tank zone of T5), therefore confirming that during both low- and high-water-demand conditions, the network nodes develop reasonable pressures. Figure 10 presents the transition from the old DMA of the Efkarpia subzone (the pressure at minimum night flow is shown) to its new DMA (the pressure at high demand is shown). It can be noticed that the southern part of the Efkarpia subzone is detached from the old DMA at nodes where the maximum daily pressure exceeds 7 atm (see the red broken line in Figure 10). This ensures that these nodes, when attached to the new tank zone of T5, will develop pressures higher than 3 atm (the minimum pressure requirement considering building heights in this area). A new HDPE DN200 pipe 117 m in length (Figure 2) was constructed to connect the southern endpoint of the Efkarpia subzone to the existing network of T5. It is, therefore, evident that the detailed hydraulic simulation of the Efkarpia DMA significantly assists engineering practice to reformulate the tank zone of the study area, expecting to confine existing hydraulic problems and create a more sustainable DMA design. It should also be noted that the location of the old DMA of Efkarpia at the boundary of the conurbation of Thessaloniki, its water supply from tank T5 (see Figure 2), and ground elevations in the area of the DMA constrain possible alternatives to improve the design of the DMA. The abovementioned reasons, combined with the need to keep the construction costs of new infrastructure low, led to the proposed solution of the new DMA of Efkarpia.
The newly constructed pipes were added to the hydraulic model, some existing pipes were annulled, and hydraulic simulations were then performed for the new DMA of Efkarpia for the reference water demand scenario. It should be noted that the water meters connected to the annulled pipes were reconnected to the nearest existing or newly constructed pipe, while the Hazen–Williams coefficients for the newly added pipes were fixed at 150. Figure 10 presents color-coded pressure estimates in the WDN of the new DMA of Efkarpia at 6:00 p.m., the time of peak total water demand, for the consumption data of the reference period (second quadrimester of 2020). It should be mentioned here that color-coded pressure estimates in the WDN of the new DMA of Efkarpia at the minimum night flow were omitted for the sake of brevity due to the small differences observed from the respective estimates of the old DMA (see Figure 7).
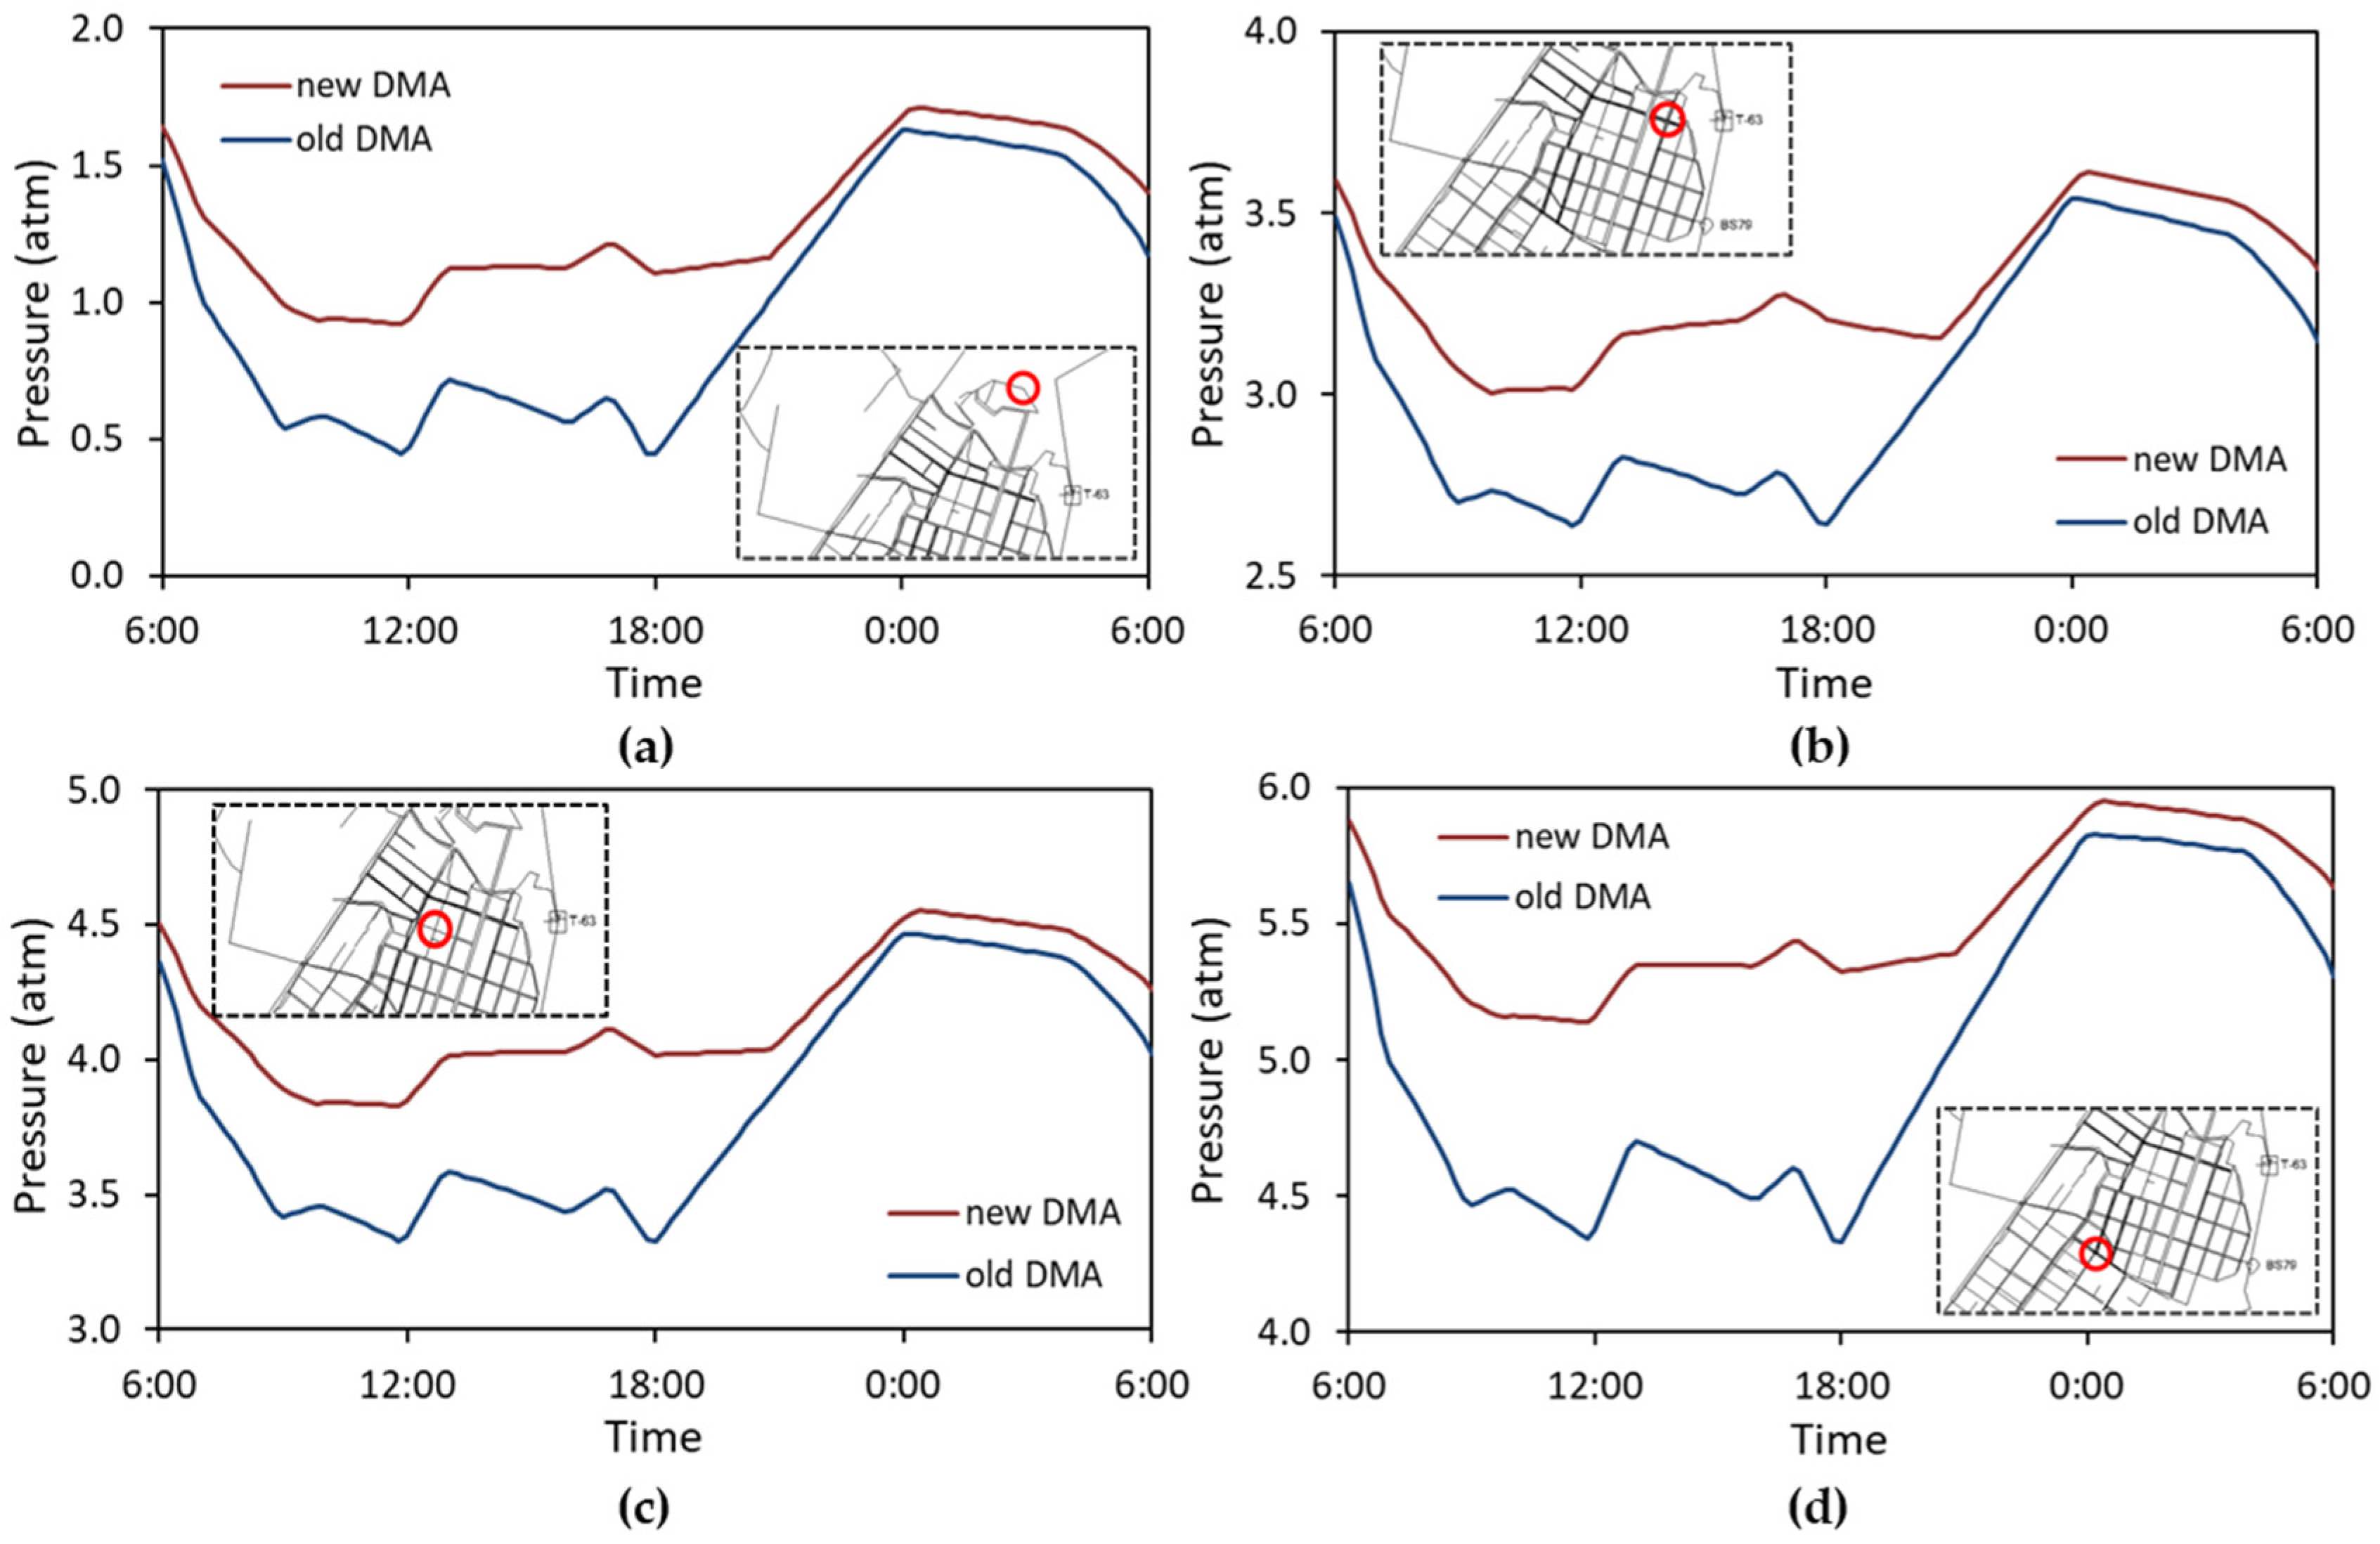
Distinct node pressure zones are again found in the new subzone of Efkarpia: (i) the lower-pressure zone north of T63 (dark green and yellow nodes) with pressures lower than 3 atm, falling below 1 atm at the highest-elevation nodes at peak demand time; (ii) the central part of the subzone of Efkarpia with pressures ranging between 3 atm and 5 atm at peak water demand (yellow, light green, and light blue nodes); and (iii) the southern part of the new subzone of Efkarpia with pressures between 5 atm and 7 atm (blue and dark blue nodes). Due to the role of the booster BS79 in regulating the pressures in the subzone of Efedroupolis, the pressures in the new DMA do not differ significantly from those of the old DMA. A wide range of pressures (ranging in the interval from 3 atm to 8 atm) were again assessed in the subzone of Efedroupolis due to differences in node elevations in this area. Pressure zones higher than 8 atm are only developed at a limited number of nodes close to BS79. Figure 11 presents a comparison of the pressure estimates in a day interval for the selected nodes of the network in the subzone of Efkarpia for both the old and new DMAs. Results for four indicative nodes are presented: a high-elevation node north of T63 (Figure 11a), a node in the central pressure zone of the Efkarpia subzone close to T63 (Figure 11b), one in the central part of the Efkarpia subzone (Figure 11c), and one in the Efkarpia subzone close to the newly constructed pipes (Figure 11d).
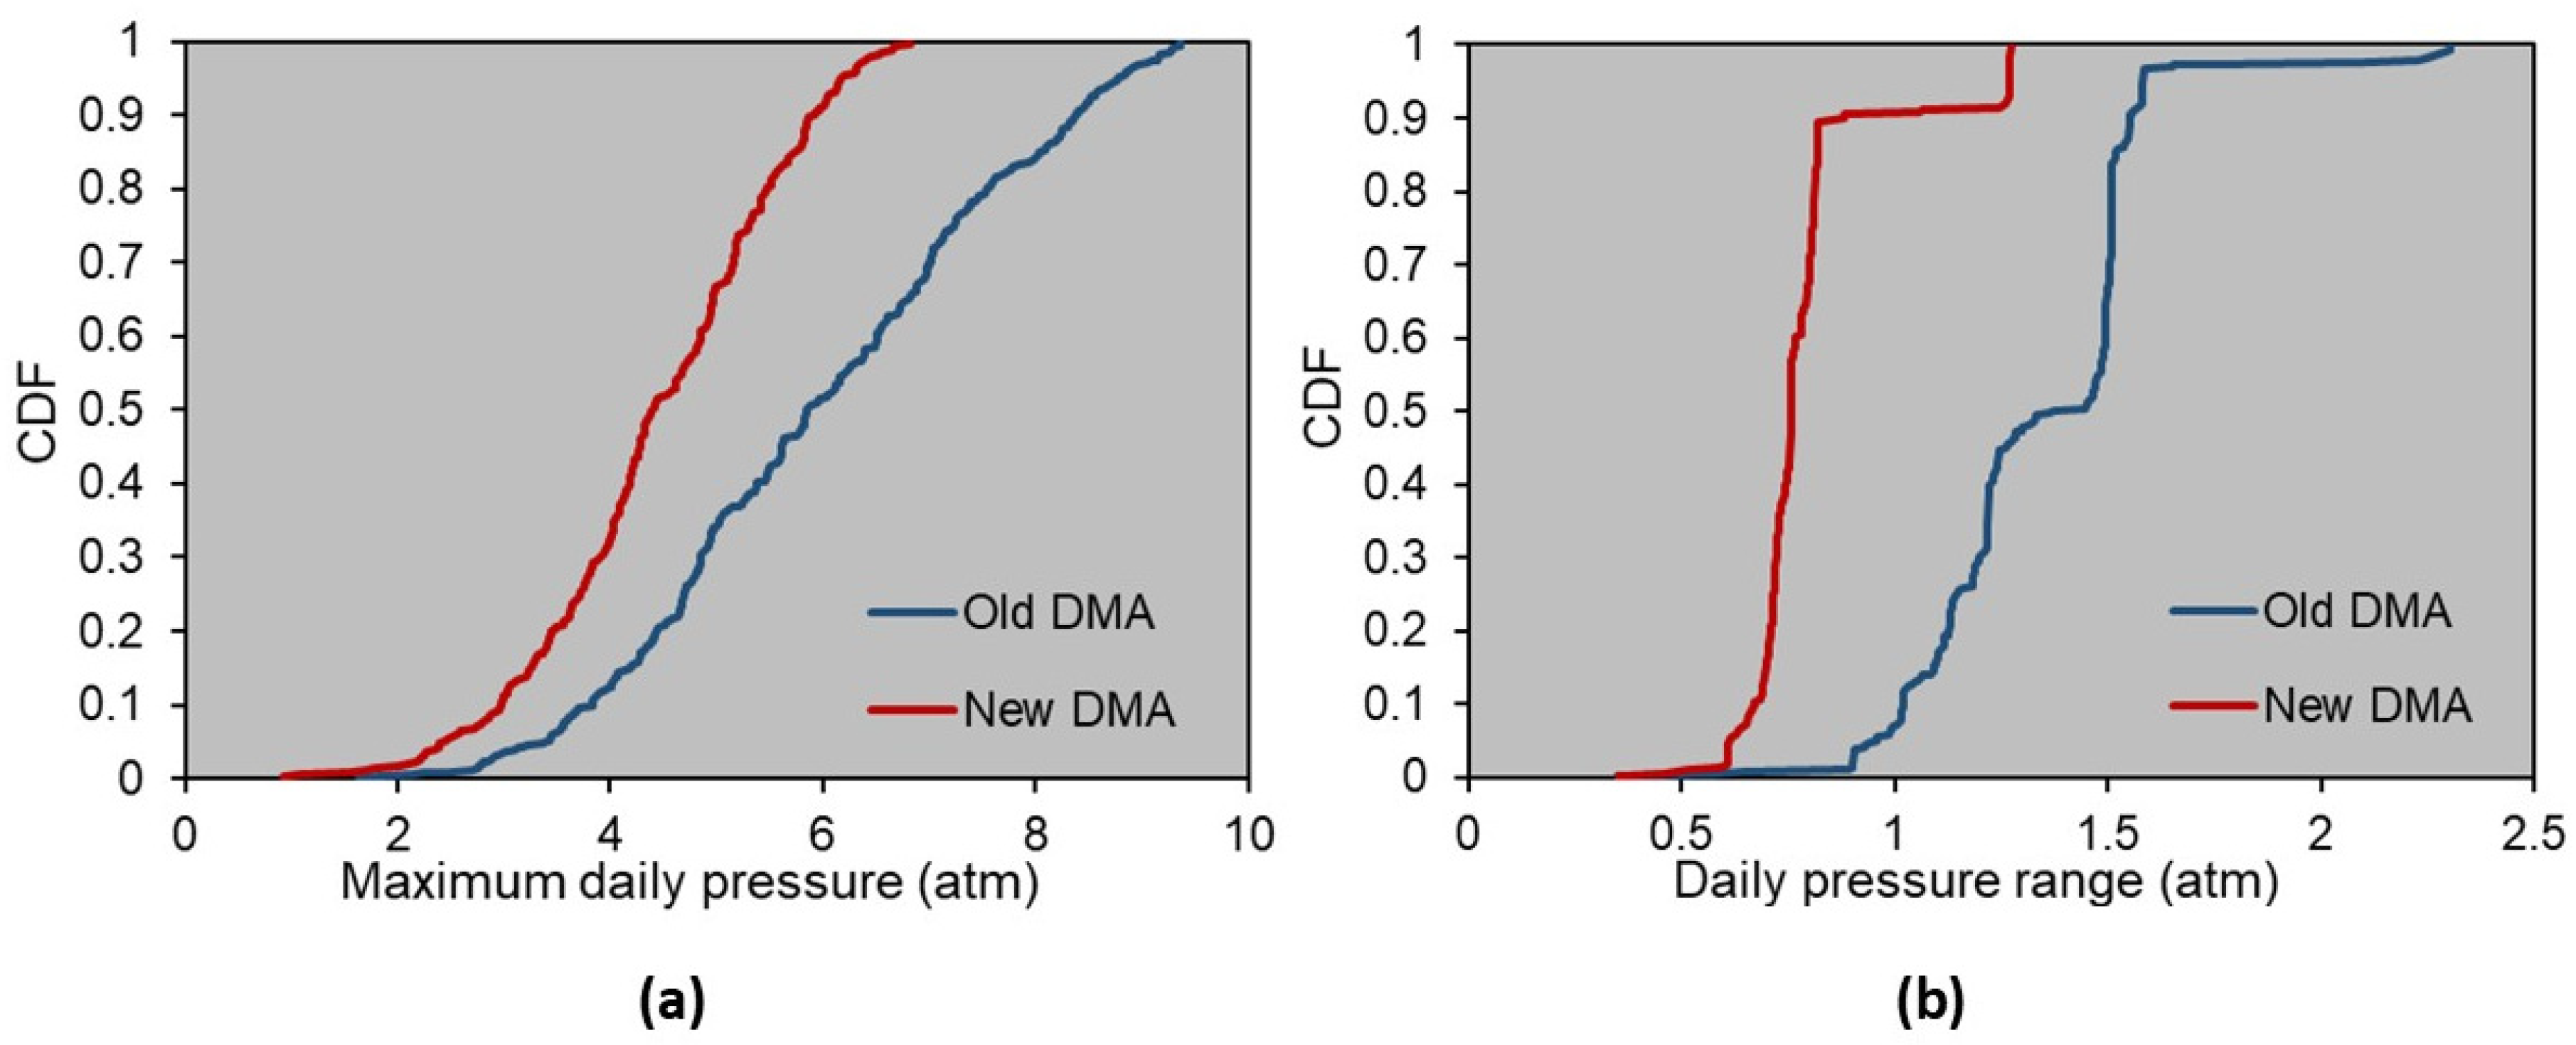
The new DMA of Efkarpia was assessed to offer significant advantages in the hydraulic operation of the WDN. The pressure increases significantly in areas where low pressures were assessed in the old DMA. The pressure increases in almost all nodes of the network, with lower increases estimated for nodes in the subzone of Efedroupolis. Daily pressure shows reduced variation in the new DMA, with a beneficial effect on the WDN operation, extending the service life of the network assets by reducing varying stress on pipes. At peak demand, node pressures in the new DMA increase by around 14.2% on average. However, the pressure more than doubles at high-elevation nodes north of T63, where the pressures in the old DMA were assessed to be really low, imposing the use of in-line boosters at the buildings located in this area. In the central pressure zone of the WDN, the pressures at peak demand increase up to 27%. The highest proportional increases were assessed for the high-elevation nodes in the subzone of Efkarpia, while in the subzone of Efedroupolis, the pressure increases were really low. During the minimum night flow period, the maximum pressure does not differ significantly from that assessed for the old DMA, presenting very small increases. Figure 12 presents the cumulative distribution function (CDF) of the maximum daily pressure (Figure 12a) and the daily pressure range (Figure 12b) in the subzone of Efkarpia for the old and new DMAs. The CDF of the maximum daily pressure in the new DMA of Efkarpia is narrower compared to that of the old DMA and reaches significantly lower maximum values. The same holds for daily pressure range variations, with maximum pressure variations in the new DMA reduced by around 45% compared to the old DMA of Efkarpia. It is evident that in the new DMA of Efkarpia, the pumping station PS41 upstream of T63 operates for almost 11.6 h a day to cover the water needs of the new zone. Therefore, on a daily basis, the pumping station PS41 operates 21.6% less to cover the water needs of the new DMA, compared to the old DMA of Efkarpia. Considering that PS41 operates with the same hydraulic parameters in both cases, the energy savings in the new DMA can also be considered equal to 21.6%.
Hydraulic simulations in the new DMA of Efkarpia were also performed for the emergency scenario applied in case of failure in the aqueduct of Aliakmonas, as in the case of the old DMA of Efkarpia. Simulations were conducted, considering that all demand nodes of the new system follow the same hydraulic schedule as the old DMA, characterized by continuous water supply for the first 19.6 h, followed by alternating periods of 3.4 h cut-off and 4.8 h of continuous water supply. The period of 67 h was also used as the period of simulations for this emergency scenario. To comply with the hydraulic schedule of the old DMA, shown in Figure 9, for the new DMA, the pumping station PS41 upstream of T63 operates for about 10.7 h on the first day (all simulations start at 6:00 a.m.), 7.9 h on the second day, and almost 8.4 h on the third day. For the old DMA of Efkarpia, the pumping station PS41 operated for almost 13 h on the first day, 10 h on the second day, and 11 h on the third day.
Rational management of water supply networks will have positive environmental and economic consequences. Environmental benefits arise from the rational management of water resources and water savings, as well as from reducing energy consumption and CF. Economic benefits arising from the rational management of water resources include the reduction of costs for water supply companies (water utilities) to decrease non-revenue water and save energy. The transition from the old to the new DMA of Efkarpia contributes to achieving both environmental and economic benefits. The low-elevation area in the southern part of the Efkarpia subzone, supplied directly by tank T5 in the new DMA zoning, develops lower pressures, therefore presenting reduced pipe bursts and leaks caused by various factors, such as daily pressure fluctuations or excessive pressures. It should be noted that the water loss rate in the WDNs is a function of pressure. The pressure–leakage relationship is well known and has been documented and proven in the past by numerous studies [4,17,67,68]. The new DMA offers a significant reduction in the energy consumption at the pumping station PS41 upstream of T63, and therefore decreases GHG emissions.
Considering a pump efficiency η = 0.7 and using Equation (4), the energy consumption for the old DMA of Efkarpia is assessed at 316.57 MWh/year. For the new DMA, the energy consumption from PS41 is estimated at 248.12 MWh/year. Energy savings transitioning from the old to the new DMA are therefore equal to 68.45 MWh/year. Using Equation (5), the specific energy consumption for the old and new DMAs of Efkarpia is assessed to be equal to 5.013 and 3.929, respectively. Lower specific energy consumption for the new DMA accounts for energy consumption savings for the water supply at a specific flow rate. Reductions in the energy consumption in PS41 are also associated with reductions in GHG emissions. Considering an emission factor for grid electricity in Greece equal to 0.45 kg CO2eq/kWh [65], an energy saving of 68.45 MWh/year due to the transition to the new DMA of Efkarpia saves around 30.8 × 10³ kg of CO2 equivalents per year. Based on the results of the hybrid LCA approach of Stokes and Horvarth [62] and considering that pumping is the dominant cause of GHG emissions in the water supply system of Thessaloniki, the savings in GHG emissions for operating the new DMA of Efkarpia are estimated at 605.09 kg equivalent CO2, 1.052 kg NOx, 0.221 kg PM, and 1.605 kg SOx per day. Based on a simple annualization, these emissions are 220.856 t equivalent CO2, 383.922 kg NOx, 80.826 kg PM, and 585.986 kg SOx.

4. Conclusions

In the present work, GIS technology is combined with hydraulic modeling software to study the hydraulic response of the urban DMA of Efkarpia, located in Thessaloniki, Greece, under different operating conditions of the network. The hydraulic model of the WDN of Efkarpia is set and calibrated for the old DMA, and hydraulic simulations are then performed to investigate and analyze different scenarios of the system’s operation, mainly consisting of different consumptions at the water meters of the DMA throughout the four quadrimesters of a year and different demand patterns. Hydraulic modeling is also conducted for a new DMA of Efkarpia, which is reduced in size, resulting from newly constructed pipes in the area. The hydraulic conditions in the two DMAs are compared in terms of the estimated pressures in the study area, as well as in terms of the energy consumption in the upstream pumping station.
A thorough analysis of the hydraulic system of Efkarpia reveals critical uncertainties in the model calibration, as well as significant benefits gained from restructuring and reorganization of the DMA. The methodology presented is simple and comprehensive to comply with engineering practice, contributing to an improved management of available water reserves, as well as facing existing and common problems of WDNs within the general framework of DMA design and efficient water management. The DMA of Efkarpia is one of the very few zones of the conurbation of Thessaloniki to satisfy the principal design criteria of DMAs and can be used as a pilot study area to be regularly monitored. This will enable the reliable quantification and identification of leakages and unreported bursts in the system, as well as the efficient management of pressure in the DMA, so that the network operates at an optimum level of pressure. This work creates a reliable hydraulic simulation model at a poorly instrumented DMA, incorporating uncertainty in daily water demand variation, and estimates energy savings transitioning to a feasible and more sustainable DMA design.
For all water consumptions studied, the lowest pressures in the old DMA of Efkarpia were assessed in the northern part of the DMA, while the highest pressures were found in the southern part of Efkarpia’s subzone and in the subzone of Efedroupolis. At the southern part of the subzone of Efkarpia, characterized by lower elevations, water pressures during minimum night flow reach 10 atm, increasing energy use and leakages, as well as the frequency of pipe breaks in the system. Pressures at peak demand in the old DMA are significantly reduced compared to those corresponding to minimum water demand, with reductions reaching 73% at high-elevation nodes north of T63 and around 13% at the central part of the subzone of Efkarpia, while average pressure reductions in the zone are estimated around 25.5%. The hydraulic model of the old DMA of Efkarpia was also run with the profiles of daily water demand variation extracted using data from the SMART-WATER research project, where fifty smart meters were installed in two different areas of the city of Thessaloniki (the city center and eastern part) with water consumption registered every hour. For the profile of the city center of Thessaloniki, nodal pressures in the system assessed during the time of peak demand are up to 62.7% lower than those of the reference demand profile, while the average pressure reduction among all nodes of the WDN is about 10.5%.
The new DMA of Efkarpia, resulting from newly constructed pipes, as well as annulled pipes in the area, which ensure that the lower elevation area of the district will be directly supplied from another head tank of the system, offers significant advantages in the hydraulic operation of the system, gaining an increase in pressure at nodes where low pressures are observed in the old DMA, reduction in daily pressure variation at all system nodes, and a quite significant reduction in energy consumption at the pumping station upstream the head tank of Efkarpia. Peak demand nodal pressures in the new DMA of Efkarpia increase by more than 14% on average, compared to estimates in the old DMA, while the pressure increases at critical nodes in the central part of the WDN reach 27%. Daily pressure variations at the nodes of the new DMA are significantly reduced compared to the old DMA, with maximum reductions assessed around 45%. In the new DMA, the energy savings in the pumping station upstream of the head tank of Efkarpia are estimated at 21.6%. Energy savings transitioning from the old to the new DMA are assessed to be equal to 68.45 MWh/year, leading to savings of 30.8 × 10³ kg of CO2 equivalents per year.
Hydraulic analysis of the WDN of Efkarpia using different operating scenarios revealed large uncertainties in the hydraulic parameters of the network caused by nodal demands. Recognizing these uncertainties, it has been planned to replace all water meters in the study area with smart meters. The latter can provide water consumption data with high temporal resolution for all user types, reducing measurement errors and enabling an accurate assessment of both base demands and demand patterns of all nodes of the system. Reducing the apparent losses of the water network using smart meters, combined with hydraulic modeling techniques, can also significantly assist the detection and reduction of real losses in the system, mainly caused by leakages in pipes and other network elements. The use of smart meters in the Efkarpia district can be accompanied by the application of the Darwin calibrator in WaterGEMs software to robustly calibrate the pipe roughness coefficients, further improving the accuracy of the hydraulic model. The Darwin calibrator performs model calibration using efficient genetic algorithms, presenting multiple calibration candidates, allowing for more reliable calibration solutions to be found.
The new DMA of the Efkarpia district has significantly increased the energy efficiency of the system, producing energy savings due to the reduction in the operation time of the pumping station upstream. However, the energy efficiency of the system could be further increased by obtaining an optimal design and operation of the pumps and scheduling the pumps to operate based on optimal controls. Due to daily or seasonal changes in the system’s demands, fixed-speed pumps could shift to non-efficient operating points. Variable-speed pumps can solve this issue as they enable the maintenance of a fixed pressure for variable flow conditions (or fixed flow for variable pressure conditions), reducing the number of starts and stops, and therefore the exposure of the WDN to water hammers and pipe breaks. The variable-speed drive (VSD) for pumps, as well as the pump curve slope to the required hydraulic conditions of the network, can contribute to the optimal design and operation of a pump or pumping station and therefore to increasing the energy efficiency of the WDN. Shifting the pump operation from the peak-rate period to the mid- and off-peak periods can sometimes offer significant energy savings. Such savings can be achieved when the water distribution system has storage capacity. As the peak-energy-rate period is typically close to that of peak demand, when energy rates are low, the water supply system is characterized by extra capacity used to store the excess water and distribute it during the peak demand interval. This change in the pumps’ operation concept assists in planning their operation in advance, unlike common control strategies, which mainly respond to altering conditions of the system.

Author Contributions

Conceptualization, P.G., I.K. and A.M.; methodology, P.G. and I.K.; software, P.G. and M.R.; validation P.G., P.S., M.R., C.A. and F.I.; formal analysis, P.G. and P.S.; investigation, P.G., C.A. and F.I.; resources, P.G., D.S., C.A. and F.I.; data curation, P.G., D.S. and M.R.; writing—original P.G. and P.S.; writing—review and editing, P.G., P.S., D.S. and I.K.; visualization, P.G. and P.S.; supervision, P.G., I.K. and A.M.; project administration, P.G., I.K. and A.M. All authors have read and agreed to the published version of the manuscript.

Funding

This research received no external funding.

Institutional Review Board Statement

Not applicable.

Informed Consent Statement

Not applicable.

Data Availability Statement

The datasets presented in this article are not readily available because of privacy and legal issues.

Acknowledgments

Michail Raouzaios participated in this research while conducting his MSc thesis in the Specialised Master on Drinking Water and Sewerage (Mastère Spécialisé Eau Potable et Assainissement (EPA)) of the National School for Water and Environmental Engineering of Strasbourg (École Nationale du Génie de l’Eau et de l’ Environnement de Strasbourg (ENGEES)). The support of EYATH S.A. for the provision of the required data is gratefully acknowledged. The support of Hydromanagement Consulting Engineers Ltd. in developing emergency scenarios of network operation for the aqueducts of Thessaloniki city is sincerely acknowledged. Special thanks to our colleagues Ioanna Papadopoulou and Chryssa Kotsampoidou for assisting us with data collection. This article is a revised and expanded version of a paper entitled “Hydraulic Simulation of an Urban DMA under Different Operating Conditions. The case of Efkarpia district in Thessaloniki, Greece”, which was presented at the IAHR 2024 World Conference.

Conflicts of Interest

Panagiota Galiatsatou, Panagiota Stournara, Ioannis Kavouras, Dimitrios Spyrou and Alexandros Mentes are employees of EYATH S.A. company. Christos Anastasiadis and Filippos Iosifidis are employees of Hydromanagement Consulting Engineers Ltd. The remaining authors declare that the research was conducted in the absence of any commercial or financial relationships that could be construed as a potential conflict of interest.

References

  1. Kanakoudis, V.; Tsitsifli, S. Integrated Management of Urban Water Distribution Networks; Open Academic Editions; Kallipos: Athens, Greece, 2015; Available online: https://repository.kallipos.gr/handle/11419/3415 (accessed on 13 December 2023). (In Greek)
  2. Morrison, J.; Tooms, S.; Rogers, D. District Metered Areas Guidance Notes; Specialist group on efficient operation and management of urban water distribution systems, Water Loss Task Force; International Water Association (IWA): London, UK, 2007. [Google Scholar]
  3. Thornton, J.; Sturm, R.; Kunkel, G. Water Loss Control; McGraw-Hill: New York, NY, USA, 2008. [Google Scholar]
  4. Marzola, I.; Alvisi, S.; Franchini, M. Analysis of MNF and FAVAD model for leakage characterization by exploiting smart-metered data: The case of the Gorino Ferrarese (FE-Italy) district. Water 2021, 13, 643. [Google Scholar] [CrossRef]
  5. Gomes, R.; Sousa, J.; Muranho, J.; Marques, A.S. Different design criteria for district metered areas in water distribution networks. Procedia Eng. 2015, 119, 1221–1230. [Google Scholar]
  6. Han, R.; Liu, J. Spectral Clustering and Genetic Algorithm for Design of District Metered Areas in Water Distribution Systems. Procedia Eng. 2017, 186, 152–159. [Google Scholar]
  7. Pesantez, J.E.; Berglund, E.Z.; Mahinthakumar, G. Geospatial and Hydraulic Simulation to Design District Metered Areas for Large Water Distribution Networks. J. Water Resour. Plan. Manag. 2020, 146, 06020010. [Google Scholar]
  8. Chatzivasili, S.; Papadimitriou KKanakoudis, V. Optimizing the formation of DMAs in a water distribution network through advanced modelling. Water 2019, 11, 278. [Google Scholar] [CrossRef]
  9. Brentan, B.M.; Campbell, E.; Meirelles, G.L.; Luvizotto, E.; Izquierdo, J. Social network community detection for DMA creation: Criteria analysis through multilevel optimization. Math. Probl. Eng. 2017, 2017, 9053238. [Google Scholar]
  10. Brentan, B.M.; Carpitella, S.; Izquierdo, J.; Luvizotto Jr, E.; Meirelles, G. District metered area design through multicriteria and multiobjective optimization. Math. Methods Appl. Sci. 2022, 45, 3254–3271. [Google Scholar]
  11. Kowalska, B.; Suchorab, P.; Kowalski, D. Division of district metered areas (DMAs) in a part of water supply network using WaterGEMS (Bentley) software: A case study. Appl. Water Sci. 2022, 12, 166. [Google Scholar]
  12. Machell, J.; Mounce, S.R.; Boxall, J.B. Online modelling of water distribution systems: A UK case study. Drink Water Eng. Sci. 2010, 3, 21–27. [Google Scholar]
  13. Yu-Kun, H.; Chun-Hui, Z.; Yu-Chung, H. A GIS-based water distribution model for Zhengzhou city, China. Water Supply 2011, 11, 497–503. [Google Scholar]
  14. Alves, Z.; Muranho, J.; Albuquerque, T.; Ferreira, A. Water distribution network’s modeling and calibration. A case study based on scarce inventory data. Procedia Eng. 2014, 70, 31–40. [Google Scholar]
  15. Soldi, D.; Candelieri, A.; Archetti, F. Resilience and vulnerability in urban water distribution networks through network theory and hydraulic simulation. Procedia Eng. 2015, 119, 1259–1268. [Google Scholar]
  16. Kara, S.; Karadirek, I.E.; Muhammetoglu, A.; Muhammetoglu, H. Hydraulic Modeling of a Water Distribution Network in a Tourism Area with Highly Varying Characteristics. Procedia Eng. 2016, 162, 521–529. [Google Scholar]
  17. Galiatsatou, P.; Ganoulis, P.; Malamataris, D.; Prinos, P. Estimating and reducing leakages in the water distribution networks of small settlements: The case of Agios Germanos in the Prespes Municipality. Water 2024, 16, 2127. [Google Scholar] [CrossRef]
  18. Mentes, A.; Galiatsatou, P.; Spyrou, D.; Samaras, A.; Stournara, P. Hydraulic simulation and analysis of an urban center’s aqueducts using emergency scenarios for network operation: The case of Thessaloniki City in Greece. Water 2020, 12, 1627. [Google Scholar] [CrossRef]
  19. Mekonnen, Y.A. Evaluation of hydraulic performances modeling of water distribution systems and physicochemical water quality analysis, in the case of Dangila town, Amhara region, Ethiopia. Water Conserv. Sci. Eng. 2022, 7, 247–265. [Google Scholar]
  20. Kuma, T.; Abate, B. Evaluation of hydraulic performance of water distribution system for sustainable management. Water Resour. Manag. 2021, 35, 5259–5273. [Google Scholar]
  21. Obura, D.; Kimera, D.; Dadebo, D. Application of GIS and hydraulic modeling for sustainable management of water supply networks: A pathway for achieving sustainable development goal (SDG) 6. Process Integr. Optim. Sustain. 2024, 8, 1017–1034. [Google Scholar]
  22. Dongare, P.; Sharma, K.V.; Kumar, V.; Mathew, A. Water distribution system modelling of GIS-remote sensing and EPANET for the integrated efficient design. J. Hydroinform. 2024, 26, 567–588. [Google Scholar]
  23. Boulos, P.F.; Jacobsen, L.B.; Heath, J.E.; Kamojjala, S.R.I. Real-time modeling of water distribution systems: A case study. J. Am. Water Works Assoc. 2014, 106, E391–E401. [Google Scholar]
  24. Shafiee, M.E.; Rasekh, A.; Sela, L.; Preis, A. Streaming smart meter data integration to enable dynamic demand assignment for real-time hydraulic simulation. J. Water Resour. Plan. Manag. 2020, 146, 06020008. [Google Scholar]
  25. Song, R.; Liu, X.; Zhu, B.; Guo, S. Modeling of Water Distribution System Based on Ten-Minute Accuracy Remote Smart Demand Meters. Water 2022, 14, 1934. [Google Scholar] [CrossRef]
  26. Spedaletti, S.; Rossi, M.; Comodi, G.; Cioccolanti, L.; Salvi, D.; Lorenzetti, M. Improvement of the energy efficiency in water systems through water losses reduction using the district metered area (DMA) approach. Sustain. Cities Soc. 2022, 77, 103525. [Google Scholar]
  27. Bentley WaterGEMS. Bentley WaterGEMS V8i Help-Software Manual; Bentley Systems: Watertown, MA, USA, 2011. [Google Scholar]
  28. Childs, C. Interpolating surfaces in ArcGIS Spatial Analyst. ArcUser 2004, 32–35, 32–35. [Google Scholar]
  29. Murayama, Y.; Estoque, R.C. Creating a Digital Elevation Model (DEM): A GIS Lecture Tutorial. Division of Spatial Information Science, Graduate School of Life and Environmental Sciences; National University of Tsukuba: Japan. 2011. Available online: https://giswin.geo.tsukuba.ac.jp/sis/tutorial/Creating%20a%20DEM%20from%20a%20Topographic%20Map_RCEstoque.pdf (accessed on 22 November 2024).
  30. Paluszczyszyn, D. Advanced Modelling and Simulation of Water Distribution Systems with Discontinuous Control Elements. Ph.D. Thesis, Faculty of Technology, School of Engineering and Sustainable Development, De Montfort University, Leicester, UK, 2015. [Google Scholar]
  31. Kang, D.; Lansey, K. Demand and roughness estimation in water distribution systems. J. Water Resour. Plan. Manag. 2011, 137, 20–30. [Google Scholar]
  32. Do, N.C.; Simpson, A.R.; Deuerlein, J.W.; Piller, O. Calibration of water demand multipliers in water distribution systems using genetic algorithms. J. Water Resour. Plan. Manag. 2016, 142, 04016044. [Google Scholar]
  33. Bhave, P.R. Calibrating water distribution network models. J. Environ. Eng. 1988, 114, 120–136. [Google Scholar]
  34. Boulos, P.F.; Wood, D.J. Explicit calculation of pipe-network parameters. J. Hydraul. Eng. 1990, 116, 1329–1344. [Google Scholar]
  35. Ormsbee, L.E. Implicit network calibration. J. Water Resour. Plan. Manag. 1989, 115, 243–257. [Google Scholar]
  36. Kapelan, Z.S.; Savic, D.A.; Walters, G.A. Calibration of water distribution hydraulic models using a Bayesian-type procedure. J. Hydraul. Eng. 2007, 133, 927–936. [Google Scholar]
  37. Koppel, T.; Vassiljev, A. Calibration of a model of an operational water distribution system containing pipes of different age. Adv. Eng. Softw. 2009, 40, 659–664. [Google Scholar]
  38. Dini, M.; Tabesh, M. A new method for simultaneous calibration of demand pattern and Hazen-Williams coefficients in water distribution systems. Water Resour. Manag. 2014, 28, 2021–2034. [Google Scholar]
  39. Zhang, Q.; Zheng, F.; Duan, H.F.; Jia, Y.; Zhang, T.; Guo, X. Efficient numerical approach for simultaneous calibration of pipe roughness coefficients and nodal demands for water distribution systems. J. Water Resour. Plan. Manag. 2018, 144, 04018063. [Google Scholar]
  40. Beal, C.; Stewart, R.; Giurco, D.; Panuwatwanich, K. Intelligent metering for urban water planning and management. In Water Efficiency in Buildings: Theory and Practice; Adeyeye, K., Ed.; John Wiley & Sons, Ltd.: West Sussex, UK, 2014; pp. 129–146. [Google Scholar]
  41. Mourtzios, C.; Kourtesis, D.; Papadimitriou, N.; Antzoulatos, G.; Kouloglou, I.O.; Vrochidis, S.; Kompatsiaris, I. Work- In-Progress: SMART-WATER, a Νovel Τelemetry and Remote Control System Infrastructure for the Management of Water Consumption in Thessaloniki. Internet of Things, Infrastructures and Mobile Applications. In Interactive Mobile Communication, Technologies and Learning, Proceedings of the 13th IMCL Conference, Thessaloniki, Greece, 31 October–1 November 2019; Springer Nature: Cham, Switzerland, 2019; pp. 962–970. [Google Scholar]
  42. Antzoulatos, G.; Mourtzios, C.; Stournara, P.; Kouloglou, I.O.; Papadimitriou, N.; Spyrou, D.; Mentes, A.; Nikolaidis, E.; Karakostas, A.; Kourtesis, D.; et al. Making urban water smart: The SMART-WATER solution. Water Sci. Technol. 2020, 82, 2691–2710. [Google Scholar]
  43. Mentes, A.; Stournara, P.; Spyrou, D. Towards smart infrastructure: A case study in the water supply system of Thessaloniki. In Proceedings of the 11th European Young Water Professionals Conference IWA YWP, Prague, Czech Republic, 1–5 October 2019; pp. 513–519. [Google Scholar]
  44. Mentes, A.; Stournara, P.; Spyrou, D.; Samaras, A.; Galiatsatou, P. The Smart-Water project: Smart metering in the city of Thessaloniki. In Proceedings of the 11th European Young Water Professionals Conference IWA YWP, Prague, Czech Republic, 1–5 October 2019; pp. 505–512. [Google Scholar]
  45. Mentes, A.; Spyrou, D.; Stournara, P.; Galiatsatou, P. Smart-Water project: Software design for processing and managing water metering data. In Proceedings of the 39th IAHR World Congress, Granada, Spain, 19–24 June 2022. [Google Scholar]
  46. Hyndman, R.J.; Athanasopoulos, G. Forecasting: Principles and Practice, 2nd ed.; OTexts: Melbourne, Australia, 2018. [Google Scholar]
  47. Olsson, G. Water and Energy: Threats and Opportunities; IWA Publishing: London, UK, 2012. [Google Scholar]
  48. Tsanov, E.; Ribarova, I.; Dimova, G.; Ninov, P.; Kossida, M.; Makropoulos, C. Water stress mitigation in the Vit River Basin based on WEAP and MatLab simulation. Civ. Eng. J. 2020, 6, 2058–2071. [Google Scholar]
  49. Muhammetoglu, A.; Al-Omari, A.; Al-Houri, Z.; Topkaya, B.; Tumbul, T.; Muhammetoglu, H. Assessment of energy performance and GHG emissions for the urban water cycle toward sustainability. J. Water Clim. Change 2023, 14, 223–238. [Google Scholar]
  50. Wiedmann, T.; Minx, J.A. Definition of ‘Carbon Footprint’. In Ecological Economics Research Trends; Pertsova, C.C., Ed.; Nova Science Publishers: Hauppauge, NY, USA, 2008. [Google Scholar]
  51. Boulos, P.F.; Bros, C.M. Assessing the carbon footprint of water supply and distribution systems. J. Am. Water Work Assoc. 2010, 102, 47–54. [Google Scholar]
  52. Sambito, M.; Freni, G. LCA methodology for the quantification of the carbon footprint of the integrated urban water system. Water 2017, 9, 395. [Google Scholar] [CrossRef]
  53. ISO/TS 14067; Greenhouse Gases-Carbon Footprint of Products-Requirements and Guidelines for Quantification and Communication. International Organization for Standardization, ISO Central Secretariat: Geneve, Switzerland, 2013.
  54. Del Borghi, A.; Strazza, C.; Gallo, M.; Messineo, S.; Naso, M. Water supply and sustainability: Life cycle assessment of water collection, treatment and distribution service. Int. J. Life Cycle Assess. 2013, 18, 1158–1168. [Google Scholar]
  55. Barjoveanu, G.; Comandaru, I.M.; Rodriguez-Garcia, G.; Hospido, A.; Teodosiu, C. Evaluation of water services system through LCA. A case study for Iasi City, Romania. Int. J. Life Cycle Assess. 2014, 19, 449–462. [Google Scholar]
  56. Lane, J.L.; De Haas, D.W.; Lant, P.A. The diverse environmental burden of city-scale urban water systems. Water Res. 2015, 81, 398–415. [Google Scholar]
  57. Delre, A.; ten Hoeve, M.; Scheutz, C. Site-specific carbon footprints of Scandinavian wastewater treatment plants, using the life cycle assessment approach. J. Clean. Prod. 2019, 211, 1001–1014. [Google Scholar]
  58. Zib, L., III; Byrne, D.M.; Marston, L.T.; Chini, C.M. Operational carbon footprint of the US water and wastewater sector’s energy consumption. J. Clean. Prod. 2021, 321, 128815. [Google Scholar]
  59. Ortíz-Rodriguez, O.O.; Sonnemann, G.; Villamizar-G, R.A. The carbon footprint of water treatment as well as sewer and sanitation utilities of Pamplona in Colombia. Environ. Dev. Sustain. 2022, 24, 3982–3999. [Google Scholar]
  60. Liu, J.; Wang, D.; Xiang, C.; Xia, L.; Zhang, K.; Shao, W.; Luan, Q. Assessment of the energy use for water supply in Beijing. Energy Procedia 2018, 152, 271–280. [Google Scholar]
  61. Samuelsson, J.; Delre, A.; Tumlin, S.; Hadi, S.; Offerle, B.; Scheutz, C. Optical technologies applied alongside on-site and remote approaches for climate gas emission quantification at a wastewater treatment plant. Water Res. 2018, 131, 299–309. [Google Scholar] [PubMed]
  62. Stokes, J.R.; Horvath, A. Energy and air emission effects of water supply. Environ. Sci. Technol. 2009, 43, 2680–2687. [Google Scholar]
  63. ECAM. Energy, Performance and Carbon Emissions Assessment and Monitoring Tool. Water and Wastewater Companies for Climate Mitigation. Available online: https://climatesmartwater.org/ecam/ (accessed on 1 January 2024).
  64. Fighir, D.; Teodosiu, C.; Fiore, S. Environmental and energy assessment of municipal wastewater treatment plants in Italy and Romania: A comparative study. Water 2019, 11, 1611. [Google Scholar] [CrossRef]
  65. EIB Project Carbon Footprint Methodologies. Methodologies for the Assessment of Project Greenhouse Gas Emissions and Emission Variations. European Investment Bank. Available online: https://www.eib.org/en/publications/20220215-eib-project-carbon-footprint-methodologies (accessed on 1 January 2024).
  66. Lin, J.L.; Kang, S.F. Analysis of carbon emission hot spot and pumping energy efficiency in water supply system. Water Supply 2019, 19, 200–206. [Google Scholar]
  67. Greyvenstein, B.; Van Zyl, J.E. An experimental investigation into the pressure-leakage relationship of some failed water pipes. J. Water Supply Res. Technol. AQUA 2007, 56, 117–124. [Google Scholar]
  68. Xu, Q.; Chen, Q.; Ma, J.; Blanckaert, K.; Wan, Z. Water saving and energy reduction through pressure management in urban water distribution networks. Water Resour. Manag. 2014, 28, 3715–3726. [Google Scholar] [CrossRef]
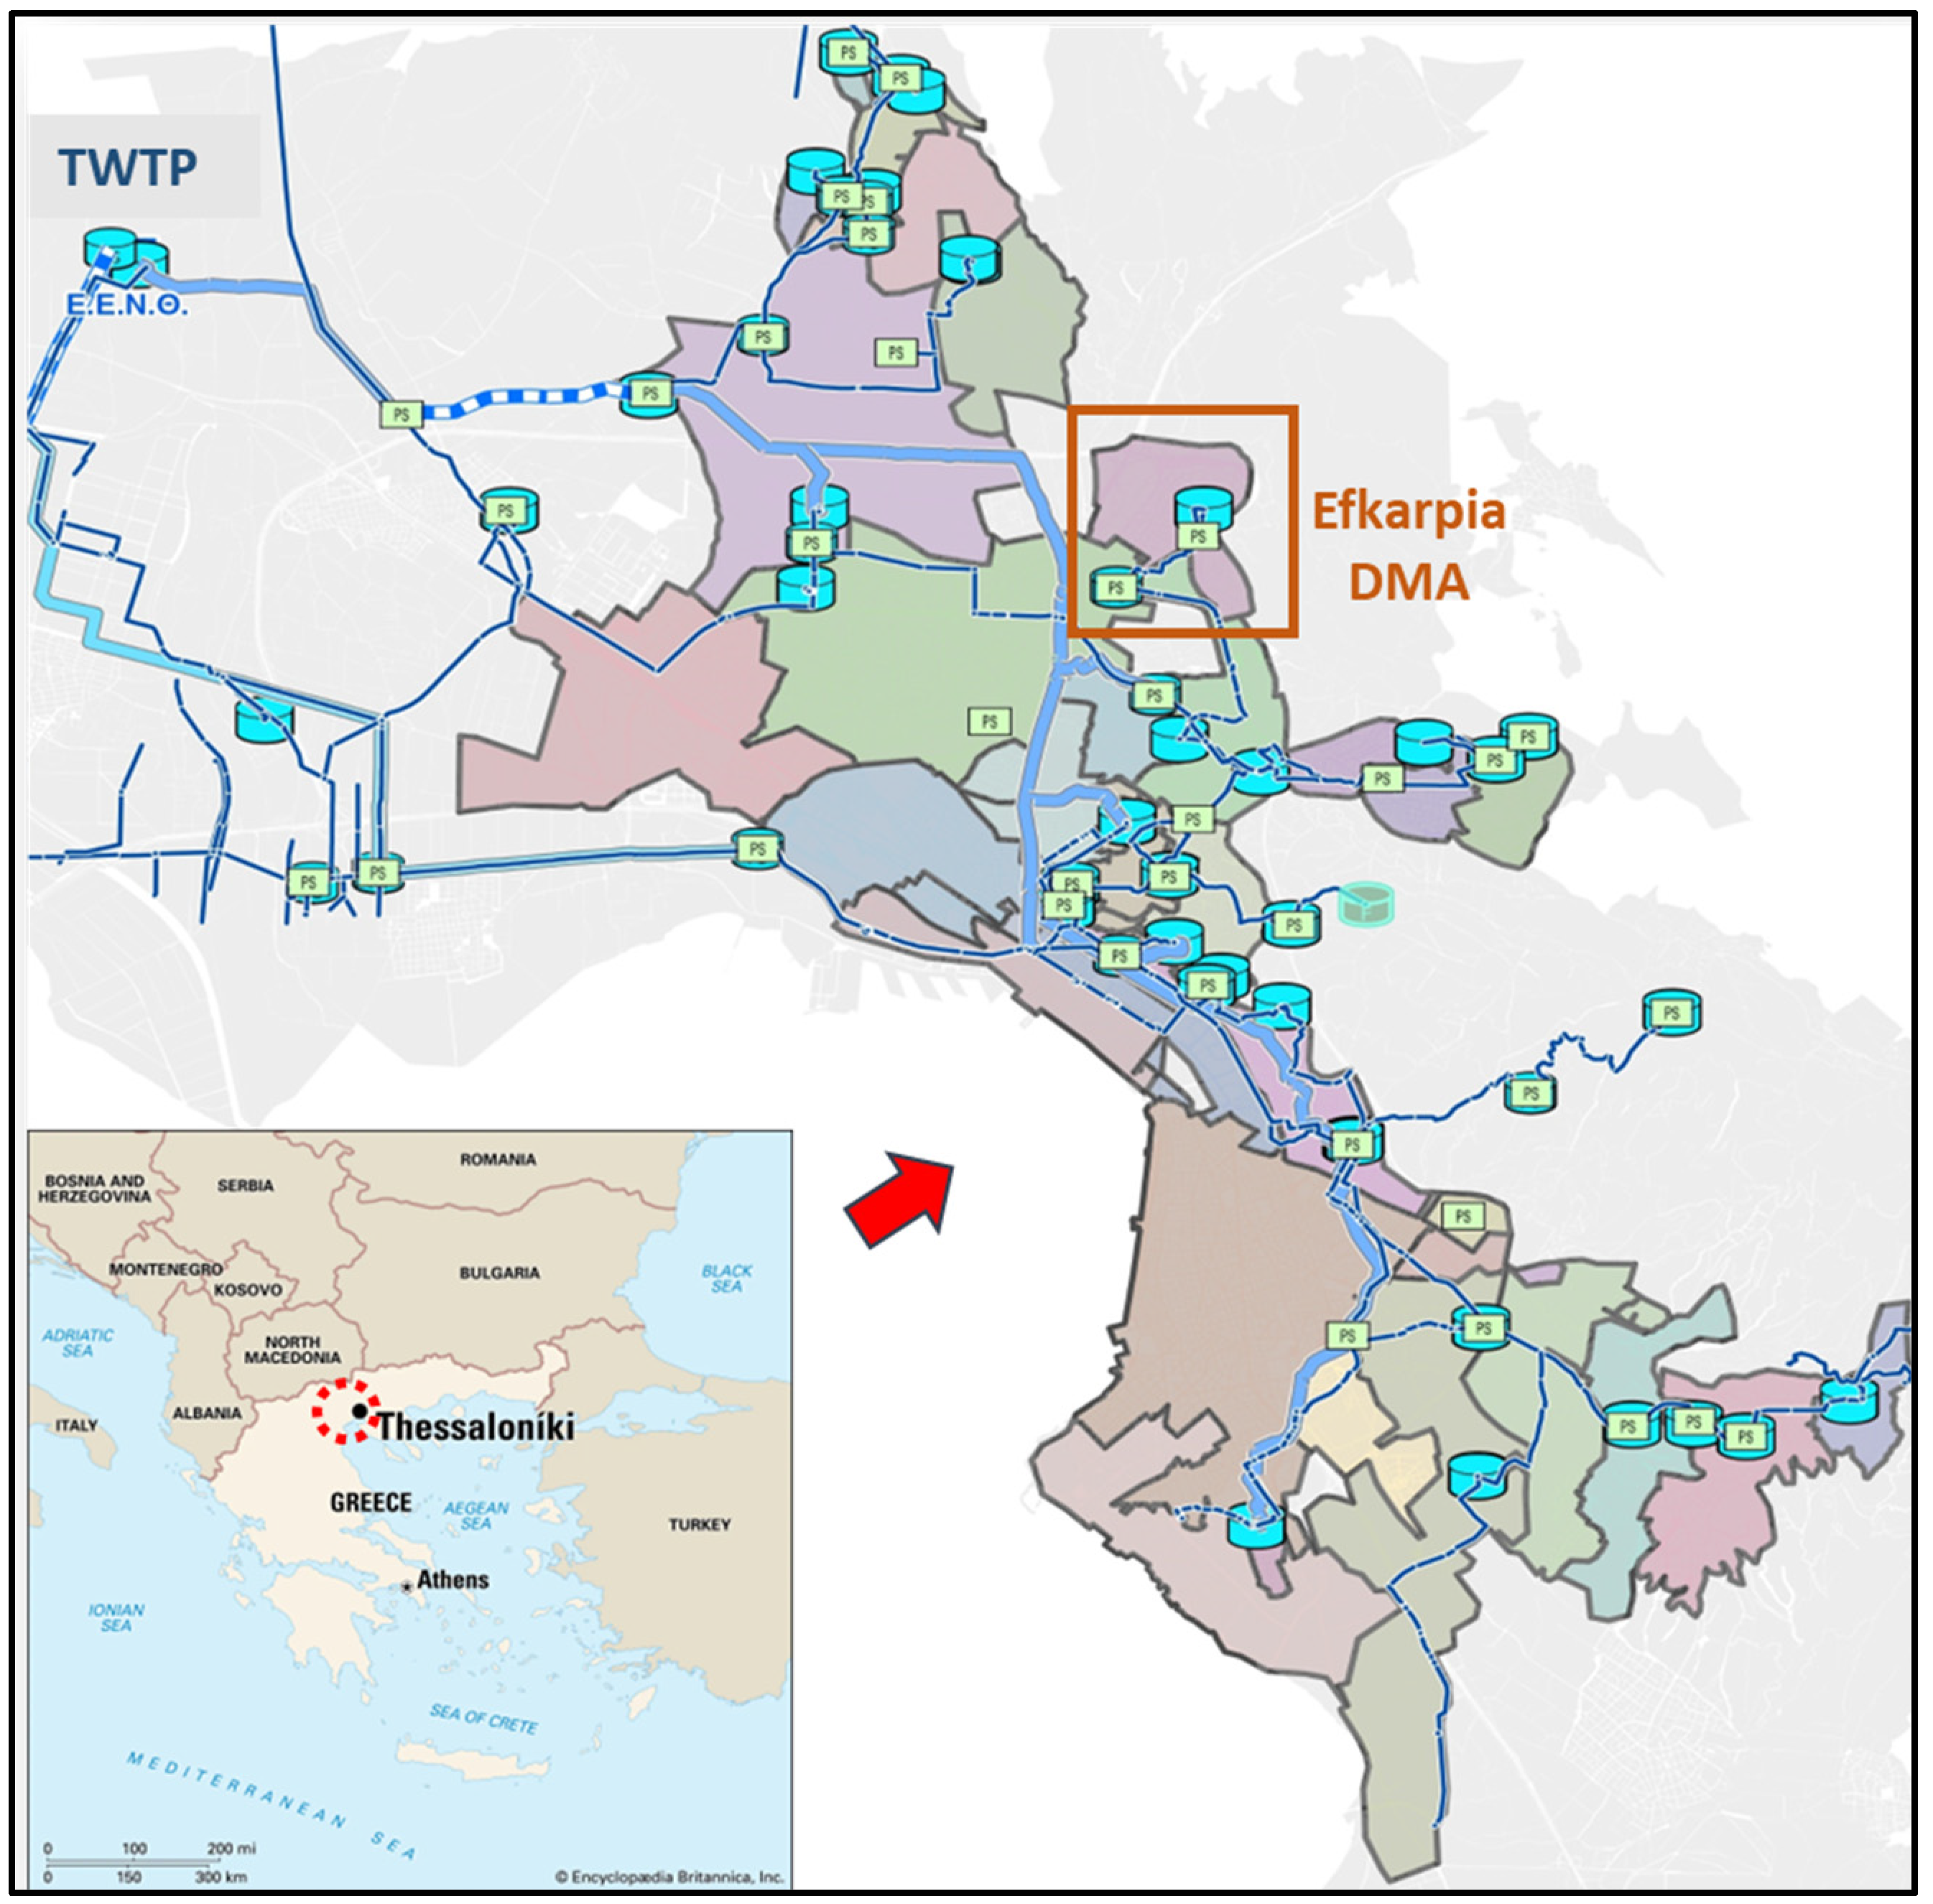
Figure 1. Map of the study region including the tank influence areas (tank zones) in the conurbation of Thessaloniki, Greece, highlighting the (new) DMA of Efkarpia.
Geographies 05 00017 g001
Figure 2. Main elements of the hydraulic system supplying the DMA of Efkarpia.
Geographies 05 00017 g002
Figure 3. Overview of the studied hydraulic system of Efkarpia with its old and new DMAs. The basic hydraulic infrastructure is shown.
Geographies 05 00017 g003
Figure 4. Schematic diagram of the methodology of the work.
Geographies 05 00017 g004
Figure 5. Schematic diagram of GIS processing.
Geographies 05 00017 g005
Figure 6. Daily variation in pressure in the old DMA of Efkarpia for the three quadrimesters of 2019 and 2020 at selected nodes: (a) north of T63, (b) in the central part of the Efkarpia subzone, (c) in the southern part of the Efkarpia subzone, (d) in the subzone of Efedroupolis.
Geographies 05 00017 g006
Figure 7. Color-coded pressures in the hydraulic system of the old DMA of Efkarpia at (a) 0:00 a.m. (minimum night flow) and (b) 6:00 p.m. (time of peak water demand).
Geographies 05 00017 g007
Figure 8. Daily variation in pressure in the old DMA of Efkarpia based on three different profiles of water demand at selected nodes: (a) north of T63, (b) in the central part of the Efkarpia subzone, (c) in the southern part of the Efkarpia subzone, (d) in the subzone of Efedroupolis.
Geographies 05 00017 g008
Figure 9. Pressure variation (a) at selected nodes (b) of the old DMA of Efkarpia for the emergency scenario applied in case of failure in the aqueduct of Aliakmonas.
Geographies 05 00017 g009
Figure 10. Transitioning from the old to the new DMA of the Efkarpia subzone. Color-coded pressures in the hydraulic system of the new DMA correspond to 6:00 p.m.
Geographies 05 00017 g010
Figure 11. Daily variation in pressure for the old and new DMAs of Efkarpia at selected nodes of the WDN: (a) north of T63, (b) in the central part of the Efkarpia subzone close to T63, (c) in the central part of the Efkarpia subzone, and (d) in the Efkarpia subzone close to the newly constructed pipes.
Geographies 05 00017 g011
Figure 12. CDF of (a) maximum daily pressure and (b) daily pressure range for the old and new DMAs of the Efkarpia subzone.
Geographies 05 00017 g012
Disclaimer/Publisher’s Note: The statements, opinions and data contained in all publications are solely those of the individual author(s) and contributor(s) and not of MDPI and/or the editor(s). MDPI and/or the editor(s) disclaim responsibility for any injury to people or property resulting from any ideas, methods, instructions or products referred to in the content.