Recommended Procedures to Assess Critical State Locus from Triaxial Tests in Cohesionless Remoulded Samples
Abstract
:1. Introduction
2. Factors Affecting the Reliability of CSL
2.1. Evolution of the Grain Size Distribution—Crushing
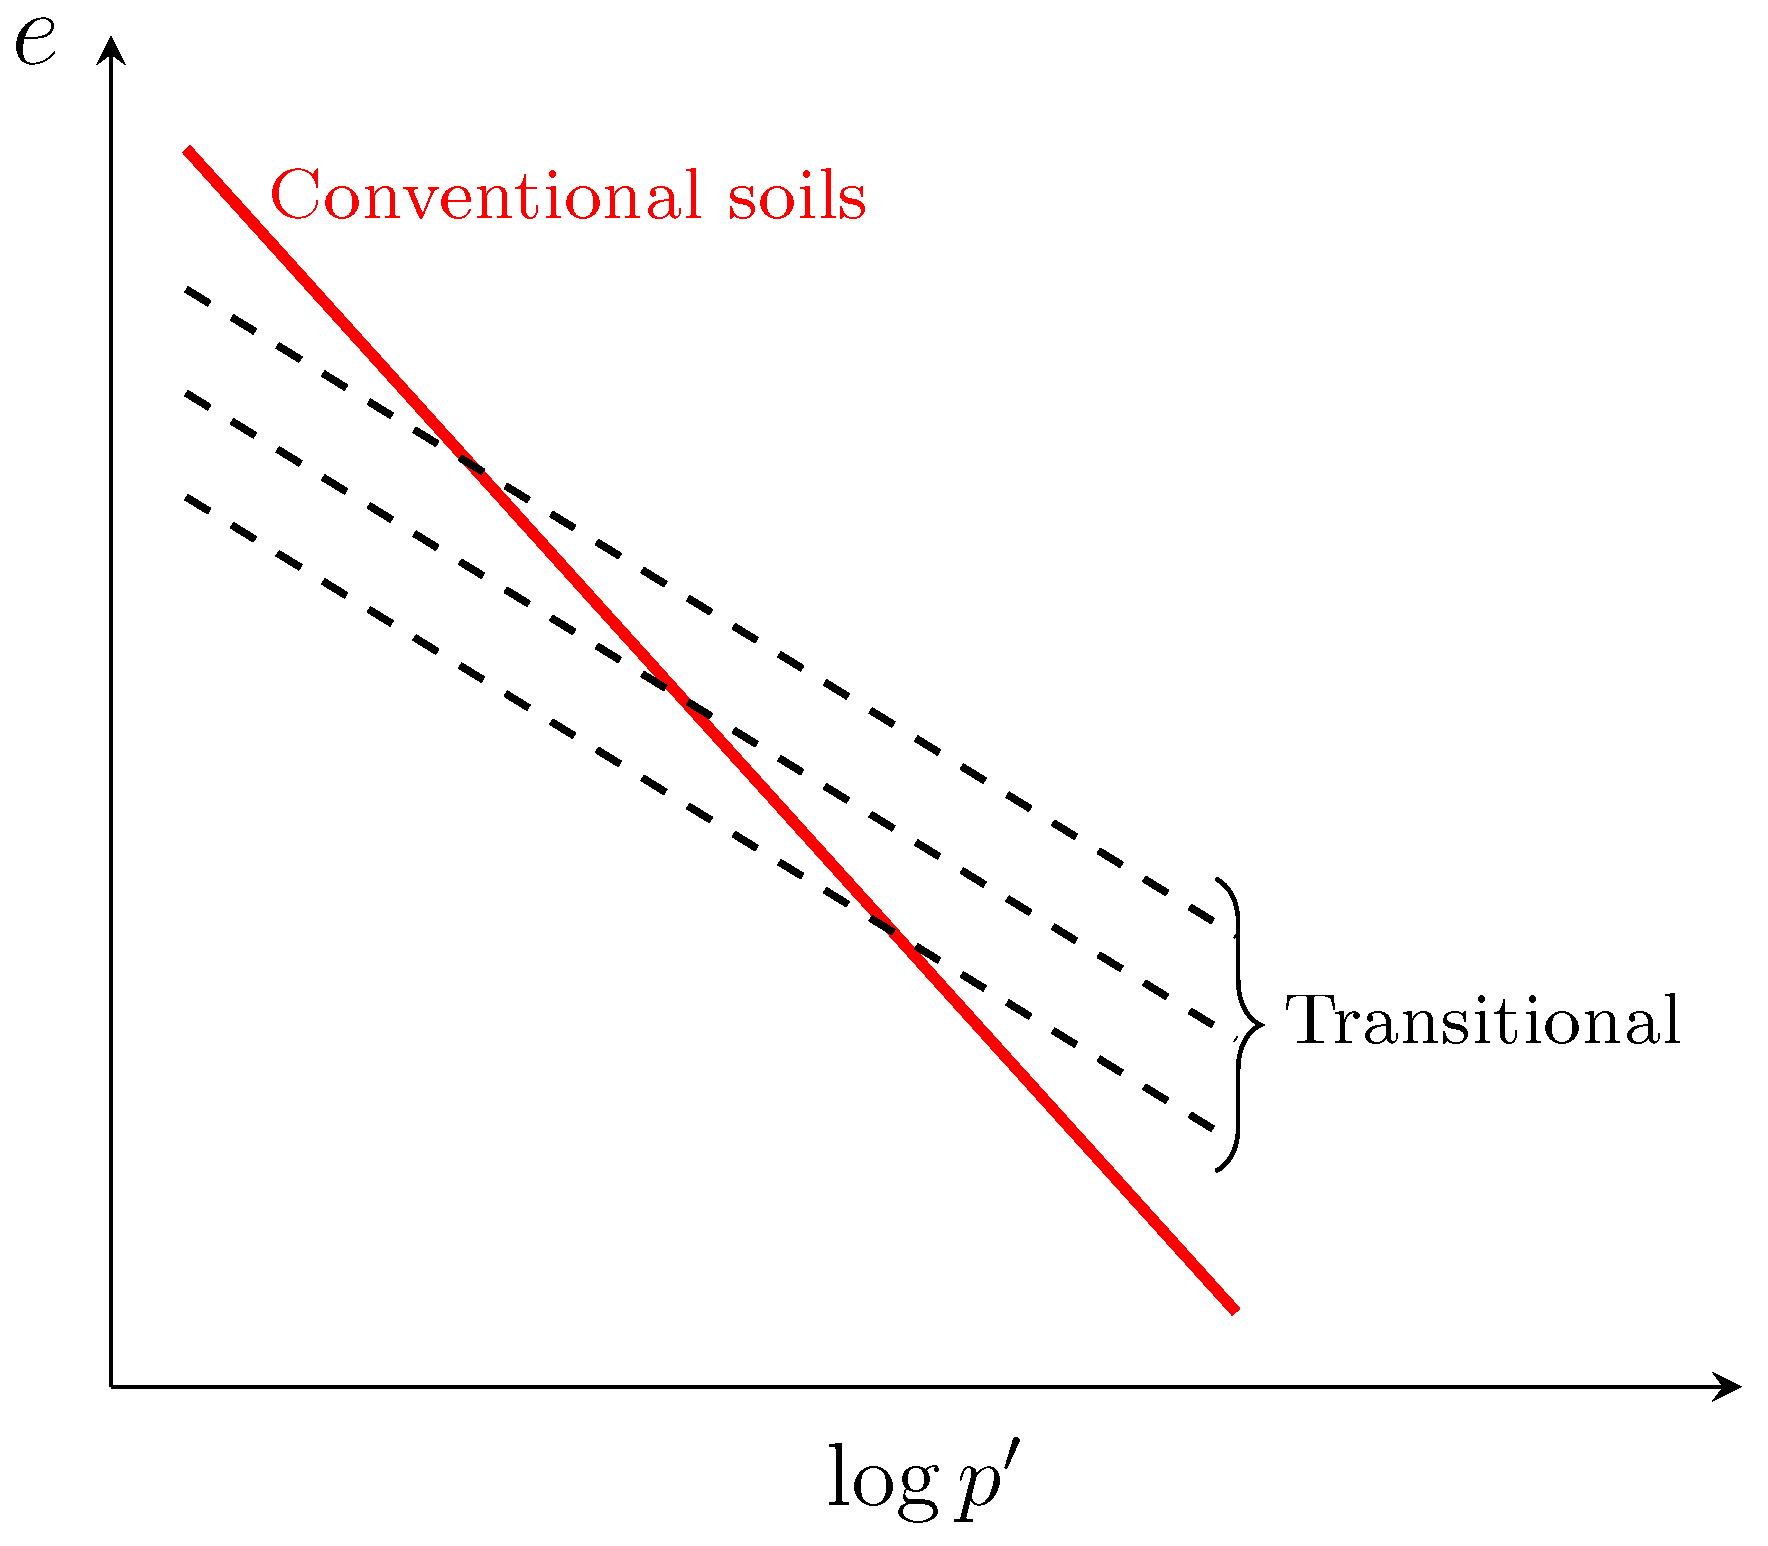
2.2. Transitional Soil Behaviour
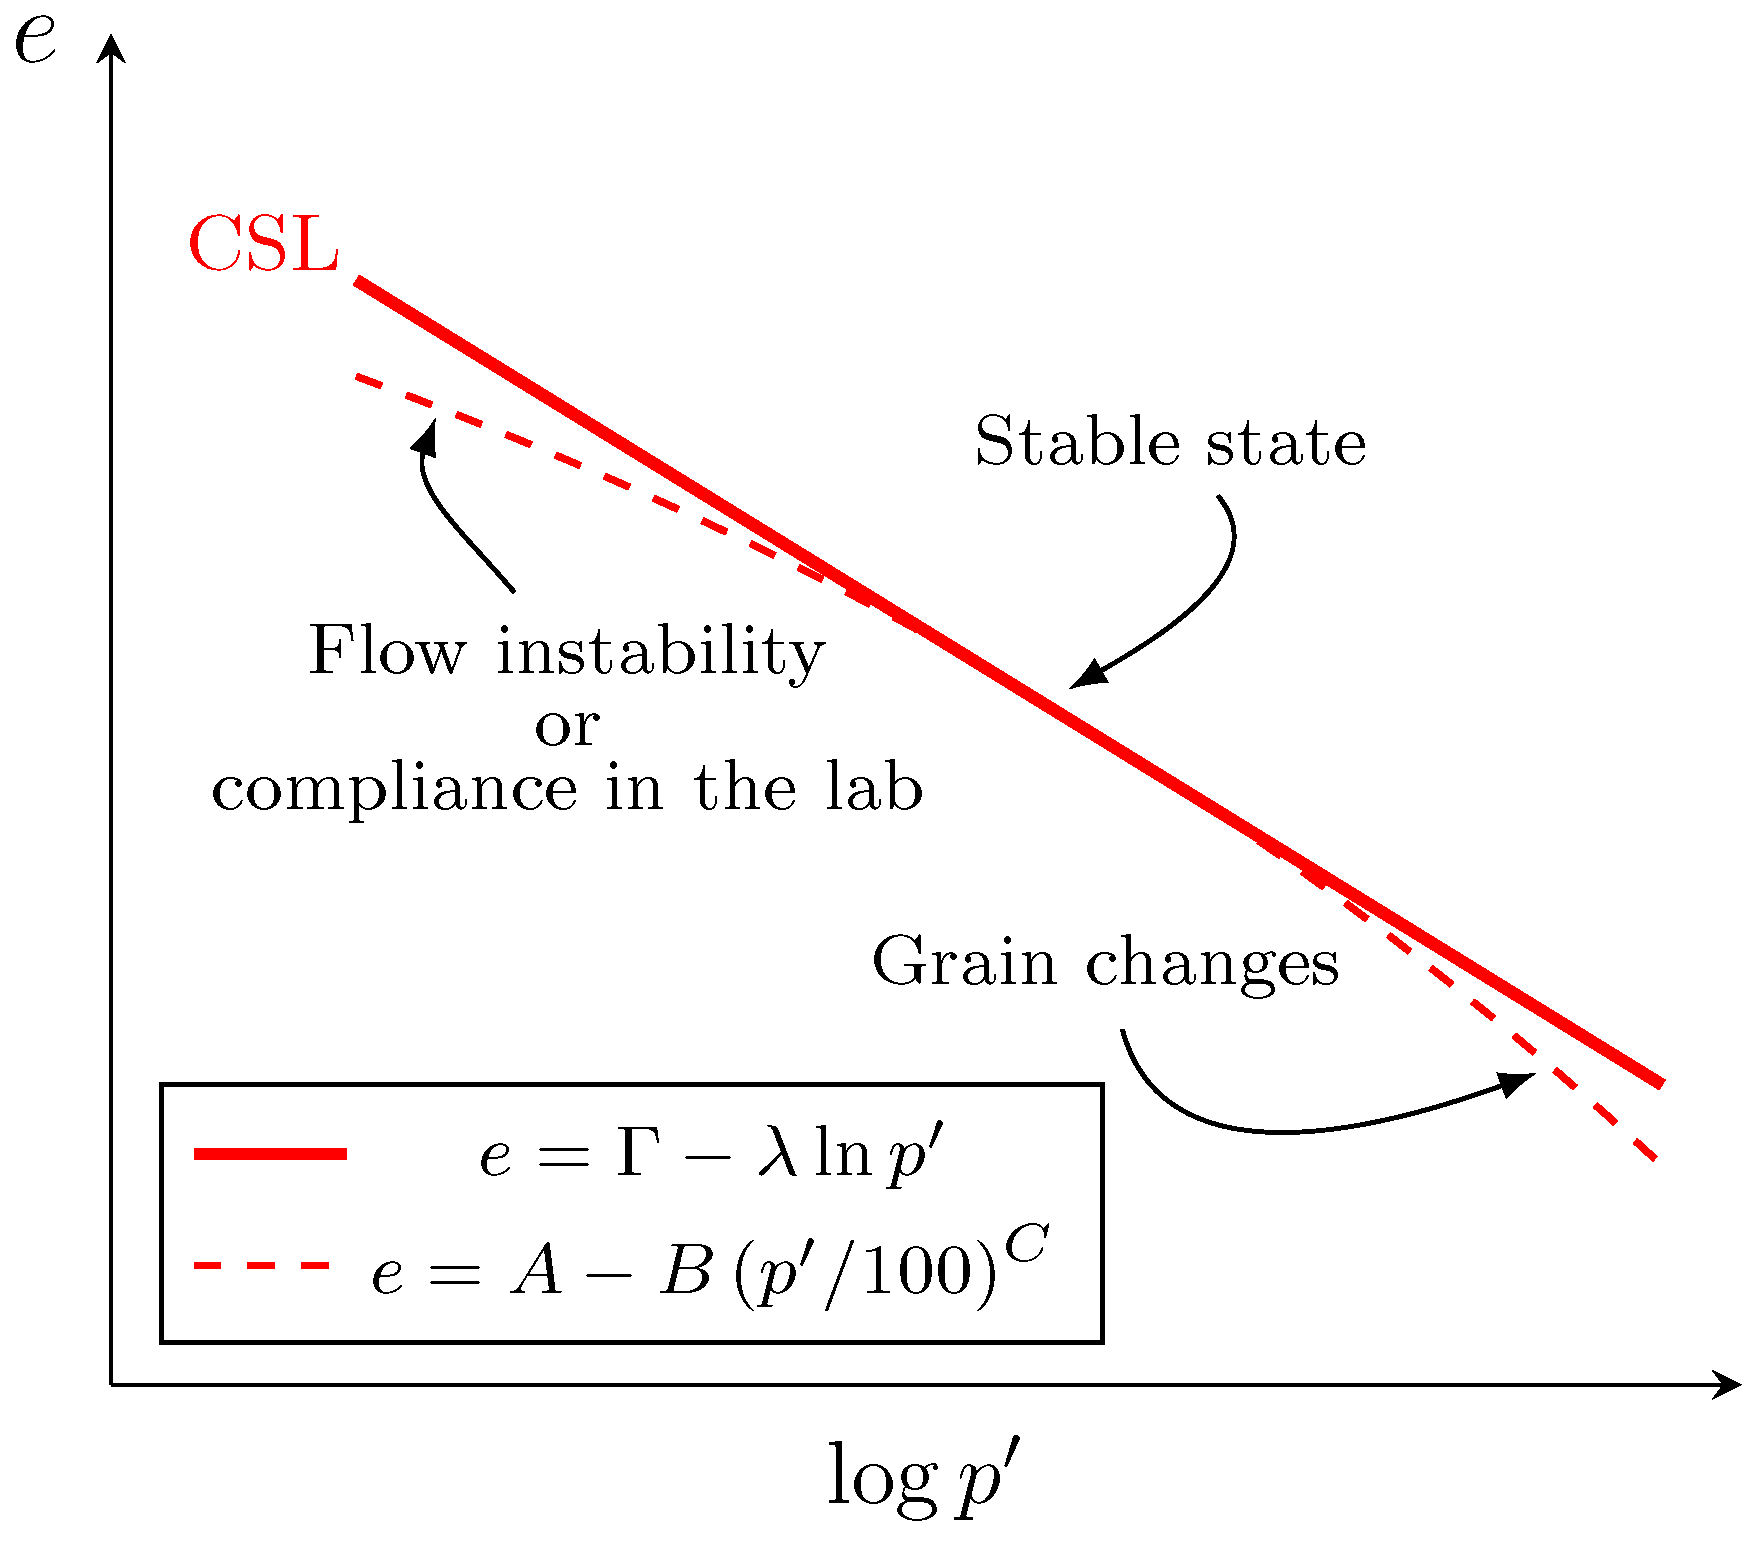
2.3. Non-Linearity of CSL
3. Triaxial Apparatus Improvements for CSL Assessment
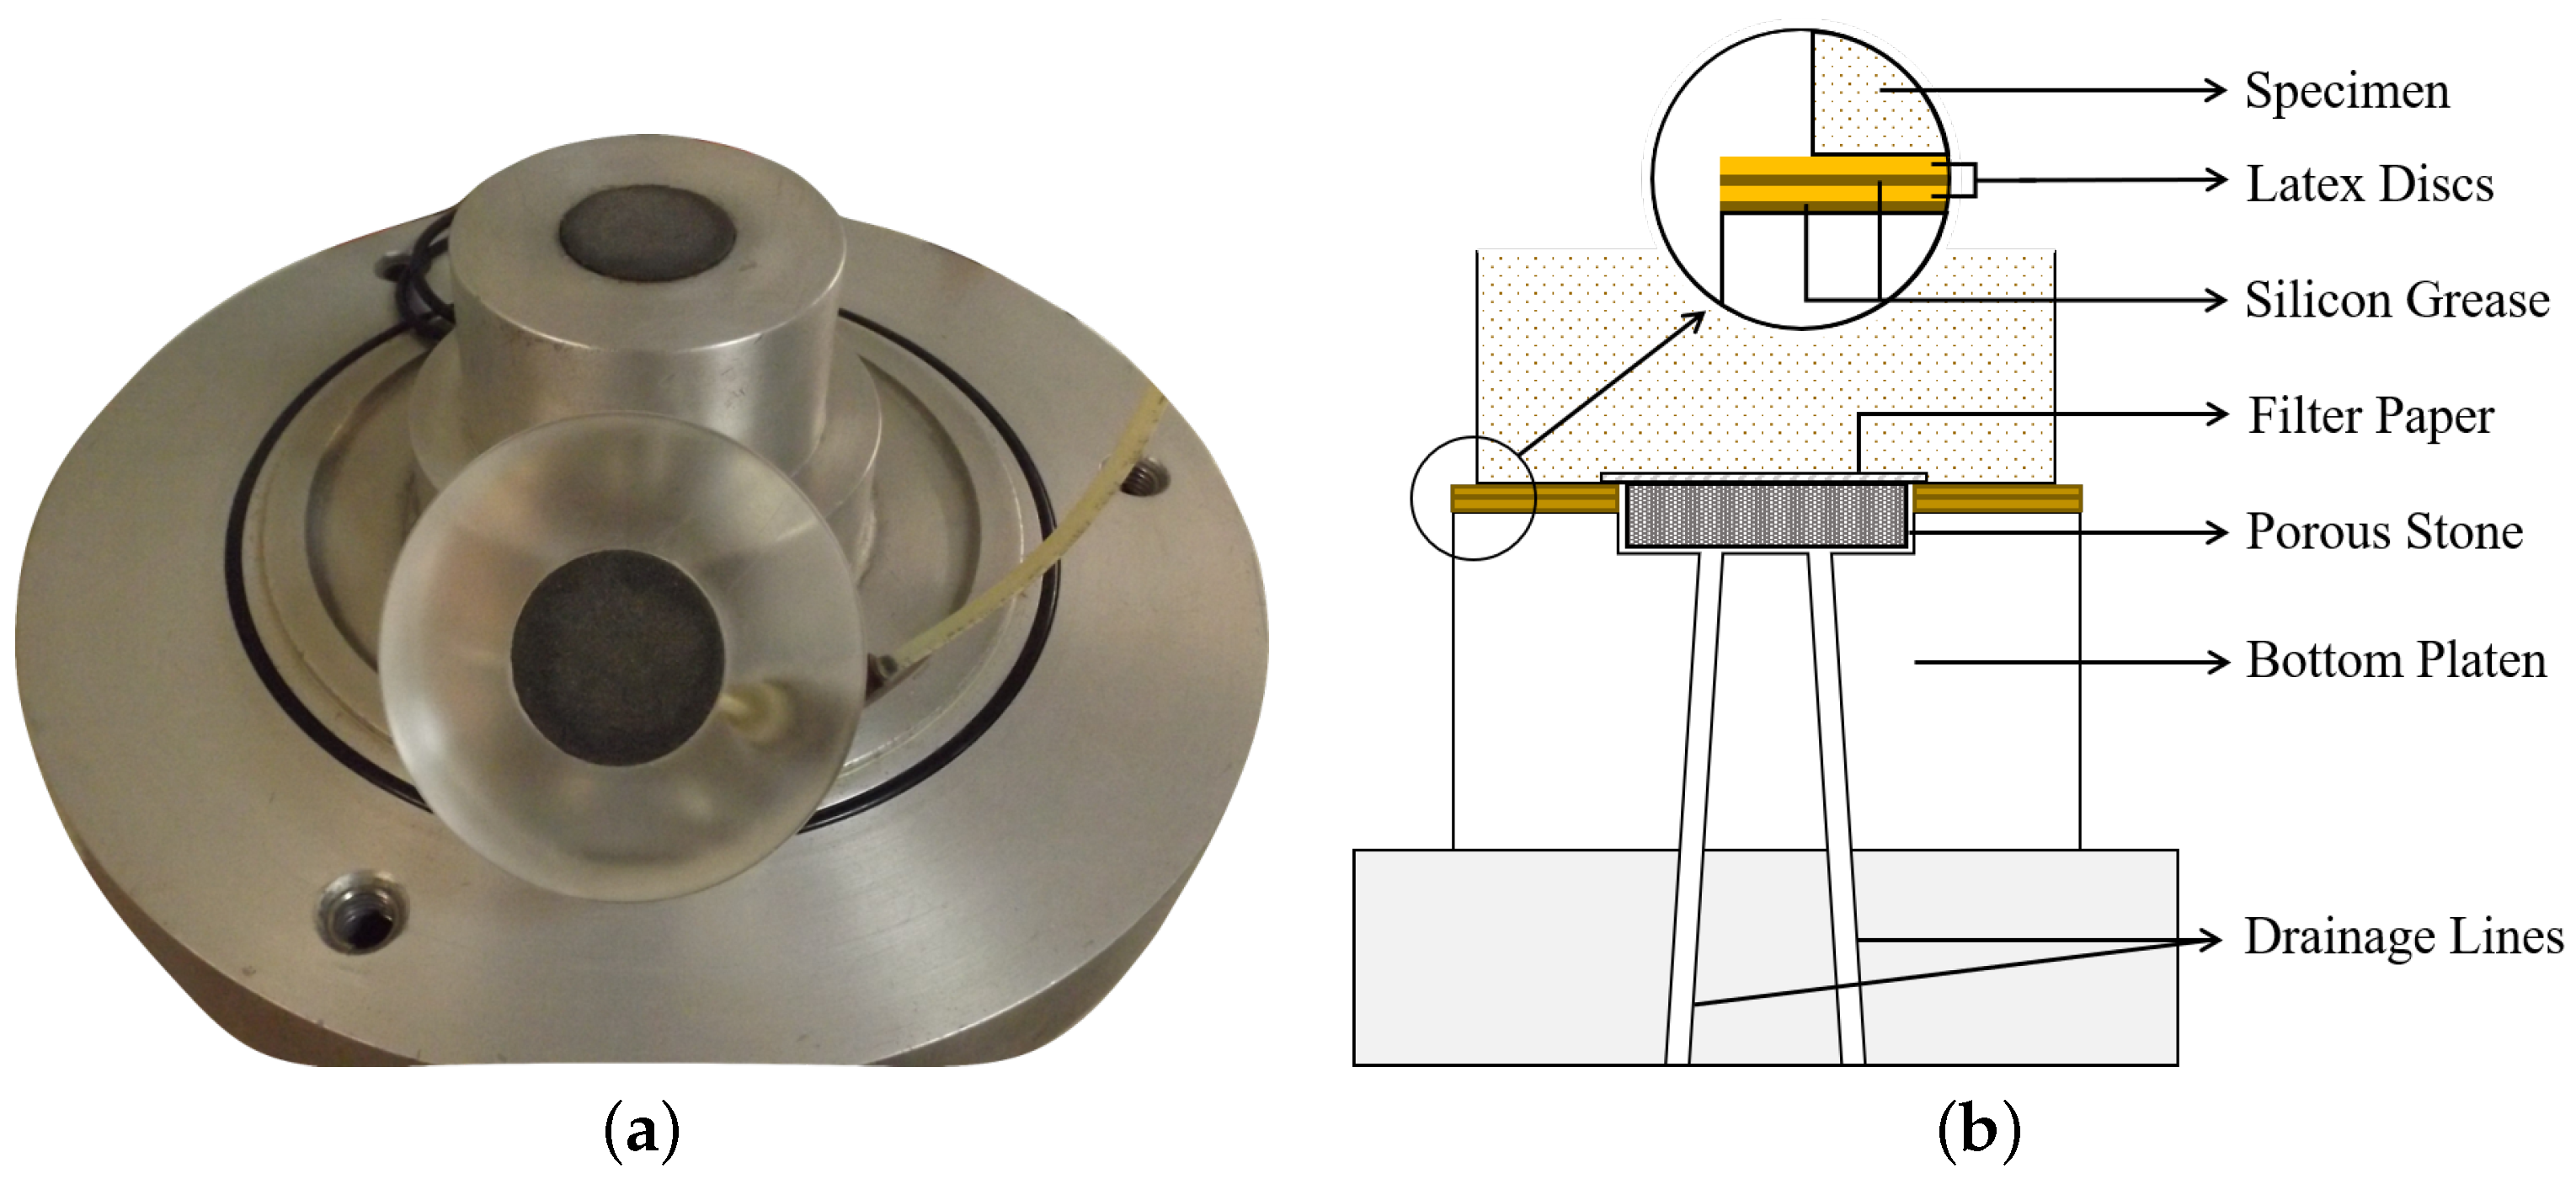
3.1. Oversized Lubricated End Platens
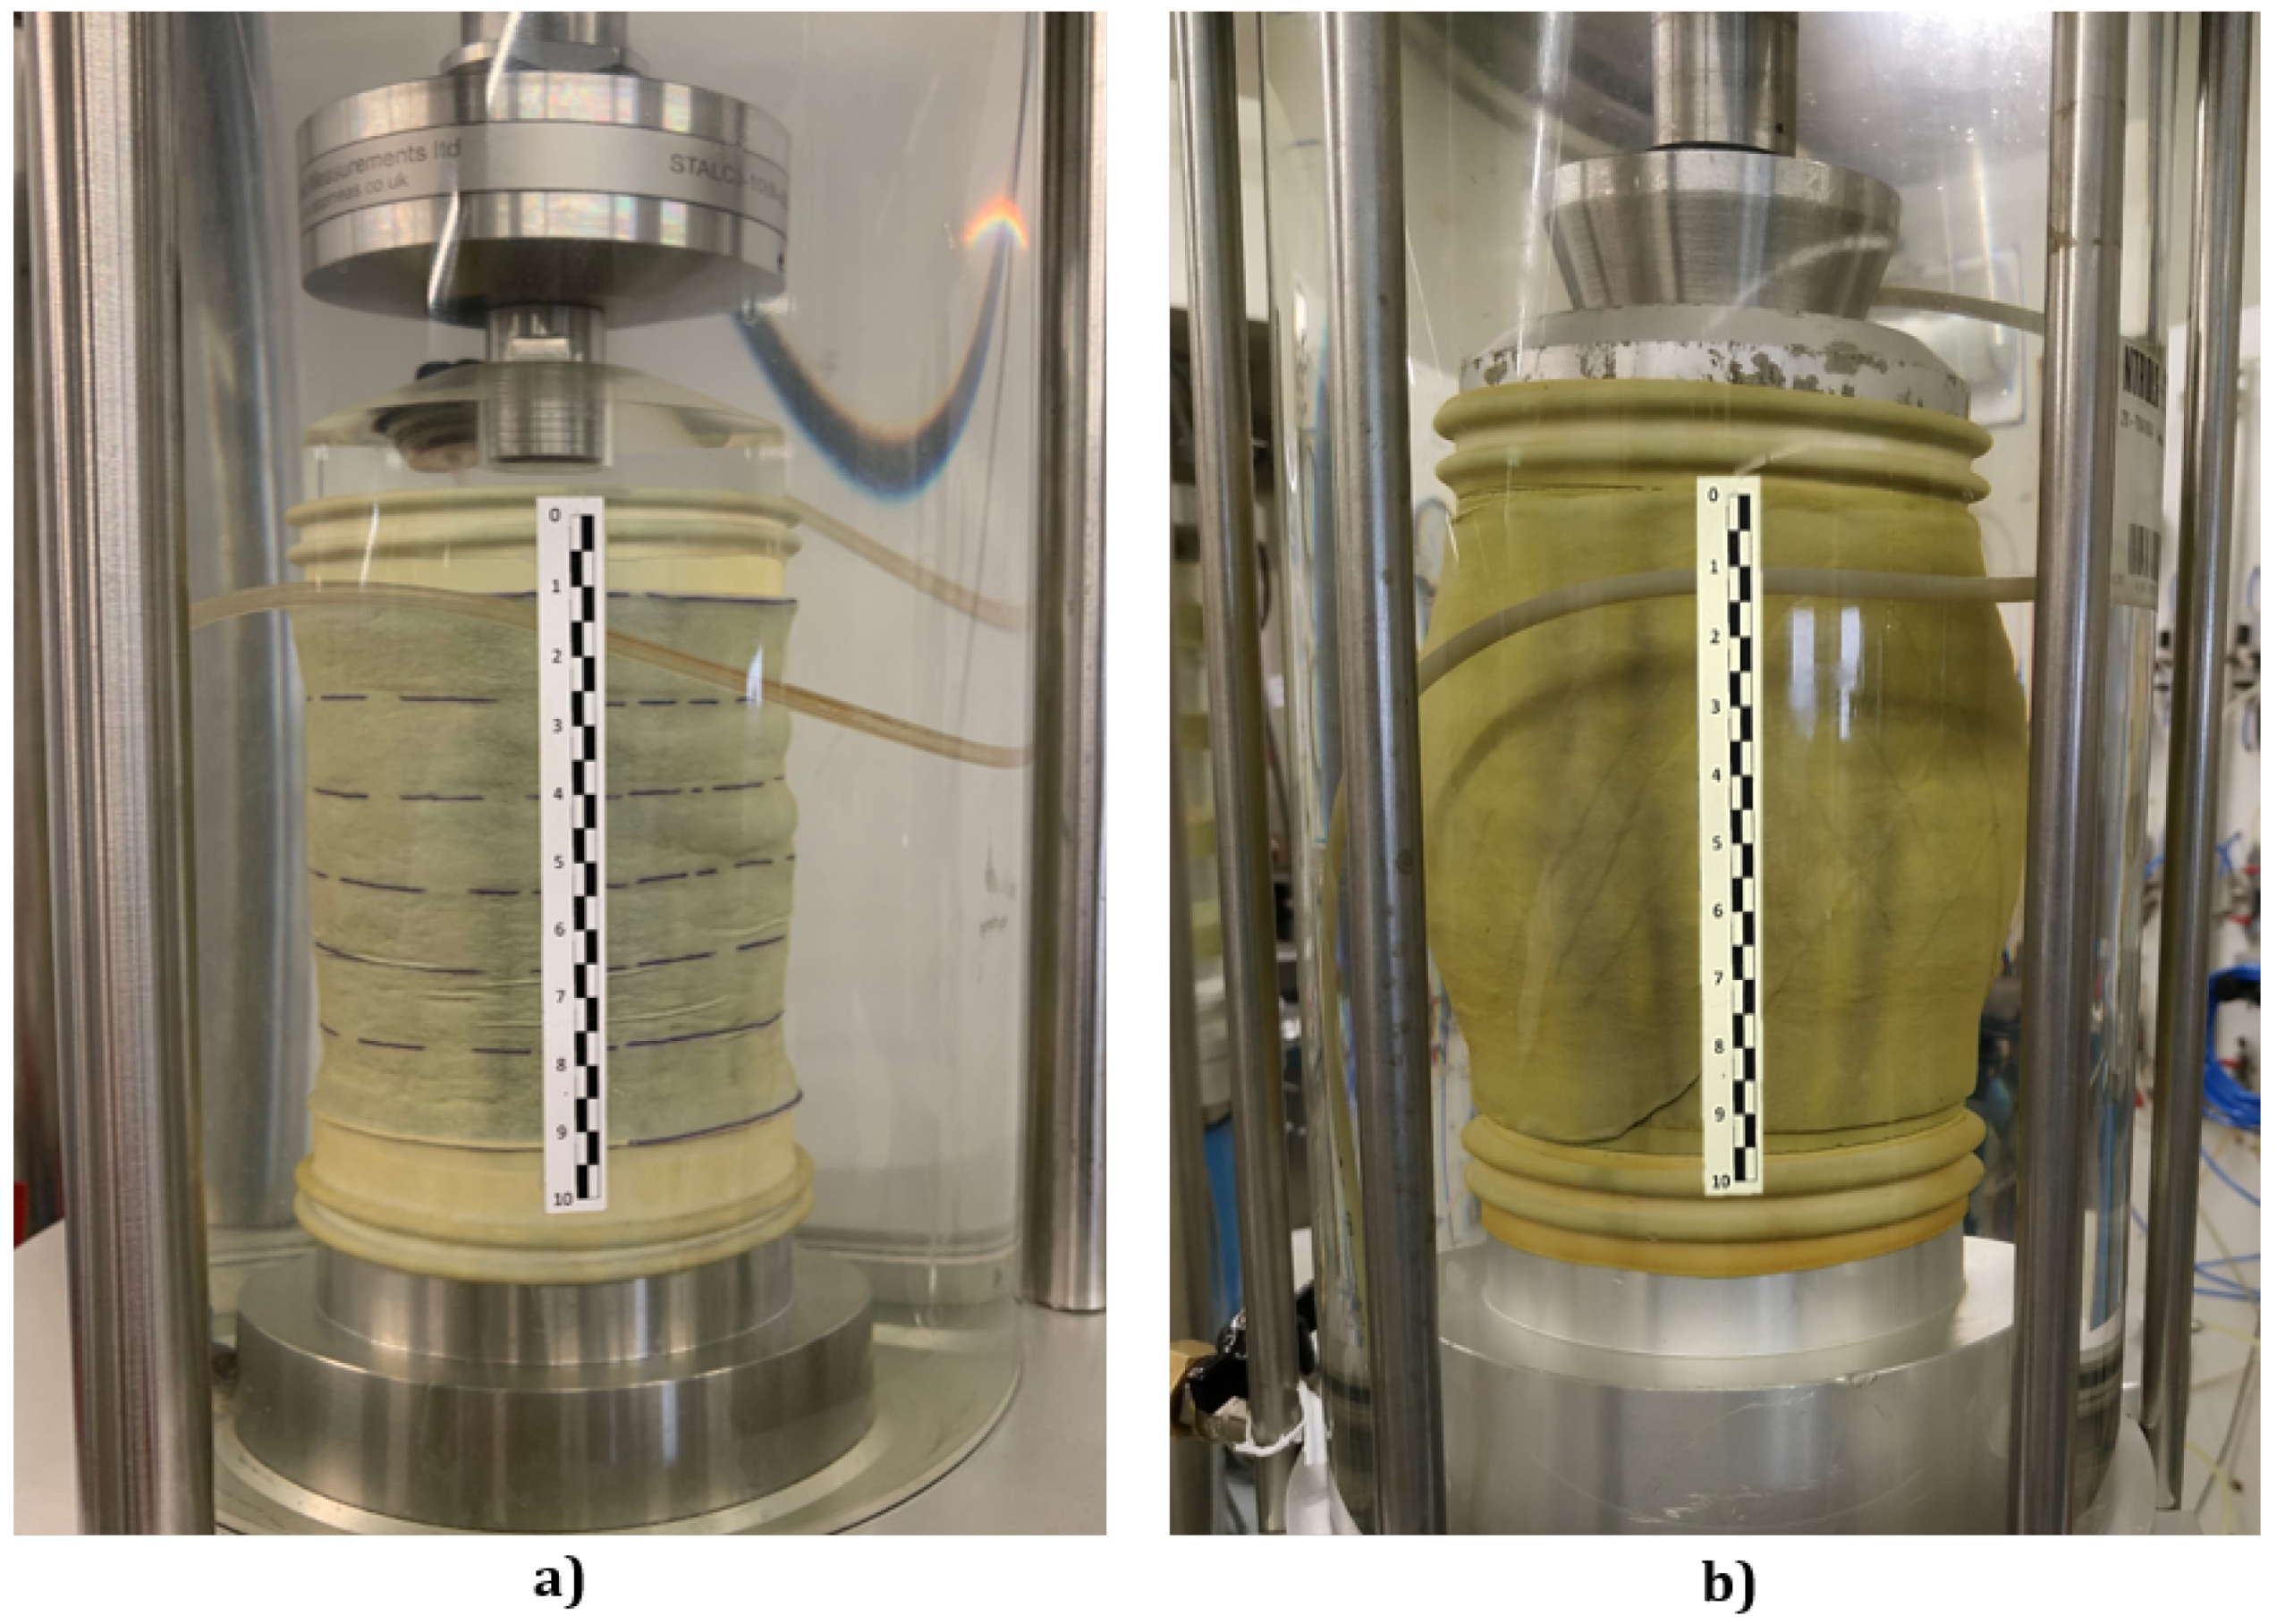
3.2. Top-Cap Loading Ram Connection
4. Specimen Preparation Method
4.1. Sample Size
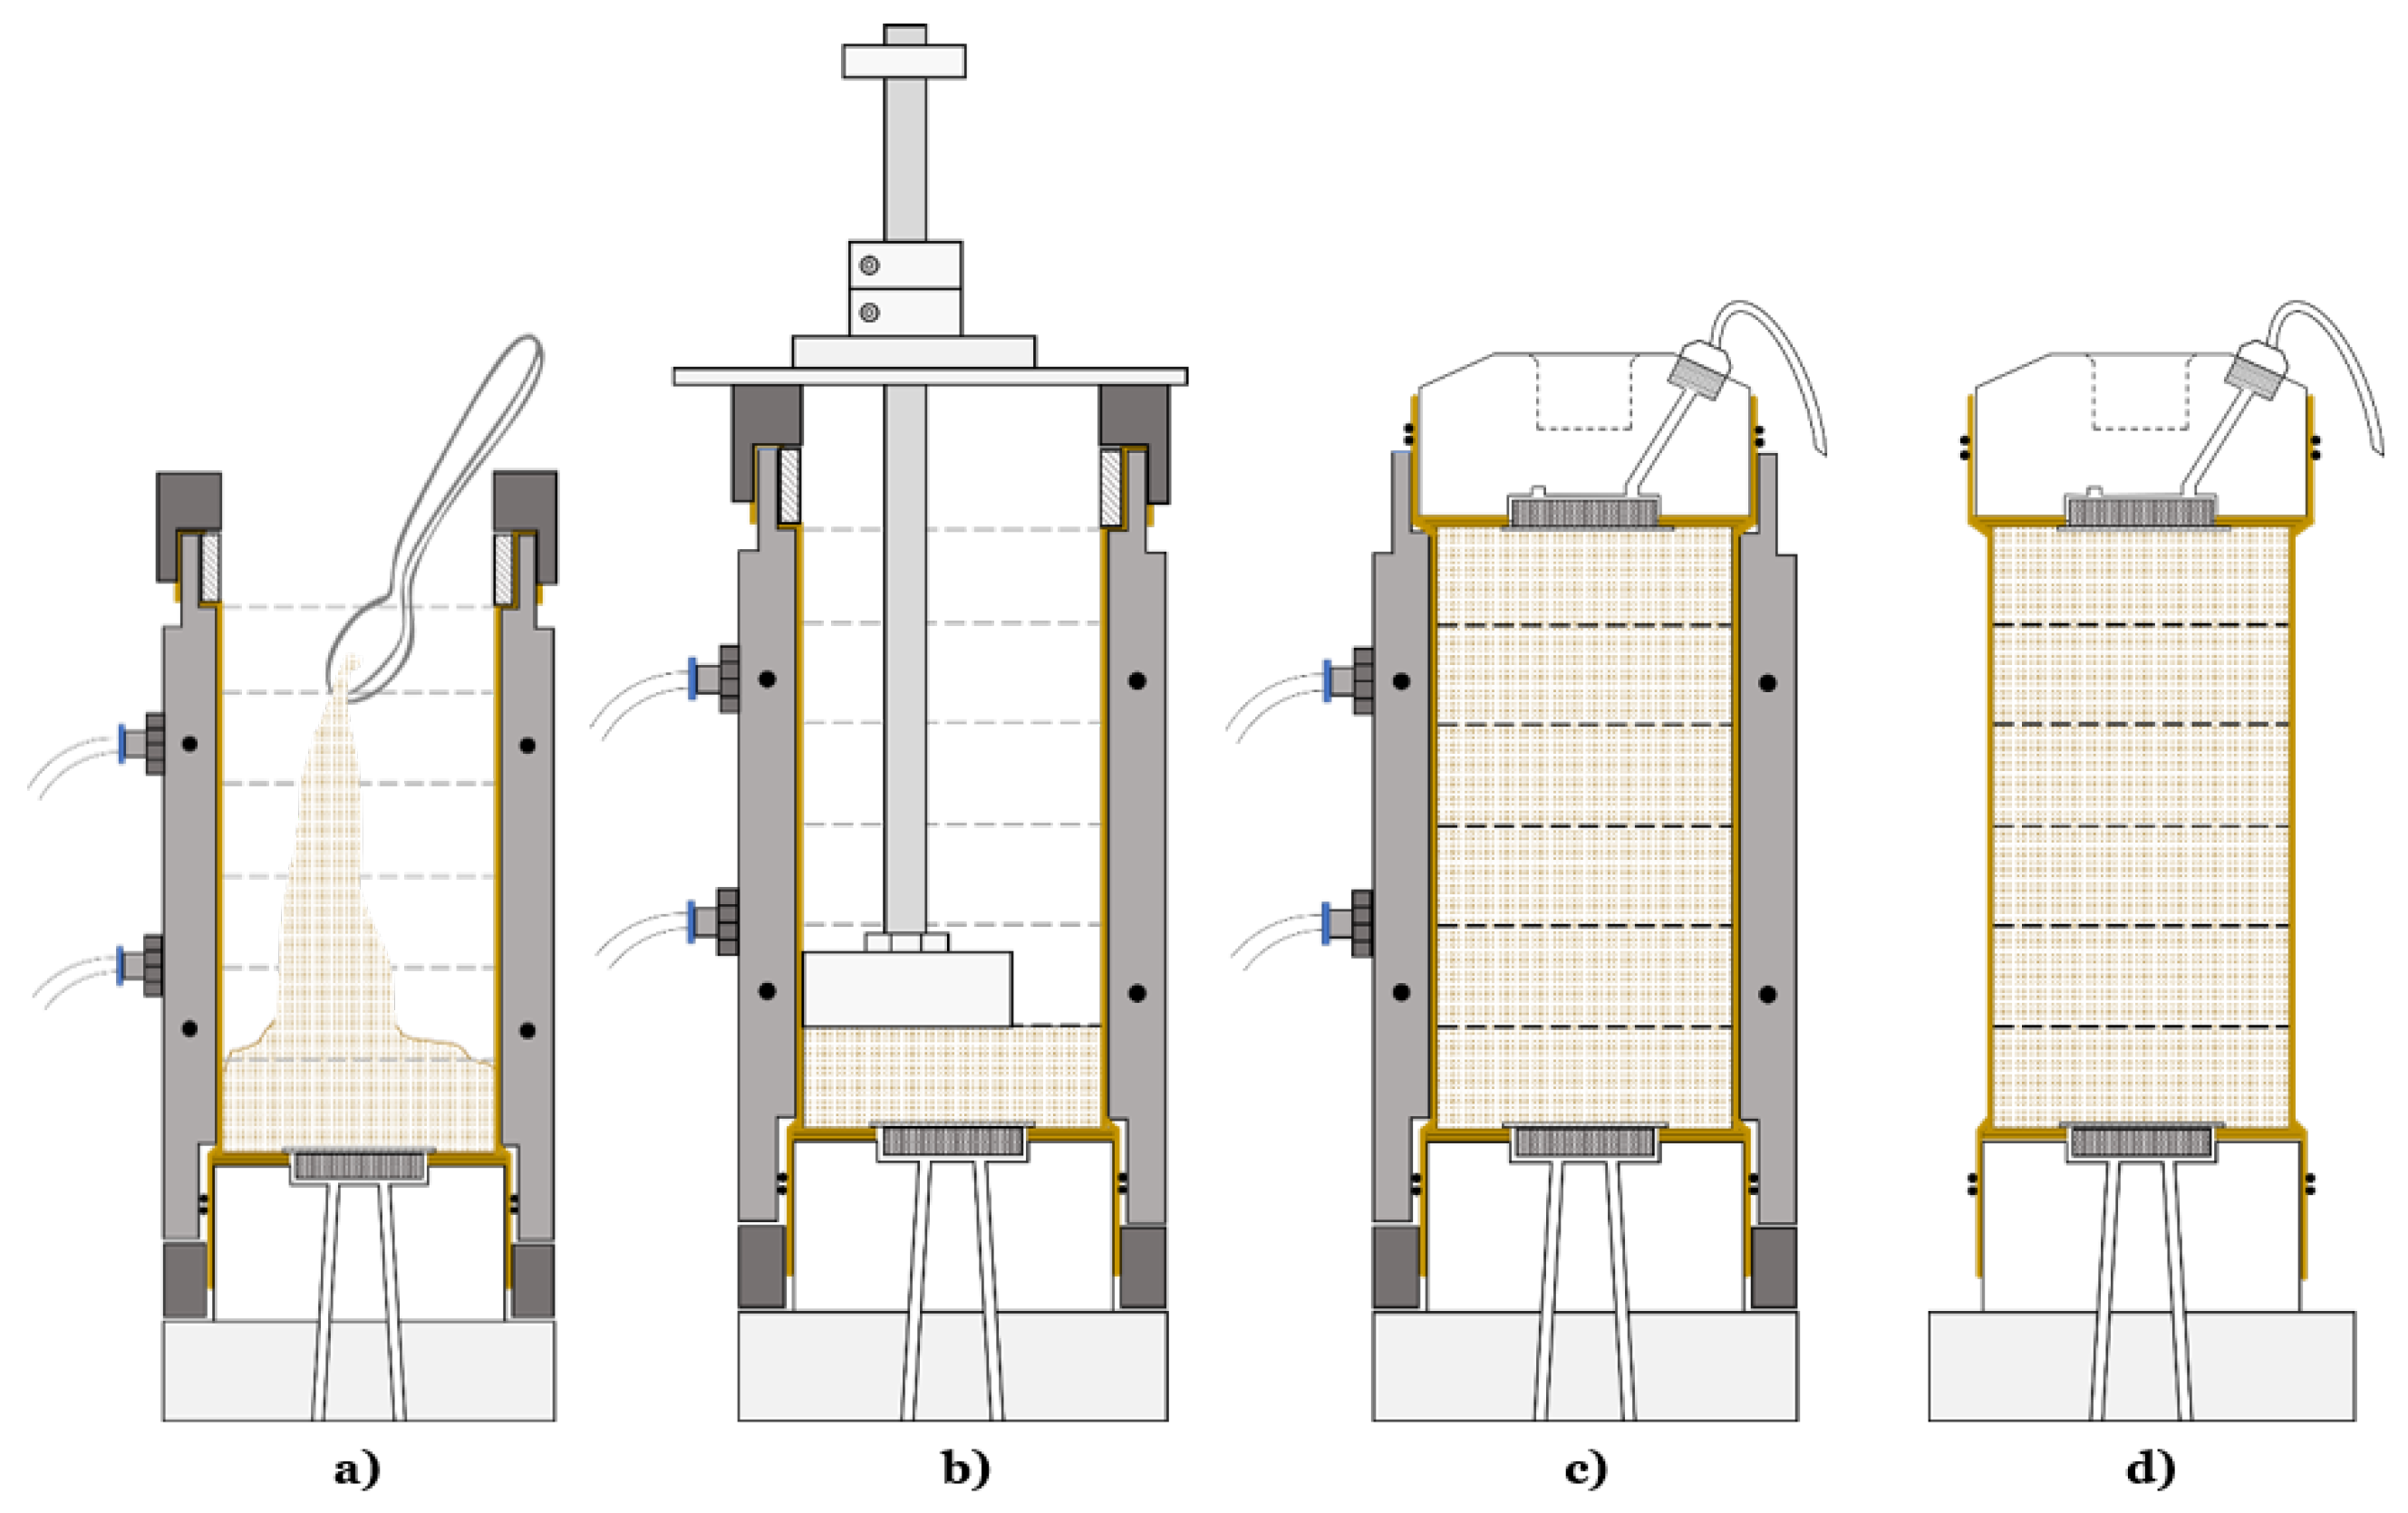
4.2. Moist Tamping Technique and Undercompaction Method
4.3. Compaction Mould and Tamper
5. Proposed Testing Procedures
5.1. Soil Preparation
5.2. Remoulding of Soil Specimens
5.3. Sample Saturation
5.3.1. Carbon Dioxide Method
5.3.2. Water Flushing
5.3.3. Backpressure Increment
5.3.4. Evaluation of the Degree of Saturation
5.3.5. Percolation under Pressure
5.4. Consolidation Phase
5.5. Shear Phase
5.6. Data Correction
5.7. Void Ratio Measurements
6. Validation of the Proposed Procedures and Discussion
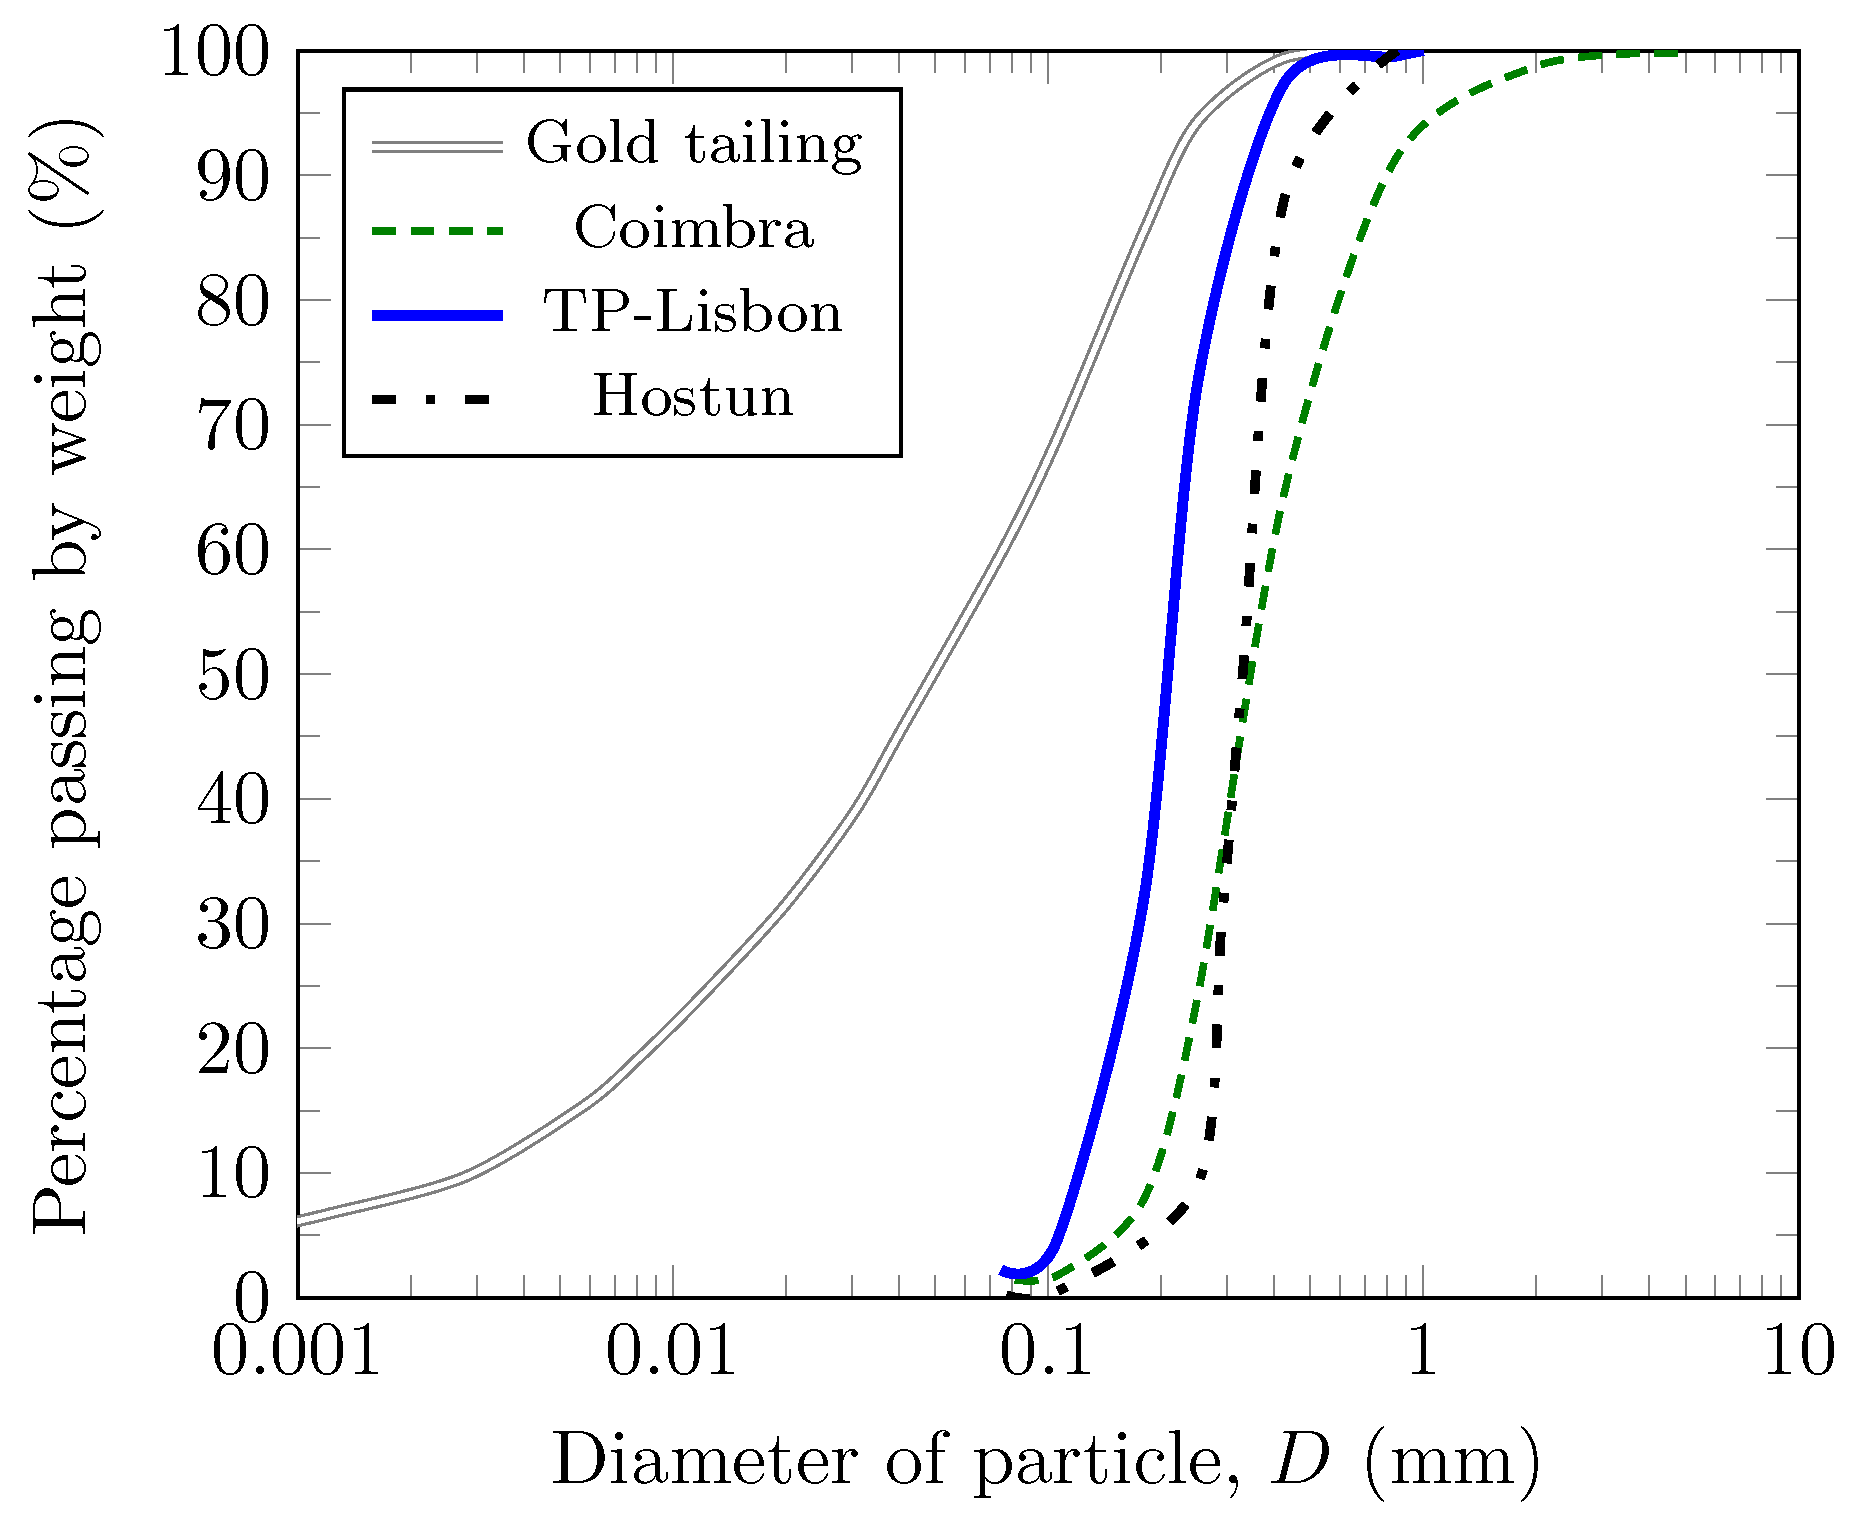
6.1. Description of Tested Soils
6.2. Reproducibility of the Proposed Test Procedures
6.3. Behavioural Consistency by Applying the Proposed Procedures
6.4. Comparisons of CSL Results against Other Procedures
7. Summary and Concluding Remarks
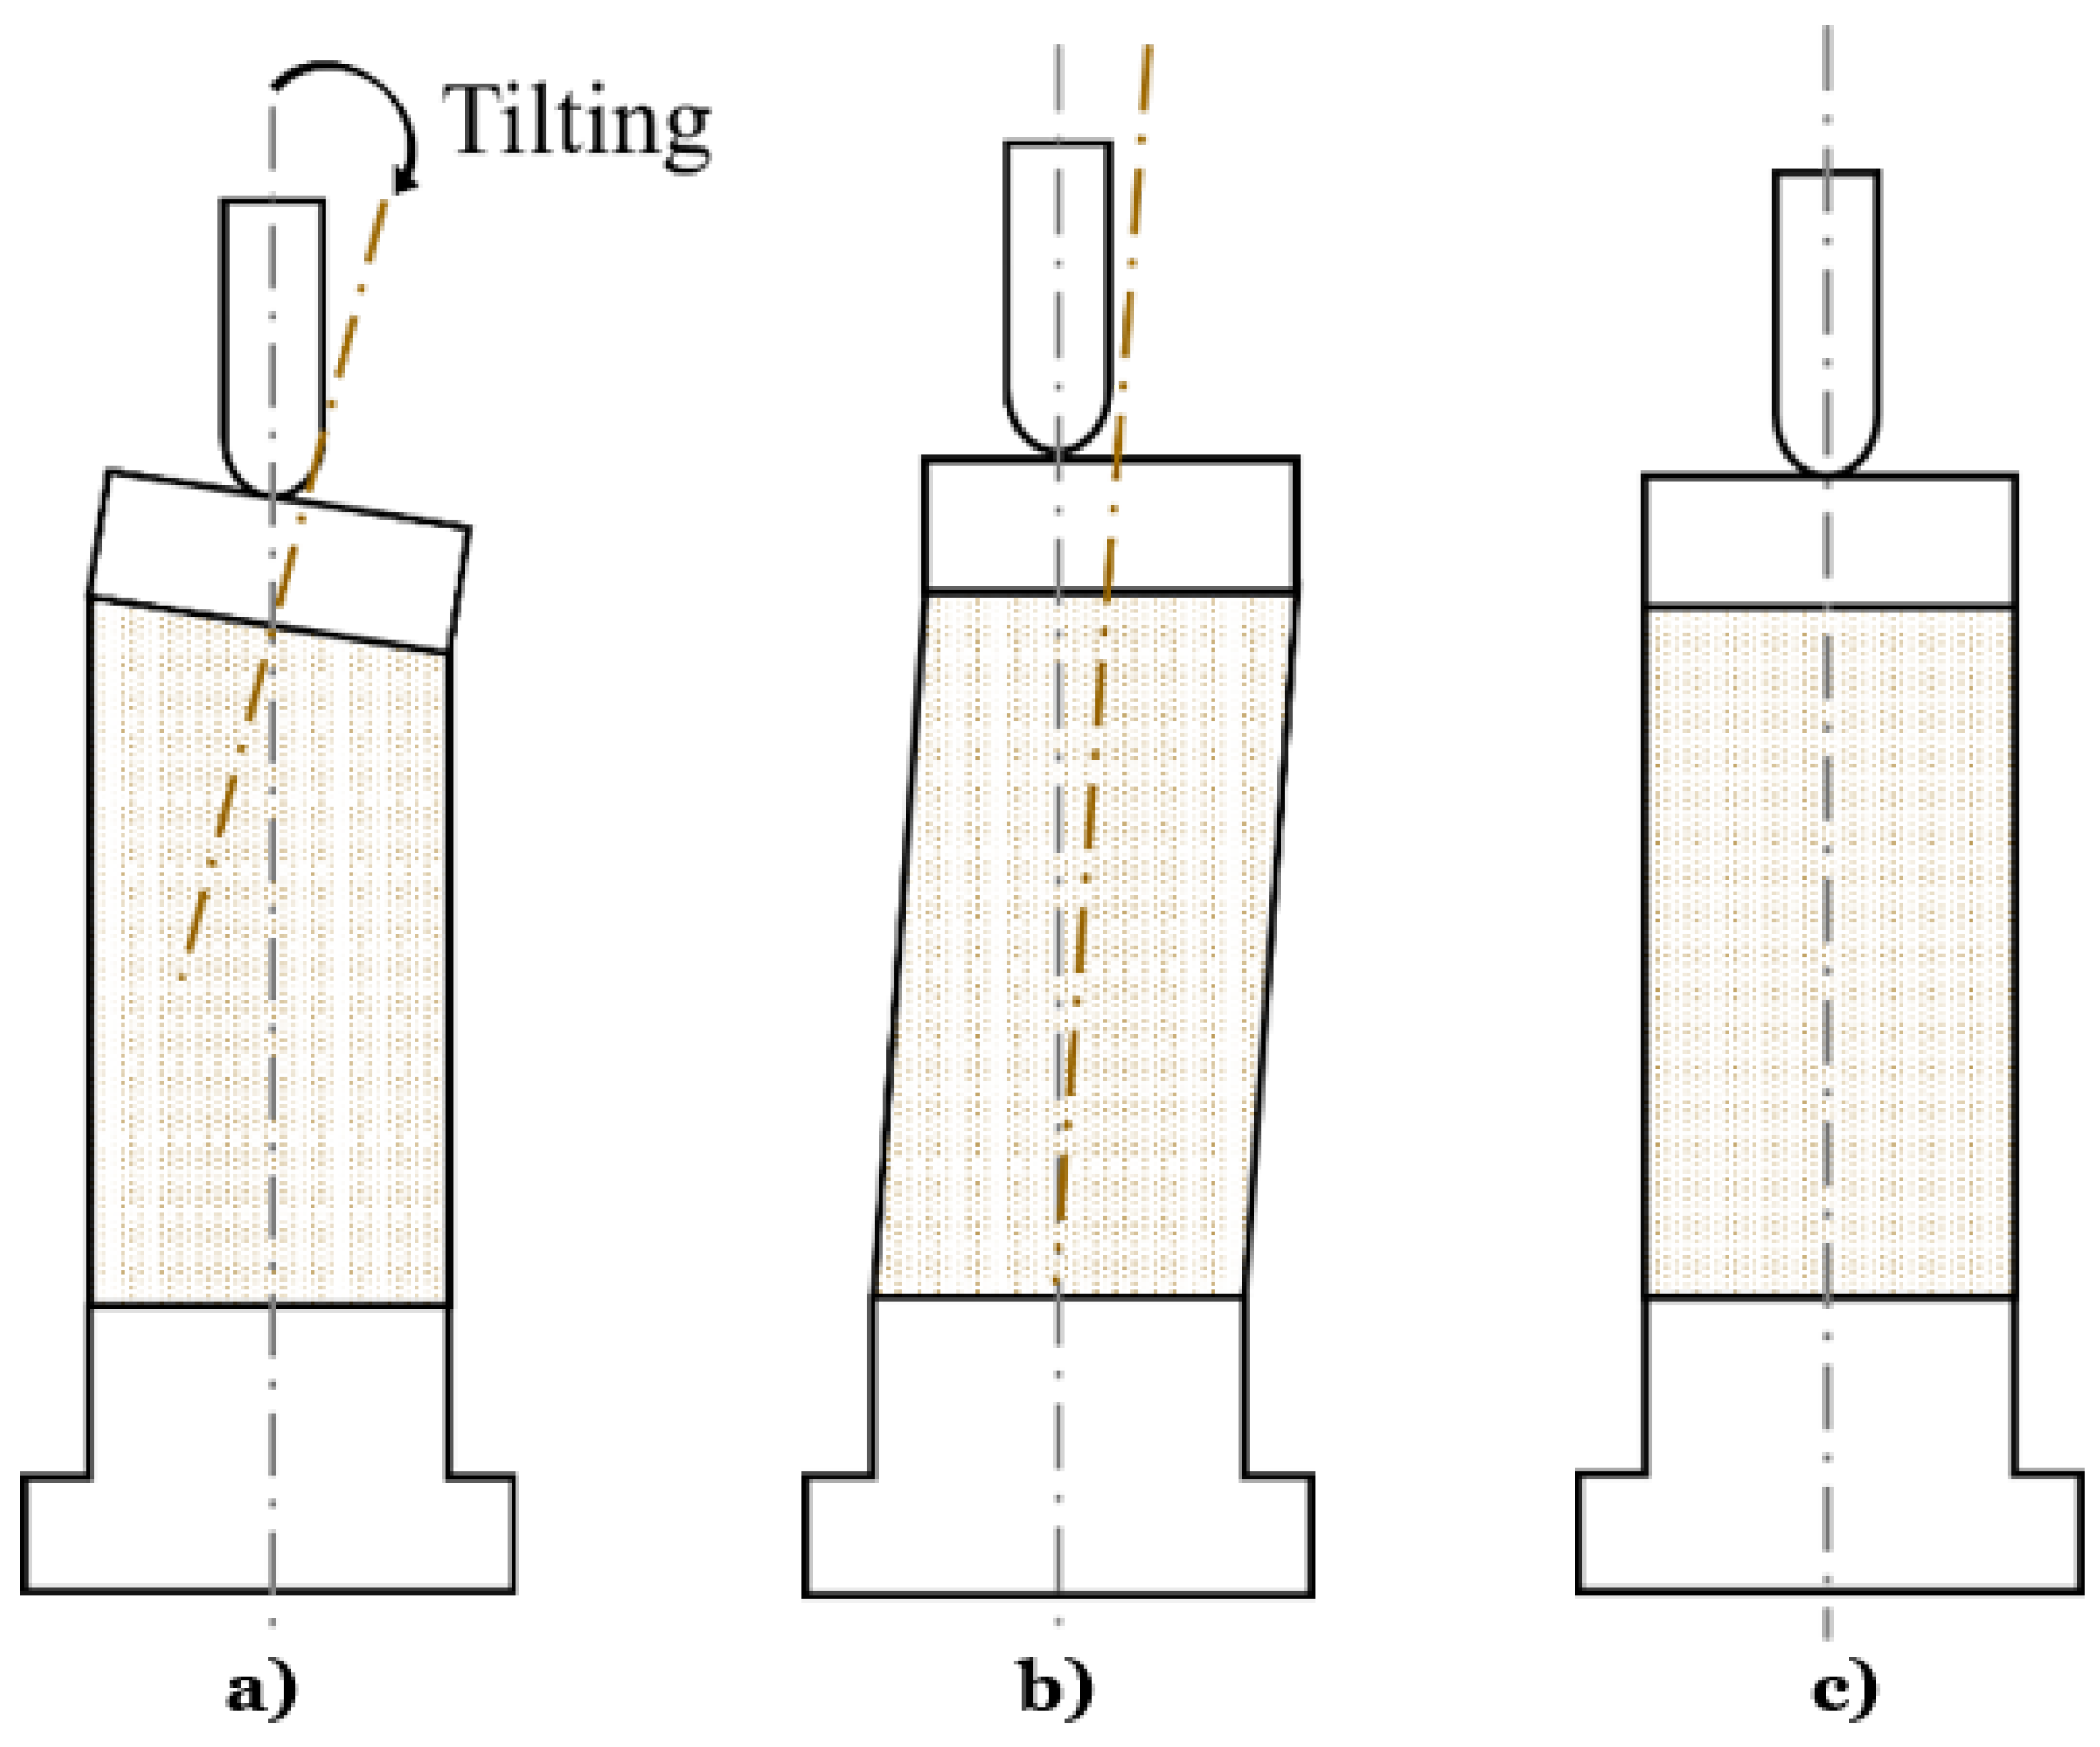
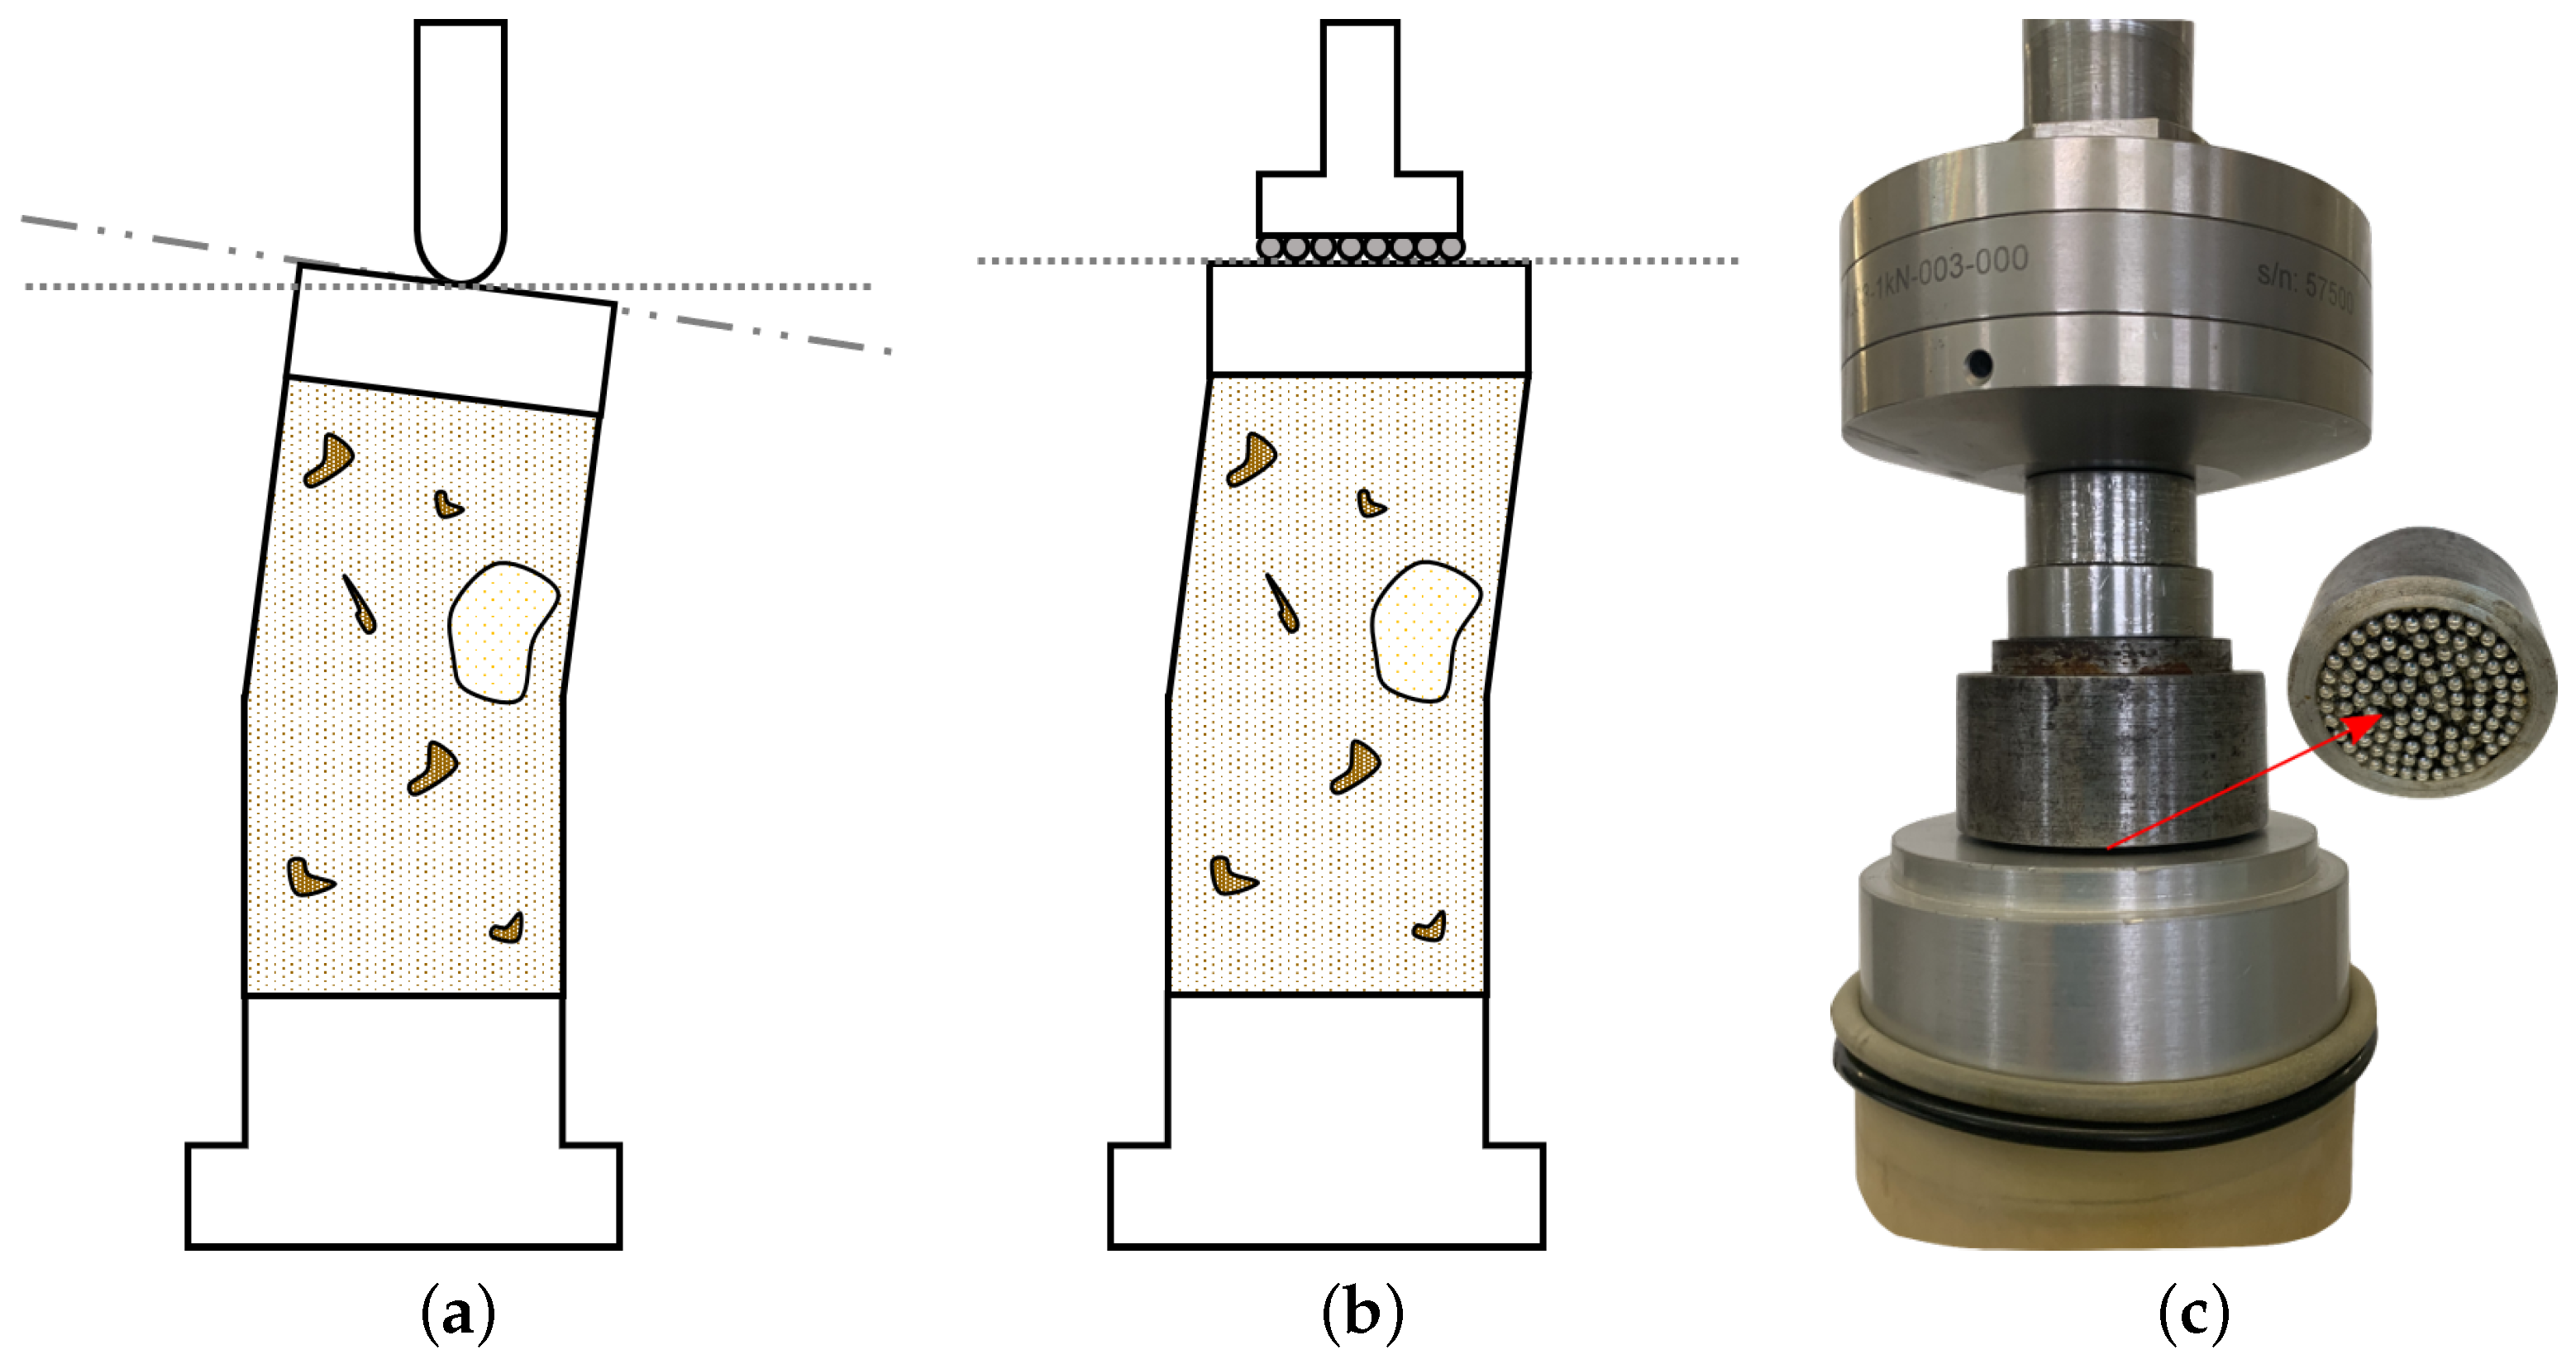
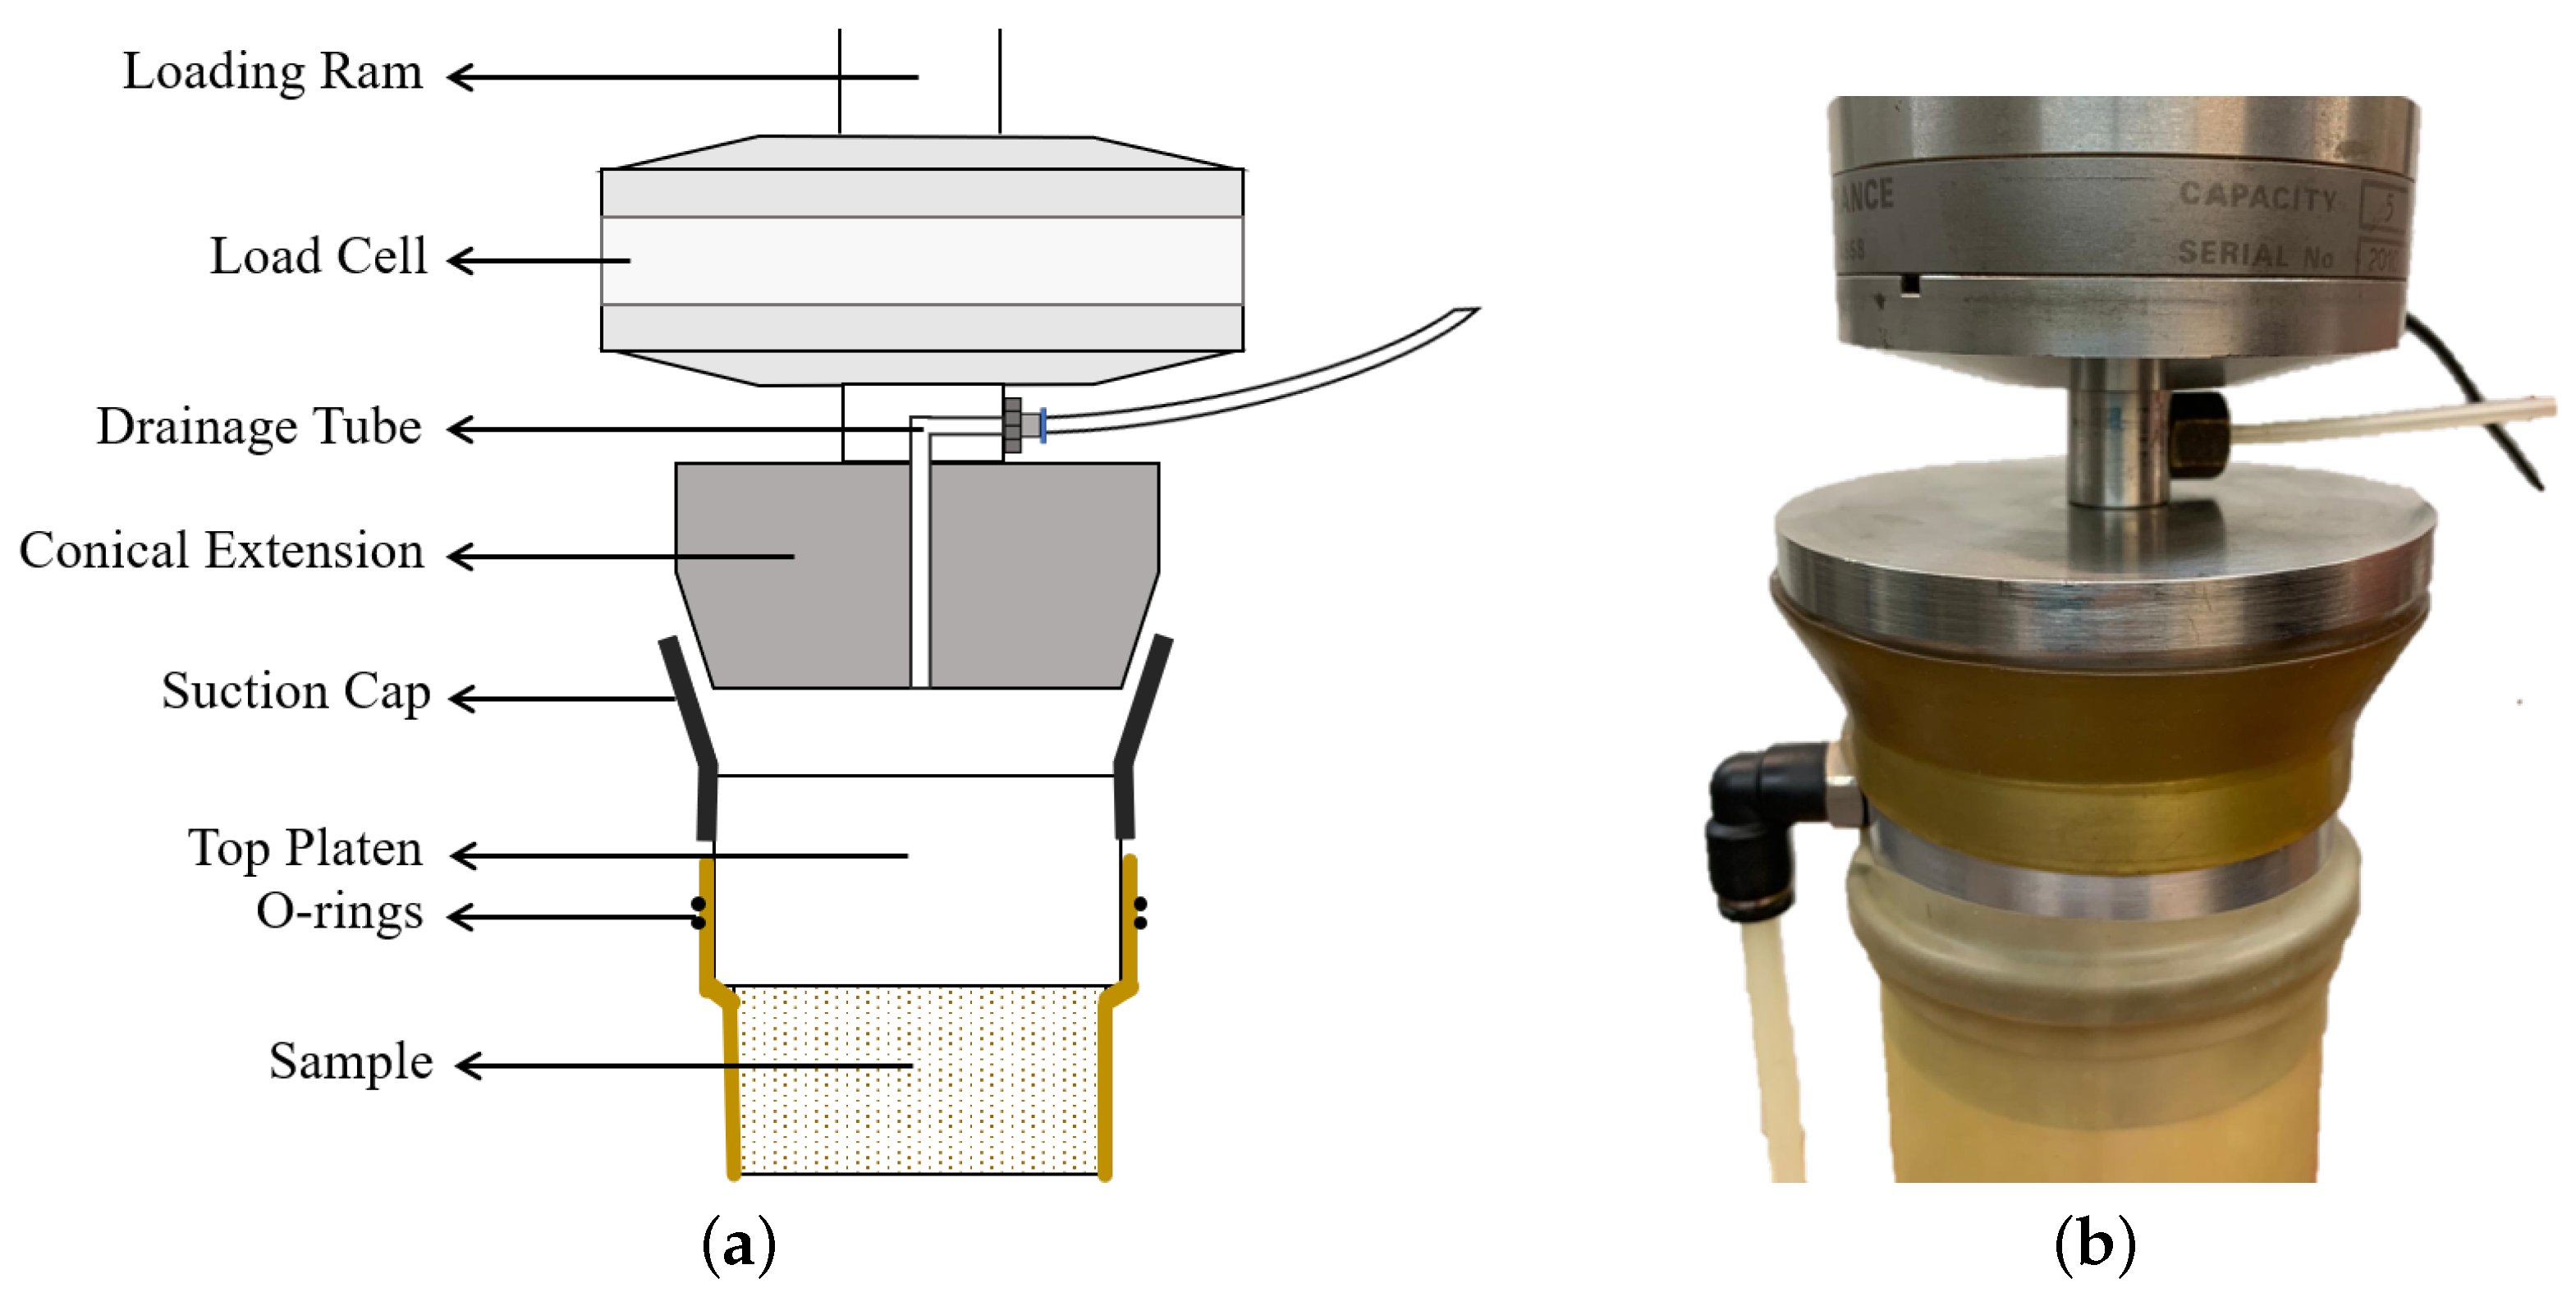
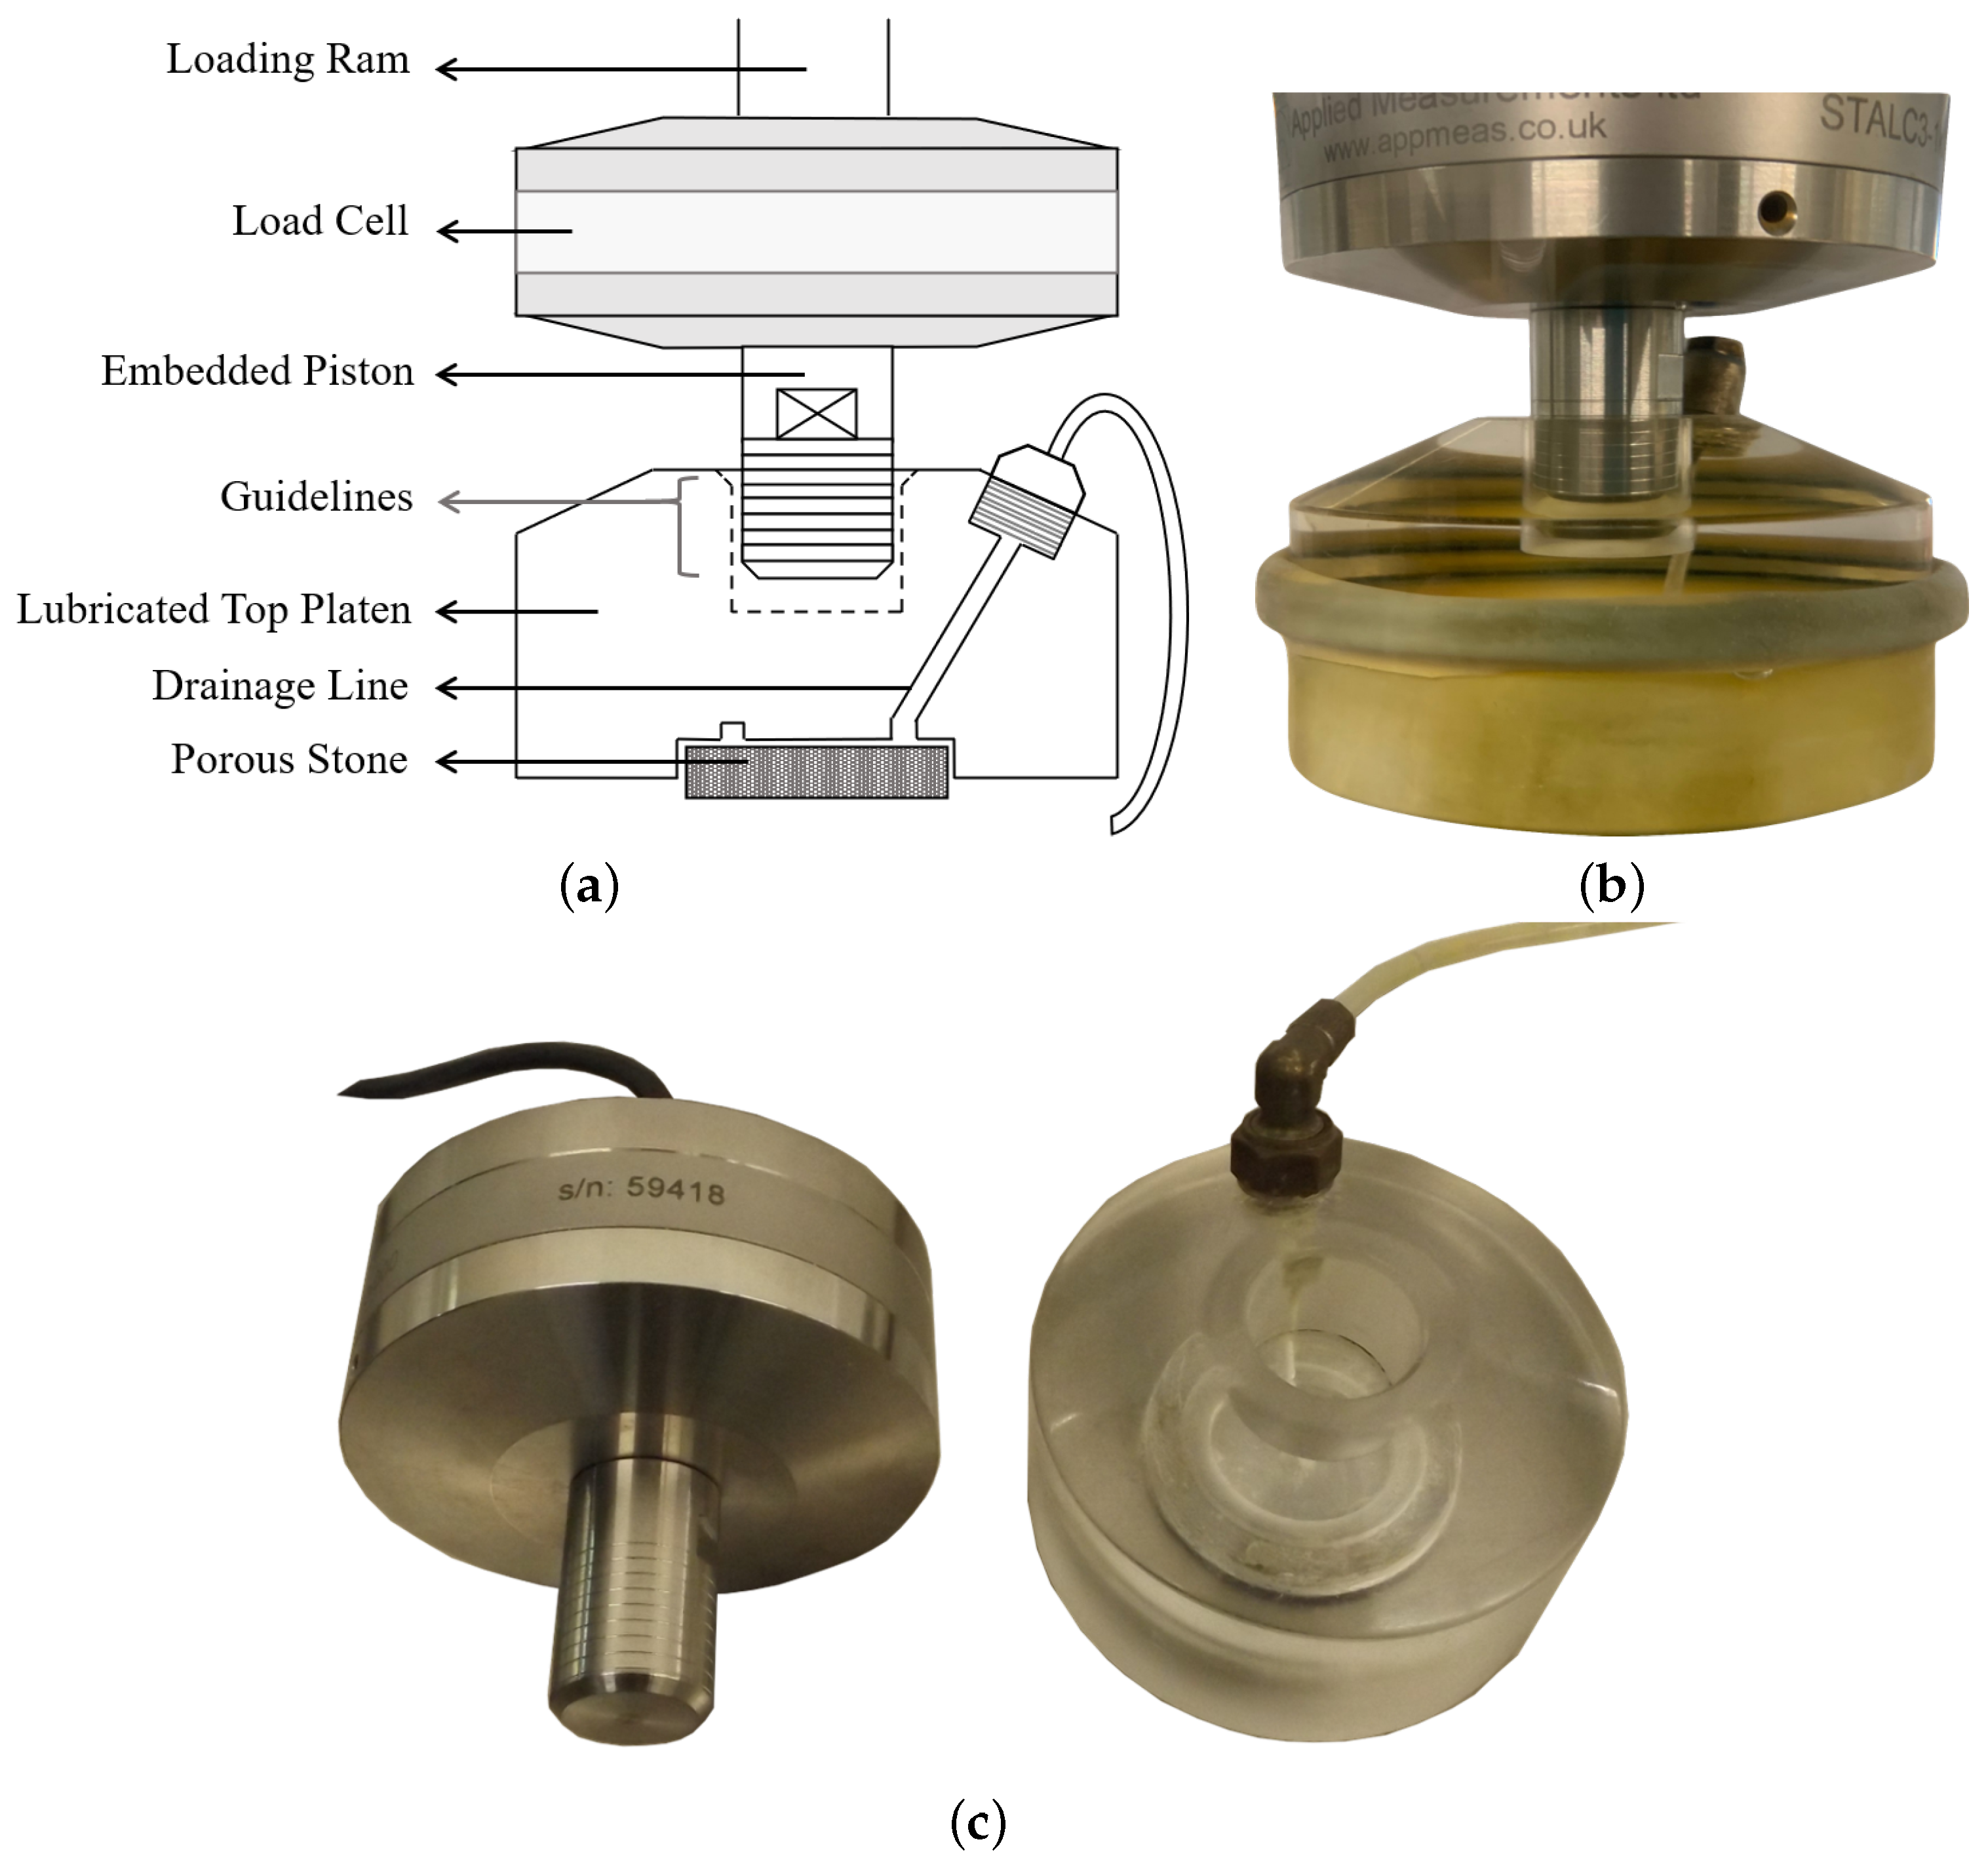
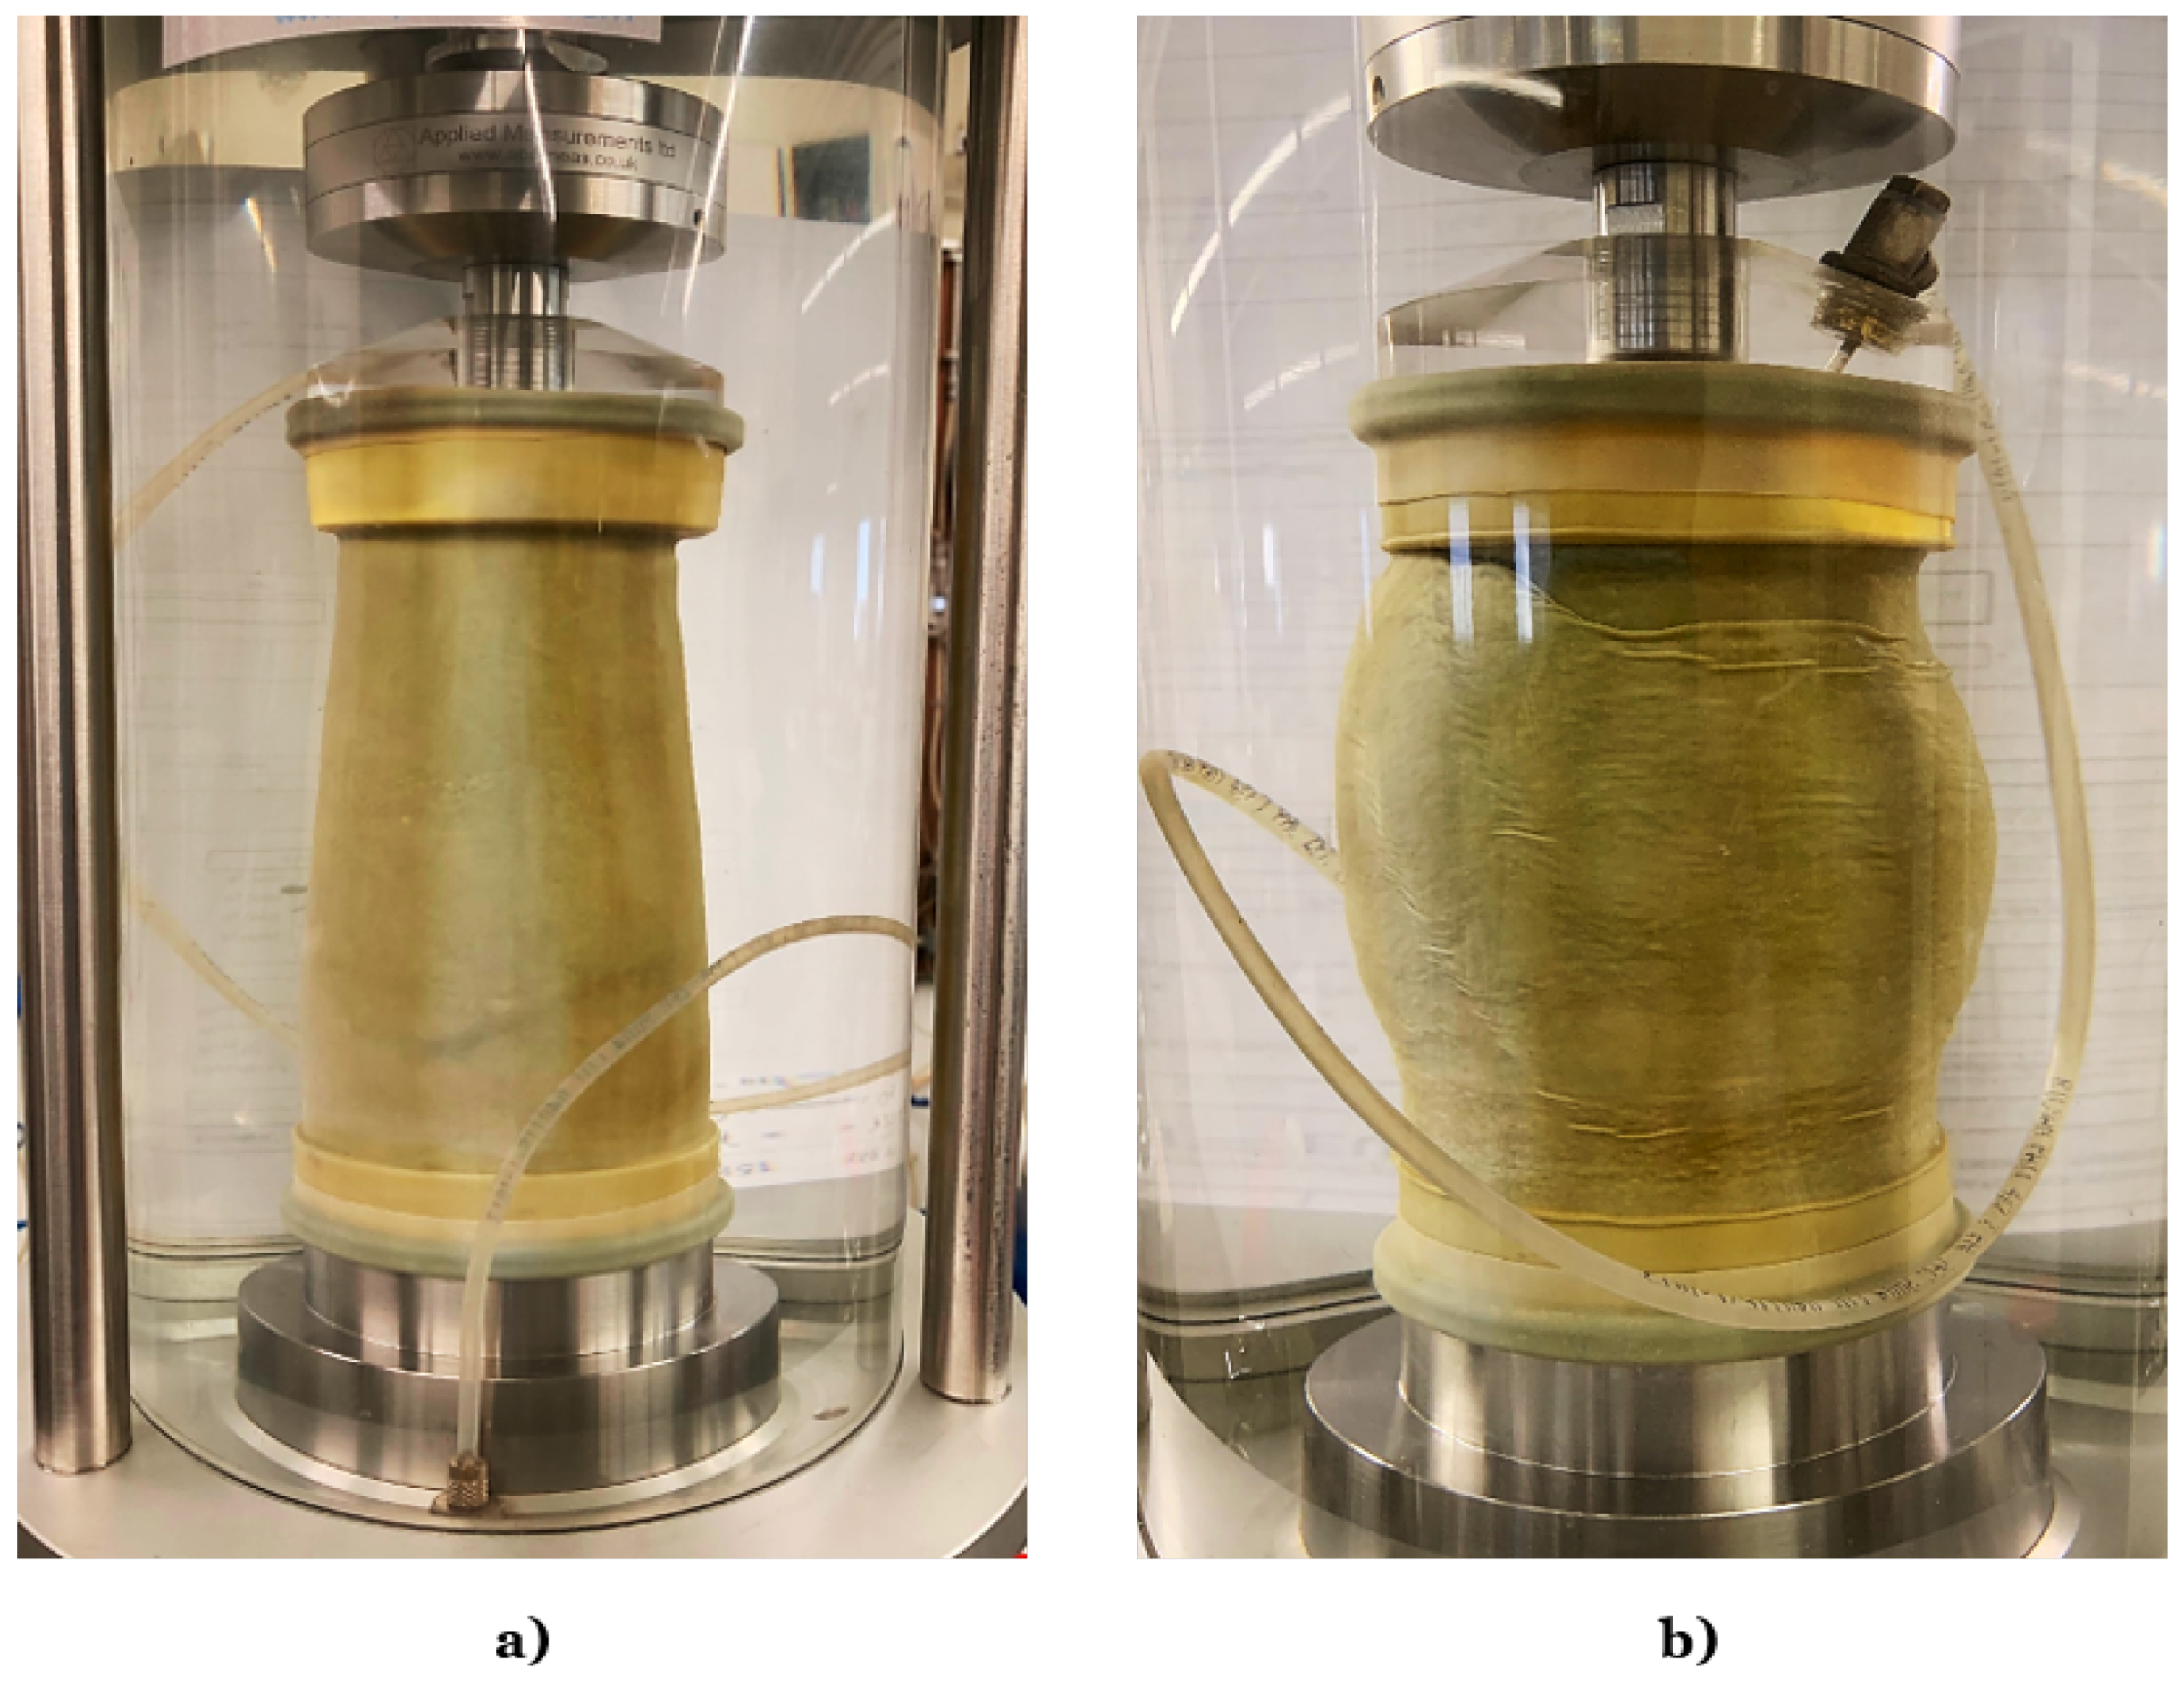
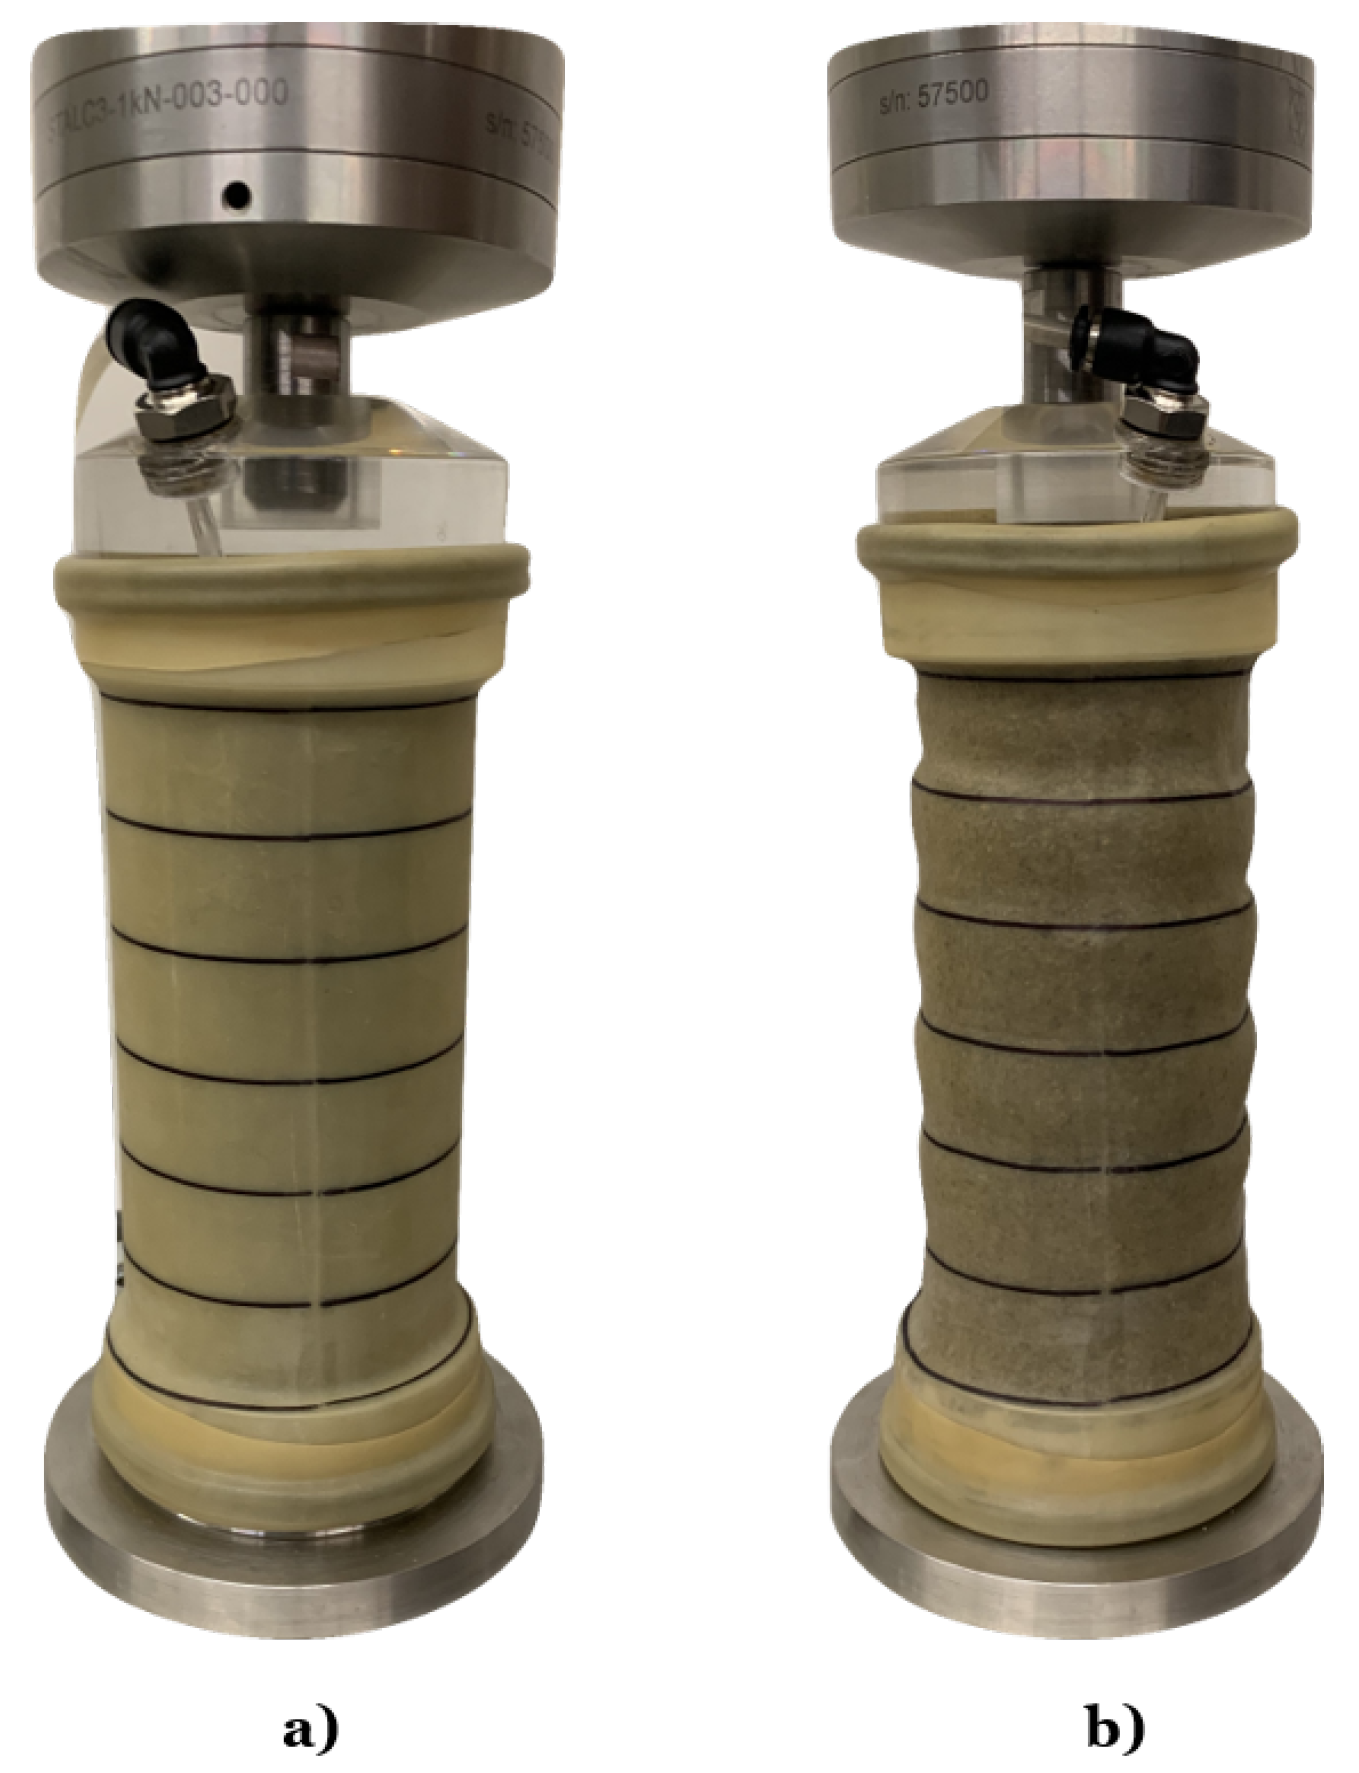
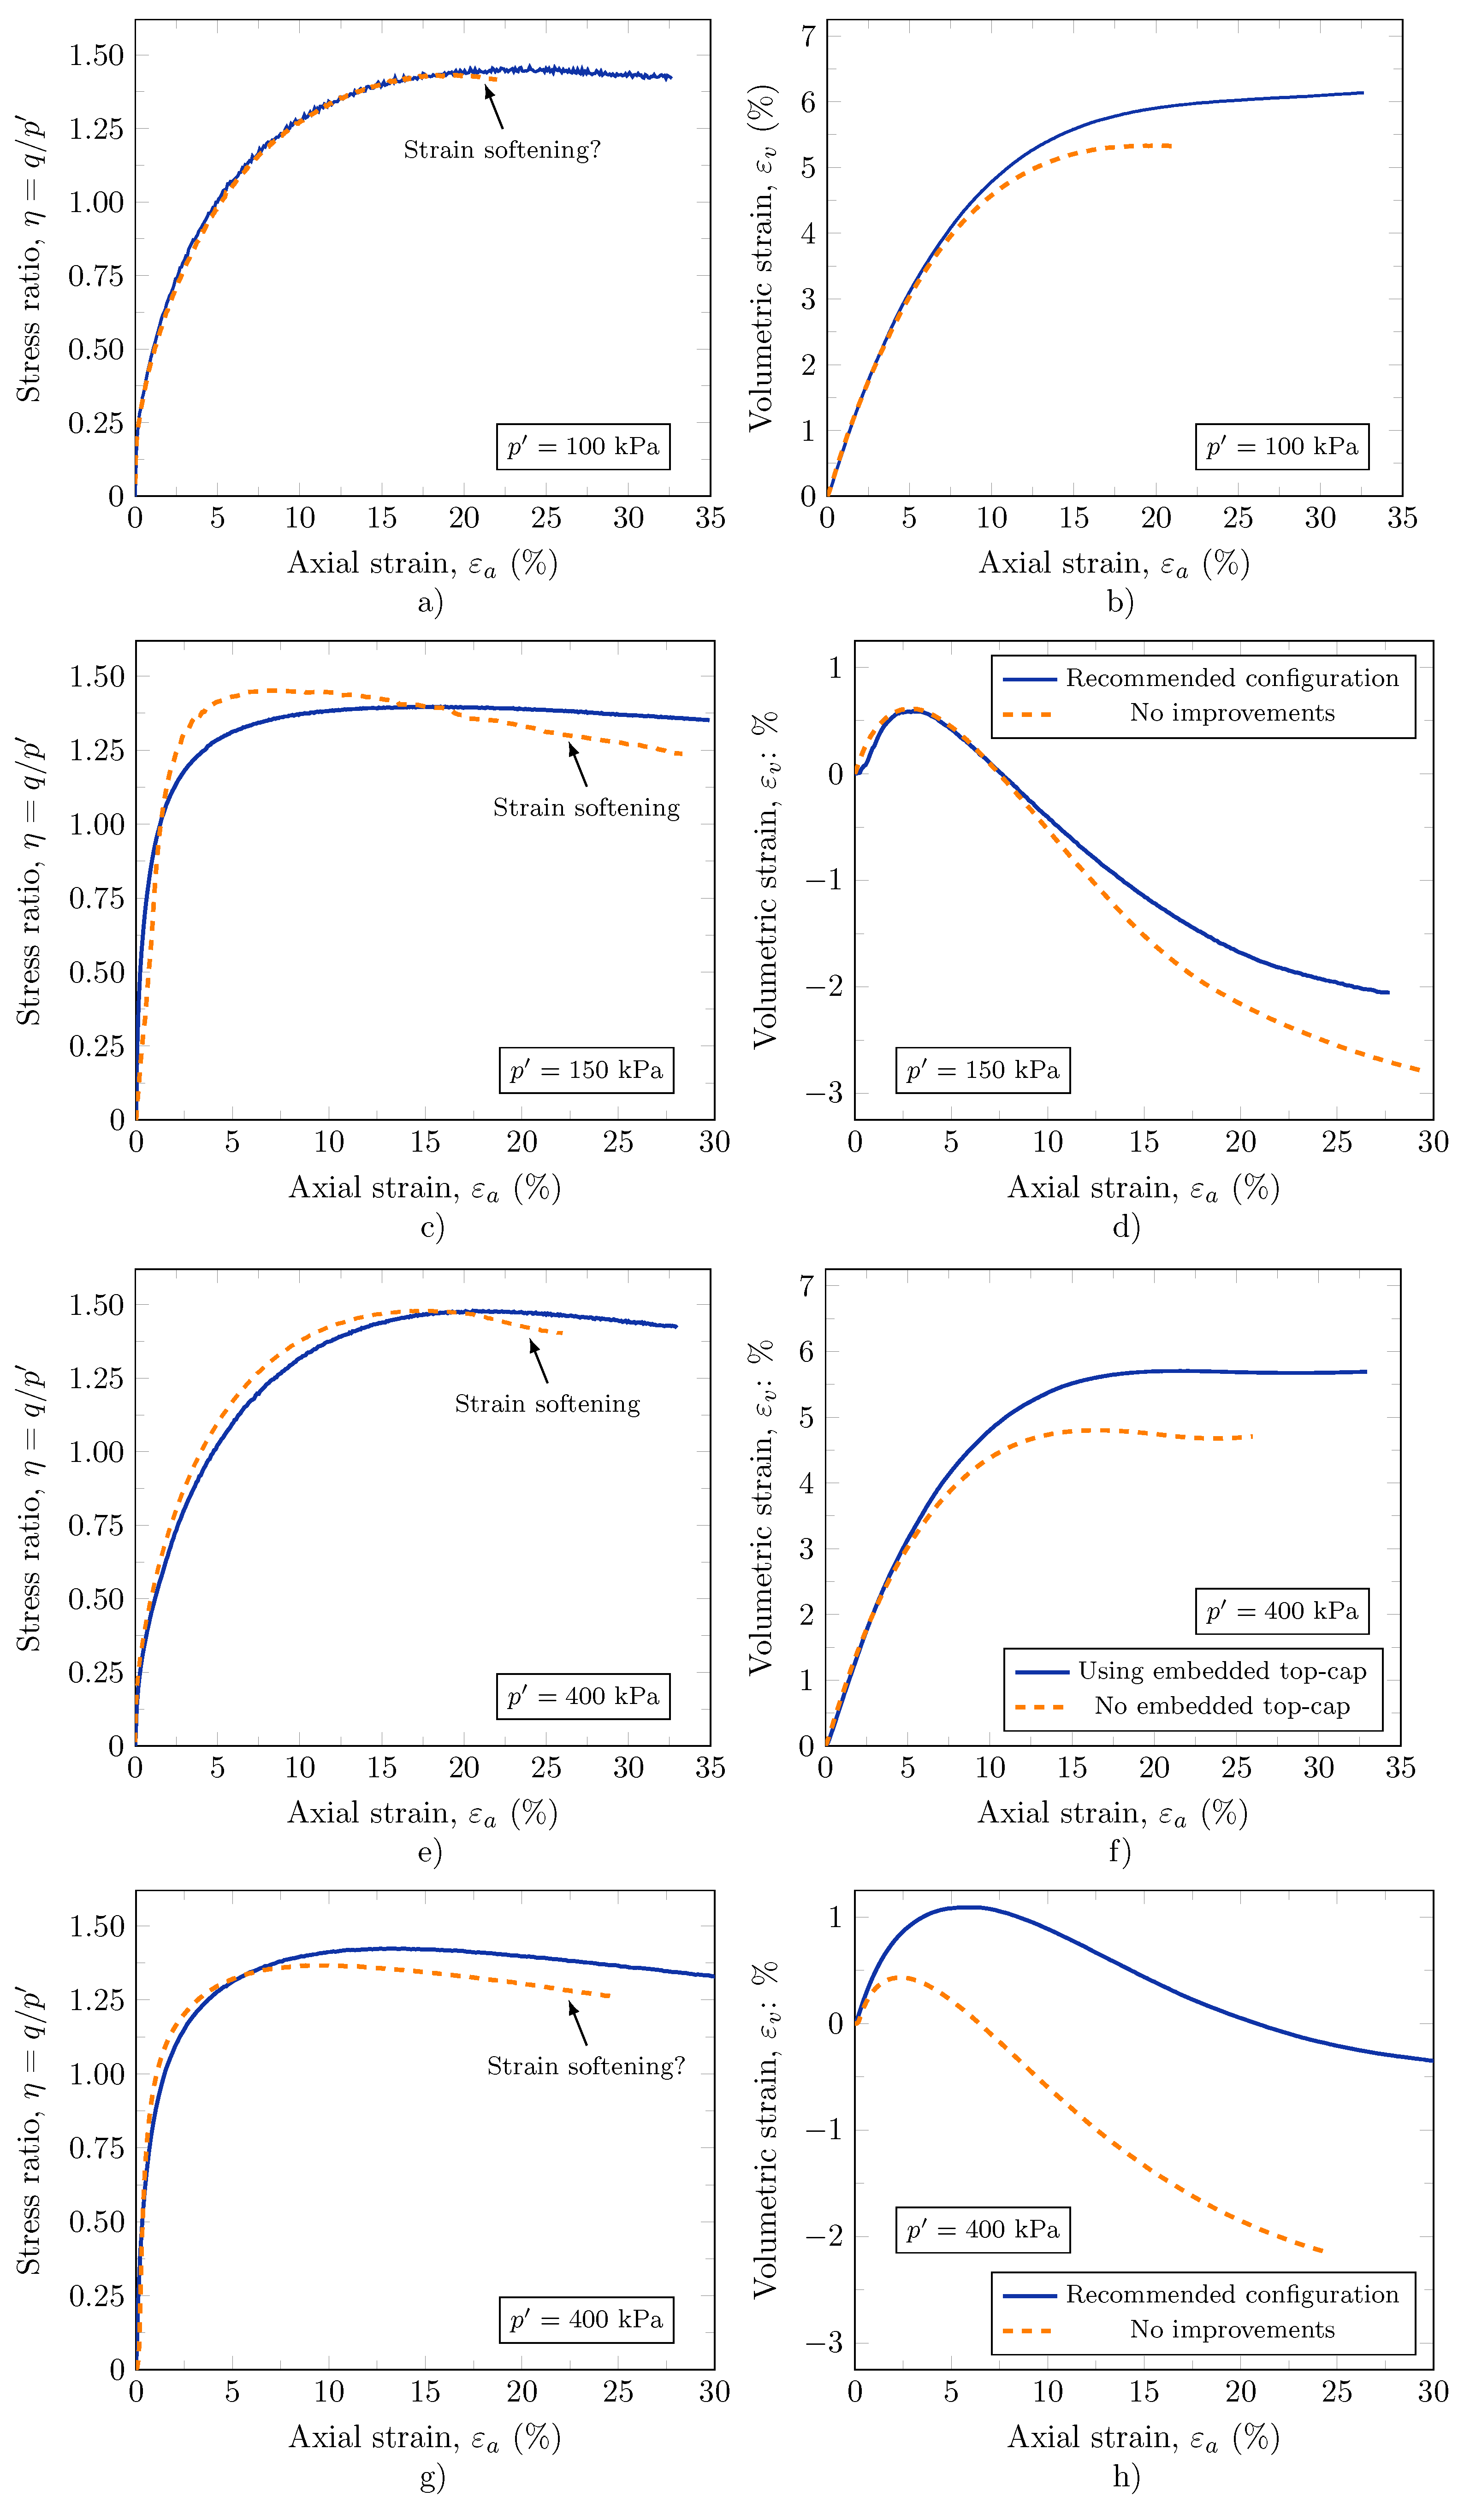
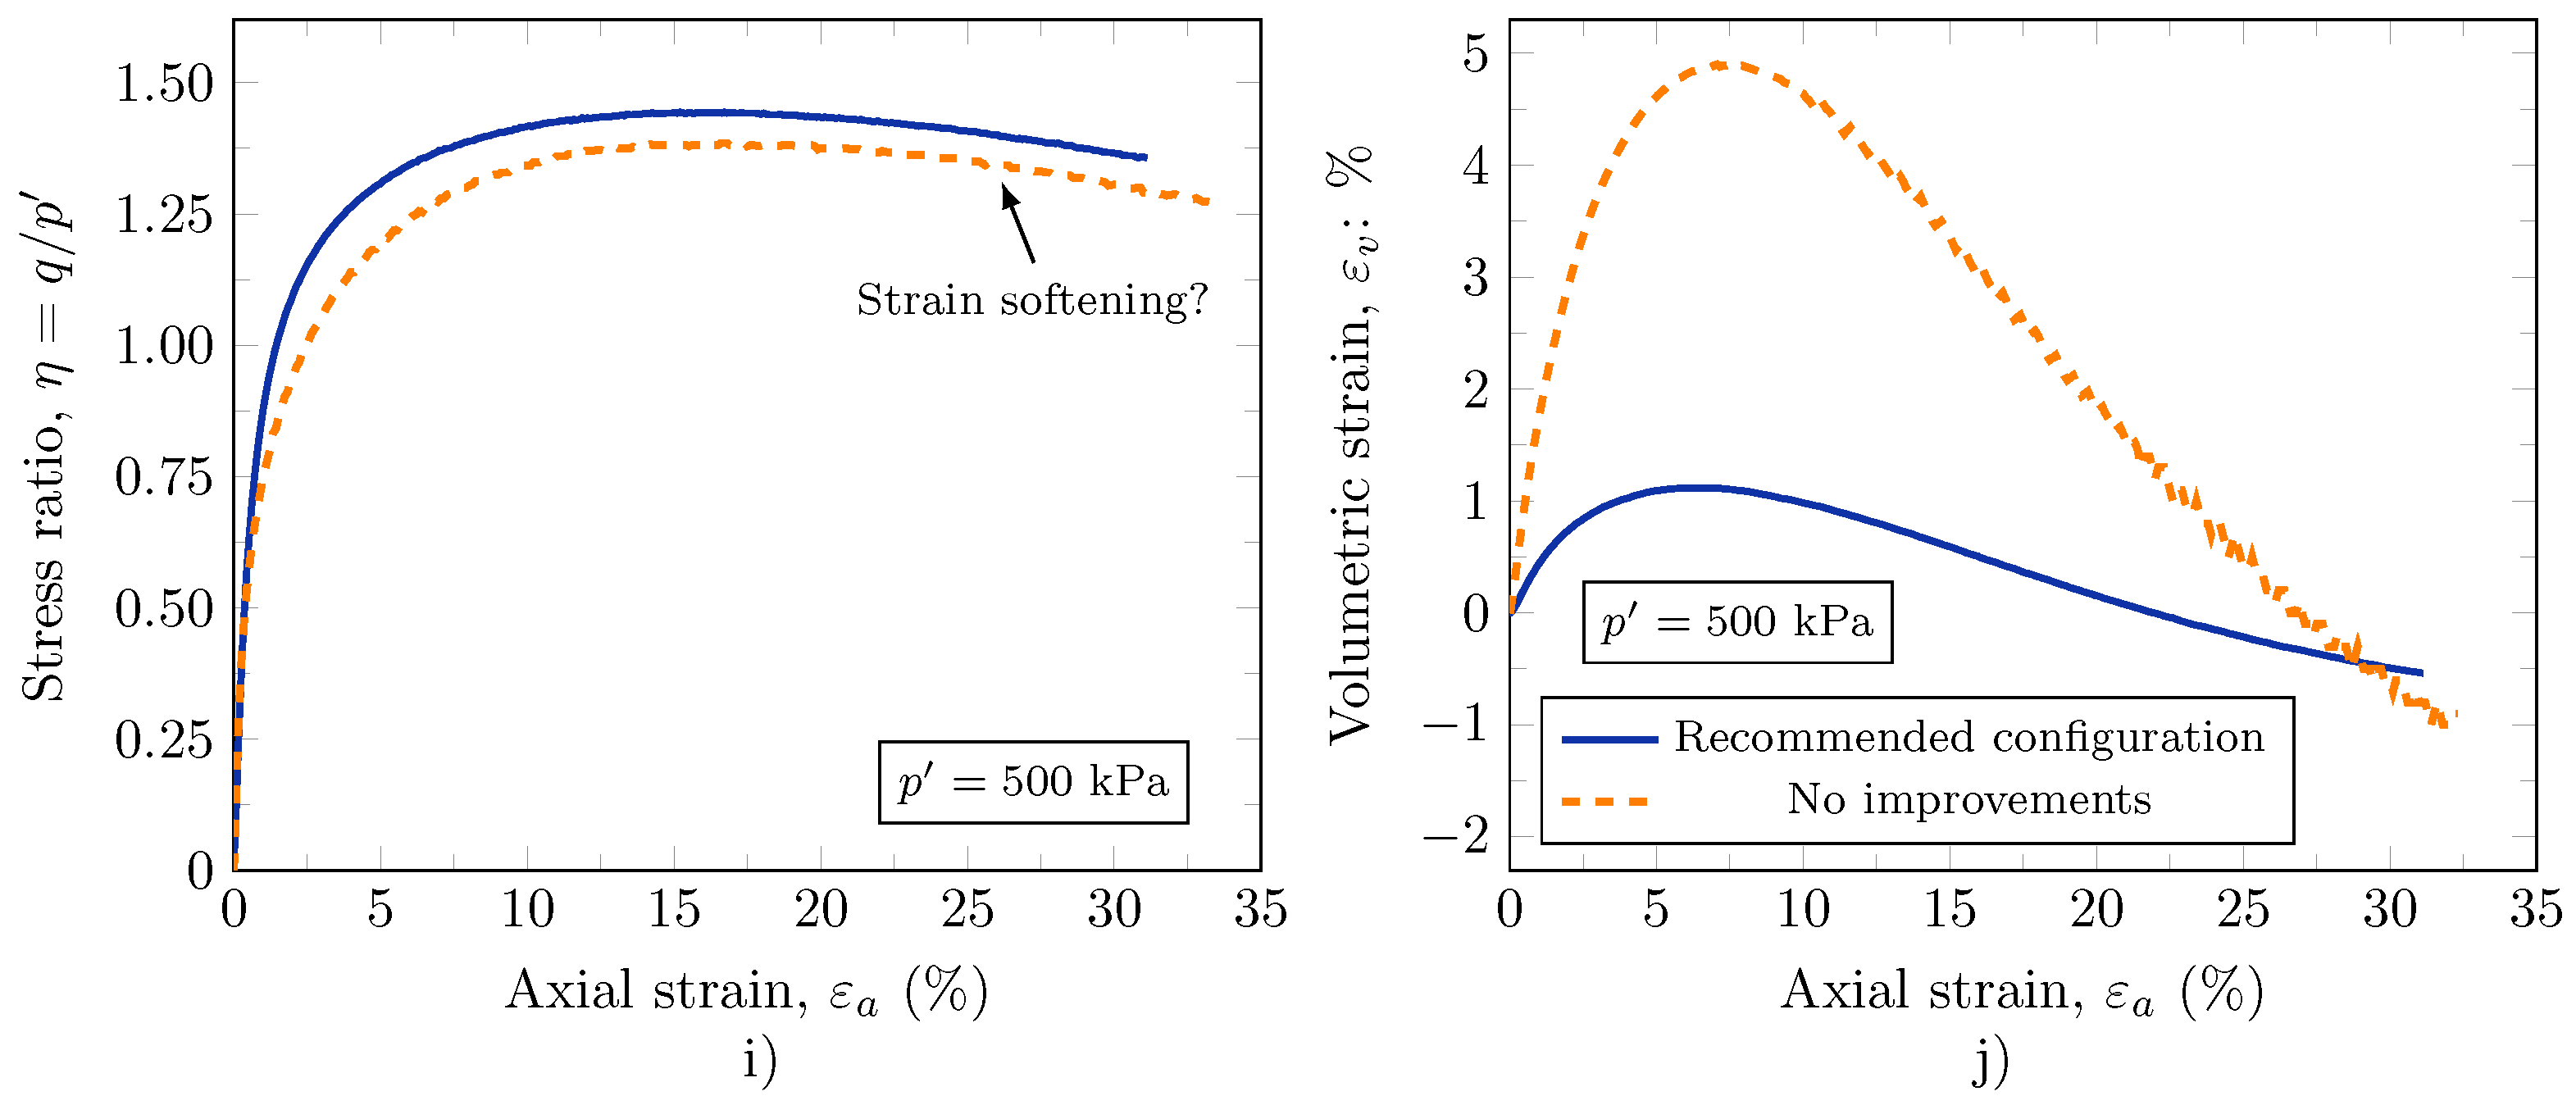
- The use of an embedded top-cap loading ram novel connection reduces the ‘tilting’ of the soil specimen during all phases of triaxial testing, ensuring a perpendicular alignment between the loading ram with the axis of the soil specimen that leads to conceptually consistent soil behaviour. Such consistent soil behaviour was experimentally validated by triaxial tests carried out in four cohesionless soils. Furthermore, the soil response is caused by a reduction of strain-softening and the stabilisation of the volume change during triaxial loading, even for soil specimens with dilative behaviour.
- The combination of oversized lubricated end platens and an embedded top-cap loading ram connection in the triaxial apparatus results in a uniform shearing without the generation of spurious shear bands, allowing for a reduction of strain softening and the stabilisation of volumetric strain, which are determinant factors for the identification of the CSL. However, the use of oversized lubricated end patterns is more relevant during undrained shearing at low effective confinement stresses, whereas the use of an embedded top-cap loading ram connection causes a more conceptually consistent soil behaviour at the large strain range.
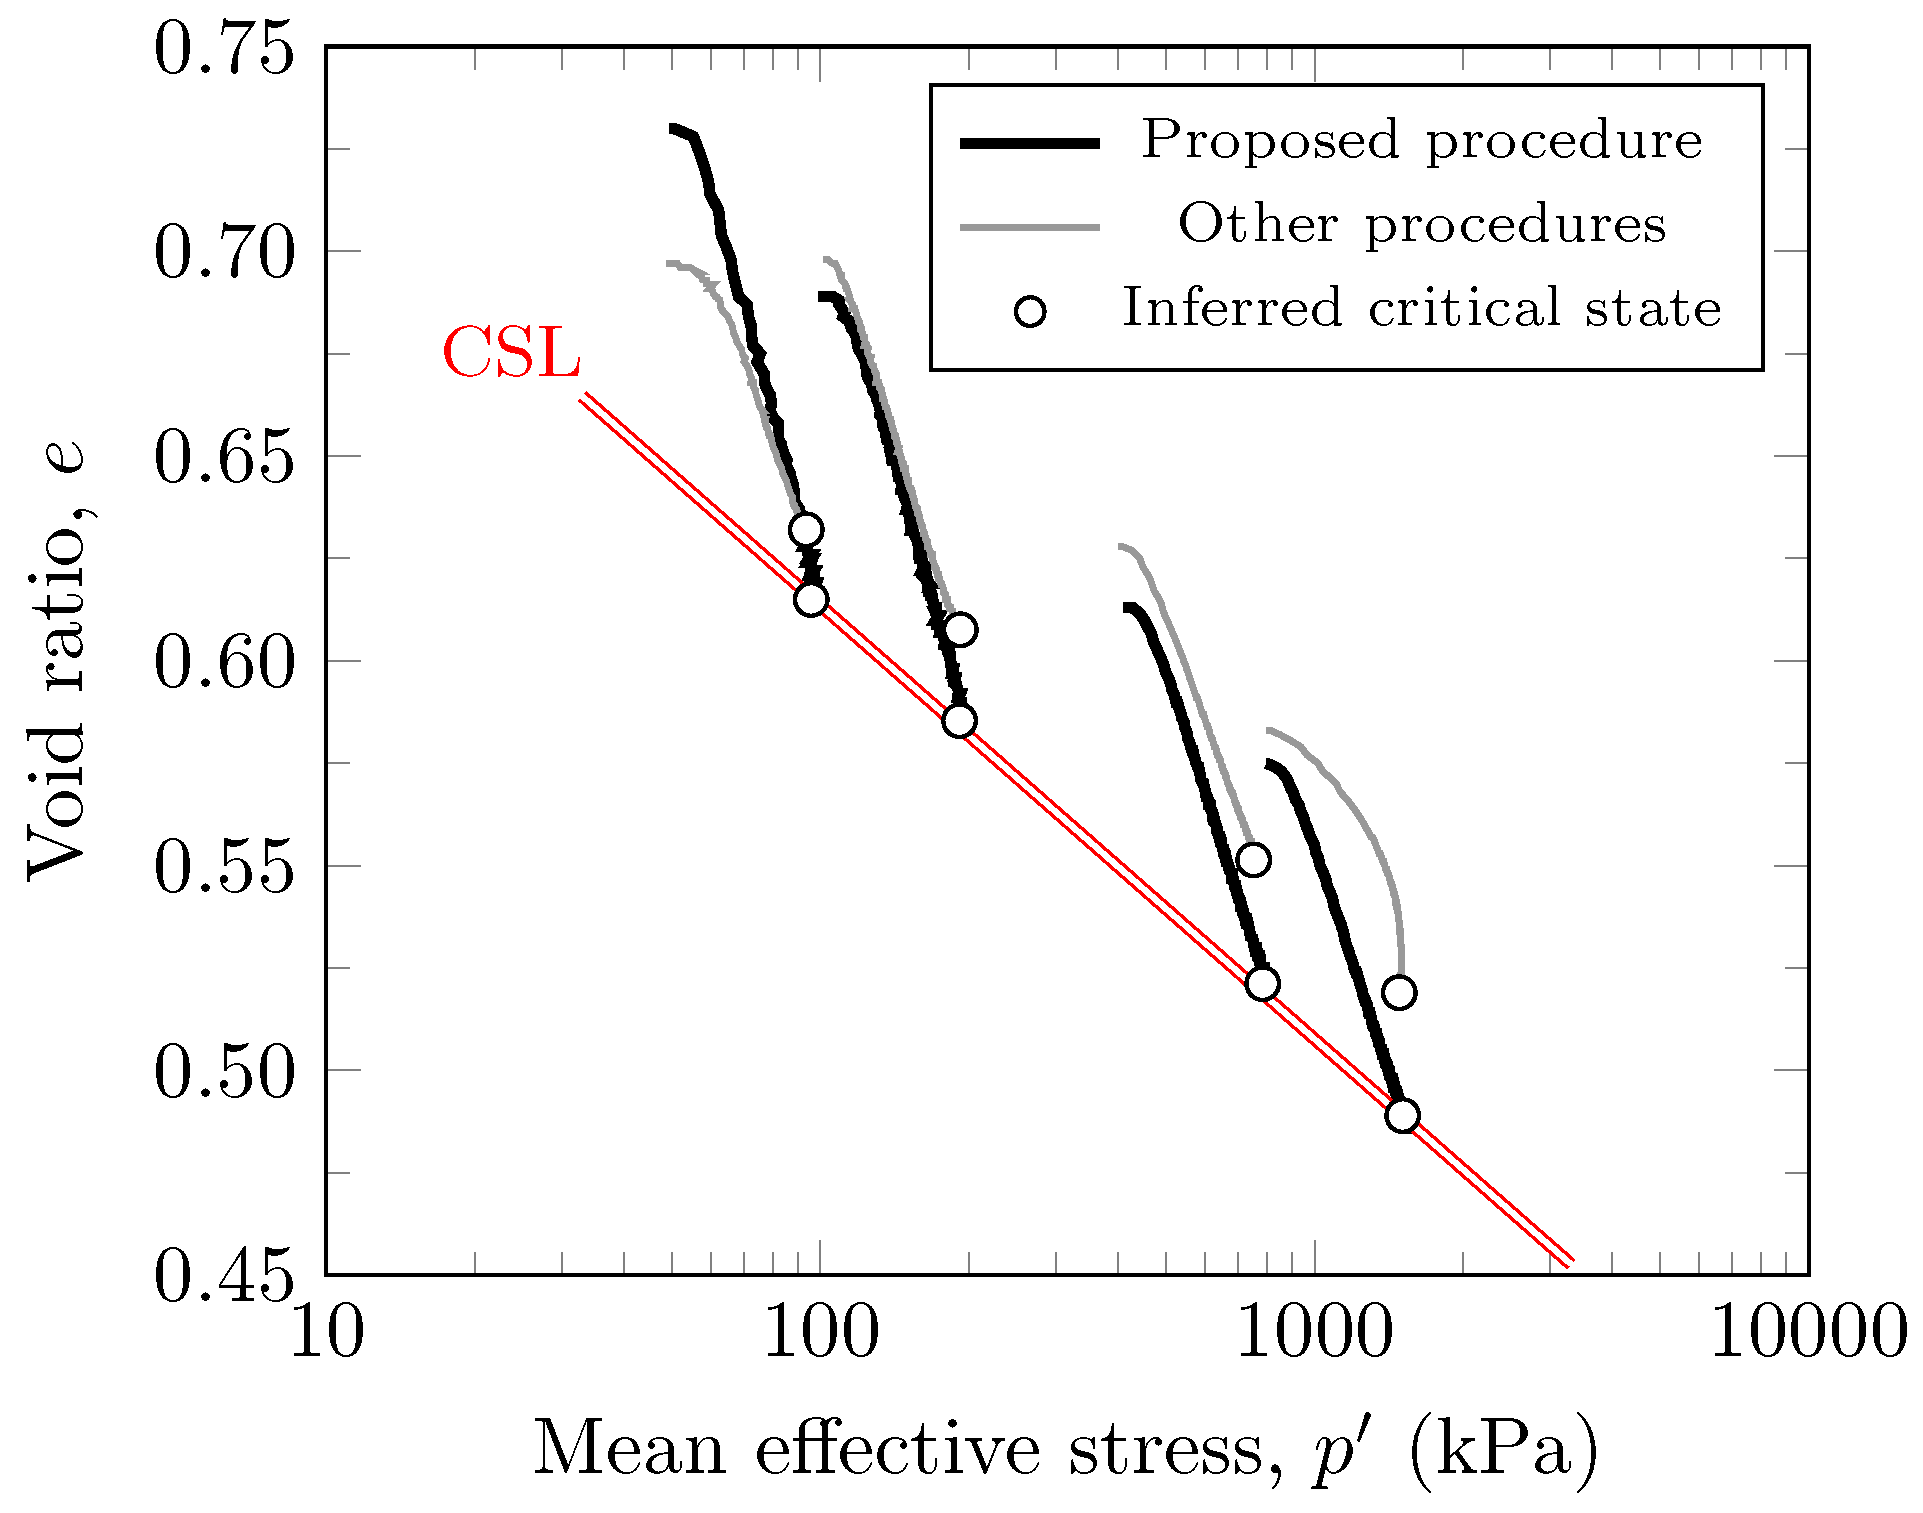
- The comparisons between triaxial configurations showed that the unbiased procedures proposed herein have very low variability and have a notable reproducibility. In addition, they provide reliable results that often are non-conservative in comparison to those obtained by means of other procedures. Hence, it is desirable that the unbiased procedures be implemented in geotechnical laboratories in which the characterisation of soils within the CSSM framework is conducted.
Author Contributions
Funding
Acknowledgments
Conflicts of Interest
Nomenclature and Abbreviations
Nomenclature
| constants of the CSL power-law model | |
| corrected area of the sample | |
| initial cross-section area of the sample | |
| B | pore pressure coefficient |
| initial diameter of the specimen | |
| e | void ratio |
| initial void ratio | |
| void ratio at critical state | |
| elastic modulus for the membrane | |
| specific gravity of the soil | |
| H | height |
| M | slope of critical state in space |
| n | selected layer |
| total number of layers | |
| n | porosity |
| mean effective stress | |
| q | deviatoric stress |
| degree of saturation | |
| initial thickness of the membrane | |
| time factor corresponding to 50% consolidation | |
| time factor corresponding to 90% consolidation | |
| u | pore pressure |
| percent undercompaction | |
| percent undercompaction selected for the first bottom layer | |
| percent undercompaction for the final top layer | |
| P-wave velocity | |
| total volume of the specimen | |
| moist weight of material required at each layer | |
| total wet weight of material required for sample preparation | |
| dry unit weight | |
| intercept of critical state in e: log p´ space | |
| increment in the pore pressure | |
| volume change | |
| CP | increment in the cell pressure |
| axial strain | |
| volumetric strain | |
| instability line | |
| slope of critical state in e: log p´ space | |
| axial stress | |
| radial stress | |
| diameter | |
| gravimetric water content | |
| initial gravimetric water content |
Abbreviations
| ASTM | American Society for Testing and Materials |
| CO | carbon dioxide |
| CSL | critical state locus |
| CSSM | critical state soil mechanics |
| DP | dry pluviation |
| EOTSF | end-of-test soil freezing |
| GSD | grain size distribution |
| GWC | gravimetric water content |
| LEP | lubricated end platens |
| LRC | loading ram connection |
| LVDT | linear variable differential transformer |
| MT | moist tamping |
| NCL | normal consolidation line |
| SD | slurry deposition |
| TP | test path |
| WS | water sedimentation |
References
- Roscoe, K.H.; Schofield, A.N.; Thurairajah, A. Yielding of Clays in States Wetter than Critical. Géotechnique 1963, 13, 211–240. [Google Scholar] [CrossRef]
- Jefferies, M. Nor-Sand: A simple critical state model for sand. Géotechnique 1993, 43, 91–103. [Google Scholar] [CrossRef]
- Bedin, J.; Schnaid, F.; Viana da Fonseca, A.; Costa Filho, L.D.M. Gold tailings liquefaction under critical state soil mechanics. Géotechnique 2012, 62, 673–682. [Google Scholar] [CrossRef]
- Andrade, J.E. A predictive framework for liquefaction instability. Géotechnique 2012, 59, 673–682. [Google Scholar] [CrossRef] [Green Version]
- Soares, M.; Viana da Fonseca, A. Factors Affecting Steady State Locus in Triaxial Tests. Geotech. Test. J. 2016, 36, 20150228. [Google Scholar] [CrossRef]
- Giretti, D.; Fioravante, V.; Been, K.; Dickenson, S. Mechanical properties of a carbonate sand from a dredged hydraulic fill. Géotechnique 2018, 68, 410–420. [Google Scholar] [CrossRef]
- Jefferies, M.; Been, K. Soil Liquefaction: A Critical State Approach, 2nd ed.; Taylor & Francis; CRC Press: London, UK, 2015. [Google Scholar]
- Been, K.; Jefferies, M. Stress-dilatancy in very loose sand. Can. Geotech. J. 2004, 41, 972–989. [Google Scholar] [CrossRef]
- Torres-Cruz, L.A.; Santamarina, J.C. The critical state line of non-plastic tailings. Can. Geotech. J. 2020, 57, 1508–1517. [Google Scholar] [CrossRef]
- Carrera, A.; Coop, M.; Lancellota, R. Influence of grading on the mechanical behaviour of Stava tailings. Géotechnique 2011, 61, 935–946. [Google Scholar] [CrossRef]
- Reid, D.; Fanni, R.; Koh, K.; Orea, I. Characterisation of a subaqueously deposited silt iron ore tailings. Geotech. Lett. 2018, 8, 278–283. [Google Scholar] [CrossRef]
- Jamiolkowski, M. Soil mechanics and the observational method: Challenges at the Zelazny Most copper tailings disposal facility. Géotechnique 2014, 64, 590–618. [Google Scholar] [CrossRef] [Green Version]
- Rowe, P.W.; Barden, L. Importance of Free Ends in Triaxial Testing. J. Soil Mech. Found. Div. 1964, 90, 1–25. [Google Scholar] [CrossRef]
- Baldi, G.; Hight, D.; Thomas, G. A Reevaluation of Conventional Triaxial Test Methods. In Advanced Triaxial Testing of Soils and Rocks; Donaghe, R., Chaney, R., Silver, M., Eds.; ASTM International: West Conshohocken, PA, USA, 1988; pp. 219–263. [Google Scholar]
- Germaine, J.; Ladd, C. Triaxial Testing of Saturated Cohesive Soils. In Advanced Triaxial Testing of Soils and Rocks; Donaghe, R., Chaney, R., Silver, M., Eds.; ASTM International: West Conshohocken, PA, USA, 1988; pp. 421–459. [Google Scholar]
- Koseki, J. Several challenges in advanced laboratory testing of geomaterials with emphasis on unconventional types of liquefaction tests. Geomech. Energy Environ. 2021, 27, 100157. [Google Scholar] [CrossRef]
- Uchida, S.; Levenberg, E.; Klar, A. On-specimen strain measurement with fiber optic distributed sensing. Measurement 2015, 60, 104–113. [Google Scholar] [CrossRef]
- Viana da Fonseca, A.; Ferreira, C.; Soares, M.; Klar, A. Improved laboratory techniques for advanced geotechnical characterization towards matching in situ properties. In Six International Symposium on Deformation Characteristics of Geomaterials; Rinaldi, V.A., Zeballos, M.E., Clariá, J.J., Eds.; IOS Press: Buenos Aires, Argentina, 2015. [Google Scholar]
- Sutton, M.; Orteu, M.A.; Schreier, H. image Correlation for Shape, Motion and Deformation Measurements—Basic Concepts, Theory and Applications, 1st ed.; Springer: Berlin/Heidelberg, Germany, 2009. [Google Scholar]
- Dijkstra, J.; Broere, W. Combined full field stress and strain measurement methods for granular materials. EPJ Web Conf. 2010, 6, 22020. [Google Scholar] [CrossRef] [Green Version]
- Desrues, J.; Chambon, R.; Mokni, M.; Mazerolle, F. Void ratio evolution inside shear bands in triaxial sand specimens studied by computed tomography. Géotechnique 1996, 46, 529–546. [Google Scholar] [CrossRef]
- Oda, M.; Takemura, T.; Takahashi, M. Microstructure in shear band observed by microfocus X-ray computed tomography. Géotechnique 2004, 54, 539–542. [Google Scholar] [CrossRef]
- Sladen, J.A.; Handford, G. A potential systematic error in laboratory testing of very loose sands. Can. Geotech. J. 1987, 24, 462–466. [Google Scholar] [CrossRef]
- Ghafghazi, M.; Shuttle, D.; DeJong, J.T. Particle breakage and the critical state of sand. Soils Found. 2014, 54, 451–461. [Google Scholar] [CrossRef]
- Cho, G.-C.; Dodds, J.; Santamarina, J.C. Particle Shape Effects on Packing Density, Stiffness, and Strength: Natural and Crushed Sands. J. Geotech. Geoenviron. Eng. 2006, 132, 591–602. [Google Scholar] [CrossRef] [Green Version]
- Luzzani, L.; Coop, M.R. On the relationship between particle breakage and the critical state of sands. Soils Found. 2002, 42, 71–82. [Google Scholar] [CrossRef] [Green Version]
- Bandini, V.; Coop, M.R. The influence of particle breakage on the location of the critical state line of sands. Soils Found. 2002, 51, 591–600. [Google Scholar] [CrossRef] [Green Version]
- Yu, F.W. Particle breakage and the critical state of sands. Géotechnique 2017, 67, 713–719. [Google Scholar] [CrossRef]
- Ferreira, P.M.V.; Bica, A.V.D. Problems in identifying the effects of structure and critical state in a soil with a transitional behaviour. Géotechnique 2006, 56, 445–454. [Google Scholar] [CrossRef]
- Altuhafi, F.; Baudet, B.A.; Sammonds, P. The mechanics of subglacial sediment: An example of new “transitional” behaviour. Can. Geotech. J. 2010, 56, 775–790. [Google Scholar] [CrossRef] [Green Version]
- Xu, L.; Coop, M.R. The mechanics of a saturated silty loess with a transitional mode. Géotechnique 2017, 67, 581–596. [Google Scholar] [CrossRef] [Green Version]
- Nocilla, A.; Coop, M.R.; Colleselli, F. The mechanics of an Italian silt: An example of “transitional” behaviour. Géotechnique 2006, 67, 261–271. [Google Scholar] [CrossRef]
- Rios, S.; Ciantia, M.; Gonzalez, N.; Arroyo, M.; Viana da Fonseca, A. Simplifying calibration of bonded elasto-plastic models. Comput. Geotech. 2016, 67, 100–108. [Google Scholar] [CrossRef] [Green Version]
- Lade, P.V.; Trads, N. The role of cementation in the behaviour of cemented soils. Geotech. Res. 2014, 67, 111–132. [Google Scholar] [CrossRef] [Green Version]
- Ponzoni, E.; Nocilla, A.; Coop, M.R.; Colleselli, F. Identification and quantification of transitional modes of behaviour in sediments of Venice lagoon. Géotechnique 2014, 67, 694–708. [Google Scholar] [CrossRef]
- Verdugo, R.; Ishihara, K. The Steady State of Sandy Soils. Soils Found. 1996, 36, 81–91. [Google Scholar] [CrossRef] [Green Version]
- Li, X.S.; Wang, Y. Linear Representation of Steady-State Line for Sand. J. Geotech. Geoenviron. Eng. 1998, 124, 1215–1217. [Google Scholar] [CrossRef]
- Schnaid, F.; Bedin, J.; Viana da Fonseca, A.; de Moura Costa Filho, L. Stiffness and Strength Governing the Static Liquefaction of Tailings. J. Geotech. Geoenviron. Eng. 2013, 139, 2136–2144. [Google Scholar] [CrossRef]
- Altuhafi, F.N.; Coop, M.R.; Georgiannou, V.N. Effect of Particle Shape on the Mechanical Behavior of Natural Sands. J. Geotech. Geoenviron. Eng. 2016, 142, 04016071. [Google Scholar] [CrossRef]
- Klotz, E.U.; Coop, M.R. On the identification of critical state lines for sands. Geotech. Test. J. 2002, 25, 289–302. [Google Scholar]
- Sladen, J.A.; D’Hollander, R.D.; Krahn, J. The liquefaction of sands, a collapse surface approach. Can. Geotech. J. 1985, 22, 564–578. [Google Scholar] [CrossRef]
- Yamamuro, J.A.; Lade, P.V. Steady-State Concepts and Static Liquefaction of Silty Sands. J. Geotech. Geoenviron. Eng. 1998, 124, 868–877. [Google Scholar] [CrossRef]
- Goto, S.; Tatsuoka, F. Effects of End Conditions on IHaxial Compressive Strength for Cohesionless Soils. In Advanced Triaxial Testing of Soils and Rocks; Donaghe, R., Chaney, R., Silver, M., Eds.; ASTM International: West Conshohocken, PA, USA, 1988; pp. 692–705. [Google Scholar]
- Lade, P.V. Triaxial Testing of Soils, 1st ed.; John Wiley & Sons, Ltd.: Chichester, UK, 2016. [Google Scholar]
- Lam, W.-K.; Tatsuoka, T. Triaxial Compressive and Extension Strength of Sand Affected by Strength Anisotropy and Sample Slenderness. In Advanced Triaxial Testing of Soils and Rocks; Donaghe, R., Chaney, R., Silver, M., Eds.; ASTM International: West Conshohocken, PA, USA, 1988; pp. 655–666. [Google Scholar]
- Kolymbas, D.; Wu, W. Recent results of triaxial tests with granular materials. Powder Technol. 1990, 60, 99–119. [Google Scholar] [CrossRef]
- Ueng, T.-S.; Tzou, Y.-M.; Lee, C.-J. The Effect of End Restraint on Volume Change and Partide Breakage of Sands in THaxial Tests. In Advanced Triaxial Testing of Soils and Rocks; Donaghe, R., Chaney, R., Silver, M., Eds.; ASTM International: West Conshohocken, PA, USA, 1988; pp. 679–691. [Google Scholar]
- Reid, D.; Fourie, A.; Ayala, J.L.; Dickinson, S.; Ochoa-Cornejo, F.; Fanni, R.; Garfias, J.; da Fonseca, A.V.; Ghafghazi, M.; Ovalle, C.; et al. Results of a critical state line testing round robin programme. Géotechnique 2021, 71, 616–630. [Google Scholar] [CrossRef]
- Hettler, A.; Vardoulakis, I. Behaviour of dry sand tested in a large triaxial apparatus. Géotechnique 1984, 34, 183–630. [Google Scholar] [CrossRef]
- Viana da Fonseca, A. Load Tests on Residual Soil and Settlement Prediction on Shallow Foundation. J. Geotech. Geoenviron. Eng. 2001, 124, 868–877. [Google Scholar]
- Viana da Fonseca, A.; Pineda, J. Getting high-quality samples in ‘sensitive’ soils for advanced laboratory tests. Innov. Infrastruct. Solut. 2017, 2, 34. [Google Scholar] [CrossRef] [Green Version]
- Viana da Fonseca, A.; Ferreira, C.; Ramos, C.; Molina-Gómez, F. The geotechnical test site in the greater Lisbon area for liquefaction characterisation and sample quality control of cohesionless soils. AIMS Geosci. 2019, 5, 325–343. [Google Scholar] [CrossRef]
- Molina-Gómez, F.; Ferreira, C.; Ramos, C.; Viana da Fonseca, A. Performance of Gel-Push sampling in liquefiable soils. Geotech. Lett. 2020, 10, 256–261. [Google Scholar] [CrossRef]
- Been, K.; Jefferies, M.G.; Hachey, J. Discussion: The critical state of sands. Géotechnique 1992, 42, 655–663. [Google Scholar] [CrossRef]
- Vaid, Y.P.; Sivathayalan, S.; Stedman, D. Influence of Specimen-Reconstituting Method on the Undrained Response of Sand. Geotech. Test. J. 1999, 22, 187–195. [Google Scholar]
- Chang, N.; Heymann, G.; Clayton, C. The effect of fabric on the behaviour of gold tailings. Géotechnique 2011, 61, 187–197. [Google Scholar] [CrossRef] [Green Version]
- Reid, D.; Fanni, R. A comparison of intact and reconstituted samples of a silt tailings. Géotechnique 2020, in press. [Google Scholar] [CrossRef]
- Yamashita, S.; Kawaguchi, T.; Nakata, Y.; Mikamt, T.; Fujiwara, T.; Shibuya, S. Interpretation of international parallel test on the measurement of Gmax using bender elements. Soils Found. 2009, 49, 631–650. [Google Scholar] [CrossRef] [Green Version]
- Miranda, L.; Caldeira, L.; Serra, J.; Gomes, R.C. Dynamic behaviour of Tagus River sand including liquefaction. Bull. Earthq. Eng. 2020, 18, 4581–4604. [Google Scholar] [CrossRef]
- Molina-Gómez, F.; Viana da Fonseca, A.; Ferreira, C.; Camacho-Tauta, J. Dynamic properties of two historically liquefiable sands in the Lisbon area. Soil Dyn. Earthq. Eng. 2020, 132, 106101. [Google Scholar] [CrossRef]
- Yamamuro, J.A.; Wood, F.M. Effect of depositional method on the undrained behavior and microstructure of sand with silt. Soil Dyn. Earthq. Eng. 2004, 24, 751–760. [Google Scholar] [CrossRef]
- Ladd, R.S. Specimen preparation and cyclic stability of sands. J. Geotech. Geoenviron. Eng. 1977, 103, 535–547. [Google Scholar]
- Clayton, C.R.I. Stiffness at small strain: Research and practice. Géotechnique 2011, 61, 5–37. [Google Scholar] [CrossRef] [Green Version]
- Been, K.; Jefferies, M.G.; Hachey, J. The critical state of sands. Géotechnique 1991, 41, 365–381. [Google Scholar] [CrossRef]
- Ishihara, K. Liquefaction and flow failure during earthquakes. Géotechnique 1993, 43, 351–451. [Google Scholar] [CrossRef]
- Shipton, B.; Coop, M.R. On the compression behaviour of reconstituted soils. Soils Found. 2012, 52, 668–681. [Google Scholar] [CrossRef] [Green Version]
- Li, W.; Coop, M.R.; Senetakis, K.; Schnaid, F. The mechanics of a silt-sized gold tailing. Eng. Geol. 2018, 241, 97–108. [Google Scholar] [CrossRef] [Green Version]
- Papadimitriou, A.G.; Dafalias, Y.F.; Yoshimine, M. Plasticity modeling of the effect of sample preparation method on sand response. Soils Found. 2005, 45, 109–123. [Google Scholar] [CrossRef] [Green Version]
- Lade, P.V.; Yamamuro, J.A.; Skyers, B.D. Effects of shear band formation in triaxial extension tests. Geotech. Test. J. 1999, 19, 398–410. [Google Scholar]
- Wang, Q.; Lade, P.V. Shear Banding in True Triaxial Tests and Its Effect on Failure in Sand. J. Eng. Mech. 2001, 127, 754–761. [Google Scholar] [CrossRef]
- Wichtmann, T.; Triantafyllidis, T. An experimental database for the development, calibration and verification of constitutive models for sand with focus to cyclic loading: Part I—tests with monotonic loading and stress cycles. Acta Geotech. 2016, 11, 739–761. [Google Scholar] [CrossRef]
- Ladd, R. Preparing Test Specimens Using Undercompaction. Geotech. Test. J. 1978, 1, 16–23. [Google Scholar]
- Reid, D.; Fourie, A.; Moggach, S. Characterization of a gold tailings with hypersaline pore fluid. Can. Geotech. J. 2020, 57, 482–496. [Google Scholar] [CrossRef]
- D4767—Standard Test Method for Consolidated Undrained Triaxial Compression Test for Cohesive Soils; ASTM International: West Conshohocken, PA, USA, 2020.
- D7181—Standard Test Method for Consolidated Undrained Triaxial Compression Test for Soils; ASTM International: West Conshohocken, PA, USA, 2020.
- C702—Standard Practice for Reducing Samples of Aggregate to Testing Size; ASTM International: West Conshohocken, PA, USA, 2018.
- Thomson, P.R.; Wong, R.C.K. Specimen nonuniformities in water-pluviated and moist-tamped sands under undrained triaxial compression and extension. Can. Geotech. J. 2008, 45, 939–956. [Google Scholar] [CrossRef]
- Frost, J.D.; Park, J.Y. A critical assessment of the moist tamping technique. Geotech. Test. J. 2003, 26, 57–70. [Google Scholar]
- Ampadu, S.K.; Tatsuoka, F. Effect of setting method on the behaviour of clays in triaxial compression from saturation to undrained shear. Soils Found. 1993, 33, 14–34. [Google Scholar] [CrossRef] [Green Version]
- Skempton, A.W. The Pore-Pressure Coefficients A and B. Géotechnique 1954, 4, 143–147. [Google Scholar] [CrossRef]
- Leong, E.C.; Cheng, Z.Y. Effects of Confining Pressure and Degree of Saturation on Wave Velocities of Soils. Int. J. Geomech. 2016, 16, D4016013. [Google Scholar]
- Kokusho, T. Correlation of pore-pressure B-value with P-wave velocity and Poisson’s ratio for imperfectly saturated sand or gravel. Soils Found. 2000, 40, 95–102. [Google Scholar] [CrossRef] [Green Version]
- Kumar, J.; Madhusudhan, B.N. Dynamic properties of sand from dry to fully saturated states. Géotechnique 2012, 62, 45–54. [Google Scholar] [CrossRef]
- Viana da Fonseca, A.; Ferreira, C.; Fahey, M. A Framework Interpreting Bender Element Tests, Combining Time-Domain and Frequency-Domain Methods. Geotech. Test. J. 2009, 32, 100974. [Google Scholar]
- Ferreira, C.; Díaz-Durán, F.; Viana da Fonseca, A.; Cascante, G. New approach to concurrent Vs and Vp measurements using bender elements. Geotech. Test. J. 2021, accepted. [Google Scholar]
- Santamarina, J.C.; Klein, K.A.; Fam, M.A. Soils and Waves, 1st ed.; ohn Wiley & Sons, Ltd.: Chichester, UK, 2001. [Google Scholar]
- Yang, J. Liquefaction resistance of sand in relation to P-wave velocity. Géotechnique 2002, 52, 295–298. [Google Scholar] [CrossRef]
- Yoshimi, Y.; Tanaka, K.; Tokimatsu, K. Liquefaction resistance of a partially saturated sand. Soils Found. 1989, 52, 295–298. [Google Scholar] [CrossRef] [Green Version]
- Tsukamoto, Y.; Ishihara, K.; Nakazawa, H.; Kamada, K.; Huang, Y. Resistance of partly saturated sand to liquefaction with reference to longitudinal and shear wave velocities. Soils Found. 2002, 42, 93–104. [Google Scholar] [CrossRef] [Green Version]
- Tamura, S.; Tokimatsu, K.; Abe, A.; Sato, M. Effects of air bubbles on B-value and P-wave velocity of a partly saturated sand. Soils Found. 2002, 42, 121–129. [Google Scholar] [CrossRef] [Green Version]
- Emerson, M.; Foray, P. Laboratory P-wave measurements in dry and saturated sand. Acta Geotech. 2006, 1, 167–177. [Google Scholar] [CrossRef]
- Biot, M.A. Theory of Propagation of Elastic Waves in a Fluid-Saturated Porous Solid I. Low-Frequency Range. J. Acoust. Soc. Am. 1956, 28, 168–178. [Google Scholar] [CrossRef]
- Biot, M.A. Theory of Propagation of Elastic Waves in a Fluid-Saturated Porous Solid II. Higher Frequency Range. J. Acoust. Soc. Am. 1956, 28, 179–191. [Google Scholar] [CrossRef]
- Molina-Gómez, F.; Viana da Fonseca, A. Key geomechanical properties of the historically liquefiable TP-Lisbon sand. Soils Found. 2021, in press. [Google Scholar] [CrossRef]
- Head, K.H. Manual of Soil Laboratory Testing—Volume 2—Permeability, shear strength and compressibility tests, 3rd ed.; Pentech Press Limited: London, UK, 2006. [Google Scholar]
- Nicholson, P.G.; Seed, R.B.; Anwar, H.A. Elimination of membrane compliance in undrained triaxial testing. I. Measurement and evaluation. Can. Geotech. J. 1993, 30, 727–738. [Google Scholar] [CrossRef]
- Delgado, B.G.; Viana da Fonseca, A.; Fortunato, E.; Maia, P. Mechanical behavior of inert steel slag ballast for heavy haul rail track: Laboratory evaluation. Transp. Geotech. 2019, 20, 100243. [Google Scholar] [CrossRef]
- Duncan, J.M.; Seed, H.B. Errors in Strenght Tests and Recommended Corrections; Institute of Transportation Studies, University of California Berkeley: Berkley, CA, USA, 1965. [Google Scholar]
- Duncan, J.M.; Seed, H.B. Corrections for Strength Test Data. J. Soil Mech. Found. Div. 1967, 93, 121–137. [Google Scholar] [CrossRef]
- Fourie, A.B.; Papageorgiou, G. Defining an appropriate steady state line for Merriespruit gold tailings. Can. Geotech. J. 2001, 38, 695–706. [Google Scholar] [CrossRef]
- Santos, J.A.; Gomes, R.C.; Lourenço, J.C.; Marques, F.; Coelho, P.; Azeiteiro, R.; Santos, L.A.; Marques, V.; da Fonseca, A.V.; Soares, M.; et al. Coimbra Sand—Round Robin tests to evaluate liquefaction resistance. In Proceedings of the 15th World Conference on Earthquake Engineering, Lisbon, Portugal, 24–28 September 2012. [Google Scholar]
- Azeiteiro, R.J.N.; Coelho, P.A.L.F.; Taborda, D.M.G.; Grazina, J.C.D. Critical State–Based Interpretation of the Monotonic Behavior of Hostun Sand. J. Geotech. Geoenviron. Eng. 2017, 143, 04017004-1–04017004-14. [Google Scholar] [CrossRef]
Short Biography of Authors
 | António Viana da Fonseca PhD, Professor in Geotechnical Engineering in the Civil Engineering Department at the University of Porto (FEUP), Director of the Geotechnical Laboratory. His expertise has focus in advanced experimental soil mechanics and modelling of natural and artificial soils, including non-conventional materials, such as mine tailings. He is the Chairman of ISSMGE TC-102, “Ground Property Characterization by In-Situ Tests”, 2013–2021. He is a fellow and former President of the College of Geotechnical Specialists of the Portuguese Institution of Engineers. He is a consultant and practitioner specialising in the areas of lab and in situ testing of soils, foundations and deep excavations of soil structure interaction analyses and earthquake design of geotechnical structures, including soil liquefaction induced damages and mitigation. He is also an advisor for the risk assessment and safety improvement of more than 50 tailings dams in Brazil; among other research projects, he serves for the H2020 project LIQUEFACT, leading the WP: “Structural liquefaction resilience and vulnerability assessment methodologies”. |
 | Diana Cordeiro, MSc, is a researcher in CONSTRUCT-GEO of the Faculdade de Engenharia da Universidade do Porto (FEUP), Portugal. She received her master’s degree in Civil Engineering from FEUP in 2018 with an emphasis in Geotechnics. Her experimental work on LabGEO (at FEUP) began with her master’s project on desaturation as an effective measure of liquefaction mitigation followed by a scholarship for the research project LIQ2PROEARTH, assessing liquefaction susceptibility throughout in situ and laboratory tests. Currently, her main research is focused on the geomechanical behaviour of tailing materials within the critical state framework by laboratory testing. |
 | Fausto Molina-Gómez is a PhD researcher in CONSTRUCT-GEO of the Faculdade de Engenharia da Universidade do Porto (FEUP), Portugal. He received his BScEng in Civil Engineering in 2014 from the Universidad Militar Nueva Granada (Colombia) and his MSc in Civil Engineering with an emphasis in Geotechnics in 2016 from the Universidad de los Andes (Colombia). His research interests and expertise are in geomechanics, geotechnical earthquake engineering (in particular, problems associated with liquefaction), soil testing, wave propagation, critical state soil mechanics and statistical data interpretation. |





| Studied | Gs | Fines | Cc | Cu | Shape of | |||
|---|---|---|---|---|---|---|---|---|
| Soil | ( – ) | (mm) | Content (%) | ( – ) | ( – ) | ( – ) | ( – ) | Particles |
| Gold tailing | 2.78 | 0.05 | 58.75 | 1.44 | 25 | 1.45 | 0.39 | Sub-rounded |
| Coimbra | 2.65 | 0.28 | 1.80 | 1.37 | 1.69 | 0.81 | 0.48 | Sub-rounded |
| TP-Lisbon | 2.66 | 0.21 | 2.21 | 1.13 | 2.13 | 1.01 | 0.63 | Sub-angular |
| Hostun | 2.64 | 0.34 | 0.00 | 0.96 | 1.43 | 1.00 | 0.66 | Sub-angular |
| Laboratory | Shearing | LEP | Top-cap | ||
|---|---|---|---|---|---|
| Conditions | (kPa) | ( – ) | LRC | ||
| UPorto | Drained | 50 | 0.73 | yes | yes |
| Drained | 100 | 0.689 | yes | yes | |
| Drained | 400 | 0.613 | yes | yes | |
| Drained | 800 | 0.575 | yes | yes | |
| Undrained | 200 | 0.659 | yes | yes | |
| Undrained | 200 | 0.632 | no | yes | |
| Undrained | 800 | 0.578 | yes | yes | |
| Undrained | 800 | 0.566 | no | yes | |
| UWA | Drained | 100 | 0.698 | yes | no |
| Golder-P | Undrained | 200 | 0.67 | yes | no |
| Golder-V | Drained | 50 | 0.697 | yes | no |
| Undrained | 800 | 0.592 | yes | no | |
| BGC | Drained | 400 | 0.628 | yes | no |
| KCB | Drained | 400 | 0.628 | yes | no |
| Test Identification | Proposed Methods | Other Methods | ||
|---|---|---|---|---|
| Using in kPa | (kPa) | ( – ) | (kPa) | ( – ) |
| 50 | 96 | 0.616 | 94 | 0.632 |
| 100 | 191 | 0.585 | 191 | 0.608 |
| 400 | 785 | 0.521 | 752 | 0.551 |
| 800 | 1507 | 0.489 | 1483 | 0.524 |
Publisher’s Note: MDPI stays neutral with regard to jurisdictional claims in published maps and institutional affiliations. |
© 2021 by the authors. Licensee MDPI, Basel, Switzerland. This article is an open access article distributed under the terms and conditions of the Creative Commons Attribution (CC BY) license (https://creativecommons.org/licenses/by/4.0/).
Share and Cite
da Fonseca, A.V.; Cordeiro, D.; Molina-Gómez, F. Recommended Procedures to Assess Critical State Locus from Triaxial Tests in Cohesionless Remoulded Samples. Geotechnics 2021, 1, 95-127. https://doi.org/10.3390/geotechnics1010006
da Fonseca AV, Cordeiro D, Molina-Gómez F. Recommended Procedures to Assess Critical State Locus from Triaxial Tests in Cohesionless Remoulded Samples. Geotechnics. 2021; 1(1):95-127. https://doi.org/10.3390/geotechnics1010006
Chicago/Turabian Styleda Fonseca, António Viana, Diana Cordeiro, and Fausto Molina-Gómez. 2021. "Recommended Procedures to Assess Critical State Locus from Triaxial Tests in Cohesionless Remoulded Samples" Geotechnics 1, no. 1: 95-127. https://doi.org/10.3390/geotechnics1010006
APA Styleda Fonseca, A. V., Cordeiro, D., & Molina-Gómez, F. (2021). Recommended Procedures to Assess Critical State Locus from Triaxial Tests in Cohesionless Remoulded Samples. Geotechnics, 1(1), 95-127. https://doi.org/10.3390/geotechnics1010006


