Article

Novel Methods for the Computation of Small-Strain Damping Ratios of Soils from Cyclic Torsional Shear and Free-Vibration Decay Testing

1
Department of Civil and Environmental Engineering, The University of Texas at Austin, Austin, TX 78712, USA
2
Haley & Aldrich, Seattle, WA 98121, USA
*
Author to whom correspondence should be addressed.
Geotechnics 2021, 1(2), 330-346; https://doi.org/10.3390/geotechnics1020016
Submission received: 15 July 2021 / Revised: 3 October 2021 / Accepted: 15 October 2021 / Published: 21 October 2021

Abstract

:
This paper illustrates two novel methods for computing the small-strain hysteretic material damping ratio, λmin, of soils from the cyclic torsional shear (TS) and computing the small-strain viscous material damping ratio, Dmin, from the free-vibration decay (FVD) testing. Both λmin and Dmin are challenging to measure, due to the significant level of ambient noise at small strains (<10−4%). A two-step method is proposed combining the Fourier Transform and a phase-based data fitting method for torsional shear testing, and this method can effectively eliminate the ambient noise at small strains. A Hilbert Transform-based method is proposed for the free-vibration decay testing in order to achieve a more accurate measurement of the viscous material damping ratio, D, at different strain levels, especially at small strains. The improved λmin and Dmin at small strains are compared to data available in the literature. The two novel methods are shown to be accurate in computing the small-strain damping ratios.

1. Introduction

In the dynamic testing of soils, there are often two types of material damping ratios [1]. The first type of material damping ratio is the hysteretic material damping ratio, λ, typically measured from a hysteresis (cyclic stress–strain) loop. The hysteretic damping quantifies the energy dissipated per cycle that is independent of the loading frequency [2]. Therefore, the hysteretic damping ratio is frequency-independent. The hysteretic material damping ratio, λ, can be measured with multiple cyclic testing devices, such as cyclic triaxial, cyclic simple shear, and cyclic torsional shear devices. The second type of material damping ratio is the viscous material damping ratio, which is a non-dimensional characterization of the energy decay rate relative to the natural frequency [2]. This definition indicates that the viscous damping ratio is frequency-dependent. The viscous damping ratio can be measured by both the free-vibration decay and the half-power bandwidth method [2,3,4,5]. The half-power bandwidth method is mostly used to measure the viscous material damping ratio at small strains, while the free-vibration decay method should be employed when the level of strain is over 5 × 10⁻³%.
Over the past 60 years, numerous researchers have been advancing the measurement of material damping ratios in laboratories, and various forms of testing equipment, as well as methods, have been developed [3,4,5,6,7,8,9,10]. However, due to the complexity of measuring material damping ratios at small strains, such as the limitation of the accuracy of sensors and the significant ambient noise, damping ratios measured by cyclic torsional shear devices below 10−4% of shear strain often lack precision [5,6,7]. Other devices, such as cyclic triaxial or cyclic simple shear devices, cannot be used to measure the small-strain damping ratio. This results in large uncertainty in the characterization of small-strain material damping ratios [5,6,7,8,9,11]. Yu et al. [12] pointed out that the measurement and computation of small-strain damping ratio can influence the accuracy of developing nonlinear damping models because the significant uncertainty among the small-strain measurements inevitably influences the modeling of small-strain damping ratios. Additionally, the small-strain damping models with inherited uncertainties from the small-strain database can further influence the nonlinear material damping models since the small-strain damping ratio is an essential input to the nonlinear damping curve [8,9,10,11,12,13].
Therefore, it is significant to accurately compute the small-strain damping ratios in laboratories to eliminate the uncertainty within the database of small-strain measurements. In order to improve the computation of small-strain material damping ratios, two new methods are proposed in this article. The first is with regard to the cyclic torsional shear testing (TS), and the second is for the free-vibration decay testing (FVD), as both methods are widely used in dynamic soil testing. The proposed method for TS testing can increase the accuracy of TS testing at small strains to decrease the uncertainty among the small-strain measurements. The proposed method for FVD can improve the application of FVD at small strains, considering that FVD is mostly performed in the nonlinear range of strains [6]. The derivations and procedures of these novel methods are discussed in the following sections. Examples of the application of these two methods are also included to show that the improved accuracy is achieved in computing damping ratios at extremely small strains below 10−4% by the new methods.

2. The Proposed Method for Computing the Small-Strain Hysteretic Damping Ratio, λmin, of Soils from Cyclic Torsional Shear Testing

2.1. Conventional Method of λmin Computation from Cyclic Torsional Shear Testing

The conventional method of λmin computation is based on area integration [5,7]. In theory, the area of the hysteresis (stress–strain) loop is related to the energy dissipation, which can conveniently be used for computing the hysteretic material damping ratio [2]. Based on the theory of soil dynamics, the material damping ratio is described as the ratio between the energy dissipated by the soil, quantified by the area of the hysteresis loop, AL, and four times the maximum strain energy, quantified by the triangular area, AT, as shown in Figure 1. The shear modulus, G, is simply the ratio between the maximum stress and strain. This method has been widely used to calculate the hysteretic damping ratio from cyclic tests, including cyclic triaxial, simple shear, and torsional shear tests, due to its relative simplicity [14].
Most soils exhibit a small amount of material damping ratio at small strains, typically at strains less than 5 × 10⁻³% [3,9]. Within the small-strain range, the material damping ratio should remain constant. A theoretical hysteresis loop and the corresponding time series of soil at small strains are shown in Figure 2 as an example. The hysteretic material damping ratio, λ, in the example is 0.5%. The time series of the stress and strain signals from an ideal cyclic test without any ambient noise are shown in Figure 2a,b, respectively. The corresponding hysteresis loop is shown in Figure 2c. The peak strain of the narrow loops is approximately 3.5 × 10⁻⁴%, which is a very small strain. However, in reality, the hysteresis loop at extremely small strains (<10−4%) would not have a clean response as in Figure 2 due to the influence of the ambient noise. Under most circumstances, the ambient noise will distort the shape of the hysteresis loops as well as the time series of strain signals [15]. The distortion of the hysteresis loops is because the hysteresis loops at small strains can be influenced by some reduplicative ambient noise from frequencies other than the excitation frequency (typically between 0.1 to 1 Hz) [5]. As the conventional method is essentially a graphical solution, the distortion of the hysteresis loops by the noise results in poor accuracy. An example of real measurements with the ambient noise present will be shown in the following section.
The poor accuracy of the conventional method at strains less than 10−4% typically leads to a higher value of λmin [6]. When material damping ratios are plotted against strains, multiple λmin measurements at small strains differ in values due to the ambient noise where they should be the same value in theory. This significantly increases the uncertainty in the value of λmin. To reduce the effects of noise, the damping ratio of each cycle can be calculated individually, and then an average of the damping ratios from multiple cycles is used as the representative value. This method is referred to as the stacking method [7]. Hysteretic damping ratios computed using this method are highly dependent on the quality of signals. Theoretically, this simplified stacking method is only valid when the noise is completely random. Additionally, a large number of measurements is often required to sufficiently eliminate the ambient noise by stacking. However, cyclic tests at small strains are typically run for no more than 30 cycles, due to the time inefficiency of soil testing by nature, especially at low excitation frequencies [6].
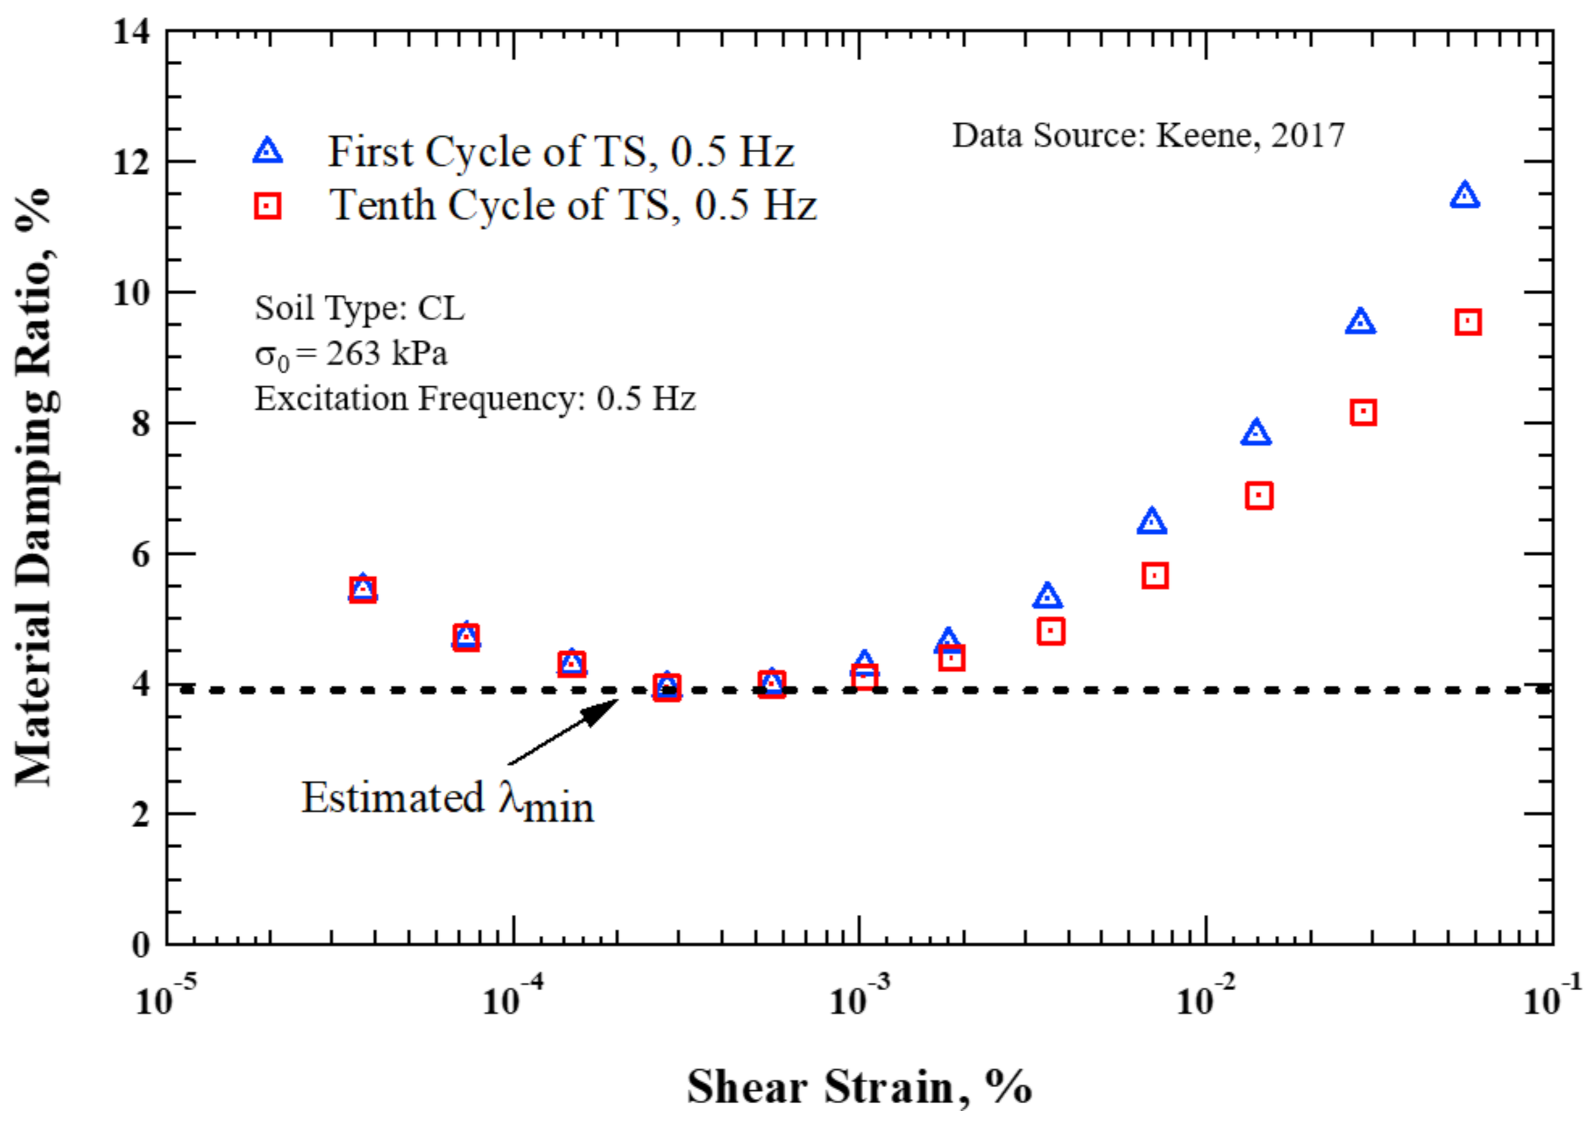
The results shown in Figure 3 are from a torsional shear test on an unsaturated and overconsolidated low-plasticity clay (CL) excited at 0.5 Hz [7]. This clay specimen was confined at an isotropic mean confining pressure, σ0, of 263 kPa (2.6 atm) and excited for 11 cycles at a constant stress level. When the stacking method is applied to the small strain results of the specimen, it can be observed that the material damping ratios steadily decrease for the first four small-strain measurements. The first four damping ratios have a mean of 4.59% and a standard deviation of 0.69%. Therefore, the uncertainty in these measurements is nonnegligible. The reported λmin of this material is 3.9%; however, this value is questionable as the first four measurements of λmin show quite different values. In certain projects, such as Nuclear Quality Assurance Level-1 (NQA-1), the significant uncertainty among the measured small-strain hysteretic damping ratios would lead to a rejection of the test results. The uncertainty among the small-strain hysteretic damping ratios is one of the reasons that resonant column testing is often preferred in NQA-1 projects over torsional shear testing [5,6,7].

2.2. Proposed Method of λmin Calculated from Torsional Shear Testing

A phase-based analytical solution to calculate the hysteretic material damping ratio is derived in this section. The Fourier Transform is applied to the strain signal to accurately calculate the strain amplitude. Then, the phase shift is determined by applying a best-fit approach.

2.2.1. Step I: Phase-Based Method of λmin Computation from TS Testing

In addition to graphically computing the hysteretic material damping ratio, the damping ratio can also be calculated by the phase shift between stress and strain time series. Assuming that both the stress, σ, and strain, ε, series are sinusoidal signals with amplitudes σ0 and ε0, as well as a phase shift, φ, an analytical solution of the material damping ratio from the phase shift, φ, between the stress and strain is derived here from Equations (1)–(5):
σ = σ 0 sin 2 π f t
ε = ε 0 sin 2 π f t φ
E D = 0 2 π / ω σ d ε d t d t = σ 0 ε 0 0 2 π / ω ω sin ω t cos ω t φ d t = π σ 0 ε 0 sin φ
E 50 = 2 π σ 0 ε 0
D = E D E 50 = sin φ 2
Notably, in Equation (3), ω is the circular frequency, and ED represents the dissipated energy. f and t in Equations (1)–(3) refer to the frequency and time, respectively. E50 in Equation (4) is the maximum strain energy times 4π. The analytical solution of the hysteretic damping ratio is half of the sine of the phase shift between the stress and strain signals, as presented in Equation (5). This solution directly illustrates the importance of the phase shift, φ, when calculating the material damping ratio. In addition to the original two factors, stress and strain, this phase-based method introduces another factor, time, to the analysis in order to compute the phase shift.
For the purpose of calculating the phase shift, φ, a best-fit approach based on root mean square (RMS) is adopted here. The first step is to fit both the stress and strain signals with sinusoidal functions with phase shifts, as shown in Equations (6) and (7).
σ = σ 0 sin 2 π f t φ 1
ε = ε 0 sin 2 π f t φ 2
In Equations (6)–(7), the frequency, f, is the frequency selected for the test, typically ranging from 0.1 to 1.0 Hz, and t is the time. The fitting parameters are stress amplitude, σ0; strain amplitude, ε0; phase in stress, φ1; and phase in strain, φ2. The difference between φ1 and φ2 is the phase shift used for calculating the hysteretic material damping ratio.
An example of fitting the time series of stress and strain signals to Equations (6) and (7) is presented in Figure 4. The soil sample, in this case, is a low-plasticity clay (CL) under an isotropic mean confining pressure of 263 kPa (2.6 atm). This clay specimen was overconsolidated and unsaturated during the test. As shown in Figure 4, the fitting of the stress signal shows fewer errors than that of the strain signal, especially at the peaks of the signals. Considering that the stress signal is converted from an electrical signal by applying a calibration factor, the signal is directly measured without any additional physical sensors and has less noise. However, the strain signal is measured with proximitors by converting the measured distance to strain [5]. The proximitor is known to capture massive noise from high frequencies [7,15]. Therefore, more ambient noise would be present in the strain signal.
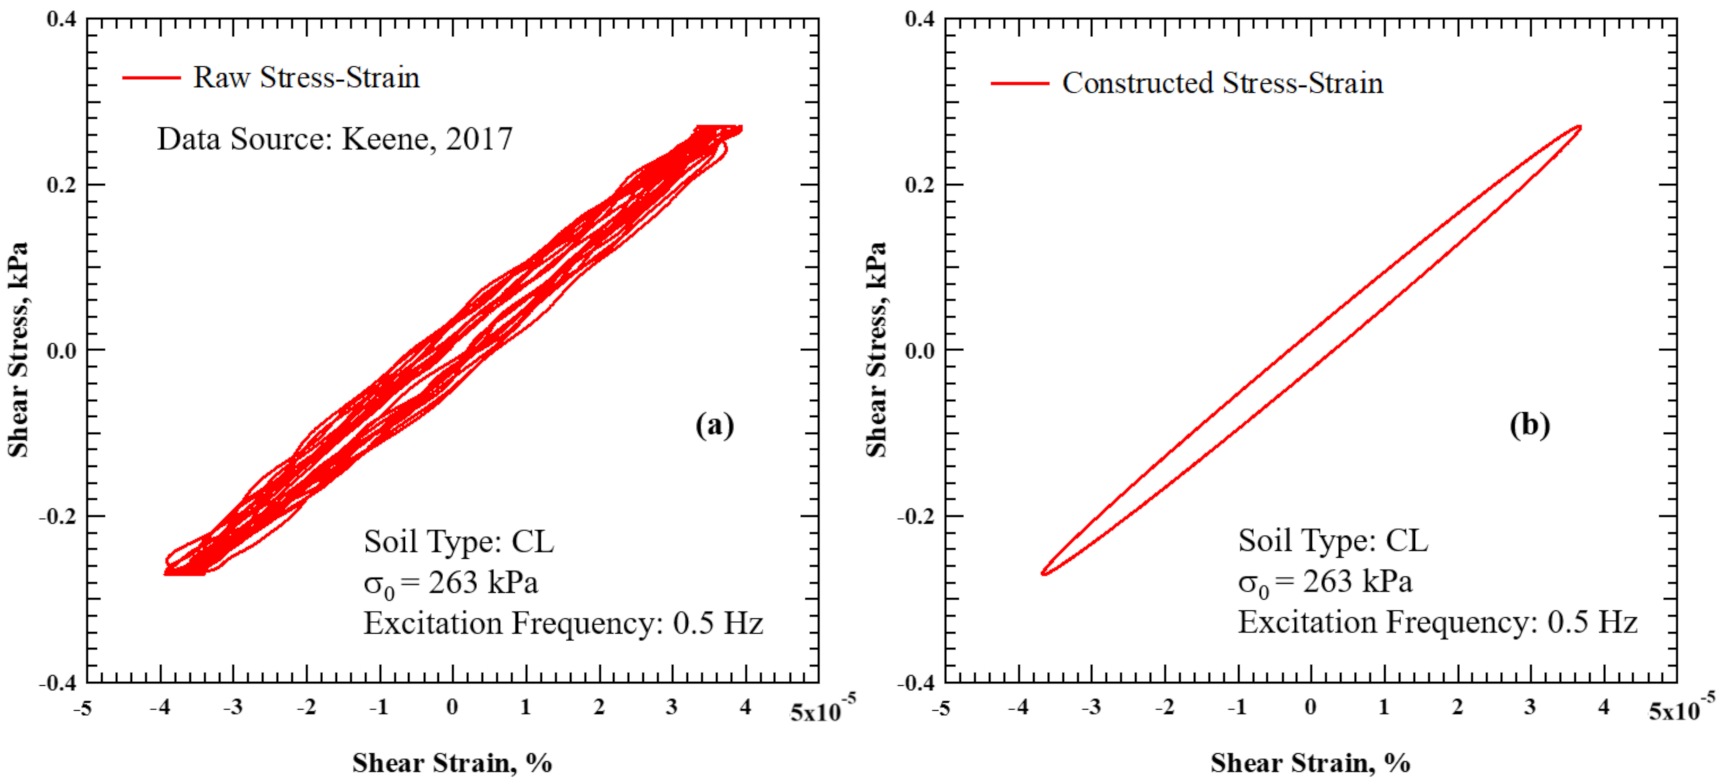
After fitting both time series of stress and strain to Equations (6) and (7), the stress–strain loop can be constructed from the fitted signals, as shown in Figure 5. This phase-based method eliminates the majority of the noise effects on the stress–strain loops. Comparing Figure 5a to Figure 5b, the constructed stress–strain loop from the fitted signals is much smoother because of the significantly reduced ambient noise.
As presented in Table 1, the last three points of λmin calculated with the phased-based method are more consistent with all values around 3.6%. However, the first λmin is still higher than the other three values due to the poor quality of the signal at extremely small strains (less than 3.4 × 10⁻⁵% in this case). This method is insufficient to eliminate the effect of ambient noise on the measurements, especially at strains of around 10−5%.
For the approach discussed above, components of frequencies other than the excitation frequency are still present in the signal. This is because the analysis is directly conducted in the time domain without involving the frequency domain. The ambient noise is not eliminated by this method, given that all of the frequencies in the strain signal are assumed to be the same as the excitation frequency during the fitting of Equation (7). Therefore, the two parameters, ε 0 ,   φ 2 , are influenced by the other frequencies in the strain signal.

2.2.2. Step II: Fourier Transform Analysis of λmin from TS Testing

The main limitation of step I is that the data fitting is operated only in the time domain. Therefore, it is not possible to filter the frequency components of the signals other than the excitation frequency. In order to address this issue, a frequency-based procedure is developed by applying the Fourier Transform to accurately compute the strain amplitude, ε0. After calculating the strain amplitude, ε0, the only parameter that needs to be fitted is the phase shift, φ2. Fitting only one parameter can significantly increase the accuracy of RMS fitting [8].
The Fourier Transform is a mathematical transformation that transfers time series to the frequency domain [16]. Typically, the Fourier Transform is implemented with an algorithm known as the Fast Fourier Transform (FFT). One of the basic assumptions of the Fourier Transform is that the complex signal is periodic in the sampling period, T. Thus, the algebraic sum of the time series should be zero. Any violation of this assumption would lead to the incorrect Fourier amplitudes in the frequency domain [16]. A simple example is presented below to address the importance of this assumption, especially for the current application.
A time function is assumed to be:
A m p l i t u d e = sin 2 π t + 2 sin 2 π 2 t + 3 sin 2 π 3 t
where t = time.
Based on Equation (8), the results expected to be observed in the frequency domain should have three peaks at FFT amplitudes of 1, 2, and 3 with corresponding frequencies of 1, 2, and 3 Hz. The algebraic sum of the amplitudes of Series 1 in Figure 6a is zero; hence, it is a periodic signal, while Series 2 in Figure 6b has an algebraic sum of 637.5 in its amplitudes, indicating that it is not a periodic signal. The sampling frequency of both signals is 1 kHz.
The FFT of the two signals in Figure 6 is presented in Figure 7. The FFT of Series 1 results in the correct amplitudes as well as the correct frequency components, while Series 2 has shifts in both the amplitudes and frequency components. This example clearly demonstrates the importance of applying the Fourier Transform to a periodic signal. However, in a cyclic test, the signals are rarely perfectly periodic due to the presence of ambient noise. One approach to transforming a random signal into a periodic one is to reverse the original signal, multiply it by negative 1, and then concatenate the original signal with the transformed signal. Accordingly, the new signal has the exact same frequency components and FFT amplitudes as the original signal. In addition, the new signal has an algebraic sum of zero in amplitudes, and thus satisfies the assumption for the Fourier Transform. This process of creating a periodic signal is referred to as ‘patch’ in the remainder of the article.
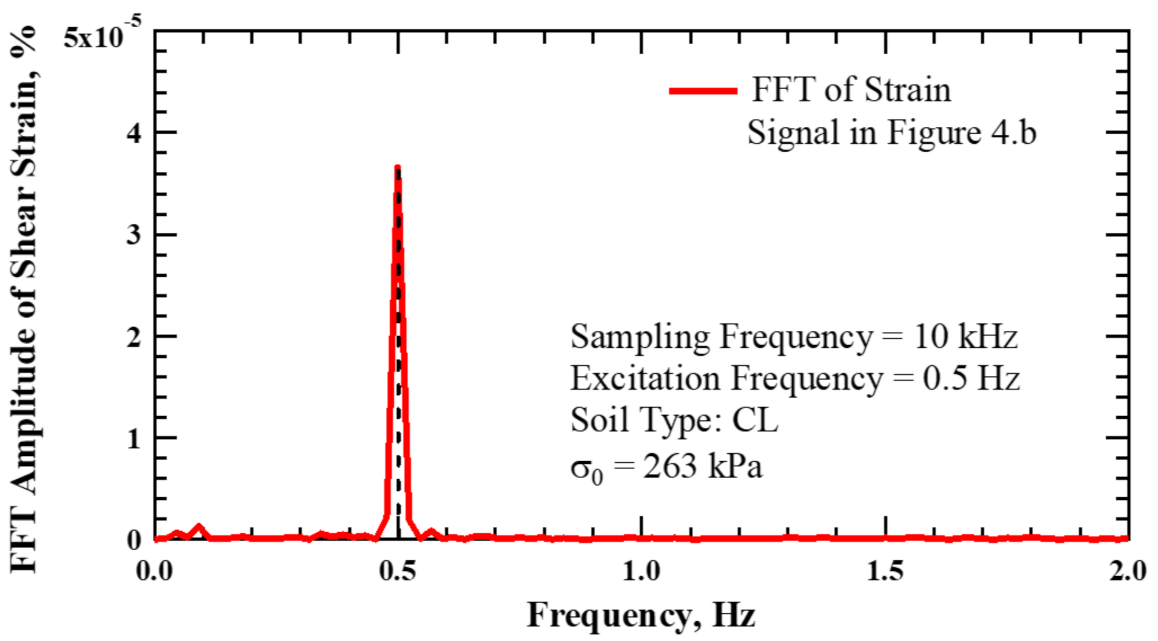
The strain signal in Figure 4b is first ‘patched’ and then transformed into the frequency domain by applying the Fourier Transform as presented in Figure 8. This figure shows that the predominant frequency of the test is 0.5 Hz (the excitation frequency). The FFT strain amplitude corresponding to 0.5 Hz is approximately 3.7 × 10⁻⁵%. With the strain amplitude ε 0 known, the only parameter that needs to be fitted to obtain λmin is the phase of the strain times series, φ2 in Equation (7).
All results for the four measurements at small strains are presented in Table 2. Additionally, the means and standard deviations of the four small-strain measurements are also listed. The low standard deviation of the proposed method presents the highest level of consistency λmin among all three methods as shown in Figure 9.

2.3. Application of the Proposed Method to Small-Strain Torsional Shear Testing

In Figure 10, it can be observed that the damping ratios for the first four tests analyzed with the proposed method are more consistent than those from the original stacking-only method. The standard deviation of the four λmin analyzed by the stacking-only method is approximately 0.65%, while the standard deviation of the proposed method is reduced to 0.04%, as reported in Table 2. In the small-strain range, the proposed method is an effective tool to compute the small-strain hysteretic material damping ratio for soils. Moreover, the method can help the application of frictionless torsional shear testing in important projects, such as NQA-1.
On the other hand, it should be noted that the proposed method only applies to the elastic strain range of the material damping ratio. The proposed method does not apply when degradation caused by nonlinear cycling occurs. In addition, the quality of the strain signal usually tends to improve at a higher level of strains. Consequently, signal processing is generally not required when the strain is over a certain level in the frictionless torsional shear testing, typically 5 × 10⁻³% [7].

3. Computation of the Small-Strain Viscous Damping Ratio, Dmin, Based on the Hilbert Transform

One common method to measure the viscous material damping ratio is free-vibration decay (FVD). Free-vibration decay is primarily used in an under-damped single-degree-of-freedom dynamic system [2]. The system is firstly excited at the natural frequency of the system until it reaches a steady-state. Then, the excitation is turned off, and the amplitude of the motion decays due to the energy loss [11]. This decay, caused by the viscous damping, can be described by the logarithmic decrement, δ, which is the ratio of the natural logarithm of two successive amplitudes of motions [2]:
δ = l n Z 1 Z 2 = 2 π D 1 D 2
D = δ 4 π 2 + δ 2
where Z1 and Z2 are the two successive strain amplitudes of motion, and D = viscous damping ratio.
The method appears simple, but it is challenging to measure the free-vibration decay at small strains, considering the level of ambient noise, especially for soft soils under low confining pressures [5,7]. In dynamic soil testing, the resonant column testing is preferred at small strains, while the free-vibration decay testing is applied mostly in the nonlinear range of strains [2,3,5,6,7].

3.1. Conventional Method of Free-Vibration Decay

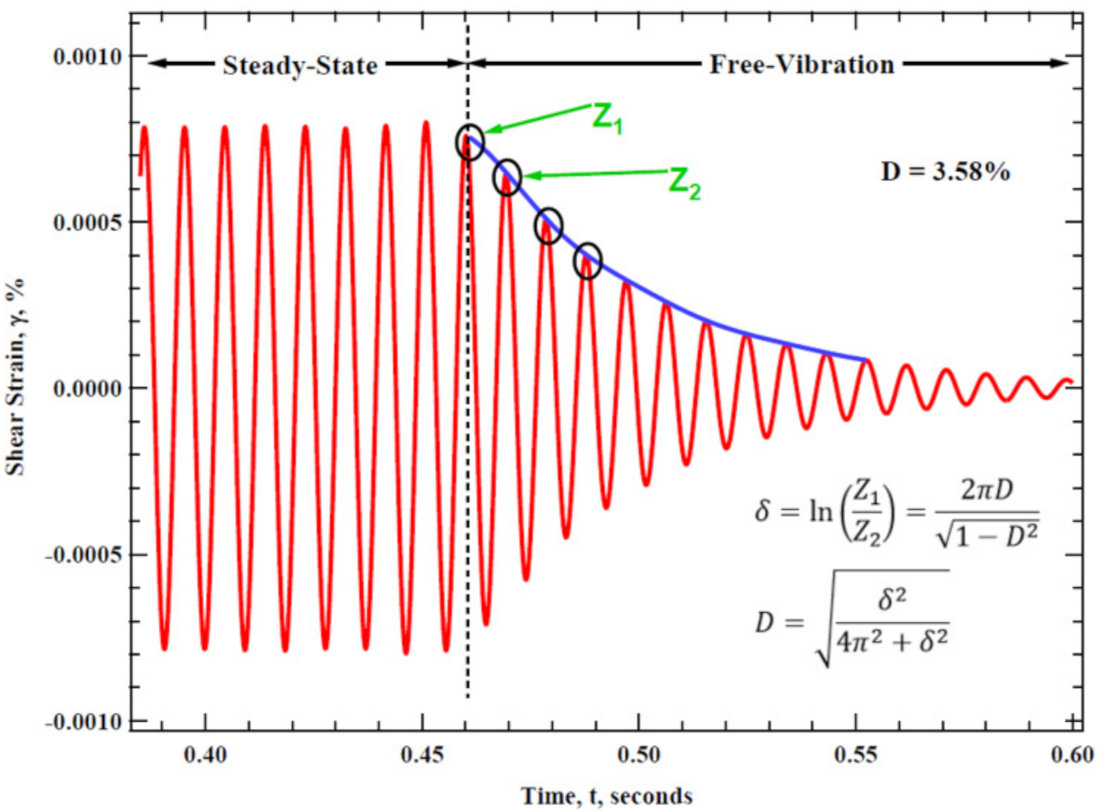
The conventional method for calculating the viscous damping ratio involves using the peaks of the logarithmic decay [5]. In order to accurately select the peaks in each cycle, the noise in the signal needs to be minimized. As a result, the free-vibration decay is typically not preferred at small strains of soil testing, given that the level of ambient noise is significant [17]. An example of small-strain testing on metal is shown in Figure 11 with a viscous damping ratio, D, of 3.58%. The peak shear strain is approximately 8 × 10⁻⁴%. In this case, the high stiffness of the metal specimen helps decrease the ambient noise. Unlike the metal testing, the free-vibration decay testing of soil at this level of shear strain would inevitably contain more significant ambient noise due to the much lower stiffness of the material. Therefore, it would be more challenging to apply the same method at this level of shear strain in soil testing.
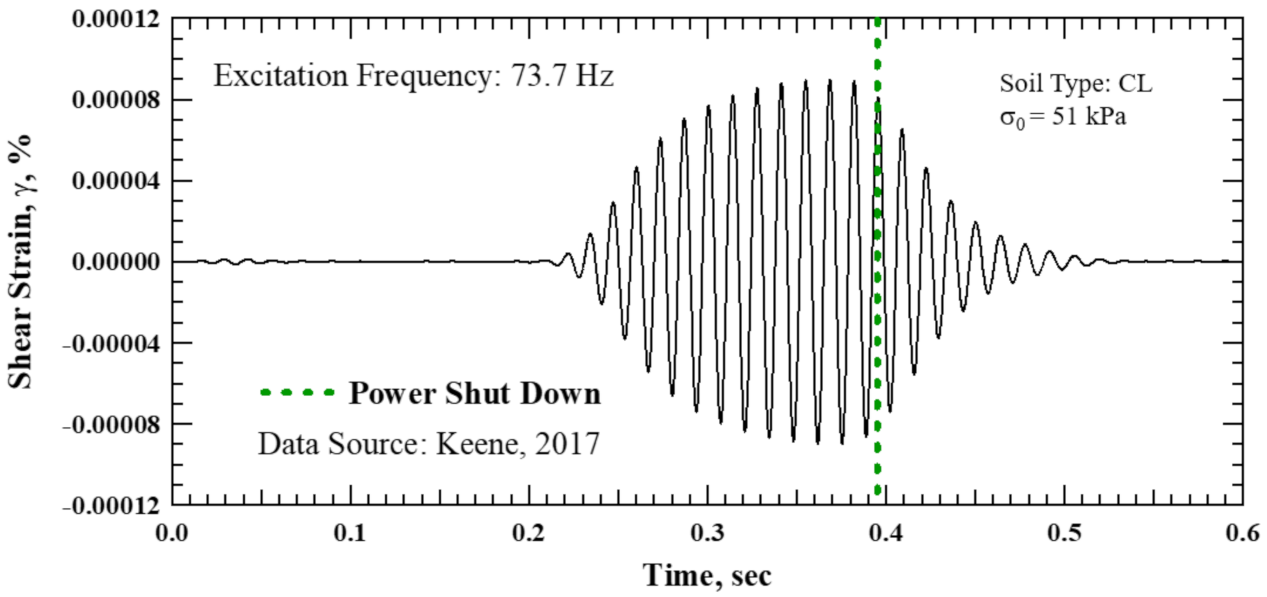
When analyzing the logarithmic decay, typically only the first two to four peaks are selected and then used to calculate the viscous material damping ratio [11]. On the other hand, in the small-strain measurements less than the strain of 10−3%, the amplitudes of the peaks can easily be influenced by the ambient noise, which can further influence the computation of the viscous material damping ratio [18]. An example is given here to address the difficulty in applying the conventional method to small-strain measurements in soils. The soil specimen in Figure 12 is an unsaturated, overconsolidated low-plasticity clay (CL) under an isotropic mean confining pressure, σ of 51 kPa (0.5 atm) [7]. The peak shear strain in Figure 12 is approximately 10−4%. The viscous damping ratios from amplitudes 1, 2, 3, and 4 should theoretically yield a constant value, which is the small-strain viscous damping ratio, Dmin. However, the damping ratios derived from different amplitudes are not constant, as reported in Table 3. The damping ratios also vary, depending on the choice of the peak amplitudes selected for the analysis, while the Dmin measured by the resonant column testing (RC) is more consistent at this level of shear strain [5,6,7]. The inconsistency leads to the preference for RC over FVD at small strains. In order to apply FVD at all strain ranges, the conventional method needs to be improved in the small-strain range to derive a more consistent value of Dmin.

3.2. Proposed Method for Analyzing FVD

The limited number of data points (typically 3 or 4) and the significant ambient noise are the main causes for the failure of the conventional method to accurately compute the small-strain viscous damping ratios. With only three or four peaks selected, the viscous damping ratio can be easily biased by a single noisy data point. In order to reduce this inaccuracy, one approach is to generate more data points for the analysis. Additionally, an analytical solution is needed to apply the theory of logarithmic decrement to a series of data points obtained from the free-vibration decay signal.

3.2.1. The Hilbert Transform

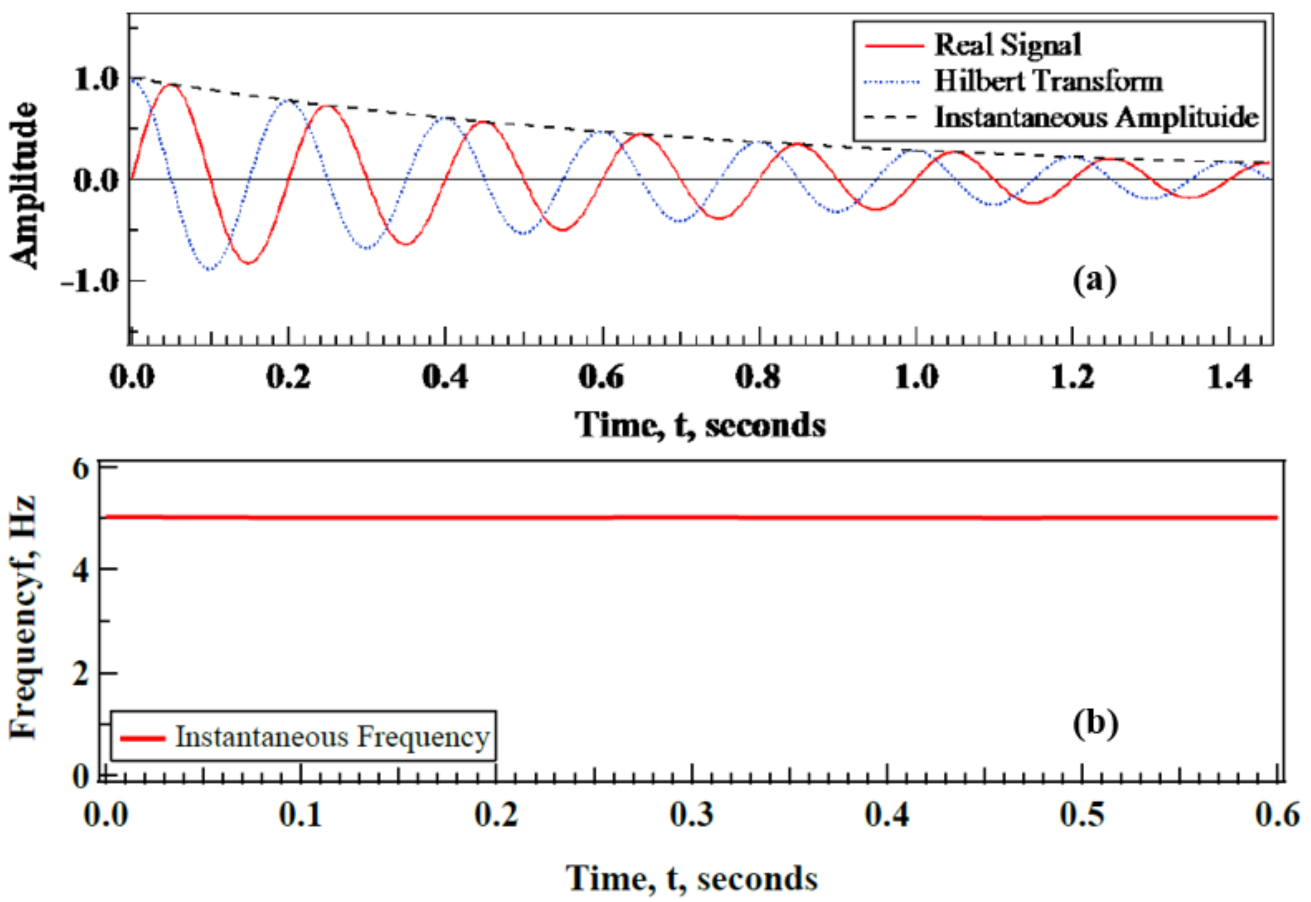
In order to evaluate the instantaneous characteristics of the FVD signal, such as the envelope and instantaneous frequencies [19], the Hilbert Transform is adopted here to further analyze the signal. An example of the Hilbert Transform of a vibration signal with a damped natural frequency, fr, of 5 Hz and a viscous damping ratio, D, of 4% is presented in Figure 13 [7]. Signal 4 in the figure is the projection of a 3D analytical signal (Signal 3) on the complex plane. When Signal 4 is plotted against time, it is referred to as the instantaneous amplitude, as shown in Figure 14a. In addition, the instantaneous frequency can also be calculated by the Hilbert Transform, as shown in Figure 14b. The number of data points in the data series of the instantaneous amplitude depends on the sampling frequency and the duration. Typically, there are thousands of data points in one signal of free-vibration decay. In this case, the instantaneous frequency remains constant at 5 Hz. These instantaneous characteristics are the keys to the new method of computing the viscous damping ratio from the free-vibration decay testing.

3.2.2. Conversion of the Instantaneous Amplitude of FVD to the Viscous Damping Ratio

As discussed above, by introducing the Hilbert Transform, the number of available data points increases drastically. The next step is to convert the instantaneous amplitude to the logarithmic decrement. In Equation (9), the logarithmic decrement, δ, is calculated from two successive peaks of the free-vibration decay signal. In order to convert the instantaneous amplitude to the logarithmic decrement, the first step is to fit the instantaneous amplitude to an exponential function. The exponential function in Equation (11) was chosen because the logarithmic decrement is linear in natural log space.
γ = a · e x p b · t
where γ = shear strain, a, b = fitting parameters, and t = time
The two purposes of fitting the instantaneous amplitude with an exponential function are: (1) to eliminate the noise if there is any; (2) to acquire the parameter b, which represents the decay of the instantaneous amplitude, as presented in Equation (12). The logarithmic decrement, δ, can be derived from the parameter b and the excitation frequency, f. This derivation serves as the analytical solution used to solve the logarithmic decrement from the instantaneous amplitude (envelope) of the free-vibration decay.
δ = l n Z 1 Z 2 = l n a · e x p b · t 1 a · e x p b · t 1 + T = b · t 1 + b · t 1 + T = b · T = b f
Therefore, the logarithmic decrement, δ, is simply the ratio between the parameter b and the excitation frequency, f. One crucial assumption involved in the derivation is that any degradation of the frequency during the free-vibration decay is ignored. Therefore, the time between Z1 and Z2 is the period T, which is assumed to be the reciprocal of the excitation frequency, f. This assumption only holds at small strains and will be violated when the strains are in the nonlinear range due to the degradation in frequencies during the free-vibration decay. The amount of decay in frequency also depends on the level of strain.

3.3. Application of the Proposed Method in the Analysis of Dmin

An example is presented in the following section to demonstrate the application of the proposed method to compute the viscous damping ratio from a free-vibration decay curve of soil at an extremely small strain. The free-vibration decay data used in this example are presented in Figure 12 [7].

3.3.1. Step I: Butterworth Bandpass Filter

The first step is to filter the FVD signal with a Butterworth bandpass filter. A fourth-order Butterworth bandpass filter is used to filter ambient noise at small strains. In this case, the low-cut frequency is set to be 66.0 Hz to avoid the 60 Hz electricity noise, and the high-cut frequency is 88.0 Hz to cut off high-frequency noise without influencing the signal at the excitation frequency. As shown in Figure 15, the filtered signal contains less high-frequency noise, especially near the end of the free-vibration decay. Additionally, with the Butterworth bandpass filter applied, a phase shift of the FVD occurs when comparing Figure 15 to Figure 12. However, with the entire signal shifting simultaneously, the logarithmic decay is not affected by the phase shift.

3.3.2. Step II: The Hilbert Transform and Signal Truncation

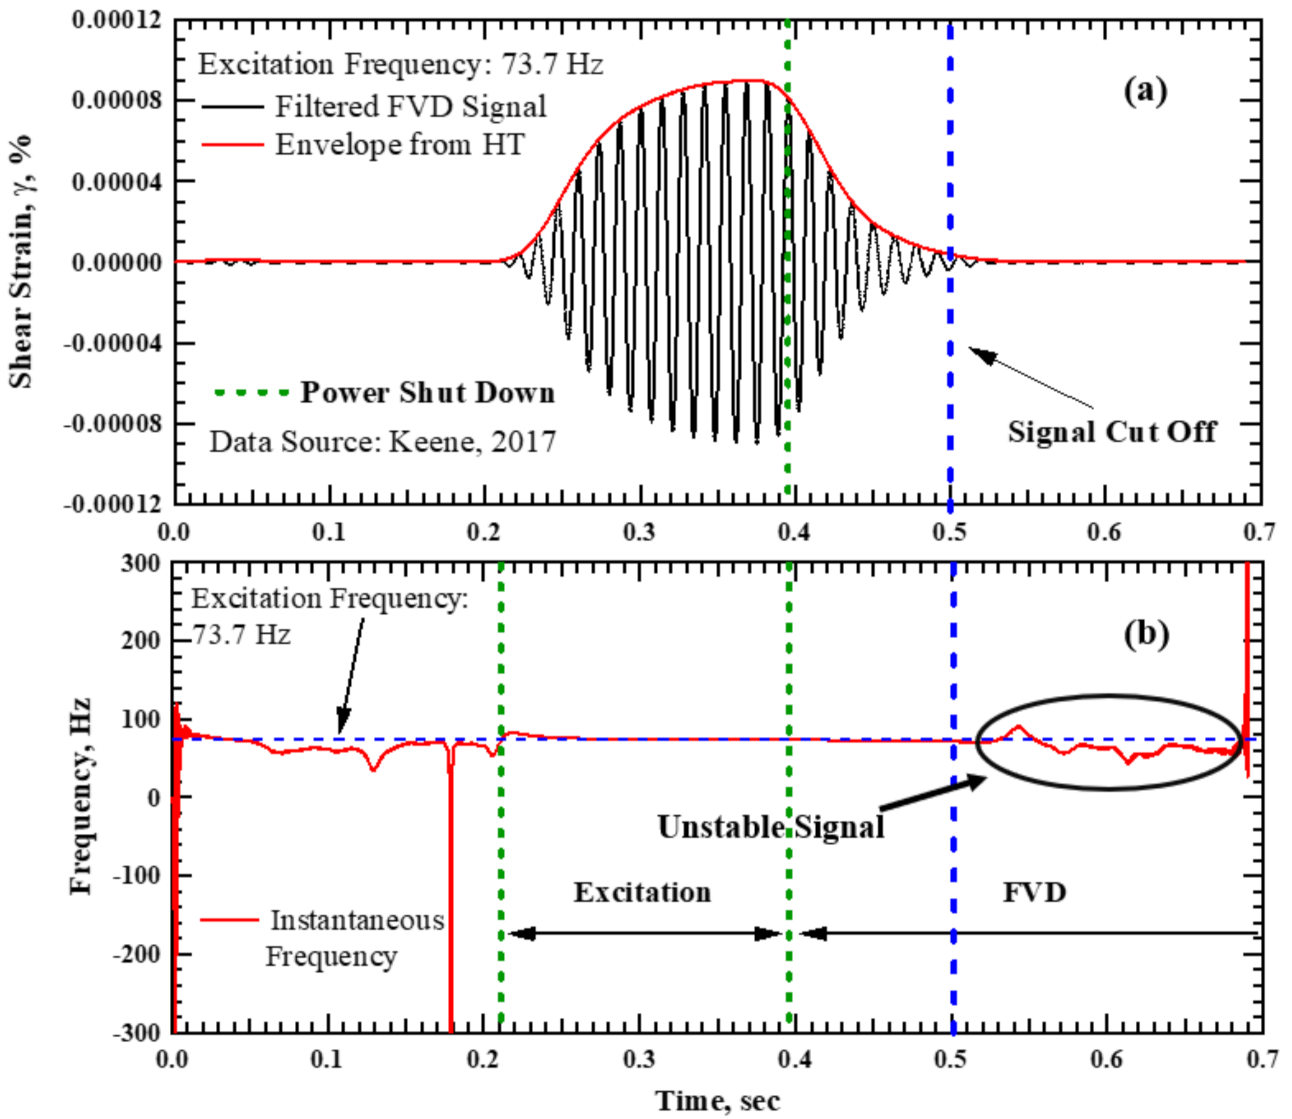
The next step is to apply the Hilbert Transform and then truncate the free-vibration decay signal based on the instantaneous frequencies. The procedure applied in this step is to compare the instantaneous frequency with the excitation frequency. Only a portion of the envelope with good signals should be considered in the calculation of the logarithmic decrement. Otherwise, the noise in the envelope will affect the computation of the viscous damping ratio. As shown in Figure 16a, the Hilbert Transform is applied to the filtered free-vibration decay signal, and the envelope is calculated from the transform. The peak strain of this free-vibration decay signal is approximately 10−4%. After approximately 0.5 s of the test, the instantaneous frequency starts to fluctuate around the excitation frequency as presented in Figure 16b, indicating that the quality of the signal is degrading. In order to avoid any ambiguities, the free-vibration decay signal after the signal cut-off line (dark blue dashed line) in Figure 16 is truncated and thus not used in the analysis of the free-vibration decay. Therefore, the signal truncation is primarily based on the instantaneous characteristics of the signal, especially the instantaneous frequency.

3.3.3. Step III: Data Fitting and Damping Calculation

In this step, the filtered and truncated signal is fitted to the exponential function in order to calculate the parameter b as defined in Section 3.2.2. For the truncated signal, the shear strain ranges from 6.6 × 10⁻⁶% to 6.5 × 10⁻⁵%, which is approximately one log cycle of strain. In order to choose the representative shear strain that corresponds to the viscous damping ratio (D—log γ curve), this one log cycle of shear strain is divided into three groups, and the representative shear strain is the average value of the shear strain for each group. In this case, each group of shear strain contains approximately 250 data points for the analysis of one small-strain viscous damping ratio, Dmin. The final results of the three viscous damping ratios are presented in Figure 17. It is clear that the three values of the viscous damping ratios, D, are similar to each other. The mean of the three values is 6.64%, and the standard deviation is only 0.08%. When comparing the results from the proposed method with the ones from the conventional method of free-vibration decay, the proposed method shows more consistency at small strains.

3.4. Validation of the Small-Strain Viscous Damping Ratio from the Proposed Method

In order to validate the proposed method, the small-strain viscous damping ratio will be compared with another testing method known as the half-power bandwidth method, which is widely used in resonant column testing [1,2,3,5,6,7,8,9,20]. The method of the resonant column falls outside the scope of this paper. However, interested readers can find details of it in Ni’s thesis [5]. In short, the resonant column method is a robust dynamic soil testing method, which has been widely used in the measurements of small-strain viscous damping ratios of soils [5,6,7,8,9,10,11,12,15,16,17,18].
The same low-plasticity clay specimen was also tested with the resonant column at various levels of shear strain [7]. In the small-strain range, the viscous damping ratios from both the half-power bandwidth method and the proposed method of free-vibration decay are practically identical, as presented in Figure 18. This proves the rigorousness of the proposed method in small-strain measurements.

4. Discussion

In terms of the hysteretic material damping ratio, it remains difficult to apply the proposed method at extremely small strains below 10−4% if the equipment is mechanically loaded, such as a conventional cyclic triaxial or simple shear device. This is due to the existence of a relatively large amount of noise at this level of strain caused by the friction in the system [21]. However, if the measurement is near 10−3% of shear strain for a mechanically loaded testing device, this proposed method should provide a more robust analysis of the small-strain hysteretic material damping ratio. Therefore, it can be very helpful for that equipment to measure the small-strain material damping ratios in order to obtain the dynamic behavior of soils at the full strain range (10−3% to 5% strain [22]). Additionally, the proposed method of computing the viscous damping ratio can only be applied at the small-strain range. The analysis of the viscous damping ratio will become more complicated when the soil is in the nonlinear range of strains. A viscoelasticity-based method to analyze nonlinear damping from free-vibration decay testing requires some further investigations.

5. Conclusions

Two new methods have been proposed in this article to analyze the small-strain hysteretic material damping ratio, λmin, from torsional shear testing, and the small-strain viscous material damping ratio, Dmin, from free-vibration decay, respectively. For the new method of analyzing λmin, a combined phase-based method with the Fourier Transform has been developed. The ambient noise at small strains can be significantly reduced. Thus, the amplitude of shear strain and the phase shift can be precisely calculated. With the proposed method of analyzing λmin, λmin is consistent at extremely small strains from 10−5% to 10−4%.
The other proposed method is employed to analyze the viscous damping ratios from free-vibration decay at small strains. In this method, the Hilbert Transform is introduced in order to calculate the instantaneous characteristics. The small-strain viscous damping ratio, Dmin, is then calculated from the decay parameter b from the fitted model. With the proposed method, the free-vibration decay testing can be applied at small strains. Accordingly, the free-vibration decay testing is a testing method for the full strain range.
Both of the two new methods are easy to apply in the small-strain dynamic soil testing, even below 10−4% of shear strain. The small-strain damping ratios analyzed by these two methods can provide consistent values of λmin and Dmin even at extremely small strains. Thus, the uncertainty in λmin and Dmin can be minimized, which is crucial in modeling the energy dissipation in soils, especially in the development of empirical damping models. Notably, only the small-strain behavior is discussed in this paper. Therefore, the two methods are not applicable to any nonlinear testing where the small-strain assumption breaks down.

Author Contributions

Conceptualization, Y.T.; Data curation, Z.X.; Formal analysis, Z.X. and Y.T.; Methodology, Z.X.; Project administration, Y.T.; Resources, L.H.; Software, L.H.; Supervision, Y.T.; Visualization, L.H.; Writing—original draft, Z.X.; Writing—review & editing, Y.T. All authors have read and agreed to the published version of the manuscript.

Funding

This research received no external funding.

Institutional Review Board Statement

Not applicable.

Informed Consent Statement

Not applicable.

Acknowledgments

The authors would like to thank the Women Engineering Program at the University of Texas of Austin for their support of this research and Kenneth Stokoe at the University of Texas Austin for his valuable advice on this topic. The authors also want to express a sincere note of gratitude to all the reviewers for their valuable suggestions and comments in reviewing this manuscript. A special thanks go to Dawie Marx and Sarah Stringer for editing the manuscript. Last but not least, the help from Andrew Keene and Yaning Wang is appreciated.

Conflicts of Interest

The authors declare no conflict of interest.

References

  1. Kramer, S. Geotechnical Earthquake Engineering, 1st ed.; Prentice Hall: Hoboken, NJ, USA, 1996. [Google Scholar]
  2. Richart, F.E. Vibrations of Soils and Foundations; Prentice-Hall: Hoboken, NJ, USA, 1971; Volume 8. [Google Scholar]
  3. Menq, F. Dynamic Properties of Sandy and Gravelly Soils. Ph.D. Thesis, The University of Texas at Austin, Austin, TX, USA, 2003. [Google Scholar]
  4. Dobry, R.; Ladd, R.S.; Yokel, F.Y.; Chung, R.; Powell, D.J. Prediction of Pore Water Pressure Buildup and Liquefaction of Sands during Earthquakes by the Cyclic Strain Method; Report No. PB8311617; U.S. Department of Commerce: Washington, DC, USA, 1982.
  5. Ni, S.H. Dynamic Properties of Sand under True Triaxial Stress States from Resonant Column/Torsional Shear Tests. Ph.D. Thesis, The University of Texas at Austin, Austin, TX, USA, 1987. [Google Scholar]
  6. Hwang, S. Dynamic Properties of Natural Soils. Ph.D. Thesis, The University of Texas at Austin, Austin, TX, USA, 1998. [Google Scholar]
  7. Keene, A. Next-Generation Equipment and Procedures for Combined Resonant Column and Torsional Shear Testing. Ph.D. Thesis, The University of Texas at Austin, Austin, TX, USA, 2017. [Google Scholar]
  8. Wang, Y.; Stokoe, K.H. Development of Constitutive Models for Linear and Nonlinear Shear Modulus and Material Damping Relationships of Uncemented Soils. J. Geotech. Geoenvironmental Eng. 2021, in press. [Google Scholar]
  9. Darendeli, M. Development of A New Family of Normalized Modulus Reduction and Material Damping Curves. Ph.D. Thesis, The University of Texas at Austin, Austin, TX, USA, 2001. [Google Scholar]
  10. Payan, M.; Senetakis, K.; Khoshghalb, A.; Khalili, N. Influence of Particle Shape on Small-Strain Damping Ratio of Dry Sands. Geotechnique 2016, 66, 610–616. [Google Scholar] [CrossRef] [Green Version]
  11. Senetakis, K.; Anastasiadis, A.; Pitilakis, K. A Comparison of Material Damping Measurements in Resonant Column Using the Steady-State and Free-Vibration Decay Methods. Soil Dyn. Earthq. Eng. 2015, 74, 10–13. [Google Scholar] [CrossRef]
  12. Yu, S.; Shan, Y. Experimental Comparison and Study on Small-Strain Damping of Remolded Saturated Soft Clay. Geotech. Geol. Eng. 2017, 35, 2479–2483. [Google Scholar] [CrossRef]
  13. Tao, Y.; Rathje, E. Insights into Modeling Small-Strain Site Response Derived from Downhole Array Data. J. Geotech. Geoenvironmental Eng. 2019, 145, 04019023. [Google Scholar] [CrossRef]
  14. Konstadinou, M.; Georgiannou, V.N. Cyclic Behaviour of Loose Anisotropically Consolidated Ottawa Sand Under Undrained Torsional Loading. Geotechnique 2013, 63, 1144–1158. [Google Scholar] [CrossRef]
  15. Rix, G.J.; Meng, J. A Non-Resonance Method for Measuring Dynamic Soil Properties. Geotech. Test. J. 2005, 28, 1–8. [Google Scholar]
  16. Bracewell, R. The Fourier Transform and Its Applications, 3rd ed.; McGraw-Hill Higher Education: New York City, NY, USA, 1978. [Google Scholar]
  17. Song, B.; Tsinaris, A.; Anastasiadis, A.; Pitilakis, K.; Chen, W. Small-Strain Stiffness and Damping of Lanzhou Loess. Soil Dyn. Earthq. Eng. 2017, 95, 96–105. [Google Scholar] [CrossRef]
  18. Senetakis, K.; Payan, M. Small Strain Damping Ratio of Sands and Silty Sands Subjected to Flexural and Torsional Resonant Column Excitation. Soil Dyn. Earthq. Eng. 2018, 114, 448–459. [Google Scholar] [CrossRef]
  19. Feldman, M. Hilbert Transform Applications in Mechanical Vibration; John Wiley & Sons, Ltd.: Hoboken, NJ, USA, 2011; Volume 1. [Google Scholar]
  20. Facciorusso, J. An Archive of Data from Resonant Column and Cyclic Torsional Shear Tests Performed on Italian Clays. Earthq. Spectra 2021, 37, 545–562. [Google Scholar] [CrossRef]
  21. Kokusho, T. Cyclic Triaxial Test of Dynamic Soil Properties for Wide Strain Range. Soils Found. 1980, 3, 305–312. [Google Scholar] [CrossRef]
  22. Diaz-Rodriguez, J.A.; Lopez-Molina, J.A. Strain Thresholds in Soil Dynamics. In Proceedings of the 14th World Conference on Earthquake Engineering, Beijing, China, 12–17 October 2008. [Google Scholar]
Figure 1. Damping ratio calculation from a stress–strain loop in torsional shear testing [8].
Geotechnics 01 00016 g001
Figure 2. (a) Time series of an ideal stress signal, (b) time series of an ideal strain signal, and (c) theoretical stress–strain loop of soil with λmin of 0.5%.
Geotechnics 01 00016 g002
Figure 3. Material damping analyzed by stacking only method [7].
Geotechnics 01 00016 g003
Figure 4. Fitting of the time series of (a) stress and (b) strain signals.
Geotechnics 01 00016 g004
Figure 5. (a) Raw stress-strain loops vs. (b) constructed stress-strain loops.
Geotechnics 01 00016 g005
Figure 6. Algebraic sums of (a) Series 1 and (b) Series 2.
Geotechnics 01 00016 g006
Figure 7. The FFT of Series 1 and Series 2.
Geotechnics 01 00016 g007
Figure 8. The transformed strain signal in the frequency domain.
Geotechnics 01 00016 g008
Figure 9. Comparisons of λmin from the three methods.
Geotechnics 01 00016 g009
Figure 10. Applicable strain range of the proposed method.
Geotechnics 01 00016 g010
Figure 11. Determination of the material damping ratio from the free-vibration decay curve for a metal specimen [7].
Geotechnics 01 00016 g011
Figure 12. Small-strain FVD of a low-plasticity clay (CL) specimen [7].
Geotechnics 01 00016 g012
Figure 13. Analytic signal plotted in 3d, real signal projected onto the real plane, Hilbert Transform projected onto the imaginary plane, and analytic signal projected onto the complex plane [19].
Geotechnics 01 00016 g013
Figure 14. Plots of (a) real signal, Hilbert Transform, instantaneous amplitude, and (b) instantaneous frequency versus time [19].
Geotechnics 01 00016 g014
Figure 15. Butterworth bandpass filtered FVD signal.
Geotechnics 01 00016 g015
Figure 16. (a) The Hilbert Transform and (b) the instantaneous frequency over time of a clay specimen.
Geotechnics 01 00016 g016
Figure 17. Viscous damping ratio from the proposed method.
Geotechnics 01 00016 g017
Figure 18. Viscous damping ratios from resonant column vs. free-vibration decay.
Geotechnics 01 00016 g018
Table 1. Comparison of λmin from the two methods.
ID.Shear Strain, %λmin, %
StackPhase-Based
13.38 × 10−55.444.09
26.70 × 10−54.703.65
31.35 × 10−44.293.62
42.55 × 10−43.933.63
Table 2. Comparisons between the three methods.
ID.Shear Strain, %λmin, %
StackPhase MethodProposed Method
13.38 × 10−55.444.093.95
26.70 × 10−54.703.653.93
31.35 × 10−44.293.623.87
42.55 × 10−43.933.633.87
Mean4.593.753.91
Standard
Deviation
0.650.230.04
Table 3. Logarithmic decrements and viscous damping ratios analyzed by the conventional method of FVD.
PeaksδDmin, %
Z1/Z20.416.57
Z2/Z30.375.89
Z3/Z40.538.41
Publisher’s Note: MDPI stays neutral with regard to jurisdictional claims in published maps and institutional affiliations.