Article

Physical Modelling of High Stiffness Large Diameter Steel Tubular Pile Subjected to One-Way Horizontal Cyclic Loading

1
Department of Civil and Environmental Engineering, Tokyo Institute of Technology, Tokyo 152-8552, Japan
2
School of Civil, Environmental and Mining Engineering, The University of Western Australia, Perth 6009, Australia
*
Author to whom correspondence should be addressed.
Geotechnics 2023, 3(2), 515-530; https://doi.org/10.3390/geotechnics3020028
Submission received: 14 May 2023 / Revised: 29 May 2023 / Accepted: 6 June 2023 / Published: 11 June 2023

Abstract

:
Two centrifuge model tests were conducted, each with three large diameter steel tubular piles installed under similar conditions, i.e., diameter (Φ) = 2 m; thickness (t) = 25 mm; loading height from the rock surface (HL) = 6.5 m, but different rock socketing depths (dr), i.e., 2 m, 3 m, and 4 m, respectively, in prototype scale. Two additional 1 g model tests were conducted using the same model pile and ground. The results indicate that the pile lateral resistance increased with an increase in the rock socketing depth to diameter ratio (dr/Φ) in both 1 g and 50 g models. However, the difference between the two gravitational acceleration levels became visible in the non-linear behaviour as the imposed displacement increased. Specifically, the 1 g models showed larger residual displacement and less stiffness in reloading than the 50 g models, particularly under cyclic loading. Two types of ultimate failure modes were observed, i.e., rock failure and pile structural failure with local buckling just above the rock surface. The latter failure mode was only attained in the pile with a dr/Φ ratio of 2 in a 50 g models among the test conditions adopted in the models, but not in the 1 g model.

1. Introduction

The use of large-diameter steel tubular piles (LDSTPs) has gained significant popularity in recent decades. These piles are commonly employed as monopile foundations for offshore wind turbines [1,2]. Additionally, LDSTPs serve as self-standing steel tubular walls in situations where construction yards are limited and strict construction schedules are in place. They offer the advantage of being installable in smaller construction yards compared to other structures like gravity-type walls or those with inverted T-type footings [3,4,5]. Furthermore, LDSTPs are utilised as supporting structures, such as in the restoration of river systems following disasters [6].
These structures are subjected to high lateral loads and overturning moments, with large moment loads being generated near the rock surface by walls with large retaining heights or wind turbines. Combination of the above loading and embedded ground conditions are significantly influence the overall behaviour of the structure. Technological advancements like the rotary cutting press-in technique allow us to construct the pile on comparatively stiff ground like soft rock or even hard rock [4]. Construction projects in Japan often encounter soft rock layers that are present at the surface or at shallow or deeper depths. Soft rocks present various challenges, such as low strength, crumbling, and fast weathering, making them unsuitable for engineering projects [7]. Additionally, their intermediate strength level makes it difficult to accurately determine their properties through testing. Soft rock sampling and site investigation are complex, and existing classification systems are unsuitable for continuous soft rock masses.
Several field tests were conducted on steel pipe piles socketed into various types of rock (like calcareous claystone, sandstone, or piedmont weathered rock), and the lateral and axial resistance of the piles were investigated [8,9,10]. In addition, several numerical and analytical investigations were conducted on the concrete shaft or drilled shaft to investigate the lateral resistance of the piles [11,12,13]. In all the field tests and the numerical and analytical approaches, the loading point was near the rock surface, resulting in a minimal moment load. Additionally, 3D FEM analysis and a centrifuge model test were conducted to investigate the lateral resistance of the anchored pile socketed into soft rock [14]. Additionally, 3D FEM analysis was conducted and compared with the existing empirical design solutions to investigate the lateral resistance of the pile [15].
Additionally, physical modelling has been utilised to investigate the mechanical behaviour of laterally loaded piles in soft rock [16,17]. Another researcher used centrifuge modelling to develop a CPT-based load resistance (p-y) curve for cemented sand (classified as weak calcareous sandstone) [18]. Studies have also been conducted to characterise the pile behaviour under lateral loading with different embedment conditions that are rigid, flexible, or intermediate [19,20,21]. For example, Randolph [19] proposed a model for pile behaviour based on the relative stiffness between the pile and the ground as well as the vertical eccentricity, while Hetenyi [21] proposed a critical length beyond which increasing the pile socketing depth in the sand would not affect the pile behaviour.
Insufficient research is currently available to provide a complete understanding of the mechanical behaviour of LDSTPs when socketed into rock. Furthermore, the pile behaviour is influenced by various factors such as pile conditions (e.g., diameter, embedment depth, thickness), ground conditions (e.g., strength and stiffness), and loading conditions (e.g., loading height and type, monotonic or cyclic) [22,23]. Despite these factors, the deformation and failure mechanisms of rock-socketed LDSTPs have not been thoroughly investigated using physical modelling or actual field tests. This is likely due to the challenges associated with modelling such massive structures in the centrifuge.
As part of the application of large-diameter cantilever-type steel tubular pile (CSTP) walls embedded in the stiff ground [24], this paper investigates the lateral response of large-diameter steel tubular piles socketed into the soft rock under one-way cyclic loading. The study includes two centrifuge model tests conducted with a centrifugal acceleration of 50 g. A constant vertical eccentricity of 6.5 m on the prototype scale is maintained throughout the tests. To simplify the testing procedure and complement the centrifuge tests, two 1 g model tests are also performed. These tests provide insights into the behaviour of rock socket piles, as soft rock exhibits less stress dependency and experiences high confining pressure. The 1 g model tests explore the influence of vertical eccentricity and filling conditions on the lateral response of the piles. In addition, a comparison is made between the observations from the 1 g model tests and the actual centrifuge model test results to assess their relevance in understanding pile behaviour.

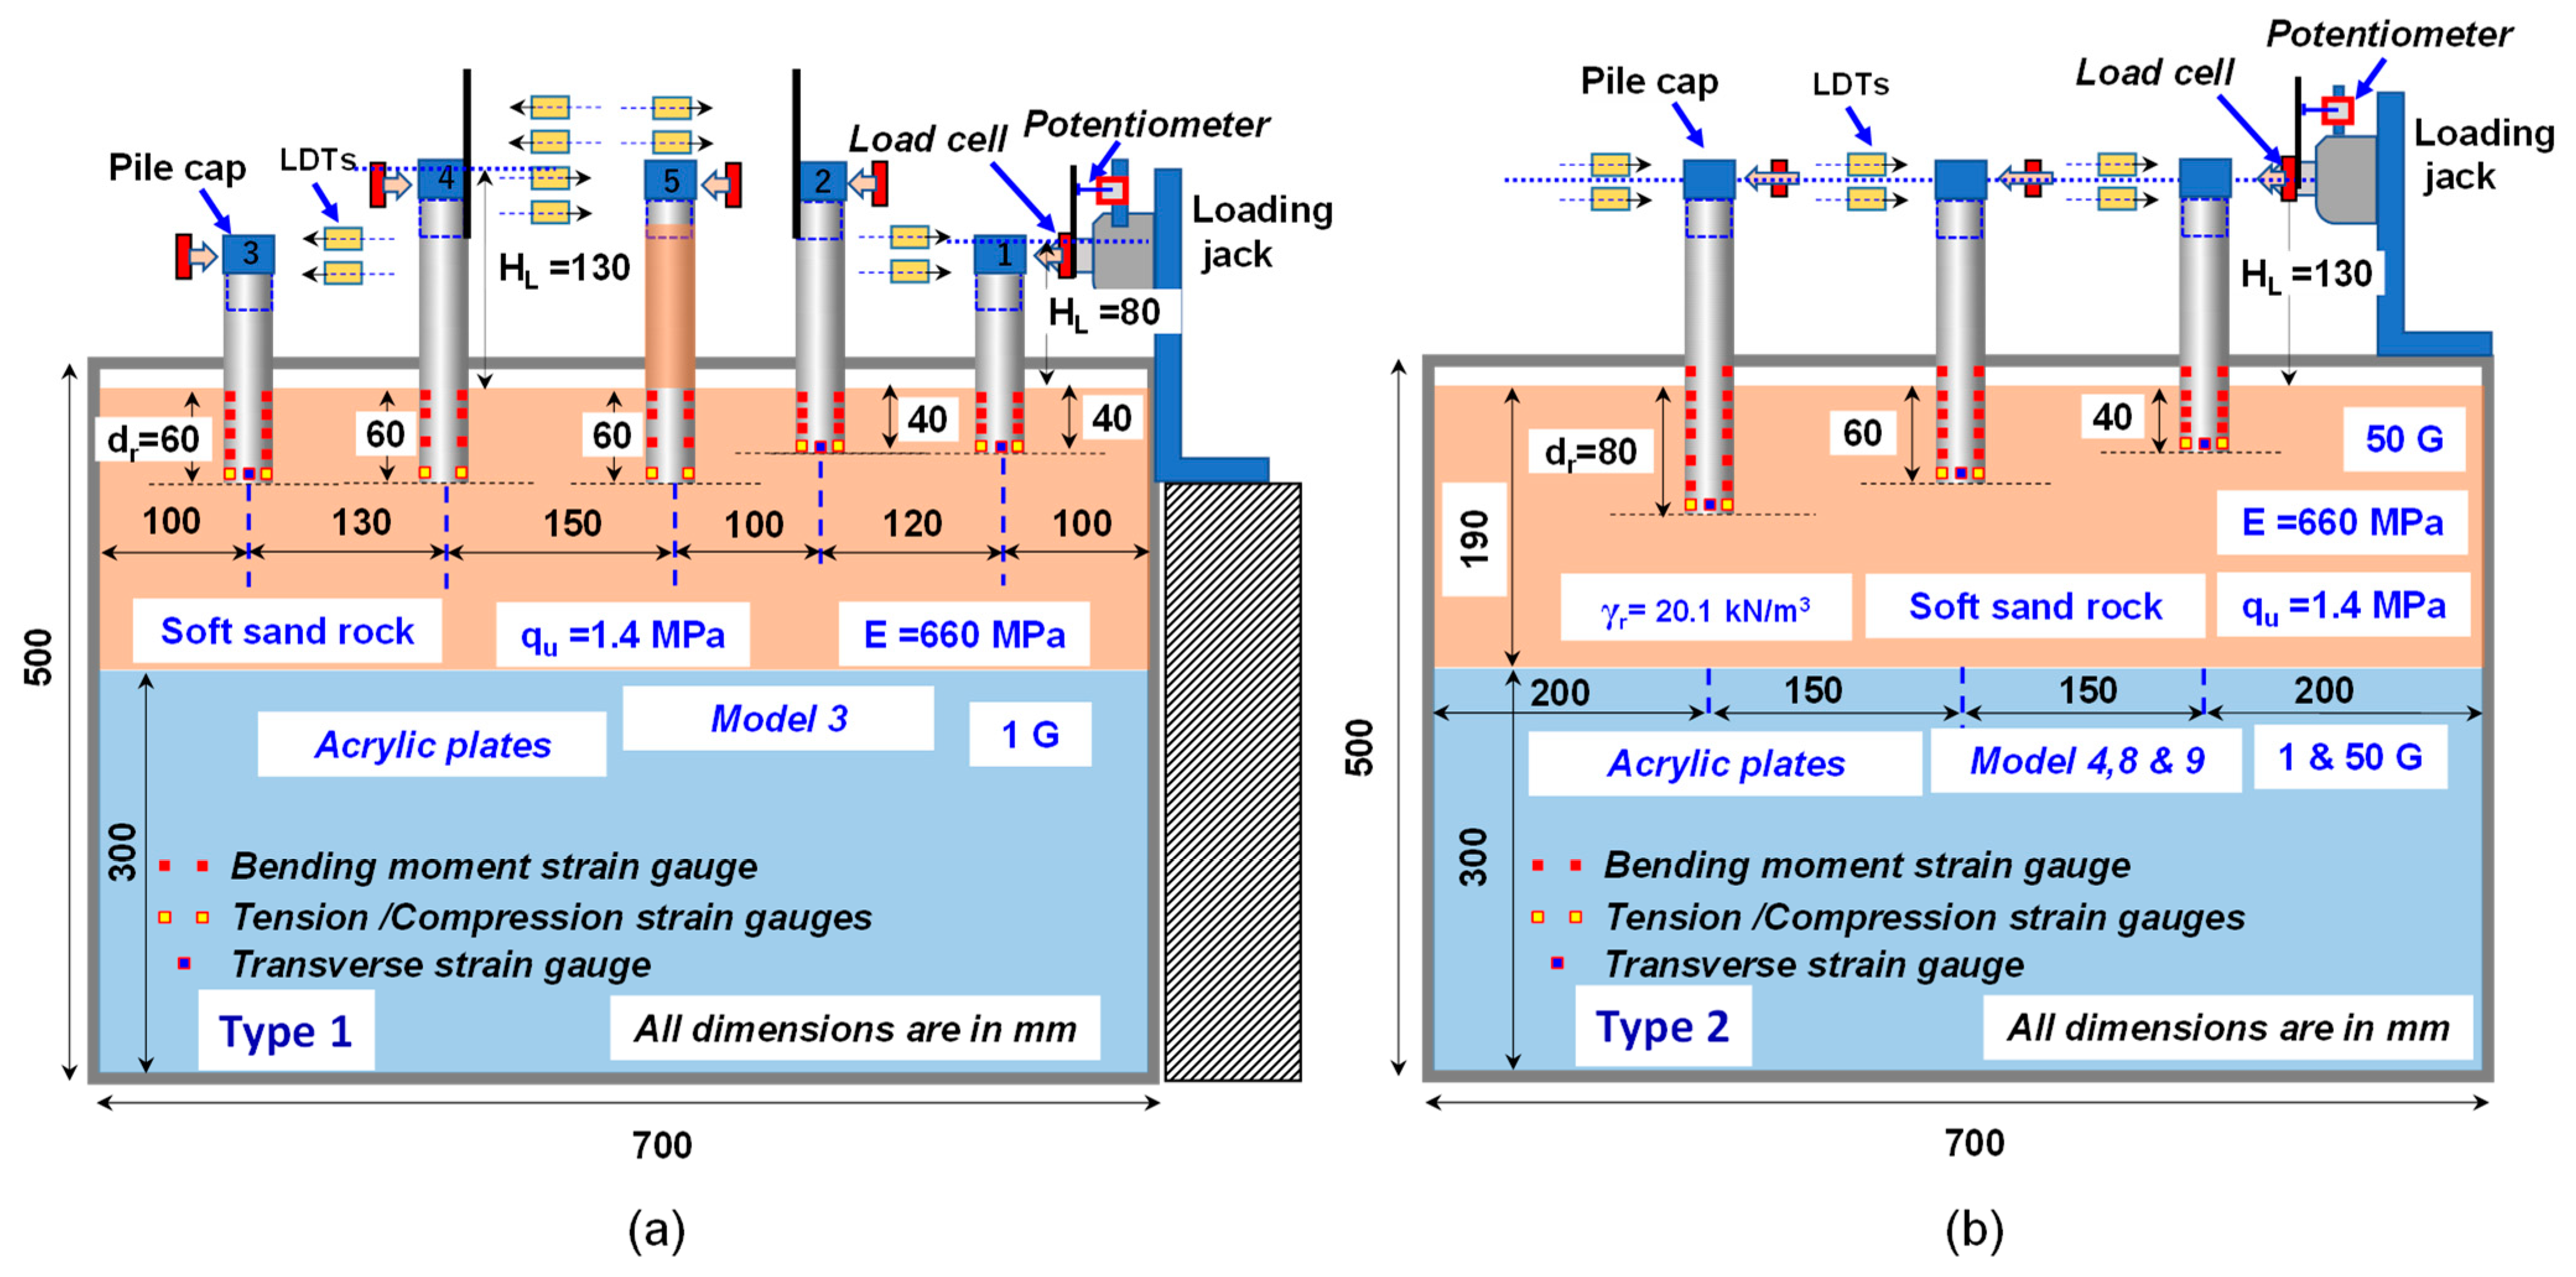
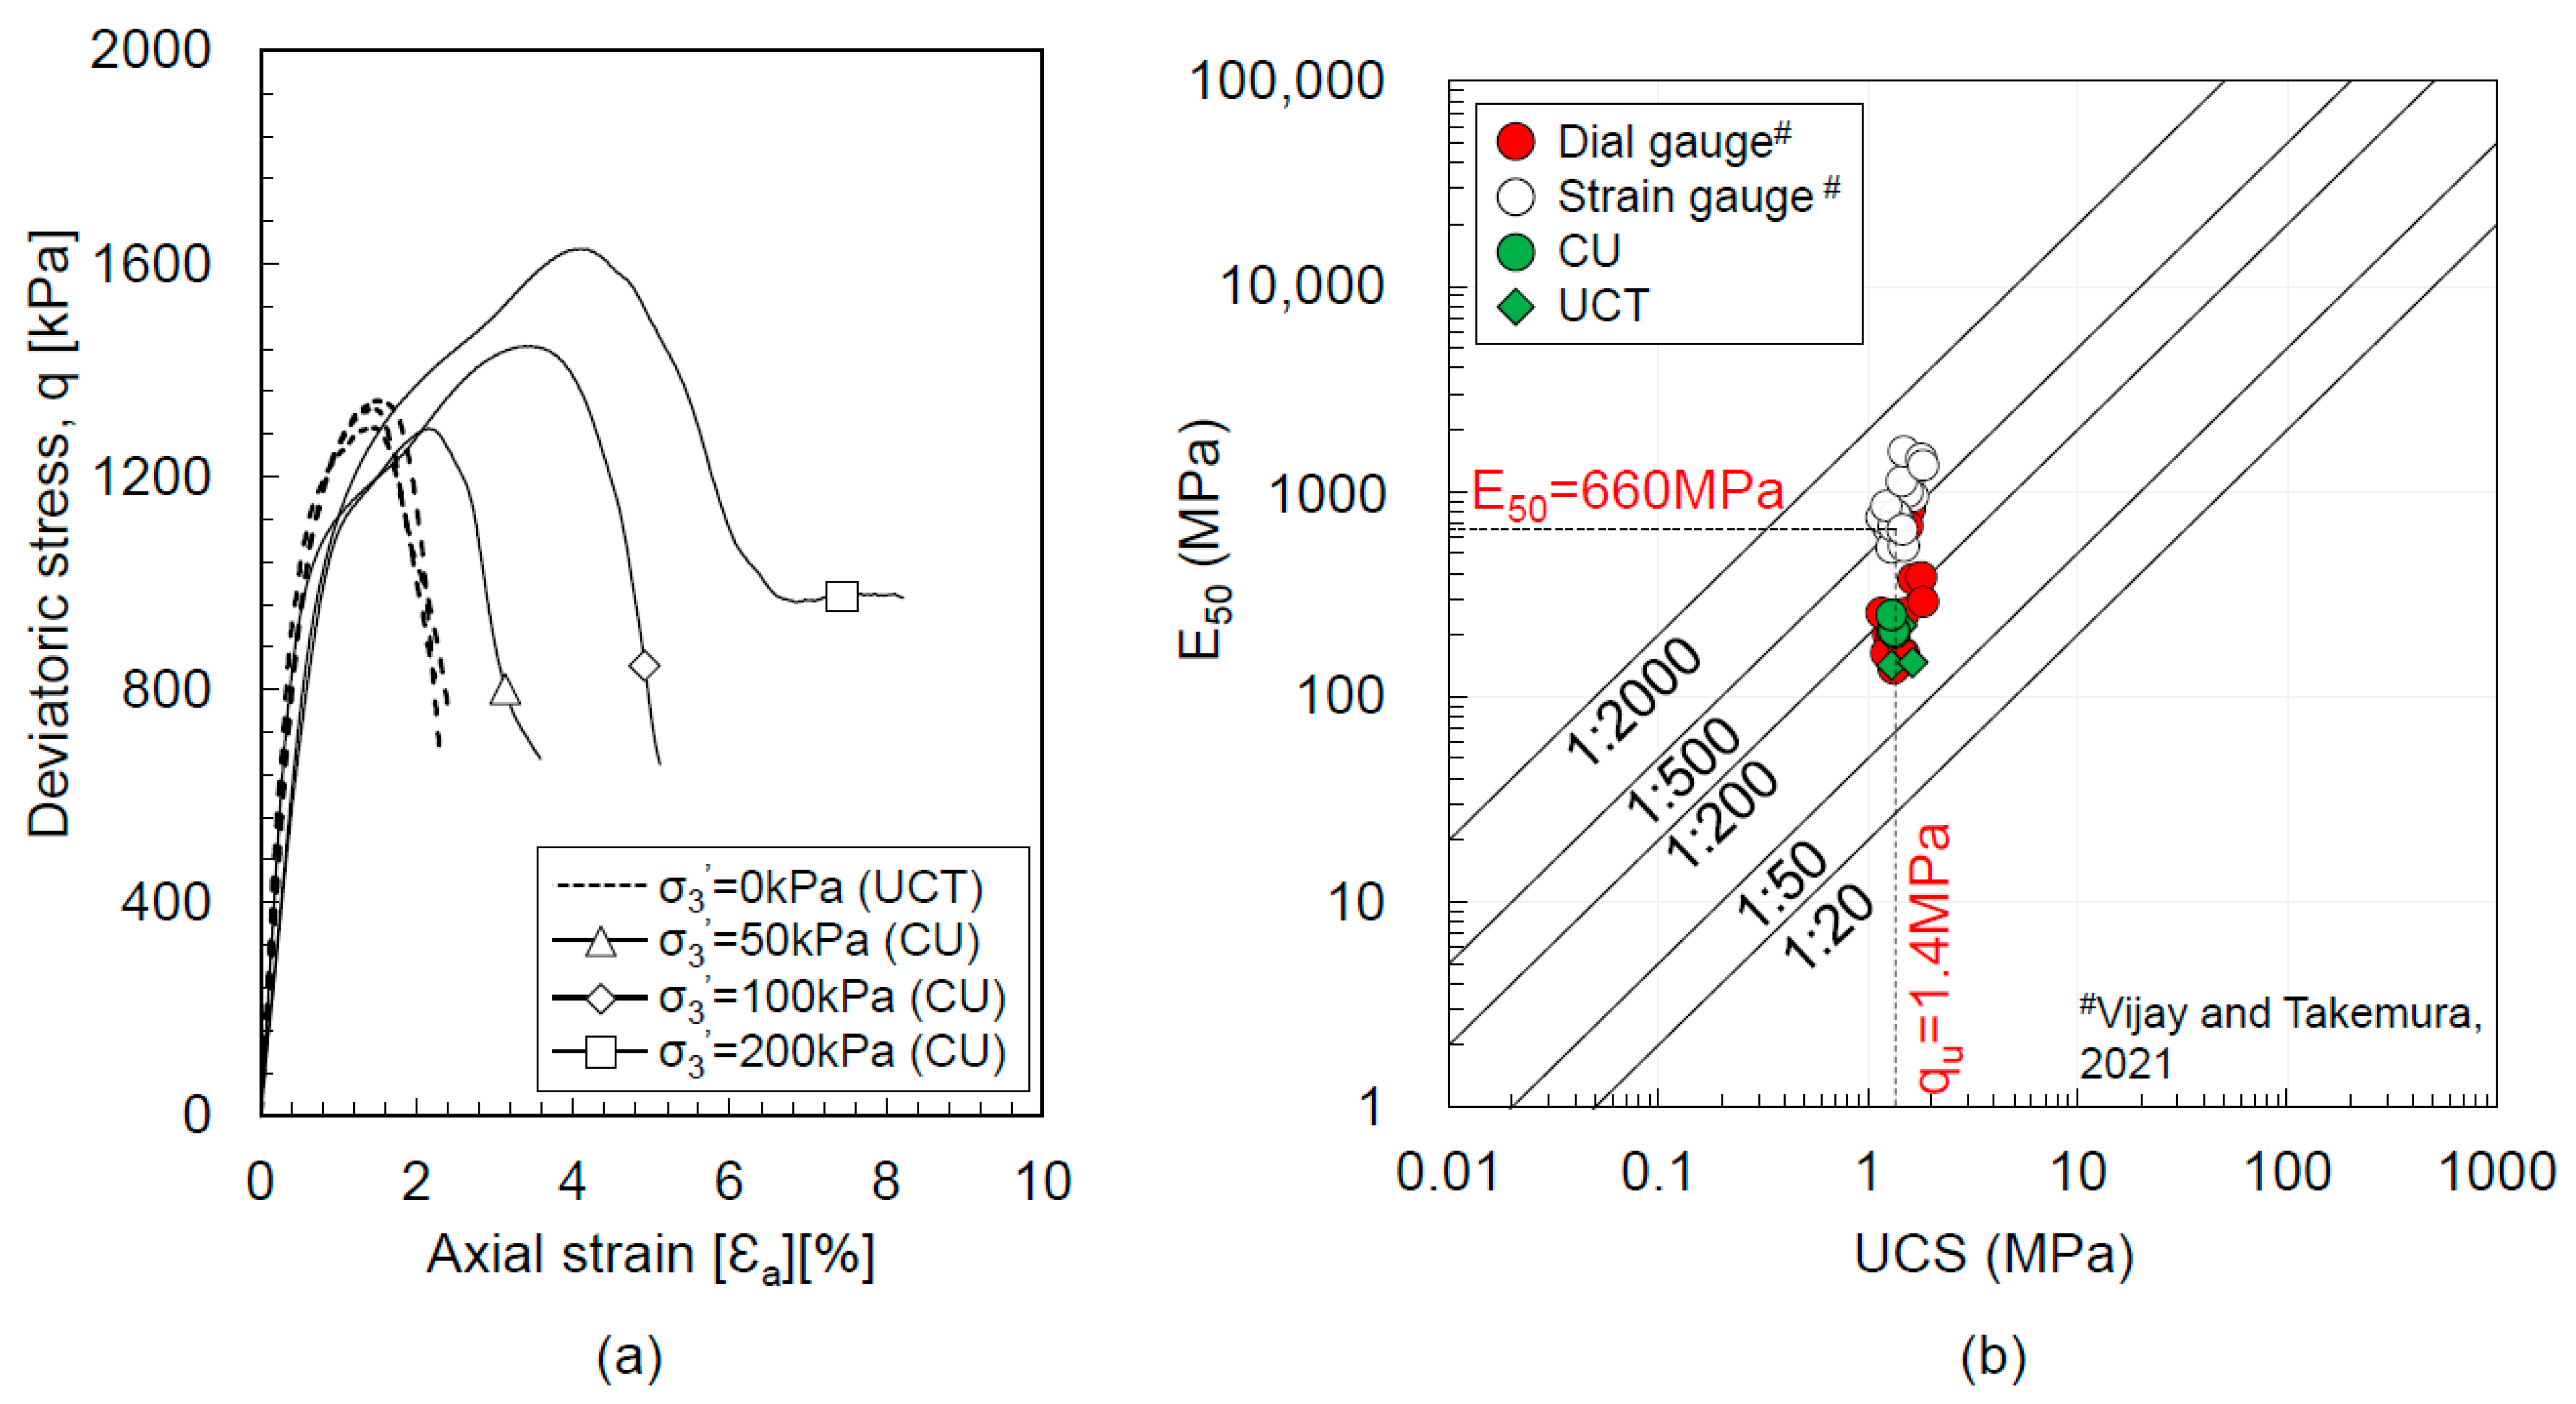
2. Centrifuge Model Tests

Figure 1 depicts the 2D view of the 1 g and 50 g model setups, which were conducted at the Tokyo Tech Mark III centrifuge facility [25]. A rigid container measuring 700 mm in length, 500 mm in depth, and 150 mm in width was used for both the 1 g and 50 g model tests. Identical stainless steel (SUS304) piles with a Young’s modulus (E) of 193 GPa and a yield stress (σy) of 255 MPa were used in both models. A solid circular pile cap with a 30 mm socketing depth was firmly fixed to form a solid loading head. Additionally, Kunasegaram and Takemura [17] conducted a detailed calibration test on the model pile and concluded that the actual yielding occurred at approximately 65% of the theoretical yielding moment (My). The mechanical properties of the piles used in the two different 1 g model tests are presented in Table 1.
In the first 1 g model test, the rock socketing depths were 40 mm and 60 mm, and the loading heights were 80 mm and 130 mm in model scale, respectively. The second 1 g model test employed three rock socketing depths of 40 mm, 60 mm, and 80 mm with a loading height of 130 mm in model scale. The setup used for the 50 g model was similar to that shown in Figure 1b, with piles representing rock socketing depths of 40 mm, 60 mm, and 80 mm (corresponding to 2 m, 3 m, and 4 m in prototype scale).
In all the tests conducted, the piles were socketed into a single layer of soft rock. The model soft rock ground was prepared by compacting a mixture of cement, sand [26,27], sumi-clay, and water into the container using appropriate mixing ratios. The details of the ground preparation and the mechanical properties of the model soft rock were reported by Kunasegaram and Takemura [17,24]. The 14th day unconfined compressive strength (qu) and the corresponding secant stiffness (E50) of the model rock were used to define the strength and stiffness of the model soft rock. A consolidated undrained (CU) triaxial test was conducted on the mould sample, and the results are shown in Figure 2a along with the unconfined compression test (UCT) result. The figure illustrates the variation of deviatoric stress (q) with axial strain (εa) (measured using a dial gauge) for three confining pressures (σ3) of 50 kPa, 100 kPa, and 200 kPa. Figure 2a confirms that there is a large increase in strength with increasing confining pressure. Moreover, no effect of confinement can be confirmed at a small strain level. Figure 2b shows the variation of the secant stiffness with the unconfined compressive strength reported by Kunasegaram and Takemura [24] for two types of strain measurement methods using a dial gauge and using strain gauges. Additionally, the variation of E50 and UCS for the test shown in Figure 2a is also shown in Figure 2b. The results indicate that the strength and stiffness measured by the dial gauge highly underestimate the strength and stiffness measured by the strain gauges. As proposed by Kunasegaram and Takemura [24], an unconfined compressive strength of 1.4 MPa and a secant stiffness of 660 MPa are considered representative strength and stiffness of the artificial model soft rock.
Before preparing the model ground, Teflon sheets were attached to both sides of the container to prevent the container wall from being affected by the cement-treated rock soil. After attaching the Teflon sheets, a thick acrylic plate stack was tightly placed at the bottom of the container, reducing the depth to 200 mm. The gap between the container wall and the acrylic plate was sealed with silicon rubber to prevent moisture loss during ground preparation. The ground was prepared layer by layer while maintaining the desired density, with each layer being compacted using a mechanical vibrator. The piles were inserted into the unsolidified ground with the help of a guide. In the case of pile 5 of Model 3 (as shown in Figure 1a), the pile was filled with rock up to the pile top. Wet towels were placed on the ground during the 14 day curing period to prevent moisture loss.
Each model pile was instrumented with bending and axial strain gauges, as illustrated in Figure 1. To measure the bending strain, a full-bridge Wheatstone circuit was used, while a half-bridge Wheatstone circuit was used to measure the axial strain, as shown in Figure 3a,c. For 1 g models, strain gauges were also affixed to the rock surface near the front and back of the pile, as depicted in Figure 3c. Two Laser Displacement Transducers (LDTs) were employed to measure the displacement (δt) directly and back-calculate the rotation (θ). These LDTs were positioned at the loading point and below it, as shown in Figure 3b. The lateral load (PL) was applied on the pile top with the aid of a load cell, also illustrated in Figure 3b, and the load was controlled by controlling the displacement. A consistent loading rate of 0.5 mm/min was maintained for all cases.
Both 1 g and 50 g loading tests were conducted on the 14th day of the curing period. In the case of the 50 g model test, after completing each test, the centrifuge was stopped and the loaded pile was removed. The load cell and the LDTs were then reset to the next pile, and a similar loading sequence was repeated. In all the tests, the first loading test was performed on the short rock socketing depth and ended with the long rock socketing depth. In the case of Model 4 (50 g), the short pile (40 mm) was unintentionally preloaded, and thus the resistance and stiffness could not be obtained in an intact condition, and therefore it was excluded from the discussion. Additionally, some strain gauges malfunctioned during the test, and hence they were excluded from the discussion as well. In the following section, all the test results are presented in model scale to facilitate a comparison between 1 g and 50 g.

3. Results and Discussion

A typical loading sequence and the definitions of the critical parameters used in this paper are presented in Figure 4, which describes the variation of the lateral load with the pile top displacement. Each loading cycle consists of unloading and reloading with a monotonic loading up to the ultimate failure of the system (defined by the failure of the ground or structural failure). With the increase of loading cycles, residual displacement (δri) also increases after each unloading, as shown in Figure 4. The slope of the loading and reloading curves represents the system stiffness (Ei) for the corresponding cycle. Furthermore, the figure defines the imposed lateral load and displacement for the ith cycle. Based on the monotonic portion between each unloading reloading cycle, a unique curve can be obtained, which is referred to as the backbone curve, as shown in Figure 4. The ultimate lateral resistance of the pile is defined as the measured maximum lateral load from the backbone curve.

3.1. Experimental Results

3.1.1. Observed Results from 50 g Centrifuge Model Tests

Figure 5 depicts the lateral load-displacement behaviour of Model tests 4 and 8, presenting both cyclic loading and backbone curves. The results illustrate the significant effect of rock socketing depth on the lateral resistance of the pile, with increasing socketing depth resulting in higher lateral resistance. A noticeable difference in lateral resistance is also observed for a change in rock socketing depth of Δdr/Φ = 0.5.
A comparison between Models 4 and 8 confirms the influence of loading cycles on the ultimate lateral resistance. Piles with dr/Φ = 1.5 and 2, in Model 4, subjected to imposed displacement cycles, exhibits clear ultimate lateral resistance (qult) with displacement softening behaviour after the peak. In contrast, Model 8, subjected to larger displacement cycles, displays displacement hardening behaviour without a distinct ultimate lateral resistance for dr/Φ = 1.5 and 2.
Figure 6 illustrates the distribution of bending moment with depth at different imposed displacements (δt = 0.5%Φ, 1%Φ, 4%Φ, and 10%Φ) in prototype scale. The bending moment is expressed as a percentage of the yielding moment. The results indicate that, no effect of confinement or rock socketing depth up to δt = 1%Φ for the piles with dr/Φ = 1.5 and 2. However, a noticeable difference in bending moment can be observed at δt = 4%Φ. At δt = 10%Φ, the ratio of the bending moment (M/My) exceeds 150% for the pile with dr/Φ = 2, whereas for dr/Φ = 1.5, the M/My ratio is less than 100%. It is important to note that the maximum bending moment occurs above the rock surface, with an abrupt change in bending moment below the rock surface. Additionally, the maximum bending moment below the rock surface is measured by the strain gauge located near the rock surface.
Figure 7 illustrates the measured bending moment in the prototype scale for the piles with dr/Φ = 2. The figure also includes the calibration test results reported by Kunasegaram and Takemura [17] and the variation observed in the centrifuge model tests using a strain gauge located near the rock surface (above the rock surface). The theoretical bending moment (PL × HL) is also plotted for comparison.
A deviation from the linear theoretical value is observed at approximately 12 MNm (60% My). Notably, the measured bending moment for SP_SR_4x exceeds that of SP_SR_4 for applied moments greater than 10 MNm, primarily due to their respective locations. Comparing the measurements of SP_SR_4 with the calibration test results shows good agreement until the failure of the pile, occurring near the plastic moment (Mp). However, in the case of SP_SR_4x, the ultimate condition is reached before reaching the plastic moment (Mp).

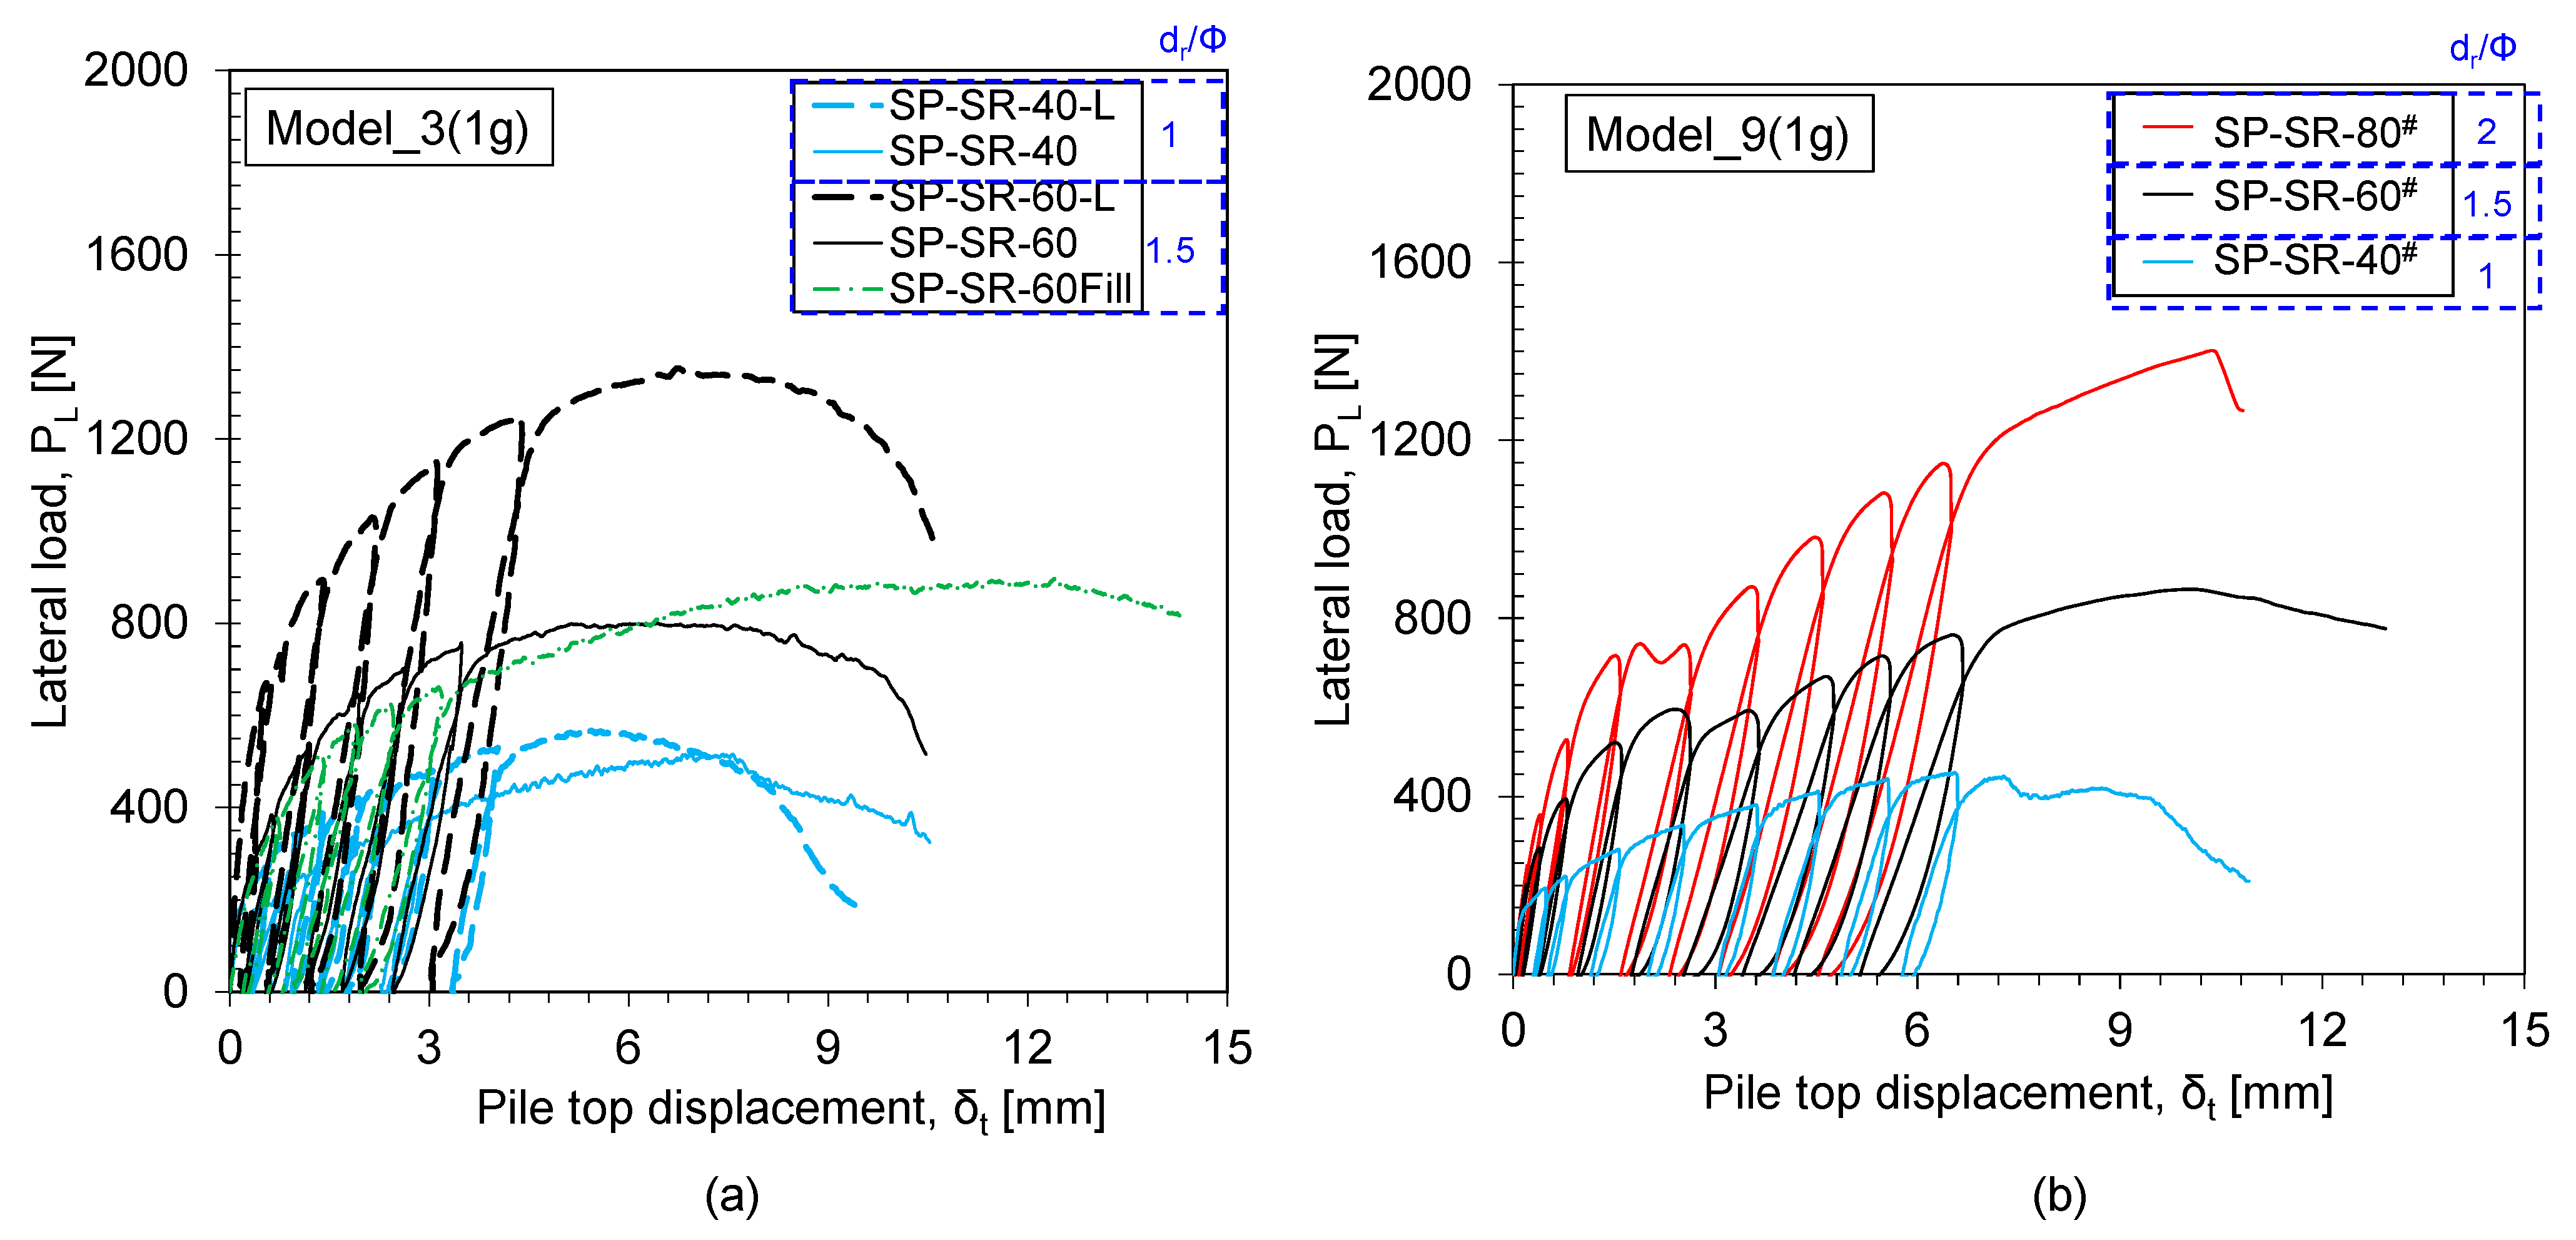
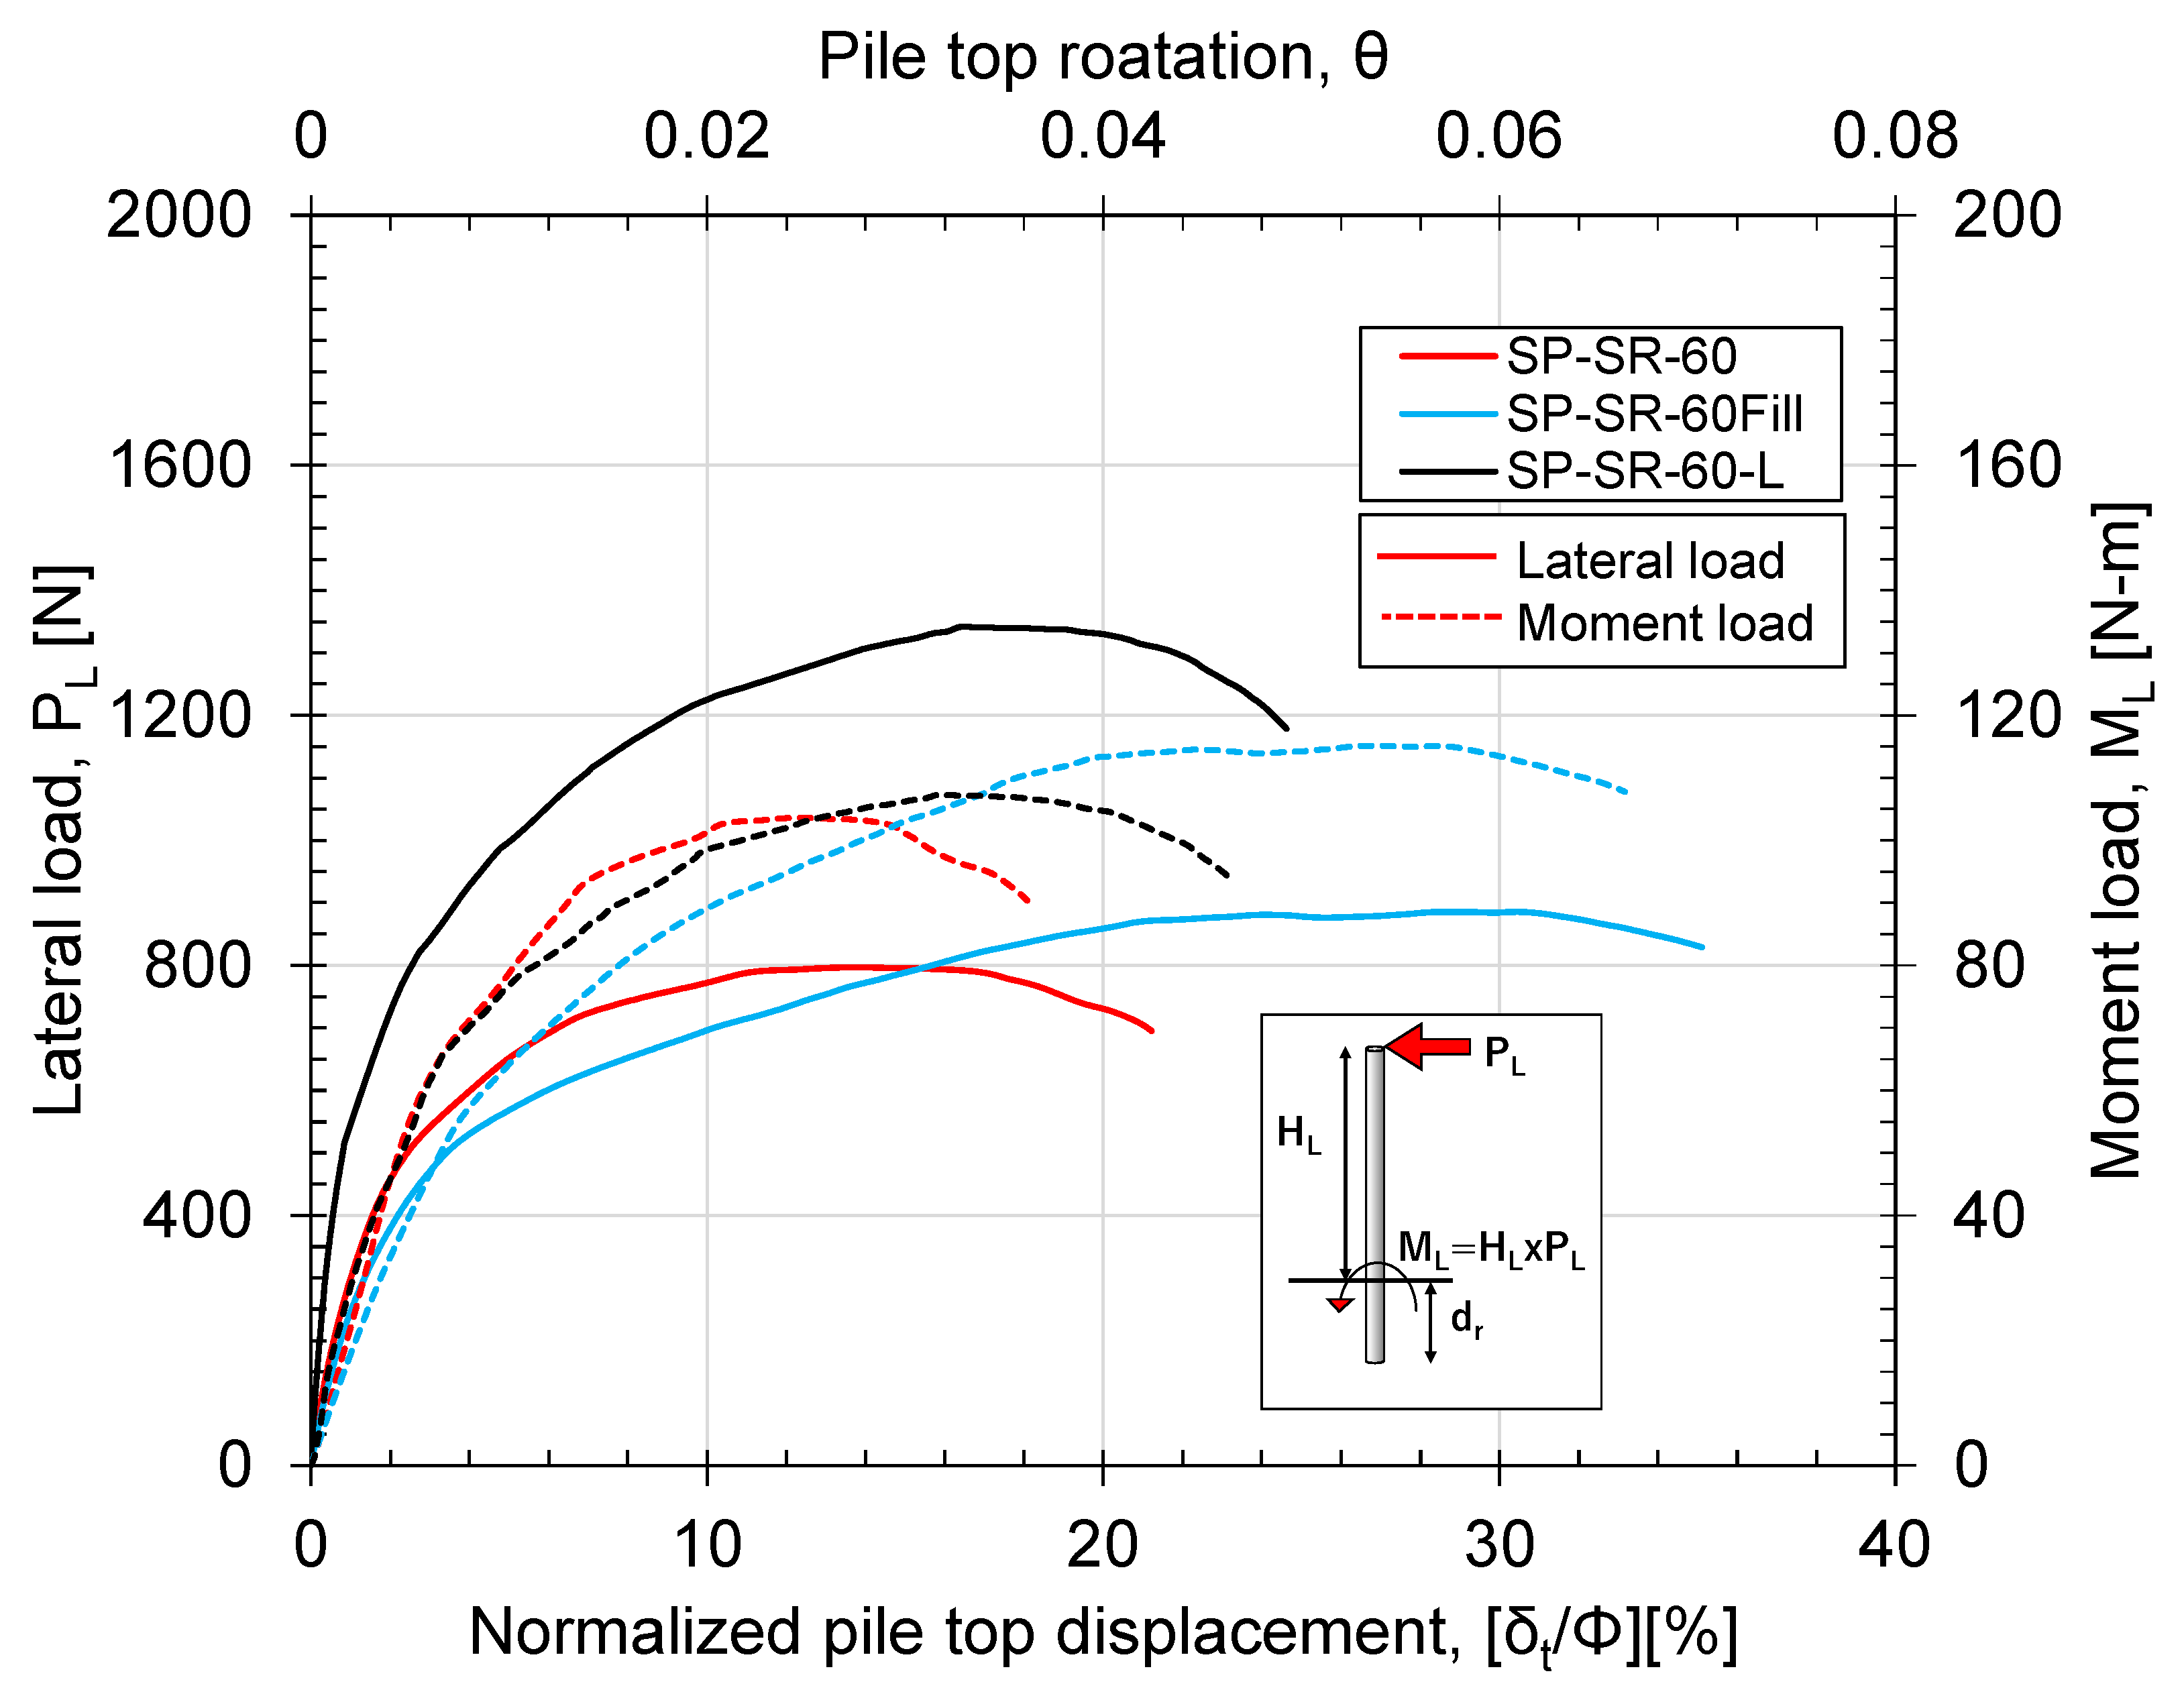
3.1.2. Observed Results from 1 g Centrifuge Model Tests

Figure 8 illustrates the relationship between lateral load and pile top displacement for Models 3 and 9, with similar loading cycles maintained for each pile. Residual displacement accumulates with each unloading-reloading cycle, and the slope of the reloading cycle changes as the number of cycles increases. The effect of rock socketing depth on lateral resistance is evident in the 1 g model test, showing that deeper socketing depths result in increased resistance. When comparing SP-SR-40 and SP-SR-40-L, despite of different loading heights, no significant difference in lateral resistance is observed. Furthermore, no significant difference in the load-displacement behaviour can be observed when comparing SP-SR-40# to SP-SR-40 and SP-SR-40-L. However, the impact of loading height becomes apparent as the socketing depth increases, it can be confirmed from the comparison of SP-SR-60-L to SP-SR-60. Additionally, no significant difference in lateral resistance is observed while comparing SP-SR-60 and SP-SR-60-Fill, showing the minimal influence of infilled conditions. In the case of SP-SR-80#, a sudden reduction in lateral load is observed at δt = 2.5 mm, and it exhibits a distinct peak followed by displacement softening behaviour.
Figure 9 presents the post-test condition of the rock ground following the 1 g model test. In the ultimate condition of the test, ground failure consistently occurs. Comparing SP_SR_60# with SP-SR-60, a tension crack was observed in SP_SR_60#, while compressive failure was observed at the front of the pile in SP-SR-60. No significant crack or appearance of a compressive failure block was noticed for SP-SR-40#. However, a distinct tension crack extending to the side of the container was observed in SP-SR-80#.
Figure 10 presents the results of the 1 g model tests, showing the variation of rock surface strain and lateral load against the normalised pile top displacement for the SP-SR-60 and SP-SR-80# piles. The front (compression) and back (tension) rock surface strains are displayed for SP-SR-60, while only the front strain is shown for SP-SR-80#. The peak rock surface strain occurs at a pile top displacement of approximately 6–10%Φ, indicating the point at which the rock surface begins to deteriorate. In the case of SP-SR-60, no visible tensile strain was measured up to δt = 5%Φ, while the compressive strain decreased significantly from δt = 5–10%Φ, with the tensile strain remaining relatively constant. However, after δt > 10%Φ, the tensile strain increased significantly while the compressive strain remained relatively constant.

3.2. Discussions

3.2.1. Load Displacement and the Effect of Failure Mechanisms on the Load-Displacement Behaviour of the Pile Loading Test

Figure 11a illustrates the lateral load-displacement backbone curve observed in the 1 g and 50 g model tests. The effect of rock socket depth is evident in both tests. However, the 1 g model underestimates the lateral resistance, particularly at large displacements for dr/Φ = 1.5 and 2. For dr/Φ = 1, no effect of the g level or the material stiffness is observed on the load-displacement behaviour due to the rigid nature of the pile.
Comparison of SP_SR_4 and SP_SR_3 reveals that, no effect of rock socketing depth presents up to δt = 1%Φ, which is consistent with the results of the CU triaxial test presented in Figure 2a. These results indicate negligible confinement effects at small strain levels due to the large cohesion (cu = qu/2) and low-stress dependency of the rock material. This behaviour can also be confirmed by comparing SP_SR_4x and SP_SR_3x. However, the backbone curve for SP_SR_2x deviates from those of SP_SR_3x and SP_SR_4x from the beginning. This deviation is attributed to the rigid nature and large rotation of the pile, as explained by Kunasegaram and Takemura [17].
To compare the load-displacement behaviour of 1 g and 50 g models under small pile top displacement, the lateral load at different imposed displacements (0.5%Φ, 1%Φ, 2%Φ, 10%Φ, and qult) is plotted against the normalised rock socketing depth in Figure 11b. The results show that, for the 50 g model, there is no significant effect of rock socketing depth up to δt = 2%Φ. In the load-displacement behaviour, the confinement effect becomes visible as the imposed displacement increases beyond 2%Φ. In contrast, the 1 g model can predict this behaviour up to δt = 0.5%Φ. As the imposed displacement increases, the effect of rock socketing depth becomes more pronounced in both the 1 g and 50 g models. These results suggest that the 1 g model may not accurately predict the load-displacement behaviour of piles at large displacements, especially for high rock socketing depths. However, for dr/Φ = 1, there is no significant difference between the 1 g and 50 g models, likely due to the rigid nature of the pile.
The overall load-displacement behaviour of the pile is an indicator of the deformation and the failure mechanism. Kunasegaram and Takemura [17] reported that for SP_SR_4 and SP_SR_4x, two types of failure mechanisms were observed: structural failure for the former and ground failure for the latter. The two types of failure could be due to the difference in the number of loading cycles applied before the monotonic loading. For SP_SR_4x, due to a larger number of loading cycles than SP_SR_4, the rock pile confinement deteriorates, leading to ground failure. However in SP_SR_4, due to the structural failure, clear post-peak displacement softening behaviour is observed in the backbone curve, as shown in Figure 11a.

3.2.2. Rock-Pile Confinement Condition

Both SP_SR_4 and the calibration pile exhibited structural failure by forming sheep-footed buckling just above the support or rock surface, as reported by Kunasegaram and Takemura [17]. As shown in Figure 7, the maximum applied moment at the ultimate condition is almost similar to the plastic moment (Mp) for SP_SR_4. However, in the case of SP_SR_4x, the ultimate condition was reached before reaching the Mp, and ground failure was observed. Based on Figure 7, it can be said that the rock-pile system behaves as a perfect cantilever, with a maximum bending moment appearing just above the rock surface.
From the rock surface strain measurement shown in Figure 10, it can be confirmed that in the ultimate condition, the pile detaches from the surrounding rock, increasing the tensile strain that leads to the deterioration of the pile-rock confining system. The larger rock surface strain observed for dr/Φ = 2 compared to dr/Φ = 1.5 indicates that the effect of confinement and rock socketing depth is significant, and this behaviour is consistent with Figure 2, which shows a large axial strain for a high confining pressure.
As explained by Erbrich [11], the lateral resistance at the shallow rock layer deteriorates due to the chipping action of the rock as the imposed load increases. This behaviour implies that the location of the maximum bending moment shifts deeper with the increasing imposed load. However, as shown in Figure 6, up to δt = 10%Φ, the maximum bending moment below the rock surface occurs at the strain gauge near the rock surface. Therefore, the contribution of the shallow rock layer could be expected even at δt = 10%Φ. Furthermore, Kunasegaram and Takemura [17] discussed that nonlinearity in the strain measurement could be expected at 65% of the yielding moment. Therefore, some overestimation of the bending moment can be anticipated, particularly at large imposed displacements, especially for dr/Φ = 2. This observation can also be confirmed by Figure 7. This behaviour also confirms that the significance of nonlinearity increases as the dr/Φ ratio increases or when the pile behaves more flexibly than rigidly.

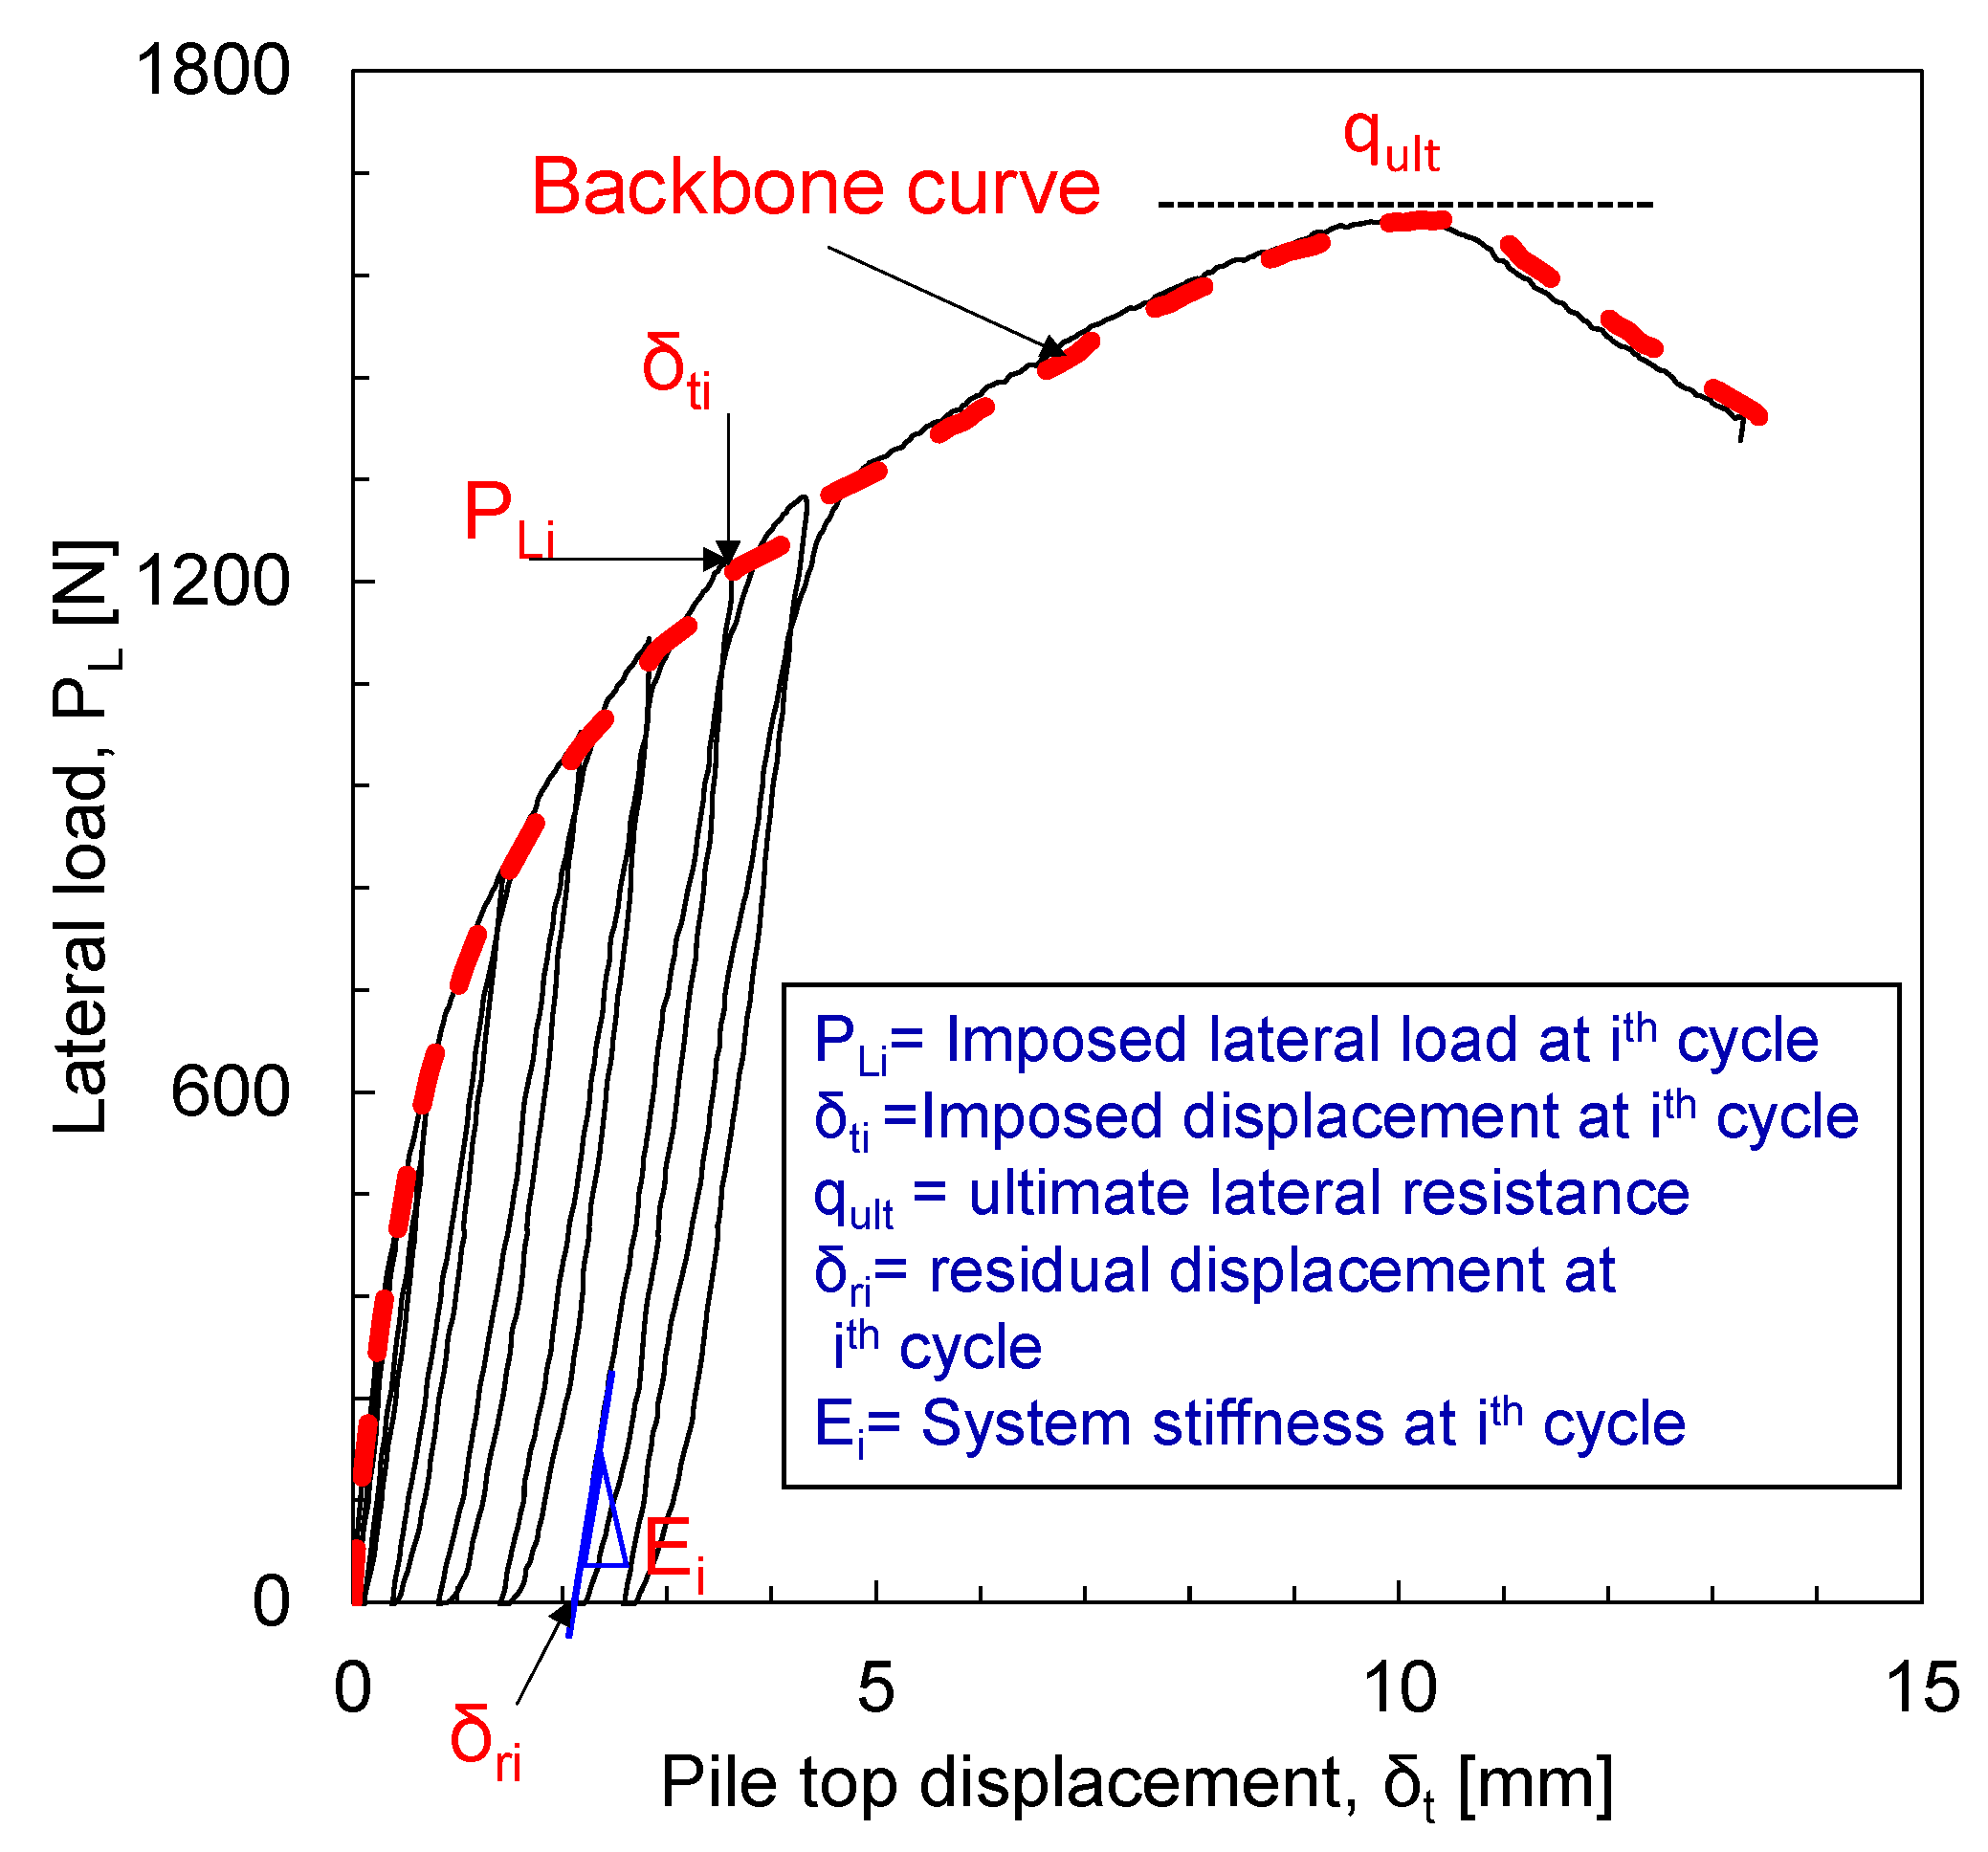
3.2.3. Accumulation of Residual Displacement and Change in System Stiffness

The accumulation of rotation occurs [28]. Figure 12 was developed based on the results of Figure 5 and Figure 8, indicating the variation of accumulated residual displacement with the imposed displacement. It also dictates that, the residual displacement increases with the increase of imposed displacements. In the case of 50 g model, good agreement between the two models can be confirmed in terms of the accumulation of the residual displacement. However, in the case of the 1 g model, the difference in the residual displacement can be confirmed due to the difference in the failure mechanism and crack formation. Comparing the piles SP-SR-60 with SP-SR-60-fill, SP-SR-60-fill shows a significantly higher accumulation of residual displacement than SP-SR-60. Overall, the observed residual displacements of 1 g model was higher than the 50 g model, which can be attributed to the confinement effects at different ‘g’ environments.
Figure 13 depicts the variation of system stiffness (as defined in Figure 4) with imposed displacement. For stiff monopiles used in offshore wind turbines, the stiffness of the ground changes due to long-term cyclic loading [28]. The system stiffness for soft rock exhibits a different trend than sand. In sand, system stiffness increases with an increase in cyclic loading, whereas for rock, the system stiffness changes with an increase in the number of cycles [16,17]. This difference in behaviour between sand and rock can be attributed to the fact that in the sand, the surrounding soil densifies with the increase of loading cycles. But in rock type materials, chipping and deterioration of intact conditions at the rock surface, creating a gap (accumulation of residual displacement) between the pile and rock, leading to the lack of confinement. For the 50 g model, identical initial system stiffness was confirmed for dr/Φ = 1.5 and 2, which decreased with an increase in the number of cycles. The system stiffness for dr/Φ = 1 was less than that for dr/Φ = 1.5 and 2. In the 1 g model, a difference in the initial system stiffness was observed for different dr/Φ ratios. Therefore, the system stiffness was normalised by the initial stiffness to compare it with the 50 g model test data. The trend of reduction in the system stiffness for dr/Φ = 1.5 and 2 of the 1 g model captured the 50 g model test trend. For dr/Φ = 1, the reduction in system stiffness was larger for the 1 g model than for the 50 g model. Comparing SP-SR-40-L with SP_SR_40#, the observed system stiffness was larger for a short loading height than for a large loading height. For SP-SR-40-L, due to the small loading height, the corresponding moment load became smaller, leading to a small rotation at the pile top, causing a small displacement and, thus, a larger stiffness ratio than for the large loading height SP_SR_40#. Comparing SP-SR-60 with SP-SR-60-fill, as the accumulation of residual displacement is larger for SP-SR-60-fill than SP-SR-60, the change in system stiffness is larger for SP-SR-60-fill than SP-SR-60.

3.2.4. Effect of Loading Height and Filling Conditions

Figure 14 shows the variation of load-displacement and moment load-rotation relationship for dr/Φ = 1.5. Comparing SP-SR-60 with SP-SR-60-Fill, no significant difference in lateral resistance was observed. Although the SP-SR-60-Fill pile was filled with soft rock up to the pile cap, due to a small variation (about 3% increase) of the relative stiffness ratio (Ep/G*, where Ep is the equivalent stiffness of the pile and G* is the equivalent shear modulus [9]), no significant difference in the lateral resistance was observed. However, in the ultimate condition, the formation of cracks and failure mechanisms could cause differences in load-displacement behaviour.
As shown in Figure 8, no effect of loading height can be confirmed for dr/Φ = 1 due to the rigid nature of the pile. However, as shown in Figure 14, for dr/Φ = 1.5, the small moment load produced by a small loading height (SP-SR-60-L) provides a larger lateral resistance than the large moment load produced by a large loading height (SP-SR-60). This observation confirms the significance of the loading height and the corresponding moment load on the lateral resistance of the pile. Furthermore, comparing the moment load-rotation relationship between SP-SR-60 and SP-SR-60-L, an almost identical relationship can be observed throughout the loading process. This observation confirms that the SP-SR-60-L behaves as a rigid pile compared to the SP-SR-60.

4. Conclusions

As part of the application of large-diameter cantilever-type steel tubular pile (CSTP) walls embedded in stiff ground, this paper investigates the lateral response of large-diameter steel tubular piles socketed into the soft rock under one-way cyclic loading. Two centrifuge model tests were conducted under 50 g centrifugal acceleration. Additionally, two 1 g model tests were conducted to explore the influence of vertical eccentricity and filling conditions on the lateral response of the piles. Although a high ‘g’ centrifuge test is ideal for understanding the actual pile behaviour when socketed into soft rock, considering the advantages of less stress dependency and the large confining pressure of the soft rock, the 1 g model can be used to predict the actual centrifuge model behaviour up to a certain limit. Based on the models and test conditions presented in this paper, the following conclusions can be drawn:
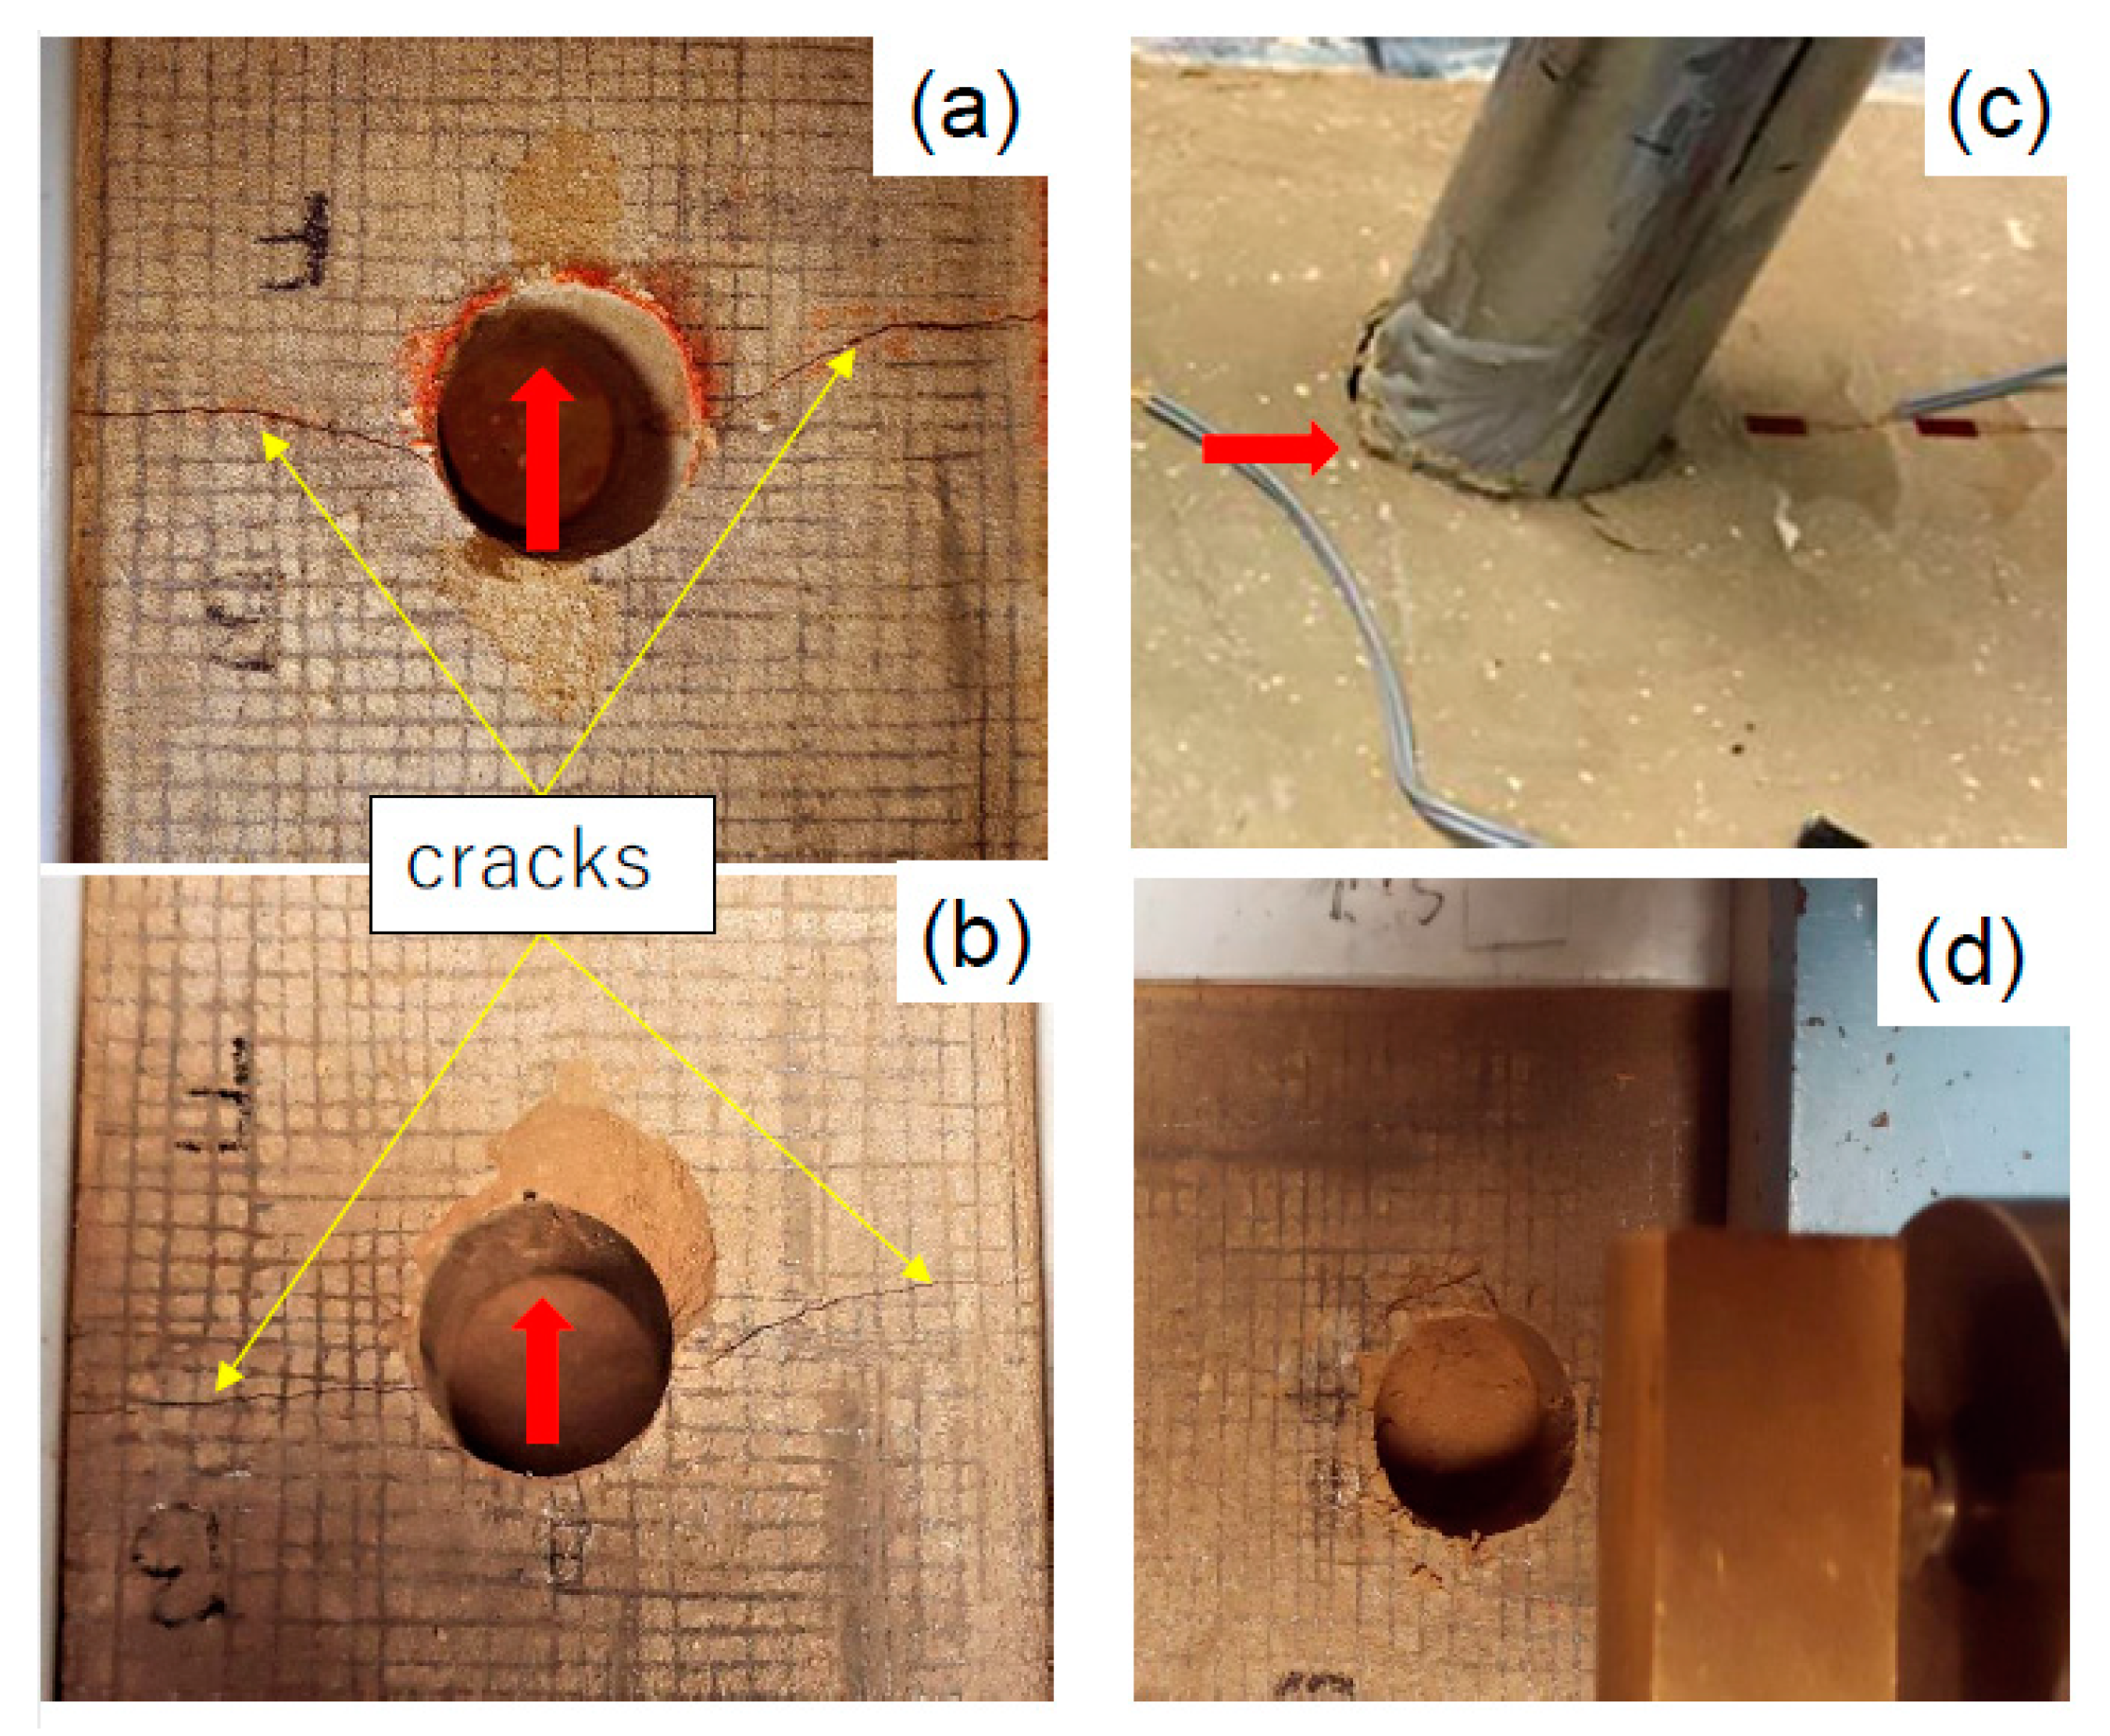
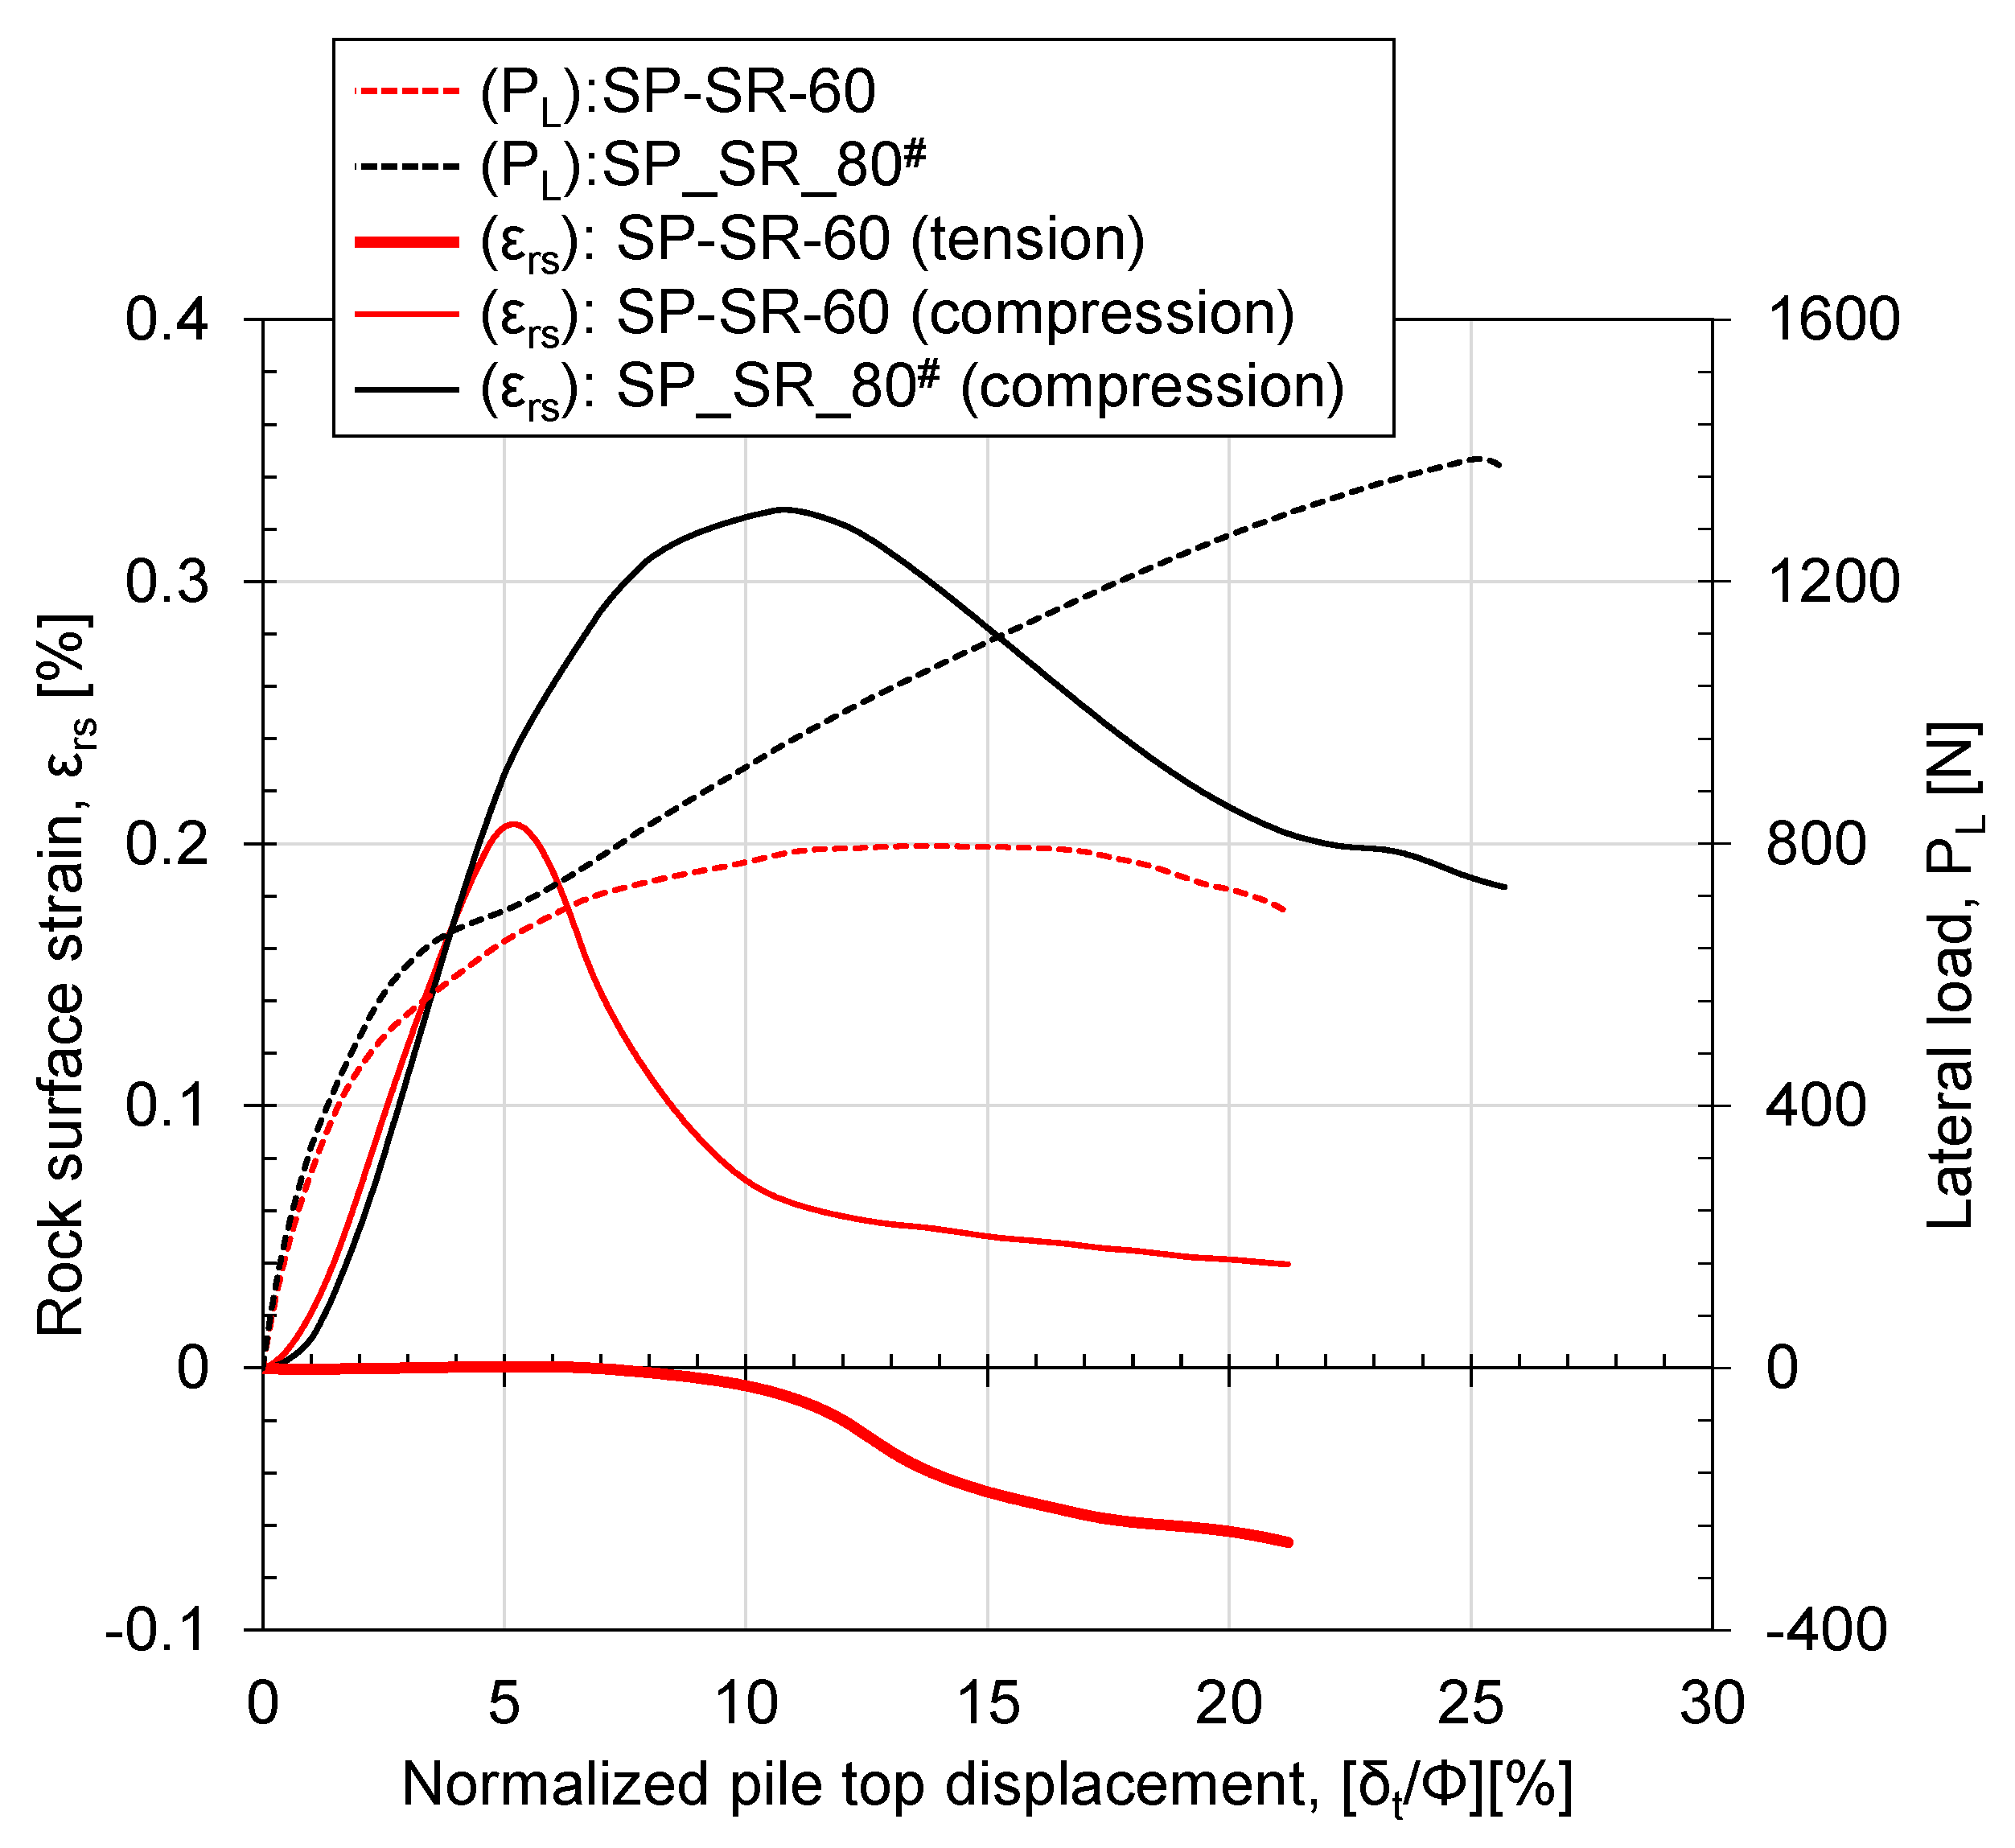
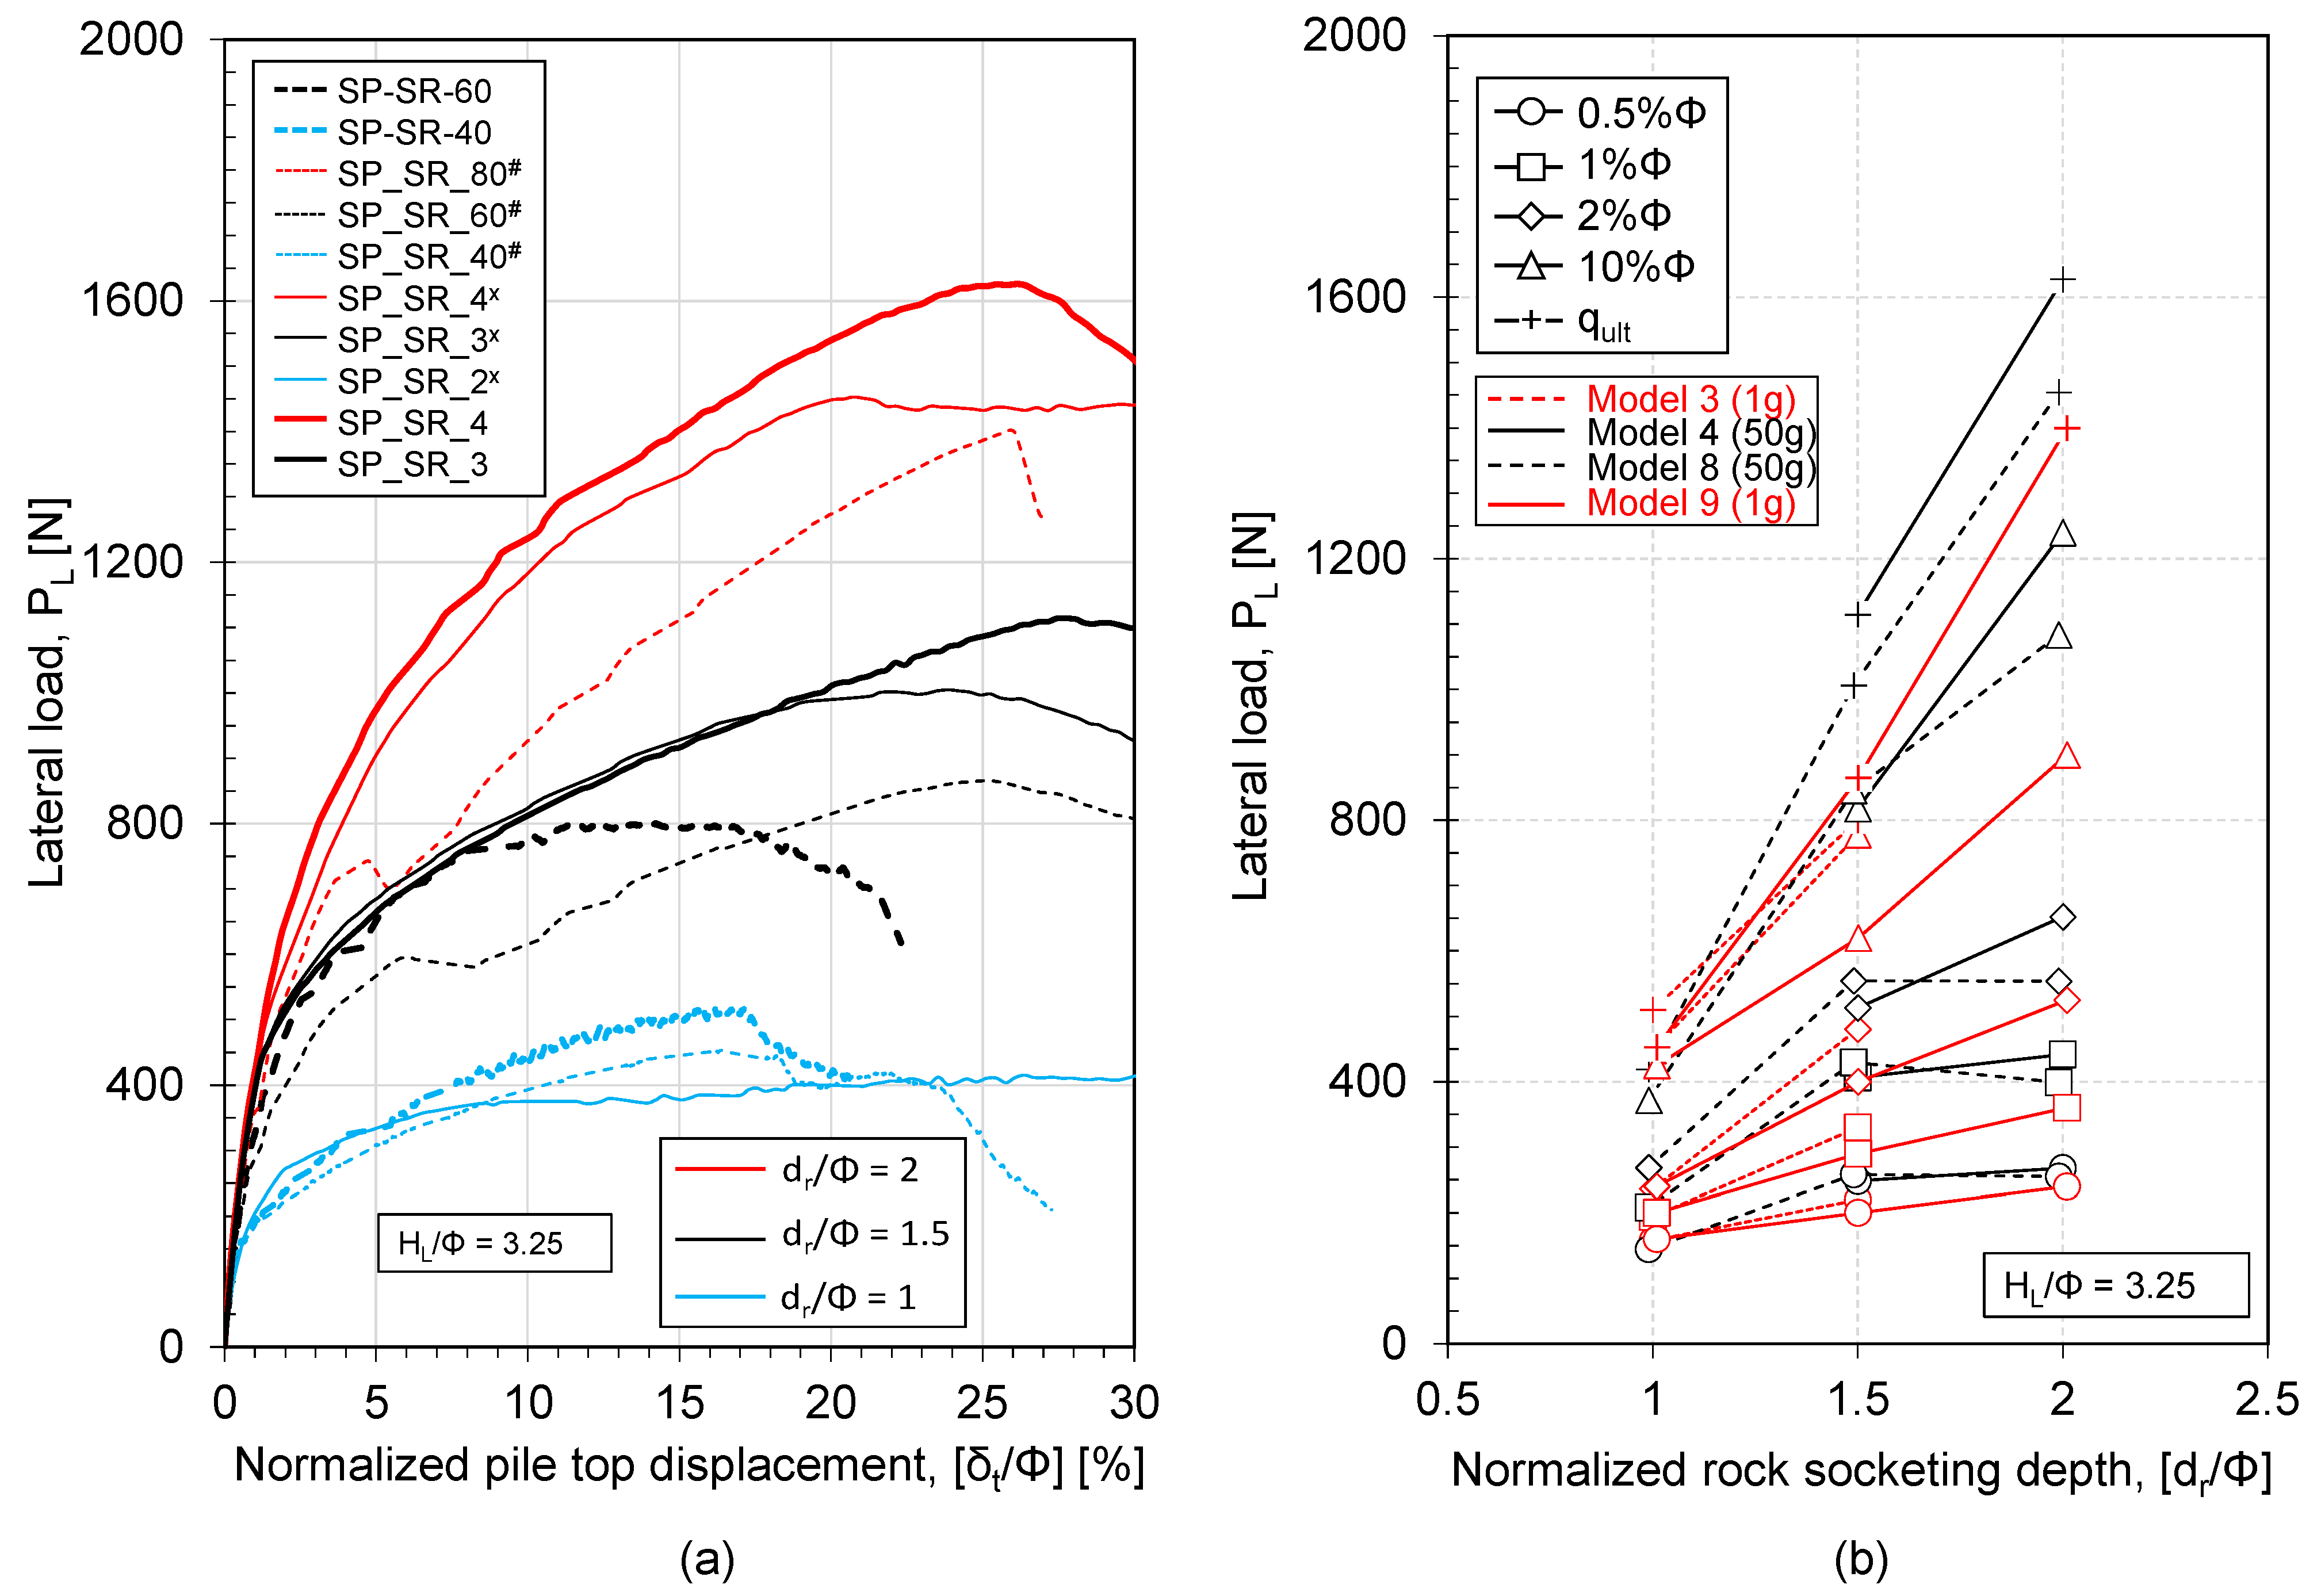
  • The lateral resistance of the pile increases with the increase in rock socketing depth, which can be effectively captured by both the 50 g and 1 g model tests. Both models show the effect of ∆dr/Φ = 0.5. However, the 1 g model underestimates the lateral resistance of the pile compared to the 50 g model, especially after the formation of tension cracks near the rock surface. This kind of tension crack formation in the 1 g model test can be considered as a limitation;
  • The failure mechanism affects the load-displacement behaviour, especially the post-peak behaviour for both the 50 g and 1 g models. Both ground and structural failure were observed in the 50 g model test for dr/Φ = 2, but the 1 g model always showed ground failure;
  • No effect of confining pressure or rock socketing depth can be confirmed up to δt = 1%Φ for dr/Φ = 1.5 and 2 in the 50 g model test. However, in the 1 g model test, this behaviour is limited to δt = 0.5%Φ. For dr/Φ = 1, due to the rigid nature of the pile, no effect of material weight or gravity can be expected;
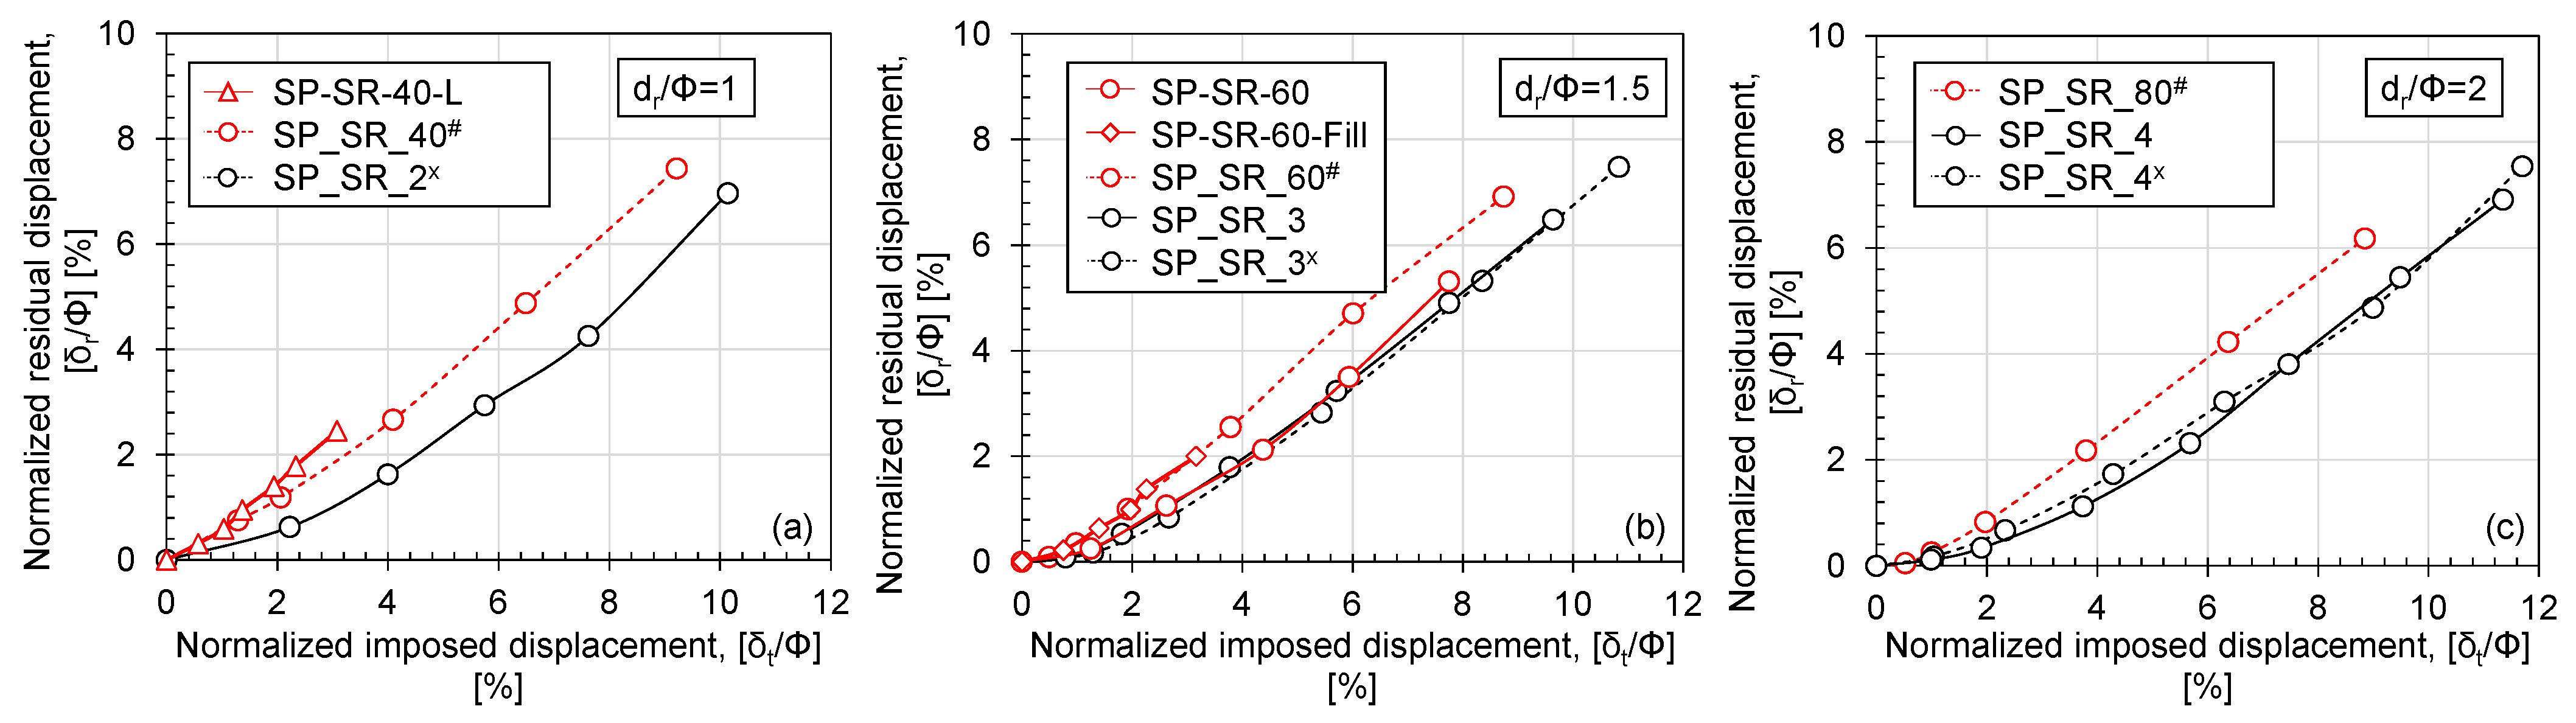
  • With an increase in loading cycles, residual displacement also increases with a reduction in system stiffness. This observation is confirmed in both the 1 g and 50 g model tests. The 1 g model overestimates the accumulation of residual displacement and underestimates the system stiffness, particularly for dr/Φ = 1;
  • Based on the 50 g model test, the rock-pile system can be considered as a perfect cantilever. The maximum bending moment will always occur at the rock surface. However, the nonlinearity in the bending moment measurement becomes significant with an increase in dr/Φ. This effect of nonlinearity is more pronounced in flexible piles than in rigid piles;
  • Based on the 50 g model test, the contribution of the shallow rock layer can be expected, even at δt = 10%Φ;
  • The effect of loading height and moment load on the load-displacement behaviour can be confirmed. The lateral resistance of the pile increases with a decrease in the loading height or the corresponding moment load. However, the rigid nature of the pile can affect the moment load-rotation relationship;
  • No significant effect of the filling conditions on the lateral resistance of the pile can be confirmed unless the relative stiffness changes significantly.

Author Contributions

Experimental and data analysis, S.M.S. and V.K.; manuscript—preparation, S.M.S.; supervision, experimental, and manuscript—preparation, J.T. All authors have read and agreed to the published version of the manuscript.

Funding

The contribution and support provided by International Press-in Association (IPA) TC-1 (Technical Committee on Application of cantilever type steel tubular pile wall embedded to stiff ground) are acknowledged in the acknowledgment section. Except this support no further funding and support is received in this research.

Institutional Review Board Statement

Not applicable.

Informed Consent Statement

Not applicable.

Data Availability Statement

Data that supports the findings are available from the corresponding author upon reasonable request.

Acknowledgments

The author would like to acknowledge the continuous support and guidance of the members of International Press-in Association (IPA) TC-1 (Technical Committee on Application of cantilever type steel tubular pile wall embedded to stiff ground).

Conflicts of Interest

The authors declare no conflict of interest.

References

  1. Kallehave, D.; Byrne, B.W.; LeBlanc Thilsted, C.; Mikkelsen, K.K. Optimization of Monopiles for Offshore Wind Turbines. Phil. Trans. R. Soc. A 2015, 373, 20140100. [Google Scholar] [CrossRef] [PubMed] [Green Version]
  2. Wu, X.; Hu, Y.; Li, Y.; Yang, J.; Duan, L.; Wang, T.; Adcock, T.; Jiang, Z.; Gao, Z.; Lin, Z.; et al. Foundations of Offshore Wind Turbines: A Review. Renew. Sustain. Energy Rev. 2019, 104, 379–393. [Google Scholar] [CrossRef] [Green Version]
  3. Kitamura, M.; Kamimura, S. Cantilevered Road Retaining Wall Constructed of 2000 mm Diameter Steel Tubular Piles Installed by the Gyro Press Method with the GRB System. In Proceeding of the First International Conference on Press-in Engineering, Kochi, Japen, 19–20 September 2018; International Press-in Association: Kochi, Japan, 2018. [Google Scholar]
  4. Miyanohara, T.; Kurosawa, T.; Harata, N.; Kitamura, K.; Suzuki, N.; Kajino, K. Overview of the Self-Standing and High Stiffness Tubular Pile Walls in Japan. In Proceedings of the International Conference on Press-in Engineering First International Conference, Kochi, Japen, 19–20 September 2018. [Google Scholar]
  5. Ishihama, Y.; Takemura, J.; Kunasegaram, V. Analytical Evaluation of Deformation Behavior of Cantilever Type Retaining Wall Using Large Diameter Steel Tubular Piles into Stiff Ground. In Geotechnics for Sustainable Infrastructure Development; Duc Long, P., Dung, N.T., Eds.; Lecture Notes in Civil Engineering; Springer: Singapore, 2020; Volume 62, pp. 91–98. [Google Scholar] [CrossRef]
  6. Matsuzawa, K.; Hayashi, T.; Shirasaki, K. Construction of Retaining Wall for River Disaster Restoration by Gyropress Method. In Proceedings of the Second International Conference on Press-in Engineering 2021, Kochi, Japan, 29 May–7 June 2021; CRC Press: London, UK, 2021; pp. 422–429. [Google Scholar] [CrossRef]
  7. Kanji, M.A. Critical Issues in Soft Rocks. J. Rock Mech. Geotech. Eng. 2014, 6, 186–195. [Google Scholar] [CrossRef] [Green Version]
  8. Fragio, A.G.; Santiago, J.L.; Sutton, V.J.R. Load Tests on Grouted Piles in Rock. In Proceedings of the Offshore Technology Conference, Houston, TX, USA, 6–9 May 1985. [Google Scholar] [CrossRef]
  9. Guo, F.; Lehane, B.M. Lateral Response of Piles in Weak Calcareous Sandstone. Can. Geotech. J. 2016, 53, 1424–1434. [Google Scholar] [CrossRef] [Green Version]
  10. Cho, K.H.; Gabr, M.A.; Clark, S.; Borden, R.H. Field P—y Curves in Weathered Rock. Can. Geotech. J. 2007, 44, 753–764. [Google Scholar] [CrossRef]
  11. Carter, J.P.; Kulhawy, F.H. Analysis of Laterally Loaded Shafts in Rock. J. Geotech. Eng. 1992, 118, 839–855. [Google Scholar] [CrossRef]
  12. Reese, L.C. Analysis of Laterally Loaded Piles in Weak Rock. J. Geotech. Geoenviron. Eng. 1997, 123, 1010–1017. [Google Scholar] [CrossRef]
  13. Liang, R.; Yang, K.; Nusairat, J. P-y Criterion for Rock Mass. J. Geotech. Geoenviron. Eng. 2009, 135, 26–36. [Google Scholar] [CrossRef]
  14. Erbrich, C.T. A New Method for the Design of Laterally Loaded Anchor Piles in Soft Rock. In All Days; OTC: Houston, TX, USA, 2004; p. OTC-16441-MS. [Google Scholar] [CrossRef]
  15. Brown, D.A.; Shie, C.-F. Three Dimensional Finite Element Model of Laterally Loaded Piles. Comput. Geotech. 1990, 10, 59–79. [Google Scholar] [CrossRef]
  16. Kunasegaram, V.; Shafi, S.M.; Takemura, J.; Ishihama, Y. Centrifuge Model Study on Cantilever Steel Tubular Pile Wall Embedded in Soft Rock. In Geotechnics for Sustainable Infrastructure Development; Duc Long, P., Dung, N.T., Eds.; Lecture Notes in Civil Engineering; Springer: Singapore, 2020; Volume 62, pp. 1045–1052. [Google Scholar] [CrossRef]
  17. Kunasegaram, V.; Takemura, J. Mechanical Behaviour of Laterally Loaded Large-Diameter Steel Tubular Piles Embedded in Soft Rock. Geotech. Geol. Eng. 2022, 40, 2967–3005. [Google Scholar] [CrossRef]
  18. Lehane, B.M.; Guo, F. Lateral Response of Piles in Cemented Sand. Géotechnique 2017, 67, 597–607. [Google Scholar] [CrossRef]
  19. Randolph, M.F. The Response of Flexible Piles to Lateral Loading. Géotechnique 1981, 31, 247–259. [Google Scholar] [CrossRef]
  20. Poulos, H.G. Pile Behaviour—Theory and Application. Géotechnique 1989, 39, 365–415. [Google Scholar] [CrossRef]
  21. Hetényi, M.; Hetbenyi, M.I. Beams on Elastic Foundation: Theory with Applications in the Fields of Civil and Mechanical Engineering; University of Michigan Press: Ann Arbor, MI, USA, 1946; Volume 16. [Google Scholar]
  22. Arany, L.; Bhattacharya, S.; Macdonald, J.; Hogan, S.J. Design of Monopiles for Offshore Wind Turbines in 10 Steps. Soil Dyn. Earthq. Eng. 2017, 92, 126–152. [Google Scholar] [CrossRef] [Green Version]
  23. Bhattacharya, S. Challenges in Design of Foundations for Offshore Wind Turbines. Eng. Technol. Ref. 2014, 1, 922. [Google Scholar] [CrossRef]
  24. Kunasegaram, V.; Takemura, J. Deflection and Failure of High-Stiffness Cantilever Retaining Wall Embedded in Soft Rock. Int. J. Phys. Model. Geotech. 2021, 21, 114–134. [Google Scholar] [CrossRef]
  25. Takemura, J.; Kondoh, M.; Esaki, T.; Kouda, M.; Kusakabe, O. Centrifuge Model Tests on Double Propped Wall Excavation in Soft Clay. Soils Found. 1999, 39, 75–87. [Google Scholar] [CrossRef] [PubMed] [Green Version]
  26. Fukushima, S.; Tatsuoka, F. Strength and Deformation Characteristics of Saturated Sand at Extremely Low Pressures. Soils Found. 1984, 24, 30–48. [Google Scholar] [CrossRef] [PubMed] [Green Version]
  27. Tatsuoka, F.; Goto, S.; Sakamoto, M. Effects of Some Factors on Strength and Deformation Characteristics of Sand at Low Pressures. Soils Found. 1986, 26, 105–114. [Google Scholar] [CrossRef] [Green Version]
  28. Leblanc, C.; Houlsby, G.T.; Byrne, B.W. Response of Stiff Piles in Sand to Long-Term Cyclic Lateral Loading. Géotechnique 2010, 60, 79–90. [Google Scholar] [CrossRef]
Figure 1. Centrifuge model setup (a) Model 3 (1 g); (b) Model 4 (50 g); Model 8 (50 g); and Model 9 (1 g).
Geotechnics 03 00028 g001
Figure 2. Mechanical properties of model soft rock. (a) Consolidated undrained triaxial test result under different confining stresses. (b) Relationship between secant stiffness (E50) and unconfined compressive strength (UCS) [24].
Geotechnics 03 00028 g002
Figure 3. (a) Top view of a pile socketed in a single soft rock layer (Model 8). (b) A close view of the loading setup (Model 8). (c) Strain gauges attached to the rock surface (Model 9).
Geotechnics 03 00028 g003
Figure 4. Definition of critical parameters used to discuss the test results.
Geotechnics 03 00028 g004
Figure 5. Variation of lateral load with pile top displacement. (a) Model 4 (50 g). (b) Model 8 (50 g).
Geotechnics 03 00028 g005
Figure 6. Bending moment distribution. (a) Model 4 (50 g). (b) Model 8 (50 g).
Geotechnics 03 00028 g006
Figure 7. Variation of applied moment load with measured bending moment [17].
Geotechnics 03 00028 g007
Figure 8. Variation of lateral load with pile top displacement. (a) Model 3 (1 g). (b) Model 9 (1 g).
Geotechnics 03 00028 g008
Figure 9. Observed state of rock ground after 1 g model test (a) SP_SR_80# (b) SP_SR_60# (c) SP_SR_60 (d) SP_SR_40#.
Geotechnics 03 00028 g009
Figure 10. Variation of rock surface strain and lateral loading with normalised pile top displacement.
Geotechnics 03 00028 g010
Figure 11. Comparison between the 1 g model and the 50 g model. (a) Backbone curve. (b) Summary of lateral load variation with rock socketing depth.
Geotechnics 03 00028 g011
Figure 12. Comparison of accumulation of residual displacmeent with imposed displacement between the 1 g model and the 50 g model.
Geotechnics 03 00028 g012
Figure 13. Comparison of system stiffness between the 1 g model and the 50 g model.
Geotechnics 03 00028 g013
Figure 14. Effect of loading height and filling condition.
Geotechnics 03 00028 g014
Table 1. Test conditions and the properties of the model pile.
Model No.AccelerationPile Notation
(Pile No.)
Rock Socketing Depth: dr
[dr/Φ]
Loading Height: HL
[HL/Φ]
Pile Properties
Model 31 gSP-SR-40
SP-SR-60
SP-SR-60-Fill
40 mm [1.0]
60 mm [1.5]
60 mm [1.5]
130 mm [3.25]Φ = 40 mm (2 m)
t = 0.5 mm (25 mm)
EI = 2.34 × 10⁻⁶ GNm2
(14.6 GNm2)
My = 1.54 × 10⁻⁴ MNm
(19.3 MNm)
Mp = 1.99 × 10⁻⁴ MNm
(24.9 MNm)
SP-SR-40-l
SP-SR-60-L
40 mm [1.0]
60 mm [1.5]
80 mm [2.0]
Model 450 gSP_SR_2 *
SP_SR_3
SP_SR_4
40 mm (2) $ [1.0]
60 mm (3) [1.5]
80 mm (4) [2.0]
130 mm [3.25]
Model 850 gSP_SR_2x
SP_SR_3x
SP_SR_4x
40 mm (2) [1.0]
60 mm (3) [1.5]
80 mm (4) [2.0]
130 mm [3.25]
Model 91 gSP_SR_40#
SP_SR_60#
SP_SR_80#
40 mm [1.0]
60 mm [1.5]
80 mm [2.0]
130 mm [3.25]
EI: pile flexural rigidity, My: bend moment causing pile yielding; Mp: bending moment causing pile plastic failure; *: preloaded prior to the test without instrumentation before centrifugation; $: prototype scales under 50 g are given in parentheses.
Disclaimer/Publisher’s Note: The statements, opinions and data contained in all publications are solely those of the individual author(s) and contributor(s) and not of MDPI and/or the editor(s). MDPI and/or the editor(s) disclaim responsibility for any injury to people or property resulting from any ideas, methods, instructions or products referred to in the content.

