Article

Impact of New Combined Treatment Method on the Mechanical Properties and Microstructure of MICP-Improved Sand

1
Department of Soil Mechanics, Foundation Engineering and Environmental Geotechnics, Ruhr-Universität Bochum, Universitätsstr. 150, 44780 Bochum, Germany
2
Department of Urban Water Management and Environmental Engineering, Ruhr-Universität Bochum, Universitätsstr. 150, 44780 Bochum, Germany
*
Author to whom correspondence should be addressed.
Geotechnics 2023, 3(3), 661-685; https://doi.org/10.3390/geotechnics3030036
Submission received: 31 May 2023 / Revised: 7 July 2023 / Accepted: 10 July 2023 / Published: 19 July 2023

Abstract

:
Microbially induced calcite precipitation (MICP) is a green bio-inspired soil solidification technique that depends on the ability of urease-producing bacteria to form calcium carbonate that bonds soil grains and, consequently, improves soil mechanical properties. Meanwhile, different treatment methods have been adopted to tackle the key challenges in achieving effective MICP treatment. This paper proposes the combined method as a new MICP treatment approach, aiming to develop the efficiency of MICP treatment methods and simulate naturally cemented soil. This method combines the premixing, percolation, and submerging MICP methods. The strength outcomes of Portland-cemented and MICP-cemented sand using the percolation and combined methods were compared. For Portland-cemented sand, the UCS values varied from 0.6 MPa to 17.2 MPa, corresponding to cementation levels ranging from 5% to 30%. For MICP-cemented sand, the percolation method yielded UCS values ranging from 0.5 to 0.9 MPa, while the combined method achieved 3.7 MPa. The strength obtained by the combined method is around 3.7 times higher than that of the percolation method. The stiffness of bio-cemented samples varied between 20 and 470 MPa, while for Portland-cemented sand, it ranged from 130 to 1200 MPa. In terms of calcium carbonate distribution, the percolation method exhibited higher concentration at the top of the sample, while the combined method exhibited more precipitation at the top and perimeter, with less concentration in the central bottom region, equivalent to 10% of a half section’s area.

1. Introduction

In the natural environment, the soil matrix undergoes biological, physical, or chemical processes that lead to the formation of natural cementation, resulting in increased soil strength [1,2]. Given the prevalence of naturally cemented soil across the Earth’s crust, research into its mechanical properties is crucial for geotechnical engineering applications. However, because of the natural variability, the costs, and the difficulties associated with sampling, conducting parametric studies on the behavior of naturally cemented soil is challenging. Naturally cemented soil has been previously replicated in the lab using chemical cementation to study its behavior and to fulfill the need of replicating various levels of cementation and relative densities [3]. A realistic way to replicate naturally cemented soil in the lab is microbially induced carbonate precipitation (MICP), which is an emerging technique that combines both economic efficiency and eco-friendly impact to solidify soils. Construction activities contribute to approximately 40% of the emissions of carbon dioxide generated globally each year, which significantly contributes to global warming [4]. Therefore, it is required to develop eco-friendly alternatives as MICP that reduce the carbon footprint associated with engineering projects. One limitation of MICP is ammonia production, as it is a by-product of the process of urea hydrolysis which may contaminate drinking water and affect health if it seeps into groundwater. However, this can be handled by treating the effluent to remove ammonia, such as by using the response surface method (RSM) [5] or using it as a fertilizer for plants [6].
MICP is capable of adapting numerous functionalities in a variety of engineering tasks. MICP has been applied so far to improve the mechanical properties of soil [7], decrease its hydraulic conductivity [8], and increase its thermal conductivity [9]. In addition, it has been used for the stabilization of geotechnical structures. This includes stabilizing slopes [10], tunnel walls [10], dams, and offshore structures [11]. An example of a field-scale application of MICP is the stabilization of a natural gravel area before the upcoming horizontal directional drilling and the installation of a gas pipeline. A volume of 1000 m 3 of gravel treated for 7 days showed improved stability during drilling, confirming treatment effectiveness [12]. Another example is the stabilization of a retaining wall beneath a motorway bridge located in France. Due to access restrictions beneath the bridge and the prohibition of transportation interruption, it was difficult to implement conventional techniques. Thus, the application of MICP treatment was the optimal solution for this project [12].
MICP is a biologically mediated method that can induce the cementation process, link soil particles together through the formation of calcium carbonate minerals, and ultimately improve the engineering properties of soil. The driving force behind the precipitation phenomena is the presence of urease-producing bacteria such as Sporosarcina pasteurii, which consume urea as an energy source and form calcium carbonate minerals in a calcium-rich environment. Urea hydrolysis is the mechanism through which urease-producing bacteria form calcium carbonate. Urea is hydrolyzed by urease due to its catalytic effect, resulting in the formation of ammonia and carbonate. The core mechanism of precipitation by urease-producing bacteria can be written as
C O ( NH 2 ) 2 + 2 H 2 O 2 NH 3 + H 2 CO 3
NH 3 + H 2 O NH 4 + + OH
H 2 CO 3 HCO 3 + H + CO 3 2 + 2 H +
Ca 2 + + CO 3 2 CaCO 3
MICP involves five stages to produce inorganic calcium carbonate minerals: (1) urease enzyme is synthesized by bacteria, (2) urea spreads into the bacterial cell, (3) urea ( CO ( NH 2 ) 2 ) is hydrolyzed, resulting in the formation of ammonia ( NH 3 ) and bicarbonate anions ( HCO 3 ) (Equations (1) and (3)), (4) hydroxide ions ( OH ) are formed due to the equilibrium reaction between ammonia and water (Equation (2)), (5) pH on the bacteria surface increases due to the formation of hydroxide ions, (6) calcium carbonate ( CaCO 3 ) precipitates upon the supply of calcium ions ( Ca 2 + ) on the surface of the bacterial cell (Equation (4)).
The key outputs that characterize MICP treatment are the attained strength and distribution of precipitates. However, MICP is a complex procedure governed by several factors and is applied by different treatment methods. Therefore, a deeper understanding of the key factors which lead to effective MICP outcomes is of vital importance. To tackle this issue, different modifications to the treatment methodology were applied, and these can be categorized into two groups: (1) chemical or physical modification, and (2) procedure modification. As regards the chemical or physical modification, Xu et al. [13] added magnesium ions to delay calcite precipitation and observed that the addition of 0.5 M magnesium ions to the feeding solution doubled soil strength. In contrast, Abdel Gawwad et al. [14] concluded that increasing the concentration of MgCl 2 had a detrimental impact on the strength of the produced bio-mortar. Recently, the issue of homogeneity of calcium carbonate distribution was addressed by one phase injection of a low-pH solution [15]. This method can avoid the soil clogging phenomena by improving the solution distribution and postponing calcite formation, thus reaching a UCS level of 2.5 MPa [16]. However, this procedure has to be tested on a larger scale (a meter scale) and examined for other species of ureolytic bacteria than Bacillus sp. Another method to improve soil homogeneity was applied by Xiao et al. [17], who adjusted the temperature of the cementation solution to 4 °C. In this way, the formation of calcite is delayed by the low temperature, allowing for properly spreading the solution between soil particles. However, this approach requires temperature control equipment, which may limit its usage in field applications. An example of the procedure modification is the premixing method. The bacteria premixing method offers a solution to the problem of random uneven bacterial distribution, resulting from either injecting or percolating bacteria. For example, Yasuhara et al. [18] premixed urease enzyme with Toyoura sand and the samples exhibited a relatively homogeneous state, indicating UCS values of 400 kPa to 1.6 MPa. Nevertheless, the premixing method did not provide as high UCS values as the other treatment procedures [19]. Additionally, Centeno Dias et al. [20] pointed out that the injection through a perforated tube inserted at the center of the sample can improve soil homogeneity and enhance its mechanical properties. However, instability was induced by the effect of the inserted tube along with the case of premixing bacteria with soil, resulting in a low UCS value (60 kPa). Moreover, Terzis et al. [21] emphasized that direct electric currents can modify the electro-chemical conditions, causing electro-migration of bacteria as well as dissolved solutes in soil voids. This can enhance the spatial distribution of bio-cementation bonding, especially when using calcium acetate and calcium lactate as calcium sources. Nevertheless, the usage of the inexpensive calcium source, calcium chloride, had a negative effect. The soaking or submerging method was established by Zhao et al. [22] as an improved strategy for supplying reactants to soil, resulting in the enhanced transport of reactants, but the exact distribution of the precipitate along the sample height was not analyzed and the maximum UCS obtained by this method was 2.2 MPa. Wen et al. [23] developed the submerging method by repeating the treatment in multiple cycles of submerging in the cementation solution. UCS values after four cycles of treatment increased by 5.7 times the strength of one cycle. However, higher soil strength enhancement may be achieved by modifying this method.
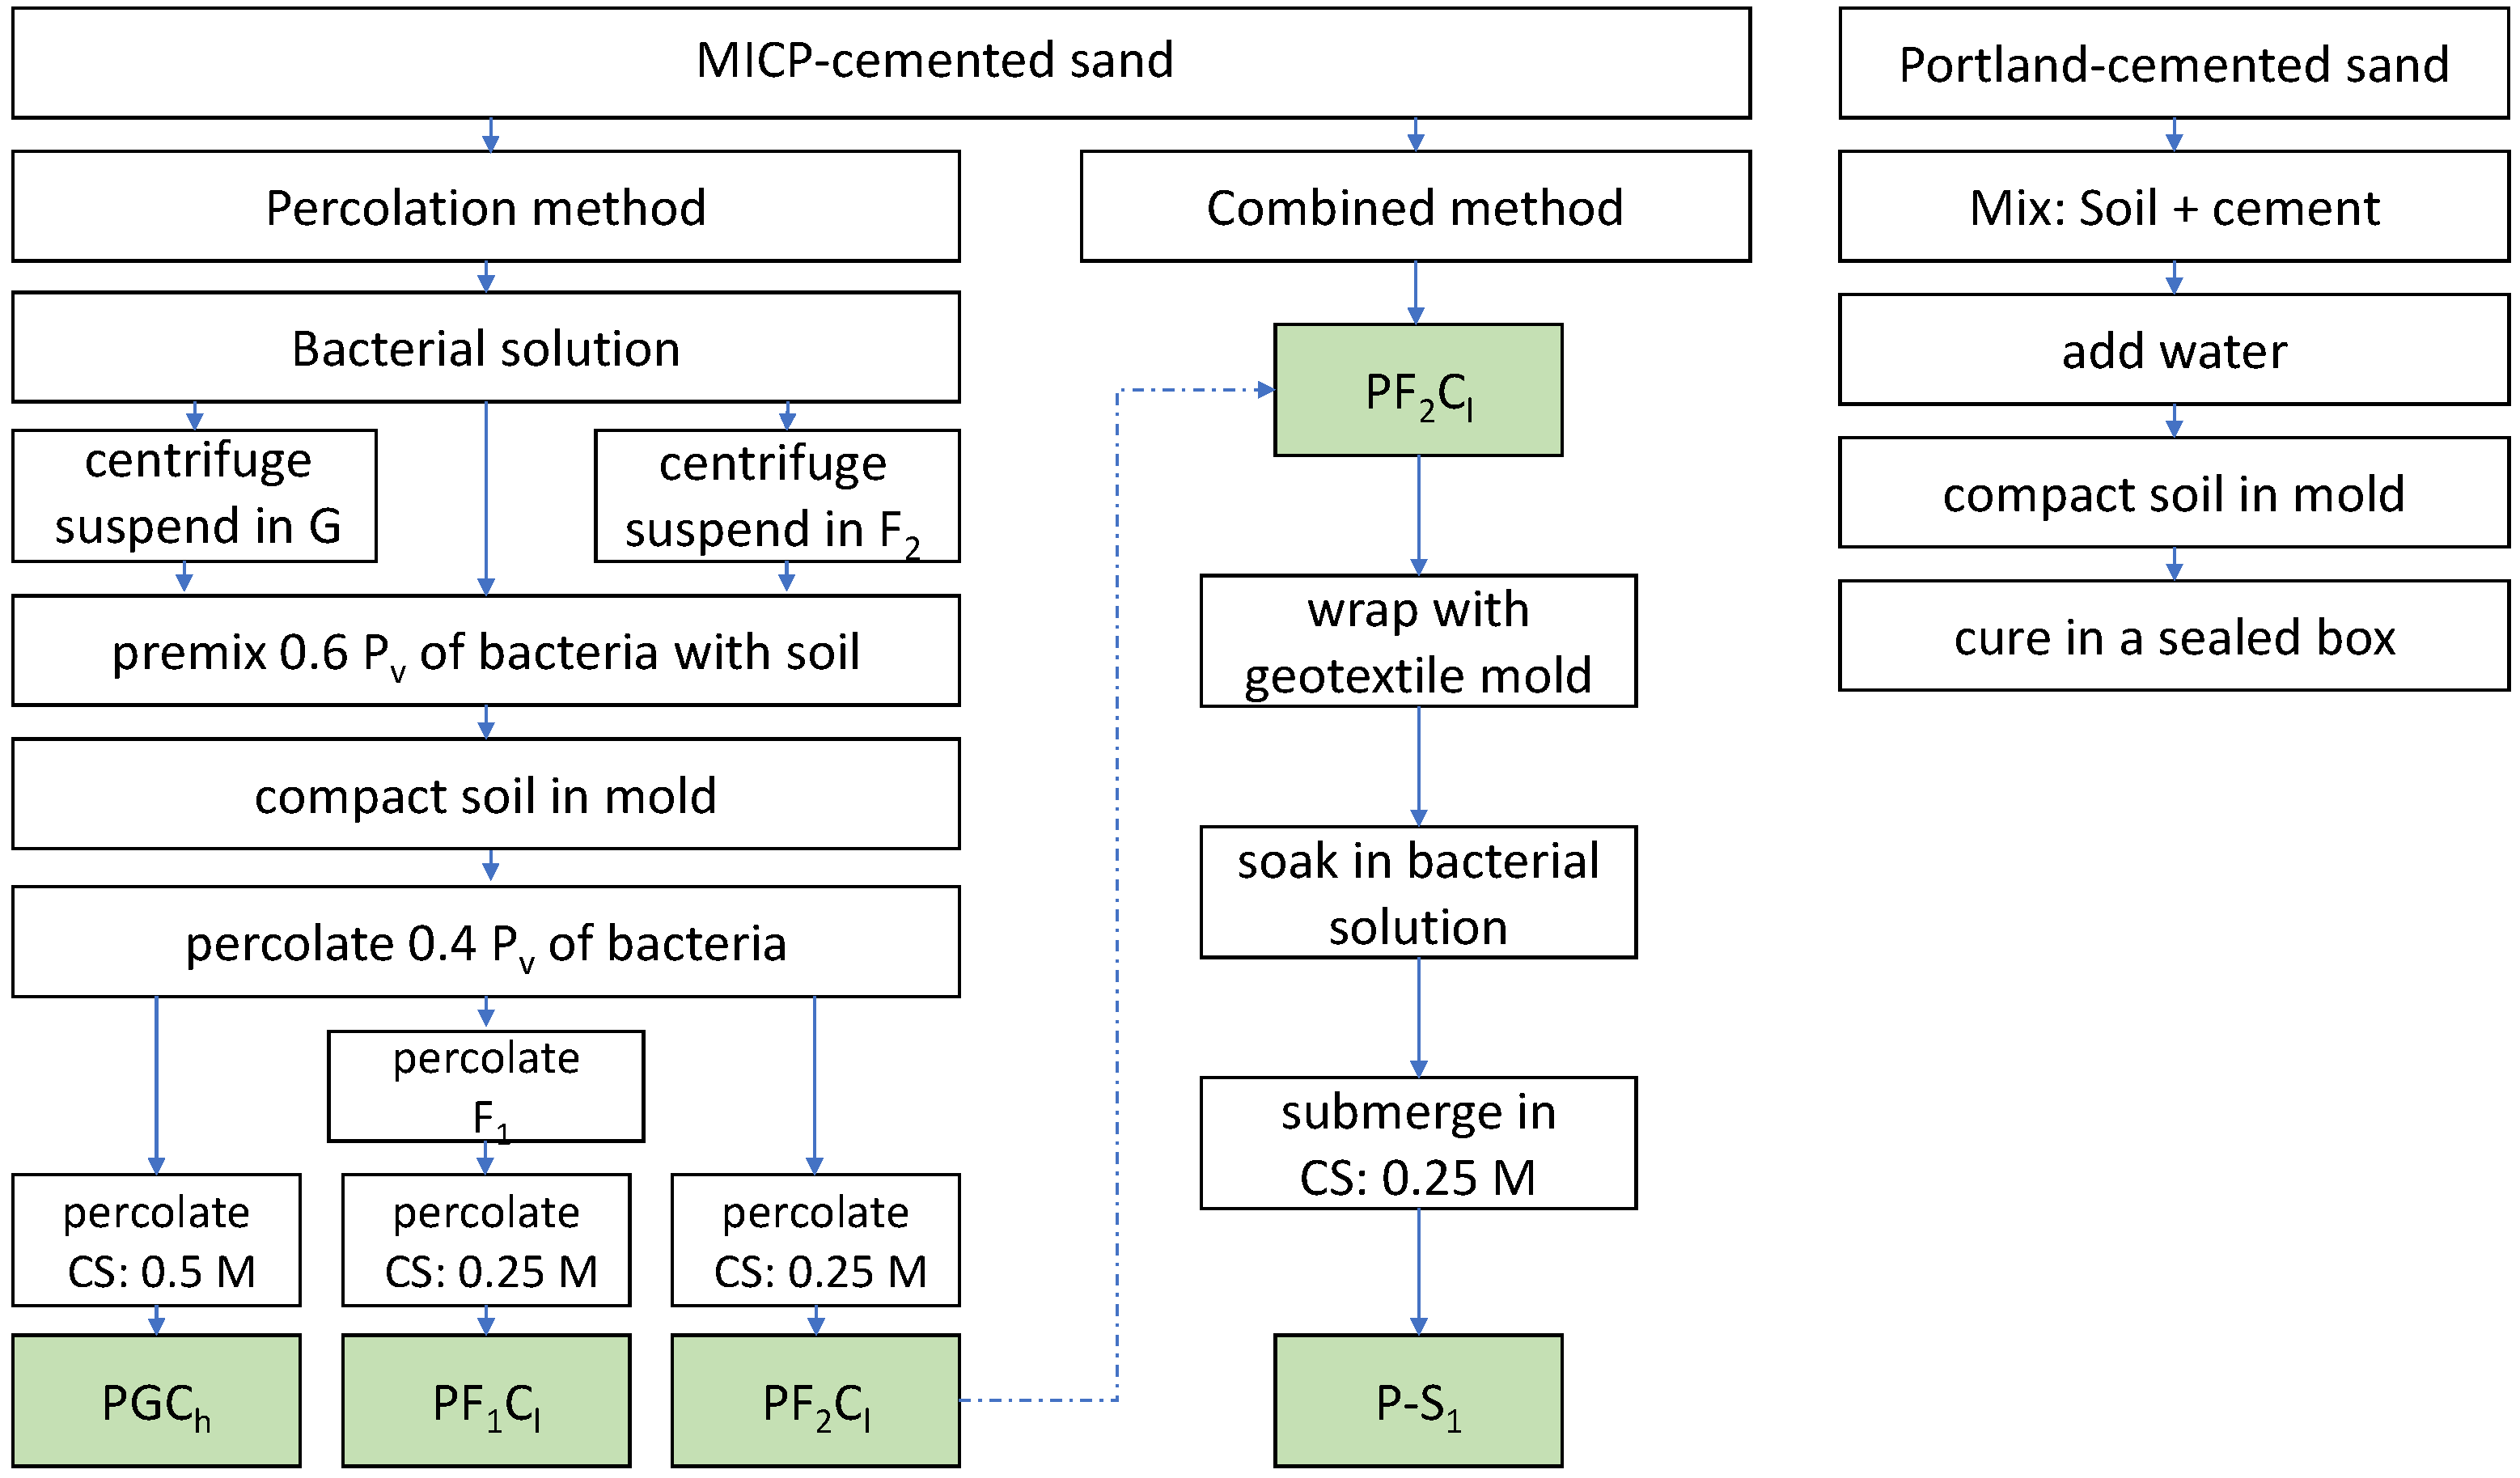
The objective of this paper is to introduce a new MICP treatment approach, the combined method, aimed at enhancing the strength outcome and the homogeneity of the distribution of calcium carbonate, in the context of utilizing this approach to produce artificial sandstones for soil testing. The combined method combines premixing, percolation, and submerging methods, taking advantage of the uniformity of bacteria distribution by the premixing method, the simplicity of the percolation method, and the enhanced transportation of nutrients by the submerging method. To verify the effectiveness of the new combined method, a comparison between the percolation and the combined methods has been performed. Different strategies for the promotion of bacterial growth have been tested for the percolation method. UCS testing has been conducted to evaluate the strength and to investigate the failure mode. The acid washing method has been used to check the distribution of calcium carbonate. SEM analysis has been applied to study the morphology of the calcium carbonate. A comparison has been made between the bio-cemented samples and sand samples that had been treated with Portland cement.

2. Materials and Methods

2.1. Soil

Tests have been conducted on Karlsruhe fine sand; these tests have been widely used to study and simulate its behavior under monotonic [24], cyclic, and combined loading [25]. This soil has a mean grain size d 50 = 0.14 mm, a uniformity coefficient C u = d 60 / d 10 = 1.5, a specific weight G s = 2.65, a sub-angular grain shape, and maximum and minimum void ratios ( e m a x and e m i n ) of 1.054 and 0.677, respectively, which were determined using DIN 18126 standard tests at zero mean pressure (p = 0). Figure 1 shows the grain size distribution curve for Karlsruhe fine sand. Before testing, sand was oven-dried at 105 °C for 24 h without any sterilization procedure.

2.2. Bacteria and Feeding Solution

Sporosarcina pasteurii (DSM 33) were obtained from Leibniz Institute DSMZ-German Collection of Microorganisms and Cell Cultures. The bacteria were inoculated in a nutrient growth medium containing the ingredients based on DSMZ instructions; these are presented in Table 1. The final pH was adjusted using NaOH to 9. Afterwards, bacteria were aerobically cultivated for 24 h in a shaking incubator at 30 °C and 130 rpm. Because Sporosarcina pasteurii is an aerobic species, the bacterial solution flask used for shaking was no more than half full. After that, bacteria were harvested. The seed culture was further inoculated in a fresh growth medium and cultivated under similar conditions of the seed culture for 5 to 6 h. Finally, the bacterial solution was stored at 4 °C in the refrigerator for a maximum of two weeks. The life circle of Sporsarcina pastuerii consists of four phases, namely the lag, log, stationary, and death phases, as shown in Figure 2. OD is the optical density of the biomass measured with a photometer at a specific wavelength. The lag phase indicates the bacteria adaption to the new environment after the inoculation in a fresh growth medium. Afterwards, bacteria use the nutrients provided with the nutrient solution and grow in the log phase (exponential phase). In the next phase, the curve peaks, reaching a steady growth stage. Afterwards, the death phase starts because of several reasons, such as the unfavorable environment due to the formation of toxic products and the lack of nutrients [26]. The bacterial cells for Sporsarcina pastuerii are usually grown to reach the log phase. The measurement of optical density at wavelength 600, OD 600 , is commonly used in the literature. However, the photometer in our geotechnical lab is limited to OD 620 and OD 585 . Therefore, the optical density at different wavelengths ( OD 585 , OD 600 , OD 620 ) was compared at the lab of the department of water management and environmental engineering, as presented in Figure 3. The results show that the optical density at various wavelengths is nearly identical. Therefore, a bacterial solution with an optical density OD 620 in the late exponential phase was further used for the bio-cementation, because of the excellent enzymatic activity in this phase. The cementation solution which provides bacteria with nutrition is prepared according to the ingredients shown in Table 2. The cementation solution has equimolar concentrations of urea and calcium chloride and is prepared at low and high concentrations of 0.25 M and 0.5 M, respectively.

2.3. Sample Preparation and Experimental Setup

For preparing MICP-cemented samples, soil was compacted in plastic syringes with a capacity of 100 mL. The sample dimensions were 8 cm in height and 3.6 cm in diameter. All samples were prepared at a relative density of 60% and 1.45 g/c m 3 dry density. To achieve this density, soil was divided into 8 layers with a predetermined weight for each layer. Moist tamping was adopted to compact the soil into the mold. To prevent the loss of soil during the injection of the cementation solution, the column was covered by a gravel layer of 1 cm height enclosed between two filter papers at both ends, as sketched in Figure 4. For preparing Portland-cemented samples, soil was compacted in split molds with 7 cm height and 3.5 cm diameter. The weight of sand was maintained to reach the same dry density used for bio-cemented samples (1.45 g/cm 3 ).

2.4. Artificial Cementation

Different degrees of cementation were obtained by adding a proportion of Portland cement (CEM II/A-LL 42.5 N) corresponding to 5%, 10%, 15%, 20%, and 30% of the sand weight, mixed with water corresponding to 13% of soil weight. The soil weight was kept constant for all samples to reach an initial relative density of 60%, similar to the MICP-cemented sand samples. The mixture of soil, cement, and water was then compacted into the split mold, using the under-compaction method. Samples were sealed in a plastic box and cured for more than 28 days at ambient temperature.

2.5. MICP Treatment

2.5.1. Percolation Method

The premixing method was used to introduce the bacteria into the soil. In this method, the soil is mixed with the bacteria solution before the sample is prepared by moist tamping. Bacteria at 0.6 of the pore volume were premixed with soil, whereas 0.4 of the pore volume were percolated. The ratio of 0.6:0.4 was chosen in light of a study conducted by Cui et al. [27]. The soil was kept at rest for 8 h after introducing bacteria to allow the fixation and transportation of the bacteria. This rest time is vital to enable bacteria to adhere to soil grains and to prevent the possibility of flushing bacteria with the effluent out of the sample. Then, the cementation solution was aerated and percolated at 1.2 pV through the sand driven by gravity. The volume of the fresh medium exceeded one pore volume to ensure the complete saturation with new reactants [28]. The injection of the cementation solution was performed every 12 h for the 10-day duration of the treatment. The outlet tube has to be fixed to the top at the retention time to ensure saturation and allow the chemical reaction to occur. At the injection time, the outlet tube was set to allow the collection of the effluent. A schematic representation of the percolation method is shown in Figure 4a.
In total, three samples were prepared using the percolation method (named P). Different investigations were undertaken to facilitate the growth of bacteria using loading solutions (named F 1 , F 2 ) or the growth medium (named G). The ingredients of the loading solutions are presented in Table 3. The effect of both low and high concentrations of the cementation solution was studied (named C l and C h ). The experimental protocol for samples using the percolation method is explained here.
  • Sample PF 1 C l : One pore volume of a loading solution F 1 was percolated directly after the bacteria introduction phase. F 1 contains urea, which provides bacteria with an energy source to grow and allows hydrolysis to occur before calcium carbonate precipitation upon introducing calcium ions [28]. A low concentration of 0.25 M was used for the cementation solution.
  • Sample PF 2 C l : The vegetative bacterial cells were separated from the growing medium where nutrients were consumed by centrifuging the bacterial solution twice at 4500× g for 20 min. After each centrifuging cycle, the supernatant was wasted while cells were resuspended in a loading solution F 2 , which contains calcium chloride, which fixes the bacterial cells via promoting the adsorption of microorganisms on sand grains [28]. Feeding was carried out using a low concentration, 0.25 M, of the cementation solution.
  • Sample PGC h : Bacteria were centrifuged with the same protocol explained previously but they were resuspended in the growth medium. Feeding was carried out using a high concentration, 0.5 M, of the cementation solution.

2.5.2. Combined Method

In this method, samples obtained by the same percolation method explained for sample PF 2 C l were subjected to the submerging method first developed by Zhao et al. [22]. Specimens were wrapped with a flexible geotextile mold and soaked with the bacterial solution for a few minutes. The syringe and geotextile molds are shown in Figure 5. Then samples were submerged for 1 week in a box containing the cementation solution at low concentration (0.25 M). The box is provided with a mixer to preserve the solution uniformity and aeration, as shown in Figure 4b. The cementation solution can freely penetrate the mold and initiate MICP between soil particles due to the permeability of the mold. It is believed that the submerging method enhances the transport of the reactants. A major advantage of this procedure is that samples are subjected to treatment from all directions, i.e., 3D supply of reactants in contrast to other methods where the treatment direction is limited to a single direction, i.e., 1D supply of reactants, from top to bottom or bottom to top. The single cycle consists of soaking the sample in fresh bacteria medium and submerging it in new fresh cementation solution for 1 week. The submerging method is termed S and the obtained sample is named P-S 1 . A summary of the samples from both methods is presented in Table 4. Figure 6 illustrates the experimental procedure for the bio-cemented samples and Portland-cemented samples by means of a flow chart.

2.6. Mechanical Behavior

The mechanical behavior of the prepared samples was studied using Unconfined Compression Strength (UCS) tests. The UCS test is applied to determine the ultimate axial compression stress which a specimen can bear with the absence of confinement. It is one of the most common tests to determine the mechanical properties and characterize the strength of bio-treated soil samples because this test can easily give an instant overview of the strength of a large number of tested samples. Before the UCS test, samples were oven-dried at 60 °C for four days. Axial loading velocity was chosen as 1 mm/min. The peak value of axial stress observed was supposed to indicate the strength (q u ). Tangent stiffness or Young’s Modulus ( E f ) was calculated by the ratio between the peak strength (q u ) and the corresponding strain at failure ( ε f ). For bio-cemented samples, the gravel filter layers were removed using a saw and the surface was flattened using sandpaper. Due to slightly changing the height of the sample by this process, a correction factor converting the strength measured for the actual height to diameter ratio H / D to that of a 2:1 sample based on the ASTM D2938-86 standard test method [29] was applied, according to the following equation:
C = C a 0.88 + ( 0.24 D / H )
where C is the corrected strength of an equivalent H / D = 2 specimen, C a is the measured strength, D is the specimen diameter, and H is the height.

2.7. Calcium Carbonate Content

Calcium carbonate content was determined by the acid washing method [30]. After UCS investigations, portions of the sample were taken from different levels (i.e., top, middle, and bottom) from the lateral and central positions. Soil was oven dried at 105 °C for 24 h before being weighed. Then, HCl was added to dissolve calcium carbonate with a continuous shaking of the mixture to facilitate the reaction. Adding HCl was stopped when no bubbles were generated in the mixture anymore. Finally, the samples were washed with distilled water and filtered using filter paper. The residual was then oven dried at 105 °C for 24 h before being weighed. The weight of the carbonate contained in the original sample is represented by the difference between the original and final weights.

2.8. Microstructural Analysis

To analyze the microstructure of the bonding produced by Sporsarcina pastuerii, Scanning Electron Microscopy (SEM) was performed using the device HR-FESEM Zeiss Merlin Gemini II, manufactured by Zeiss at Oberkochen, Germany. After the mechanical analysis, small soil pieces from the sample were placed on aluminium stubs utilizing carbon tabs and sputtered by coating them with a 20 nm layer of gold.

3. Results

3.1. Uniaxial Compression Strength (UCS)

Figure 7 compares the results of the UCS tests for the samples produced by both the percolation method as well as the combined method. In the case of the percolation method enhanced with different concentrations of the cementation solution and different techniques for bacterial growth, the results indicate that the highest UCS reached was about 1 MPa for both PF 1 C l and PF 2 C l samples, as presented in Figure 7a. By contrast, the lowest UCS using the percolation method was found for the sample PGC h , amounting only 0.5 MPa. In other words, when using a higher concentration of the cementation solution, lower strength was obtained. The results for the sample PF 2 C l revealed the least fluctuations in the stress–strain curve and a high UCS as compared to the other samples produced by the percolation method. A pre-peak was observed in the stress–strain curve for the sample PF 1 C l at a strain of almost 1%. After that, the curve presented softening followed by hardening until it reached the failure point at a strain of 4%. For the sample PGC h , several oscillations in axial stress (zigzag shape) were noticed. As far as the strain at failure is concerned, it can be seen that sample PF 1 C l yielded the highest failure strain, followed by sample PF 2 C l and sample PGC h , at 4%, 2.6%, and 2.4%, respectively.
In terms of the results of the combined method, which are presented in Figure 7b, the sample yielded higher UCS than those prepared by the percolation method. The maximum stress reached was 3.7 MPa for the sample P-S 1 , which was subjected to submerging after the percolation process. The stress–strain curve for the combined method had no oscillations before failure, whereas the strain at failure was 0.8%. Considering these results, there are several important differences between the percolation and the combined method. The strength obtained by the combined method is about 3.7 times higher than the strength obtained by the percolation method, with an increment of around 2.7 MPa caused by a single submerging treatment cycle. Secondly, lower values of strain at failure for the combined method were observed than for the percolation method. The lower strain at failure in the combination with the significantly higher peak strength for the combined method indicates a remarkably higher stiffness of the treated sand. Another difference is that the stress–strain curve using the percolation method showed oscillations in the stress before the failure point, which was not the case for the combined method.
UCS results for Portland-cemented samples with different levels of cementation between 5% and 30% are shown in Figure 8. The specified proportion of Portland cement has been chosen to obtain a broad range of cementation levels and to be compared with the results of bio-cementation. As was expected, strength increased with the increase in cement content, reaching a maximum UCS of 17.2 MPa for a cement content of 30%. On the other hand, the minimum UCS was 0.6 MPa for 5% cement content. The UCS results for Portland-cemented sand at a degree of cementation of 10%, 15%, 20%, and 25% were measured as 1.6 MPa, 4.4 MPa, 7.7 MPa, and 12.8 MPa, respectively. Portland-cemented sand experienced no oscillations in the stress–strain curve before failure took place.

3.2. Failure Mode and Stiffness

Photos of the bio-cemented samples after failure are presented in Figure 9. The failure took place mainly at the lower part of the samples. The failure of samples PF 1 C l and PF 2 C l concentrated in the lower quarter of the sample, which is thought to be because of the reduced carbonate content in this region. Soil has crushed in this position, while the failure plane is a horizontal zigzag-like shearing plane. For sample PGC h , the failure extended to a larger area than for PF 1 C l and PF 2 C l samples and reached the lower one-third of the sample. The failure mode is characterized by multiple fractures. For the case of the combined method, multiple fractures were observed in the bottom part of the sample.
Concerning the Portland-cemented specimens, the failure mode is presented in Figure 10. For a degree of cementation of 5%, the failure mode was characterized by shearing, whereas a y-shape failure pattern was dominant pattern for cement contents ranging from 10% to 25%. The exact failure surface for the sample with a 30% level of cementation could not be detected, as it broke and scattered into smaller pieces during loading.
Table 5 gives an overview of Young’s modulus of the bio-cemented samples. For the percolation method, the highest stiffness measured at 35 MPa corresponds to the sample which had less pronounced oscillations in the stress–strain curve. The lowest stiffness was 18 MPa for sample PGC h . Although samples PF 1 C l and PF 2 C l have a comparable maximum stress, sample PF 2 C l has higher stiffness than sample PF 1 C l , measured at 35 MPa and 23 MPa, respectively. For the combined method, stiffness exhibits a significant increase and reaches 467 MPa. This means it is 13.3 times higher than the stiffness resulting from the percolation method. With regard to the stiffness of Portland-cemented samples, the results are elaborated in Table 6. It was observed that stiffness increased from 128 MPa to 1161 MPa with the increase in cement content from 5% to 30%. This means that increasing the cementation degree by six-fold resulted in increasing the stiffness by nine-fold.

3.3. Calcium Carbonate Distribution

The results from the acid washing method are presented in Figure 11. Overall, calcium carbonate content for all samples varied between around 14% and 35%. For samples produced by the percolation method, the amount of carbonate formation was higher at the top of the specimens with a decreasing trend along the direction to the bottom. The average calcium carbonate content revealed to be 20%, 16%, and 23% for samples PF 1 C l , PF 2 C l , and PGC h , respectively. The best homogeneity was obtained for specimen PF 2 C l , where a fixation solution and low concentration of the feeding solution were used. The maximum difference along the height of this sample was about 4%. Vice versa, the largest heterogeneity was observed for sample PGC h , where a high concentration of the cementation solution was percolated.
Interestingly, the maximum precipitation amounts were observed for the specimen which reached the lowest strength among all samples. This indicates that effective bonding between soil grains, as well as the homogeneity of the calcium carbonate distribution, are more important than the percentage of the carbonate precipitation. For the case of PF 1 C l , where the loading solution containing urea was percolated, the maximum difference along the sample height was less than 8%. Although sample PF 1 C l had higher calcium carbonate content than sample PF 2 C l , a comparable UCS strength was obtained for both samples.
In case of the combined method, the overall calcium carbonate content in sample P-S 1 revealed to be 26%. CaCO 3 content was more concentrated at the top of the sample and along the sample perimeter. Less concentration was observed in the center region of the bottom of the sample, equivalent to 10% of a half section’s area, which can be explained by the preferable flow path of the cementation solution generated by gravity.

3.4. Correlation between Calcium Carbonate Content and UCS

Figure 12 shows the correlation between UCS and the cementation degree for Portland- as well as bio-cemented sand. When compared to bio-cementation, Portland cemented samples showed consistently higher UCS values for similar degrees of cementation. The graph shows a continuous rise in strength for Portland-cemented sand with the increase in the degree of cementation. For bio-cemented sand, however, the strength remained more or less stable followed by a remarkable increase after calcium carbonate exceeded 23%, where the combined method has been applied. The relationship between the level of cementation and strength for bio-cemented sand indicates that the strength is not necessarily positively correlated with the level of cementation. An inhomogeneous distribution of calcium carbonate content can result in localized failure, thereby diminishing the reinforcing effectiveness of MICP [31].

3.5. SEM Observations

The morphology of calcium carbonate crystals was analyzed using SEM. For sample PF 1 C l , the results of SEM scanning are presented in Figure 13. It can be seen that there are plenty of small rhombohedral (cubic-like) crystals scattered on the surface of the sand grain, having dimensions less than 10 μ m, in the range from 4 to 9 μ m. Another finding was that multiple holes are present on the surface of the rhombohedral crystal, as shown in Figure 13c. For sample PF 2 C l , SEM micrographs are shown in Figure 14. Most of the precipitation was located at contact points between sand grains, as shown in Figure 14a,c. The shape of crystals is rhombohedral, with a range of dimensions between 7 and 20 μ m. These crystals were located either isolated or in groups, as shown in Figure 14b,d. With regard to sample PGC h , produced by the percolation method, SEM micrographs are shown in Figure 15. The shape of calcium carbonate crystals was rhombohedral with a particle size of 24 μ m. The rhombohedral crystals were also accumulated in blocks, forming a flower-like shape, with dimensions of the accumulated group ranging between 23 μ m and 36 μ m, as shown in Figure 15b. It was observed that the rhombohedral crystals were interconnected with each other along the surface of the sand particles, forming a series that reached a length of about 170 μ m, as shown in Figure 15c. A thin layer with a thickness of 3 μ m was noticed just under this series, as shown in Figure 15d. SEM images of the bio-cemented sample using the combined method ( P-S 1 ) are shown in Figure 16. From Figure 16a, it can be seen that calcium carbonate precipitation occurred in three different locations, coating sand particles, filling the pore space, and at contact points between sand grains. Regarding the shape of calcite crystals, three shapes were detected for this sample. One of these shapes was rhombohedral, with a particle size of about 15.5 μ m, as shown in Figure 16b. Another observed shape is a flower-like shape composed of an agglomeration of angular plates, with a particle size of approximately 13 μ m; see Figure 16b. We also observed a series of overlapping spherical shapes that formed large clusters of calcium carbonate, with the length of the series exceeding 74 μ m, as presented in Figure 16c. The single crystal in this series had a diameter of about 11 μ m and contained a small hole on its surface.

4. Discussion

4.1. MICP Treatment

The MICP treatment method has a great impact on UCS strength, calcium carbonate distribution, and morphology. The present study showed a high precipitation of calcium carbonate is caused by using the percolation method with a high concentration of the cementation solution. This could be related to the higher bacteria activity which is promoted at the top of the sample upon the introduction of the cementation solution, which causes immediate precipitation near the inlet. This finding is in accordance with observations reported by [32], who used the percolation method. They reported a higher cementation concentration in the upper part of the column, leading to significant strength increase within 65% of the sample height from the inlet point. However, the strength gradually decreased with depth. In addition, the SEM results in the current study indicate that a high concentration of the cementation solution resulted not only in larger sizes of calcite crystals but also longer length of the accumulated series of calcite crystals when compared to a low concentration. A similar conclusion was reached by [33], who reported that the precipitation tends to occur on the already existing crystals rather than forming new ones, resulting in forming bigger CaCO 3 crystals as compared to the size of crystals formed at a low concentration. In terms of the effect of the feeding solution on strength, lower strength was measured when a higher concentration of cementation solution was used. This is consistent with the results of Lai et al. [34], who drew the conclusion that the strength achieved by using a low concentration of the cementation solution was higher than the strength obtained by using a high concentration. This can be explained by the immediate calcium carbonate precipitation near the inlet, which becomes stronger when using a high concentration of the cementation solution and causes a heterogeneous distribution of calcium carbonate along the sample height.
In terms of the multiple strategies used for the bacterial solution, SEM images showed that when percolating urea-containing solution upon the introduction of the bacterial solution to the soil, a higher number of small-sized calcium carbonate crystals was observed when compared to other strategies. The high degree of precipitation could be related to the effect of urea, which can increase the nucleation sites. The activity of urease influences the pore-scale characteristics and the morphology of precipitated calcium carbonate. According to [35], higher urease activity leads to faster precipitation and a more uniform distribution of CaCO 3 . Lai et al. [34] noted that in the case of repeated injections of the cementation solution without introducing a new amount of urea, the newly formed crystals tend to precipitate onto the existing spherical crystals. This implies that urea is responsible for the high number of precipitations in sample PF 1 C l due to the higher number of nucleation sites promoted by urea. In the stress–strain behavior for this sample, pre-peak softening and hardening were detected before failure. This can be related to the effect of bonding breakage. The influence of bacterial activity on the mechanical properties of bio-cemented samples is complex and difficult to determine. Conflicting results have been reported in the literature, making it challenging to draw definitive conclusions [36]. Higher bacterial activity can promote the formation of more nucleation sites with smaller crystals, while sufficient reagents can increase urease activity, leading to higher supersaturation levels and larger crystal growth. Different supersaturation levels can result in varying crystal polymorphs, impacting the strength performance of the soil. Due to the interplay of multiple factors, accurately predicting the effects of bacterial activity on soil behavior remains challenging. Hence, conducting preliminary investigations is crucial for MICP-based soil strengthening applications to gather case-specific information and enhance control. With regards to suspending bacteria in a fixation solution, fewer oscillations in the stress–strain curve were observed. A reason for this behavior is maybe because of the effect of suspending bacterial cells in the fixation solution, which may promote bacterial flocculation and enhance bacterial retention by attaching bacterial cells to the sand grains. A similar conclusion was reached by Chu et al. [37], who indicated that centrifuging the culture liquid and re-suspending it in fixation solution resulted in a 1.7-fold higher UCS than the sample treated with the intact cell (culture liquid). Another reason could be the use of a low concentration of the cementation solution for this sample. In this regard, Lai et al. [34] concluded that the calcium conversion efficiency decreases as the concentration of the urea-calcium solution increases. Regarding re-suspending the bacterial cells in the growth medium, there was not a high number of coating precipitates, as was observed for the case when percolating the F1 solution. However, a long series of connected particles with large particle sizes was detected.
In the percolation method, calcium carbonate precipitation was lower at the bottom part. Calcium carbonate crystals could cause clogging in the pore space at the upper part of the sample and hamper the transport of the reactants to deeper parts of the sample. This result agrees well with previous studies. For example, the surface percolation approach was used by [38] to create four testing models with two cementation degrees. The results of the tests revealed that the strength of the bio-treated sandy road bases rose and subsequently dropped as soil depth increased, owing to clogging in the top layer. In the newly developed combined method, precipitation occurred deeper, especially at the periphery of the sample. To improve the homogeneity by the combined method, it could be possible to reverse the direction of the sample during the immersing phase inside the box containing the urea-calcium chloride solution. With respect to strength, the combined process yields 3.7 times higher strength than that of the percolation method, resulting in an increment of around 2.7 MPa for a single treatment cycle. It is thought that the submerging can be repeated to reach higher strength by applying more cycles. When comparing the results of the current study to those of Wen et al. [23] applying the submerging method, it must be pointed out that a lower strength improvement was reported in that previous study. Wen et al. [23] used the submerging method in a 0.25 M feeding solution employing one, two, three, and four cycles within four weeks, leading to UCS values of 600 kPa, 1600 kPa, 2700 kPa, and 4000 kPa, corresponding to an approximate rate of improvement of around 1000 kPa per single cycle. The mean grain size of the sand used in [23] was d 50 = 0.47 mm. This result highlights the efficiency of the combined method in reaching higher strength within a shorter time frame than the submerging method. In the submerging method, sand is mixed with bacteria and air pluviated into a flexible mold made of geotextile, ensuring full contact. The treatment begins by submerging the sample in a box containing a cementation solution, which is circulated by a mixer and an air pump [23]. The combined method differs in terms of treatment initiation. In the combined method, the process of precipitation begins by allowing the cementation solution to percolate through the sample before submerging it. Subsequently, the treatment continues as the sample remains submerged in the cementation solution. The strength of MICP-cemented soil is significantly influenced by the treatment method. The differences in strength outcomes between the submerging and combined methods may be attributed to the difference in the initiation of calcite precipitation, particularly through the previous use of the percolation method, allowing for improved calcium carbonate distribution.
According to the results of this study, the combined method is one new solution for the challenges associated with effective MICP treatment. This is because it gives higher strength than the percolation and the premixing methods. It consumes less time than the submerging method to reach high strength. Moreover, it overcomes the problem of clogging near the inlet and the impeded flow, which is mainly generated by the injection and percolation methods. This is because of the three-dimensional supply of reactants.
The treatment time required to increase the soil strength through MICP is affected by different factors, such as the number of injections, the concentration of the cementation solution, the retention time, the curing time, and the effect of clogging. As the number of injections is increased over the course of treatment, higher strength is achieved. However, there is a correlation between the strength, the concentration of cementation solution, and the retention time, which is the rest gap between two consecutive cementation solution injections. Retention time is positively correlated with the concentration of the feeding solution; thus, different concentrations of the cementation solution that are proportional to the retention time correspond to identical bio-cementation efficiency [33]. It should be noted that in the percolation or the injection methods, there is a potential for clogging to occur, which can impede the flow of the cementation solution. Consequently, this may impose a time limitation, resulting in a treatment limitation. Moreover, the efficiency of the submerging method can also be limited by time. Zhao et al. [22] studied the effect of curing time on the UCS of MICP-cemented sand through the submerging method. The results showed that UCS values were 0.56, 0.98, and 1.36 MPa for 3, 5, and 7 days of curing time, respectively. The increase in UCS was more significant between 3 and 5 days compared to the increase between 5 and 7 days. One possible explanation for this observation is that after 5 days, the bacteria became surrounded by calcite crystals, leading to a decrease in enzyme activity.

4.2. Portland-Cemented Sand versus Bio-Cemented Sand

Based on UCS results, it can be concluded that the strength of Portland-cemented specimens is higher than that of bio-cemented samples at the same level of cementation. In contrast, Mujah et al. [39] observed that bio-cemented sand had higher strength than ordinary Portland-cemented sand cured for 28 days. Moreover, Cheng et al. [40] also compared the strength of sand specimens treated with either Portland cement or with MICP. The outcomes of the study revealed that the bio-cemented sand exhibited higher strength than Portland-cemented sand cured for 7 days only at a cementation level below 10%. Portland-cemented samples showed higher strength at a cementation level above 10%. In contrast to the bio-cemented specimens, the Portland-cemented specimens exhibited a smoother stress–strain relationship, while oscillations occured in case of the bio-cemented specimens. The nature and distribution of the bio-cementation bonding in the sample could be the reason for these oscillations, which are thought to be generated by bonding breakage. On the other hand, for the combined method, there were no oscillations before failure, similar to the behavior of Portland-cemented sand, which can be linked to better sample homogeneity.

4.3. Failure Mode and Stiffness

The failure mode refers to the identification of how the specimen fails during load application. In the present study, the failure mode is identified by multiple fractures for the bio-cemented sand and shearing and Y-shape modes for the Portland-cemented sand. The different failure modes observed in this study can be attributed to various responses of micro-defects due to the compression loading along with the weakest route. The direction in which the fracture spreads and the spatial distribution of the relatively weaker zones both affect the failure pattern. Liu et al. [35] also reported multiple fractures at the bottom part due to the inhomogeneous distribution of calcium carbonate, which resulted in localized deformation and minimal overall shear resistance for the specimen. By referring to the literature on MICP treatment, it can be concluded that there is no typical failure mode induced by the UCS test. Figure 17 depicts different failure modes compiled from different references. Four failure modes have been observed so far in the previous literature for bio-cemented samples subjected to the UCS test. These failure modes are (1) splitting [41]; (2) multiple fractures [7]; (3) shearing [20]; and (4) Y-shape [7]. However, the reason behind the varying failure modes is unclear so far and challenging to determine because these studies were conducted under different conditions, treatment methods, and soil types. The generation of various failure modes can be attributed to damage evolution, which includes the formation of micro-cracks, the propagation of cracks, and the coalescence of cracks [42]. The splitting failure mode occurs when the wing cracks are able to freely propagate. Conversely, the shear failure mode occurs when the microstructure restricts the propagation of wing cracks; therefore, the adjacent wing cracks or nearby cracks coalesce [43]. Multiple fracturing involves irregular specimen breakage or crumbling when systematic coalescence of adjacent wing cracks are restricted, allowing the release of strain energy in any possible way. The failure mechanism is influenced by the strength of bonds and the coefficient of friction. Ahenkorah et al. [7] conducted multiple unconfined compressive strength (UCS) experiments using both microbially induced carbonate precipitation (MICP) and enzyme-induced carbonate precipitation (EICP) methods. The analysis revealed that the average calcium content was about 18% for the y-shape failure mode, 20% and 14% for the splitting failure mode, and 17% for the multiple-fracture failure mode. These findings suggest that the variations in failure modes cannot be solely attributed to the level of cementation. Instead, they appear to be influenced by the homogeneity across the sample.
The results demonstrated a difference in the stiffness of bio-cemented samples between the percolation method and the combined method. The mechanical characteristics of geomaterials improved by MICP are primarily controlled by the size, level, and distribution of CaCO 3 precipitates. These microstructural changes play a significant role in the evolution of stiffness [36]. During MICP treatment, the development of soil stiffness can be measured by non-destructive methods like seismic wave measurements, particularly shear wave velocity ( V s ). The value of V s is predominantly influenced by the stiffness of contacts between particles, the degree of cementation, the soil density, the confining pressure, and the saturation level [44]. The difference in stiffness between bio-cemented samples and Portland-cemented samples could potentially be attributed to the degradation of the weaker bonds between calcite and sand, finally leading to its breakage into fine particles that subsequently fill the internal voids. Yin et al. [45] also found that the stress–strain curve of the Portland cement-treated sample showed higher values of stiffness compared to those of bio-cemented samples. Another reason for the enhanced strength and stiffness observed in the samples treated with ordinary Portland cement (OPC) can be attributed to the process of cement hydration, which continues for up to 28 days following the initial reaction between the cement and the soil [39].

4.4. Calcium Carbonate Content and UCS

It is a common practice in the MICP field of research to link the amount of CaCO 3 with the acquired UCS. Figure 18 compares the results of this study with data compiled from the literature [22,40,46,47,48,49,50,51,52,53,54,55,56,57,58,59]. The level of cementation in the considered studies ranged from low to high, with values between almost zero up to around a 35%. The results of this study are in line with the results of [54,60] (gray squares and brown inversed triangles in Figure 18). The mean grain size of the sand used in [60] was d 50 = 0.166 mm. For the study of [54], three sands were utilized, having d 50 = 1.2, 0.6, and 0.2 mm. It can be concluded that the strength achieved by the combined method in this study (UCS = 3.7 MPa, d 50 = 0.14 mm) is higher than the average UCS reported by [54] for a mean grain size higher than our study (UCS = 1.4 MPa, d 50 = 0.2 mm). It can be seen from Figure 18 that two points from this study produced by the percolation method had lower UCS than data from the literature for the same level of cementation. This can be attributed to the precipitation homogeneity along the height of the specimen and the precipitation efficiency whether it is placed at contact points or not. Figure 19 shows compiled data of naturally cemented sand and sandstone. More information related to the name and origin of the sandstones can be found in [2,3,61,62,63,64]. It can be seen from Figure 19a that UCS values for natural sandstone range from around 10 to 5000 kPa. The range of UCS values for the bio-cemented samples in this study is clearly in line with the UCS values for naturally cemented soil. Figure 19b provides information regarding the calcium carbonate content for naturally cemented soil data. The values vary between approximately 1% and 30%. Compared with the findings of the current study, it can be concluded that the calcium carbonate content reached in the bio-cemented samples in this study fits well with values for naturally cemented soil.

4.5. SEM

SEM observations give insights into the dimensions, the morphology, as well as the placement of CaCO 3 precipitation. The process of how calcium carbonate crystals precipitate consists of three stages: formation, followed by accumulation and growth. With the continued accumulation of generated CaCO 3 crystals, their size will expand until the complete encapsulation of bacterial cells by the precipitated calcium carbonate. The difference in the size of crystals can be attributed to the competition that takes place between crystal growth, where the size of the crystal increases, and crystal nucleation, where new crystals are formed [39]. In the process of MICP, the mechanism of crystal growth involves the gradual accumulation of newly formed crystal layers on top of existing ones, resulting in layering, when fresh reagents are introduced [65]. The dominance between the formation of new crystals and the growth of pre-existing crystals is determined by two factors, the presence of nucleation sites and the supersaturation level. The availability of nucleation sites is promoted by higher bacteria concentration. In sample PF 1 C l , the smallest size but the highest number of calcium carbonate crystals were observed. This can be related to the urea effect, which is considered to promote crystal nucleation. The bonding breakage which occurred at 1% strain for sample PF 1 C l could be because of the small sizes of the crystals, which results in a small contact area for the bonds. The second factor affecting the size of the crystals is the level of supersaturation, which is determined by the ionic activity product of the dissolved precipitating ions as well as the solubility product of the mineral phase. The level of supersaturation is influenced by various factors, including urease activity, cementation solution concentration, temperature, and pH [36]. The final size and number of CaCO 3 crystals is the result of the interaction between all these factors. With a restricted number of nucleation sites, there is a tendency for the crystals to increase in size as they grow. This may explain the medium crystal size in samples PF 1 C l and P-S 1 . In line with previous studies [39], the big size of crystals in sample PGC h was attributed to the effect of the high concentration of cementation solution. The holes present on the surface of precipitate crystals in samples PF 1 C l and P-S 1 are thought to be the traces of bacteria, where bacterial encapsulation has not yet been totally completed. A similar pattern of results was obtained by [66,67]. Some crystals had no traces, which might be explained by the full bacterial decomposition [67].
The morphology of CaCO 3 observed in this study is in line with previous research, such as spherical [39], rhombohedral [40], and flower-like shapes [68]. Different calcium carbonate minerals have been found in bio-cemented soils, including calcite, vaterite, aragonite, monohydrocalcite, ikaite, and amorphous calcium carbonate (ACC). These polymorphs vary in solubility and stability, with calcite being the most stable [36]. CaCO 3 precipitation follows a series of phase transformations, starting with the least stable form (ACC) and ranging to the most stable form (calcite). The varied morphologies of CaCO 3 crystals observed in sample P-S 1 might be the result of different stages of sphere growth and potential transition into rhombohedral crystals [69]. Factors like supersaturation levels have an impact on the specific polymorphs that arise [70]. Vaterite and aragonite are two metastable phases that form more readily when supersaturation levels are high, whereas calcite forms more readily when supersaturation levels are low. To conduct a more detailed analysis of the morphology, X-ray diffraction (XRD) analysis could be employed. According to this study, calcium carbonate crystals were observed in three different locations: coating sand grains, bonding sand grains together, termed as effective precipitation, and filling the pore space, similar to the findings of other studies [40]. The mechanism by which soil mechanical properties are improved depends on where the CaCO 3 crystals are located relative to the soil particles. The presence of crystals between sand particles results in a bonding effect, while the presence of crystals coating the surface of sand particles or being suspended in soil pores leads to roughening and densification of the soil. Cementation at the contact points between particles is more effective in enhancing strength compared to the process of roughening and densification [36].

5. Conclusions

Inspired by nature, biological soil treatment (MICP) has recently emerged as a new strategy to solidify soil, improve its mechanical properties, and simulate the behavior of naturally cemented sand. For this aim, different treatment methods have recently been used to improve the homogeneity as well as the strength obtained by MICP. In this paper, a new MICP treatment method was proposed using a combination of the premixing bacteria method, the percolation method, and the submerging method. For comparison, Portland-cemented samples were produced. Based on the results of this investigation, the following conclusions can be drawn:
  • Experimental data revealed that suspending bacterial cells in a calcium-containing solution is more effective than percolating the sample with a urea-containing solution.
  • The combined method lead to higher strength than the percolation method by almost 3.7 times, with an increment in strength of around 2.7 MPa, indicating the ability to achieve a higher strength in a shorter time than the submerging method.
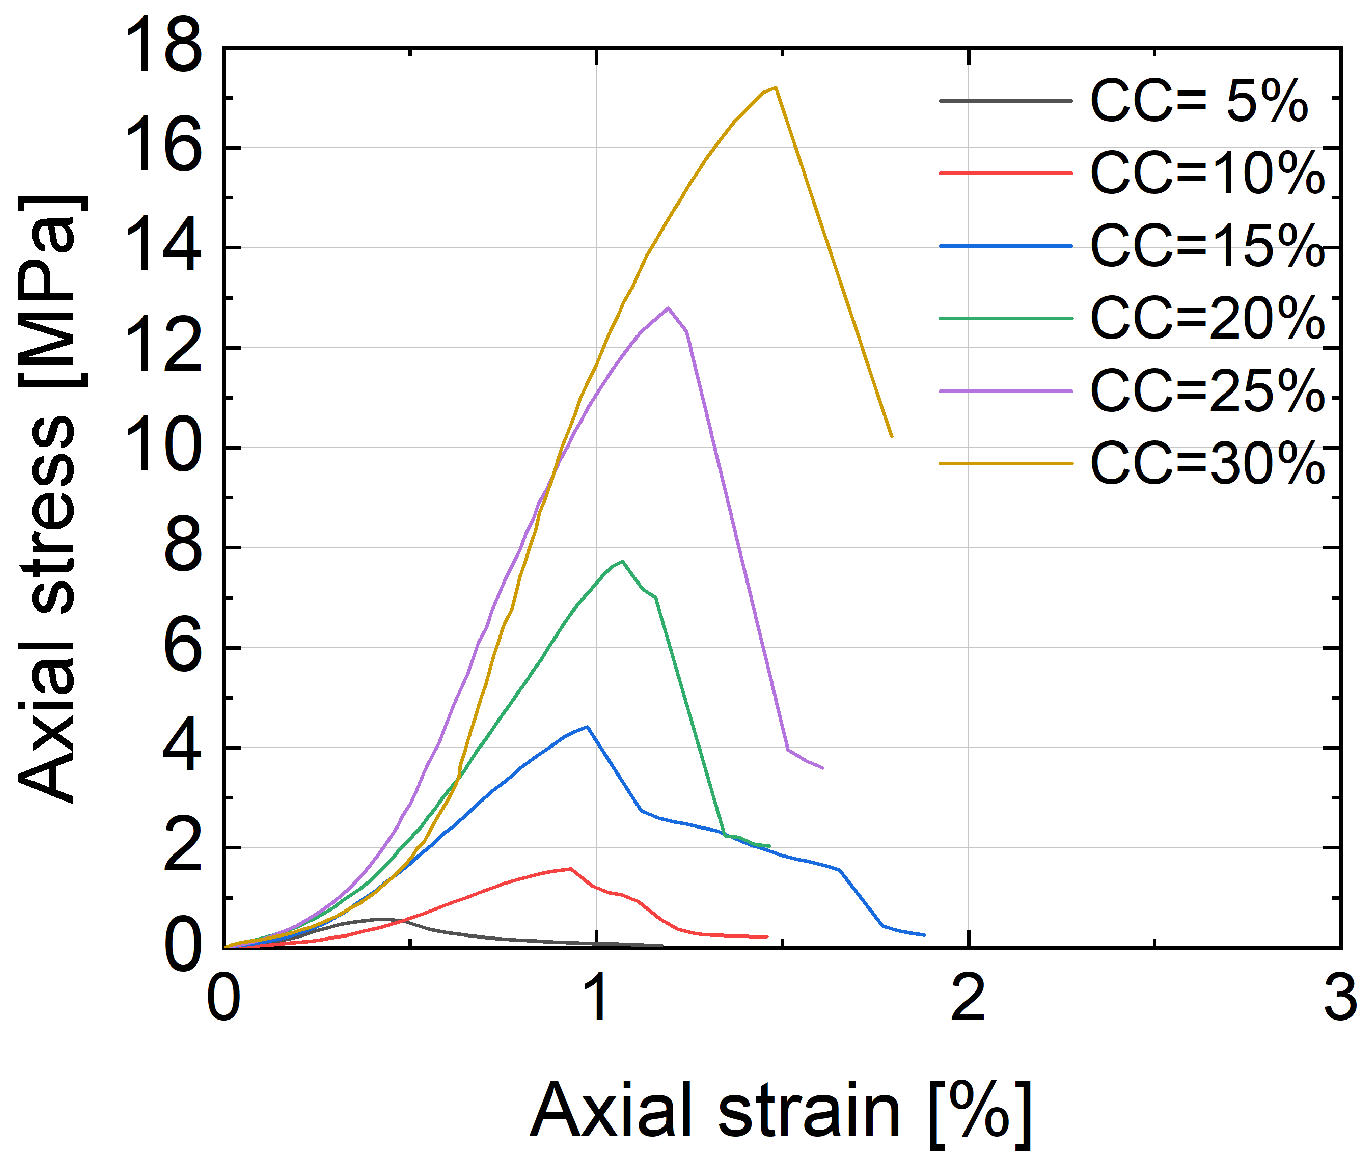
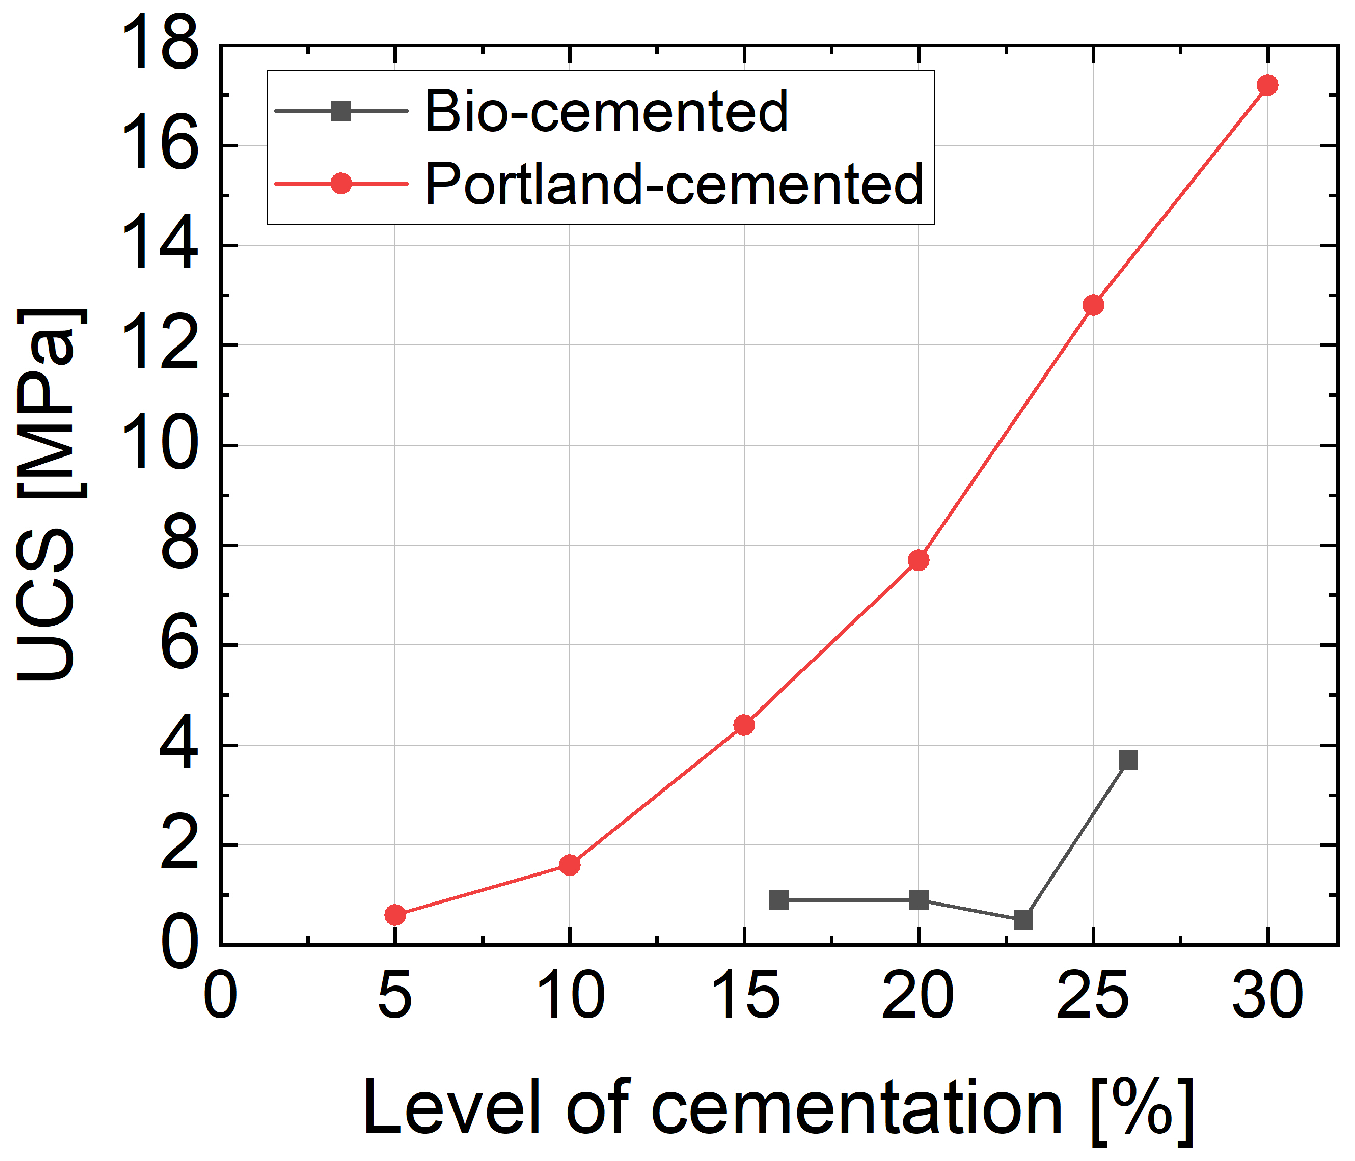
  • UCS for sandy soil solidified by bio-cementation, ranging from 0.5 to 3.7 MPa, was found lower than that of samples solidified by Portland cement, ranging from 0.6 to 17.2 MPa.
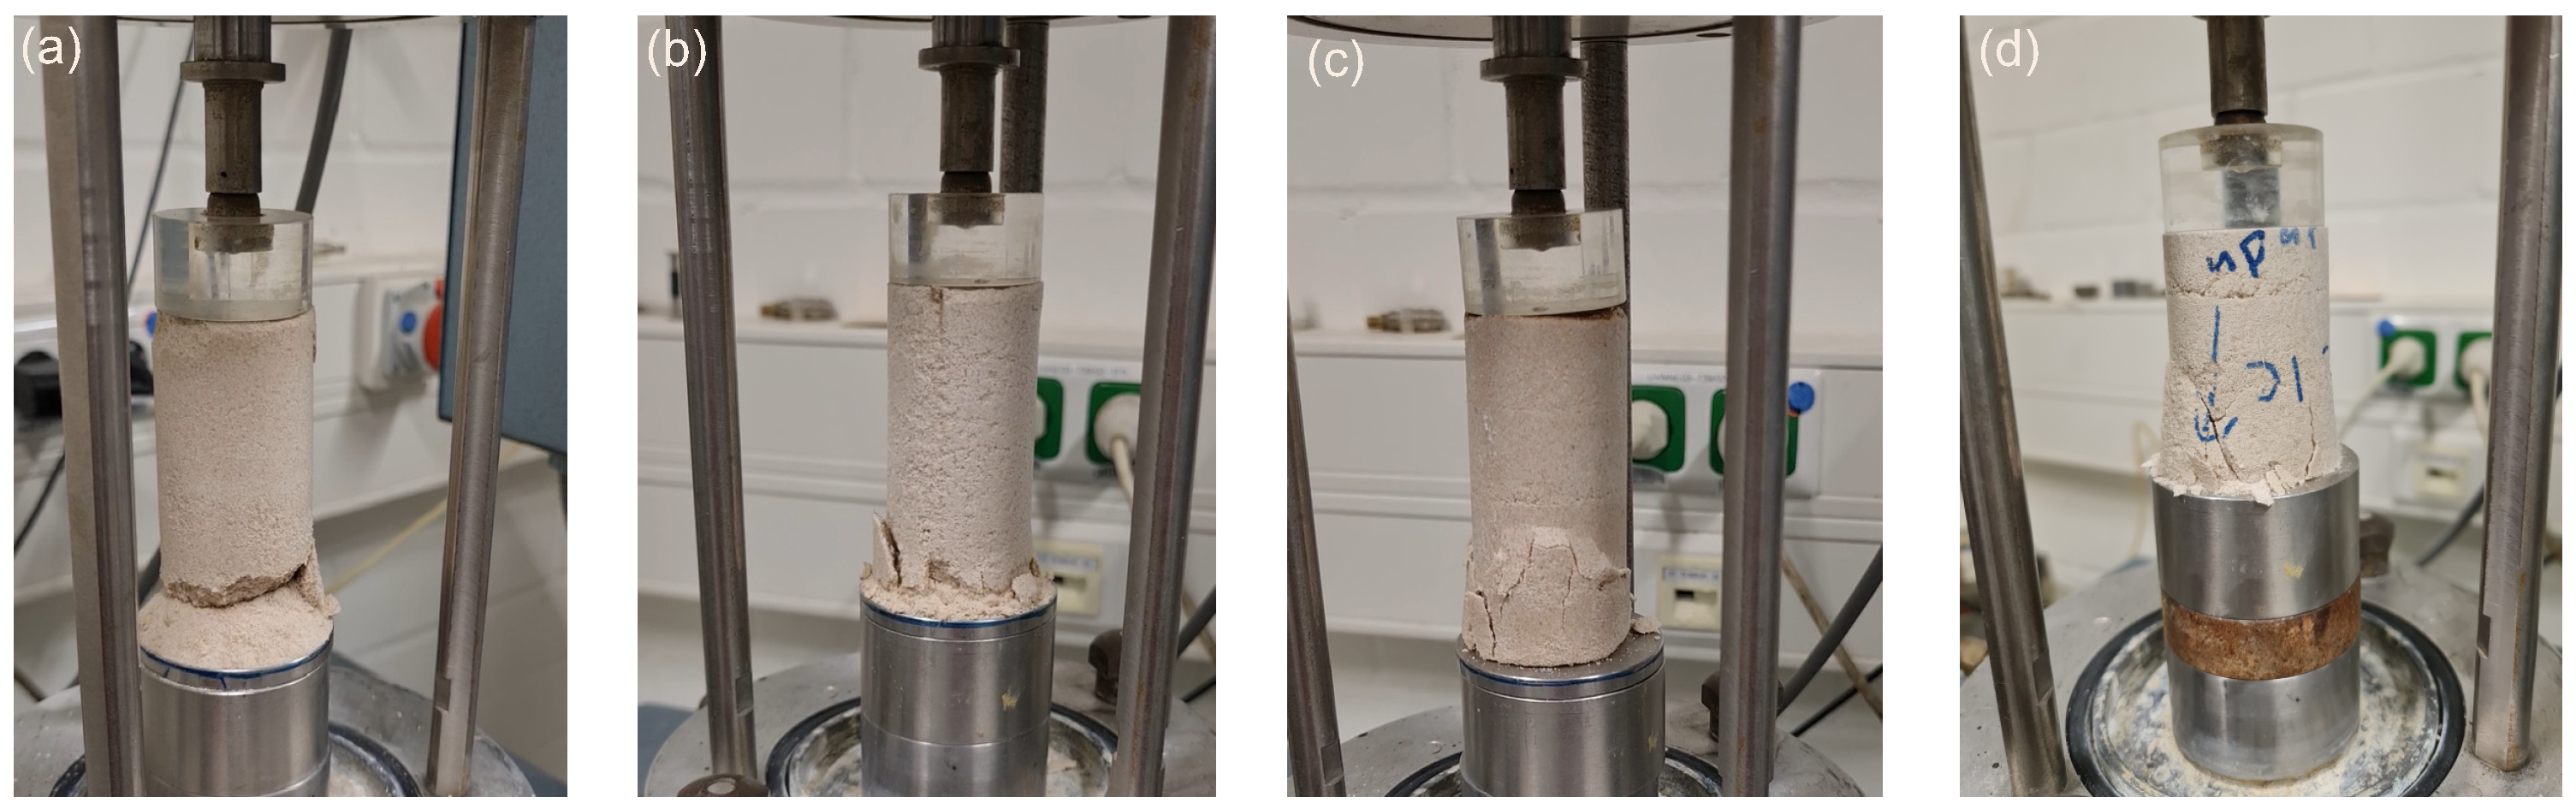
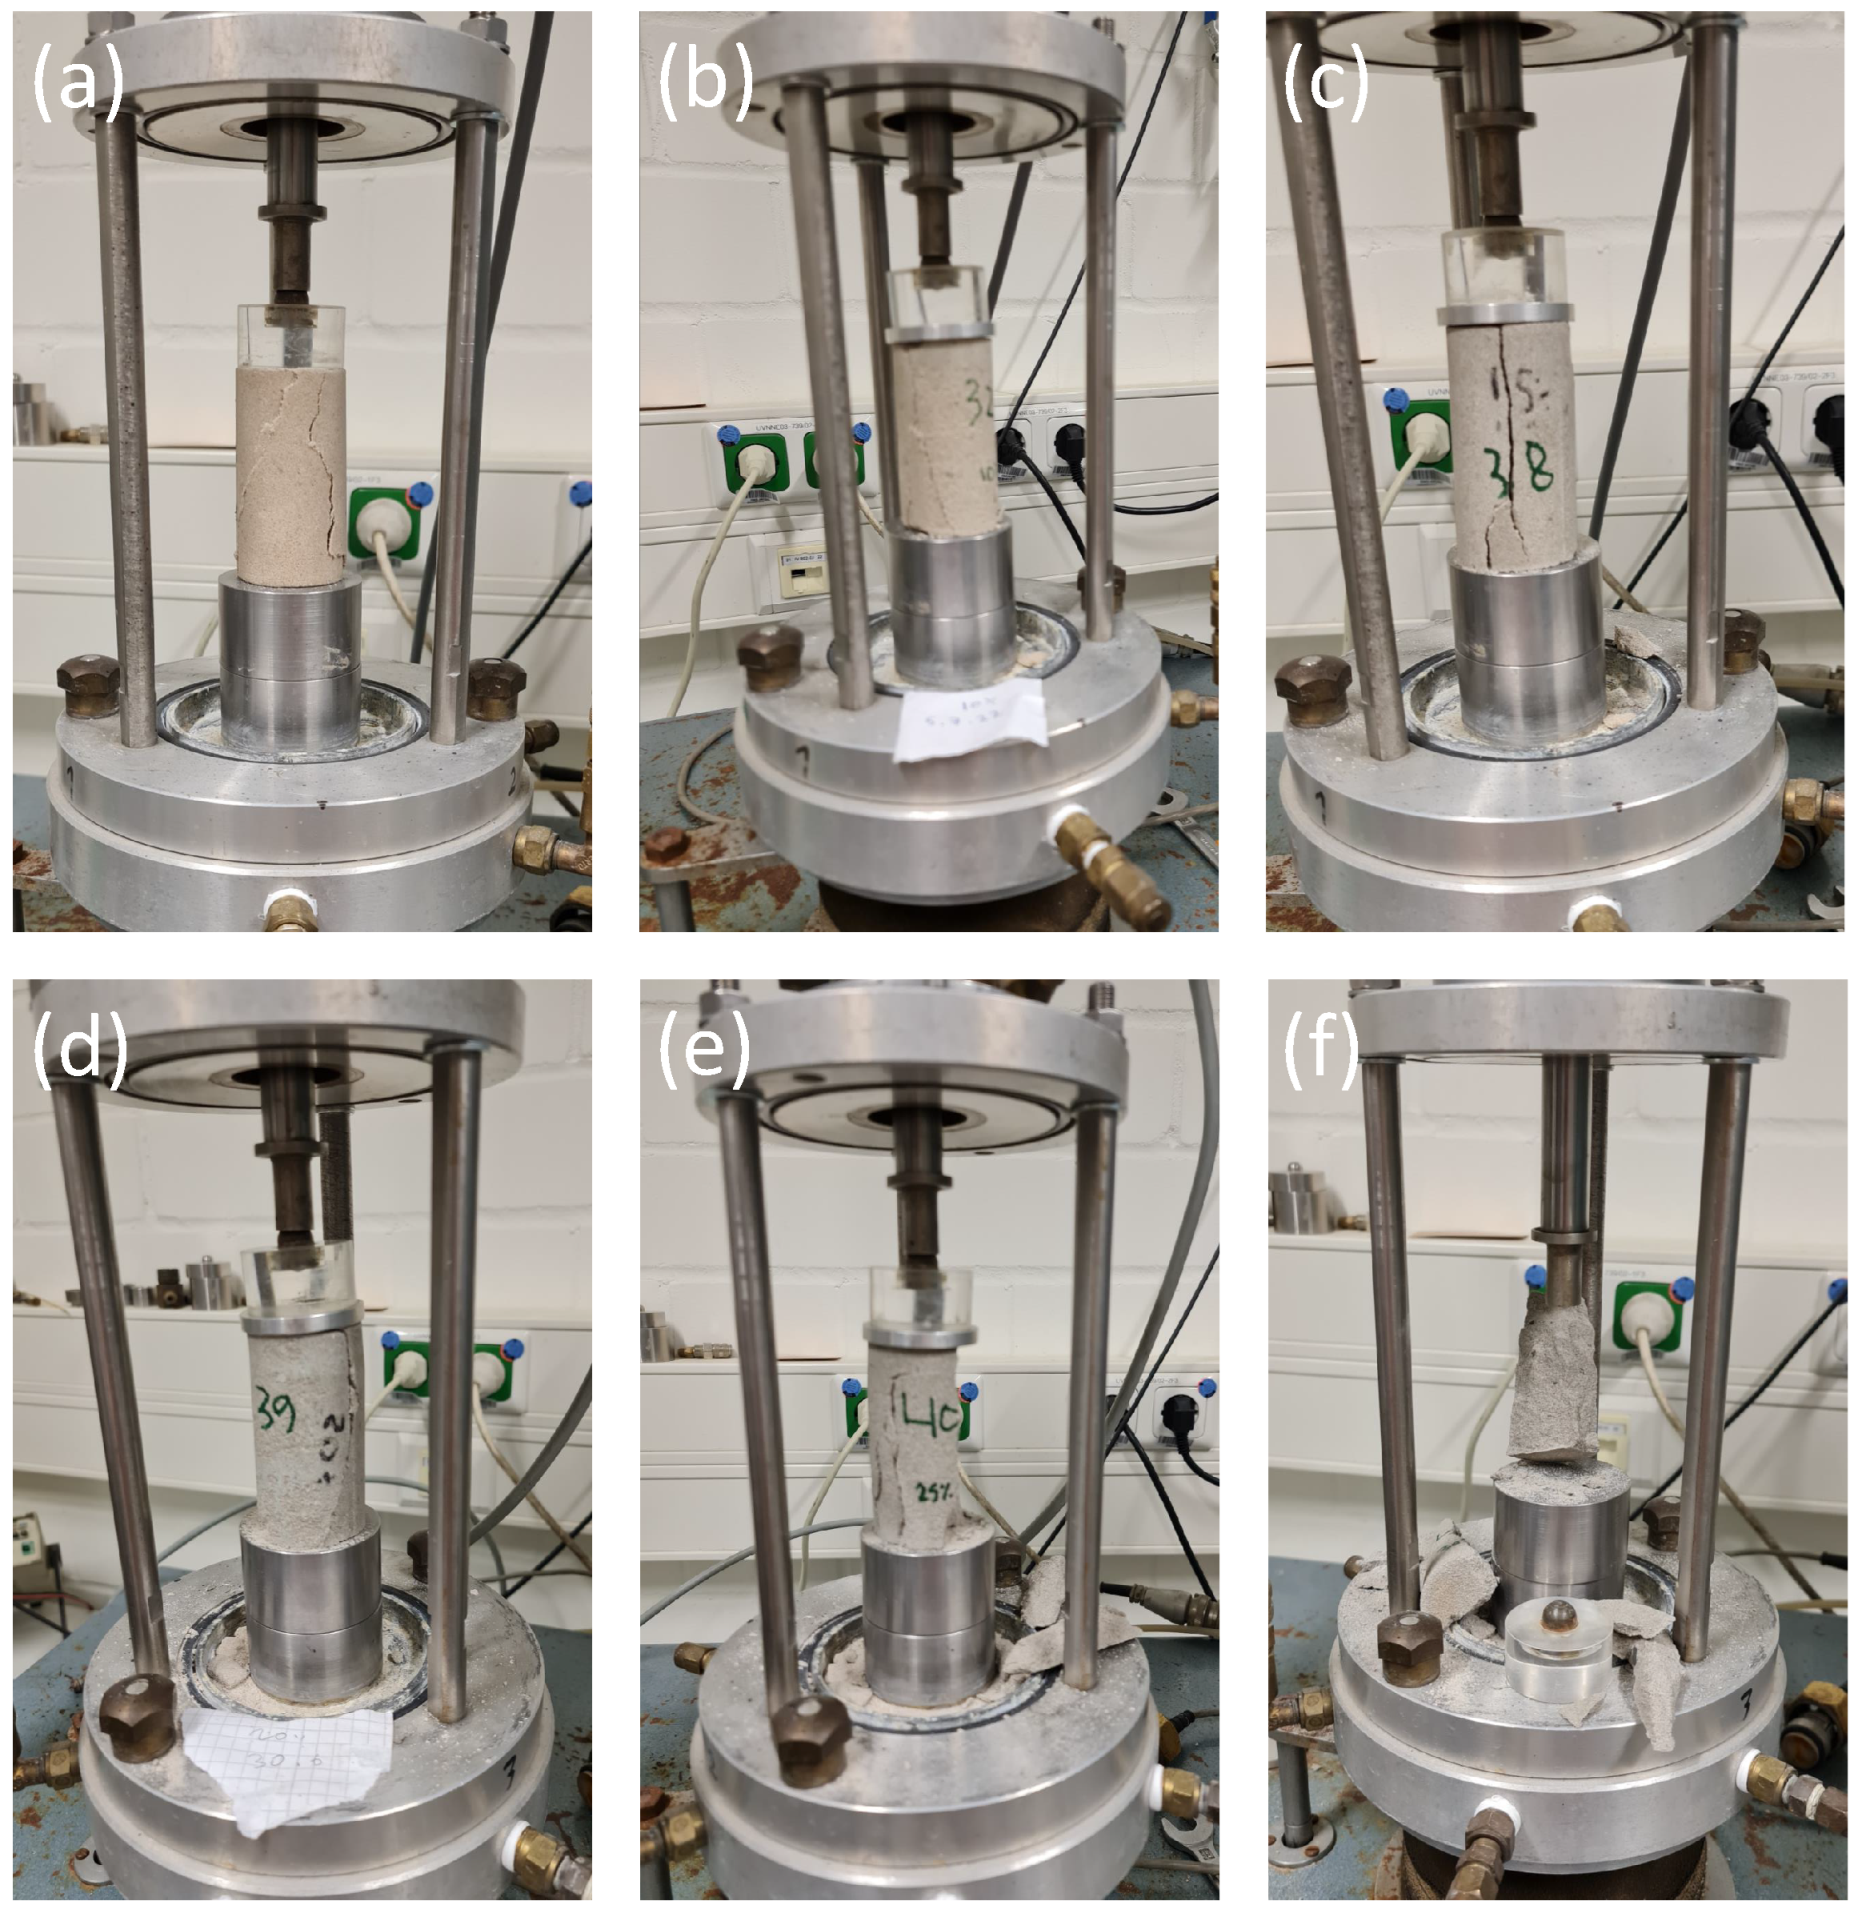
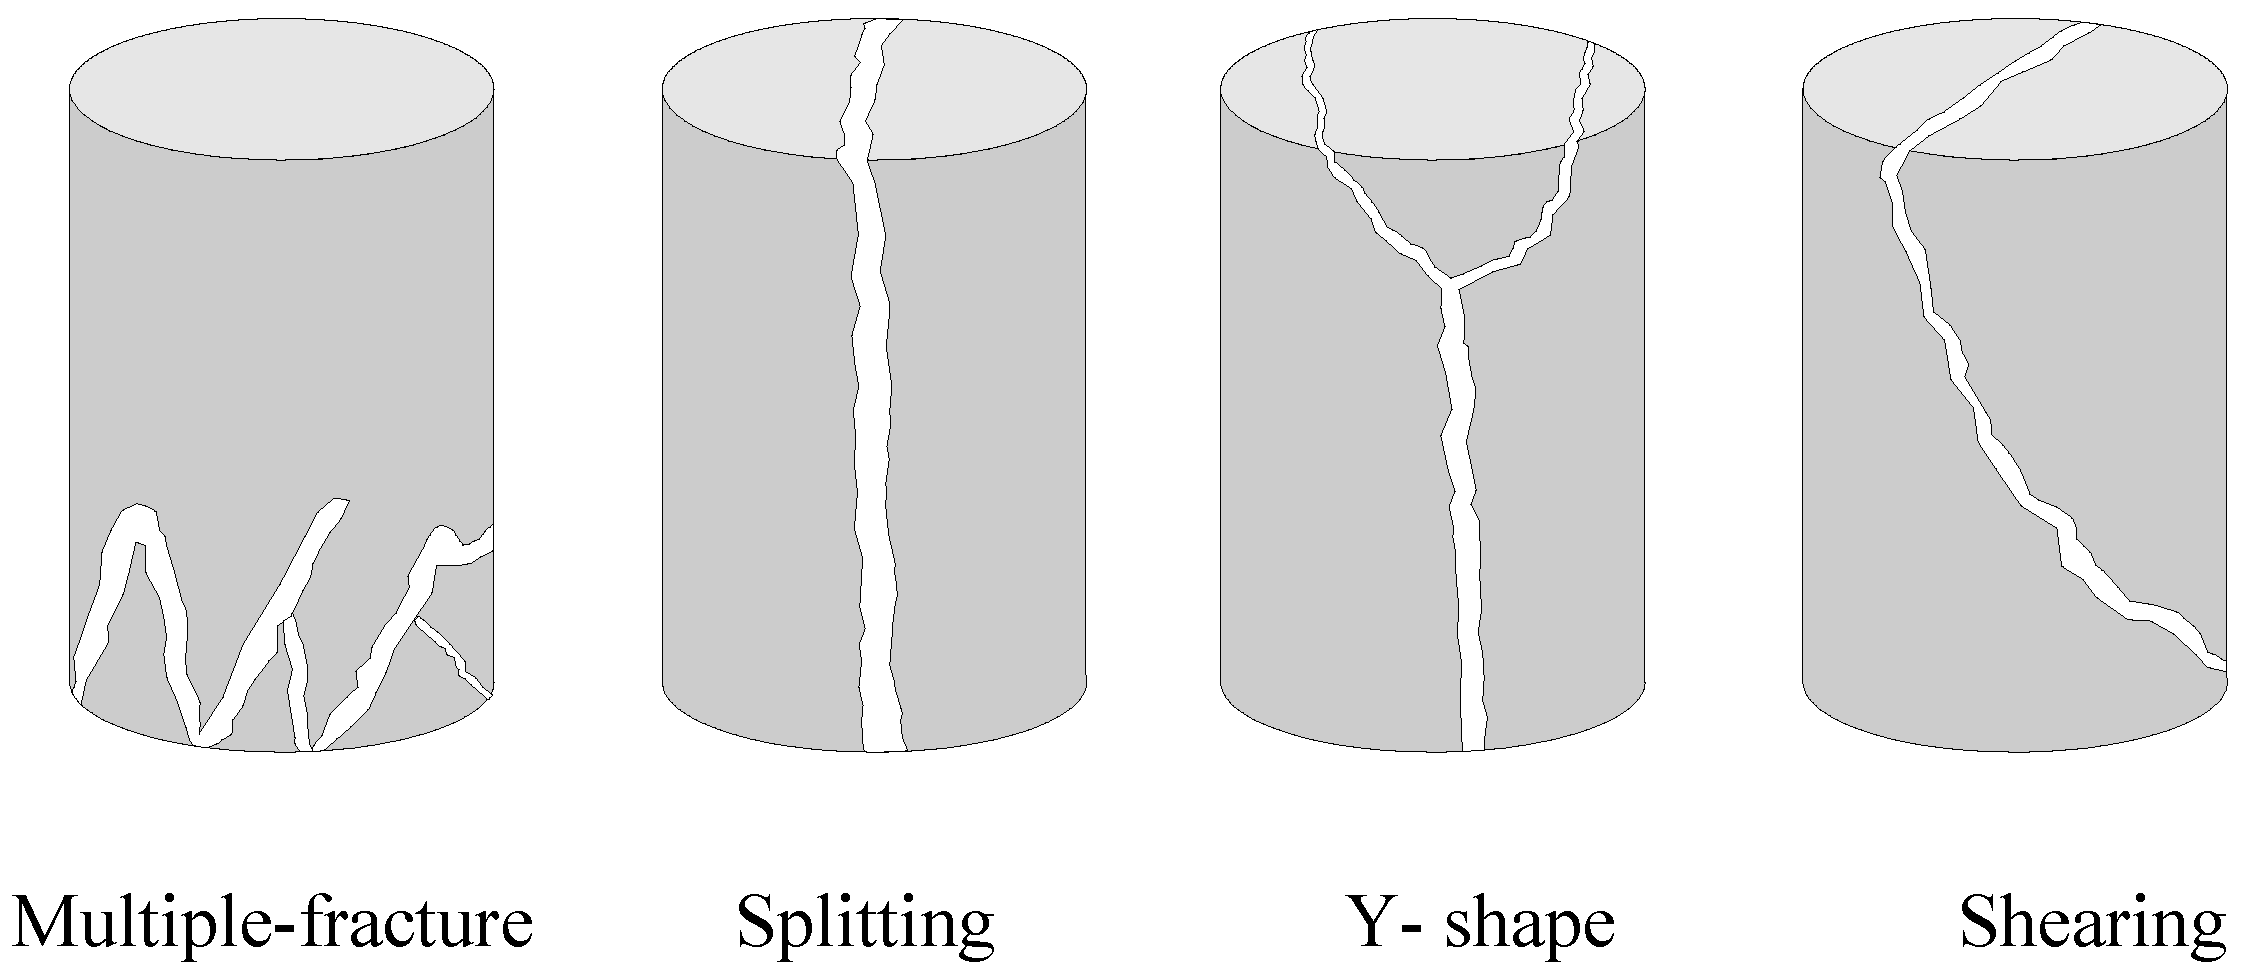
  • In bio-cemented sand, the failure mode was characterized by the presence of multiple fractures at the bottom of the specimen, while in Portland-cemented sand, the failure mode predominantly exhibited a y-shape pattern.
  • The combined procedure yielded samples that were about 13 times stiffer than those prepared by the percolation method.
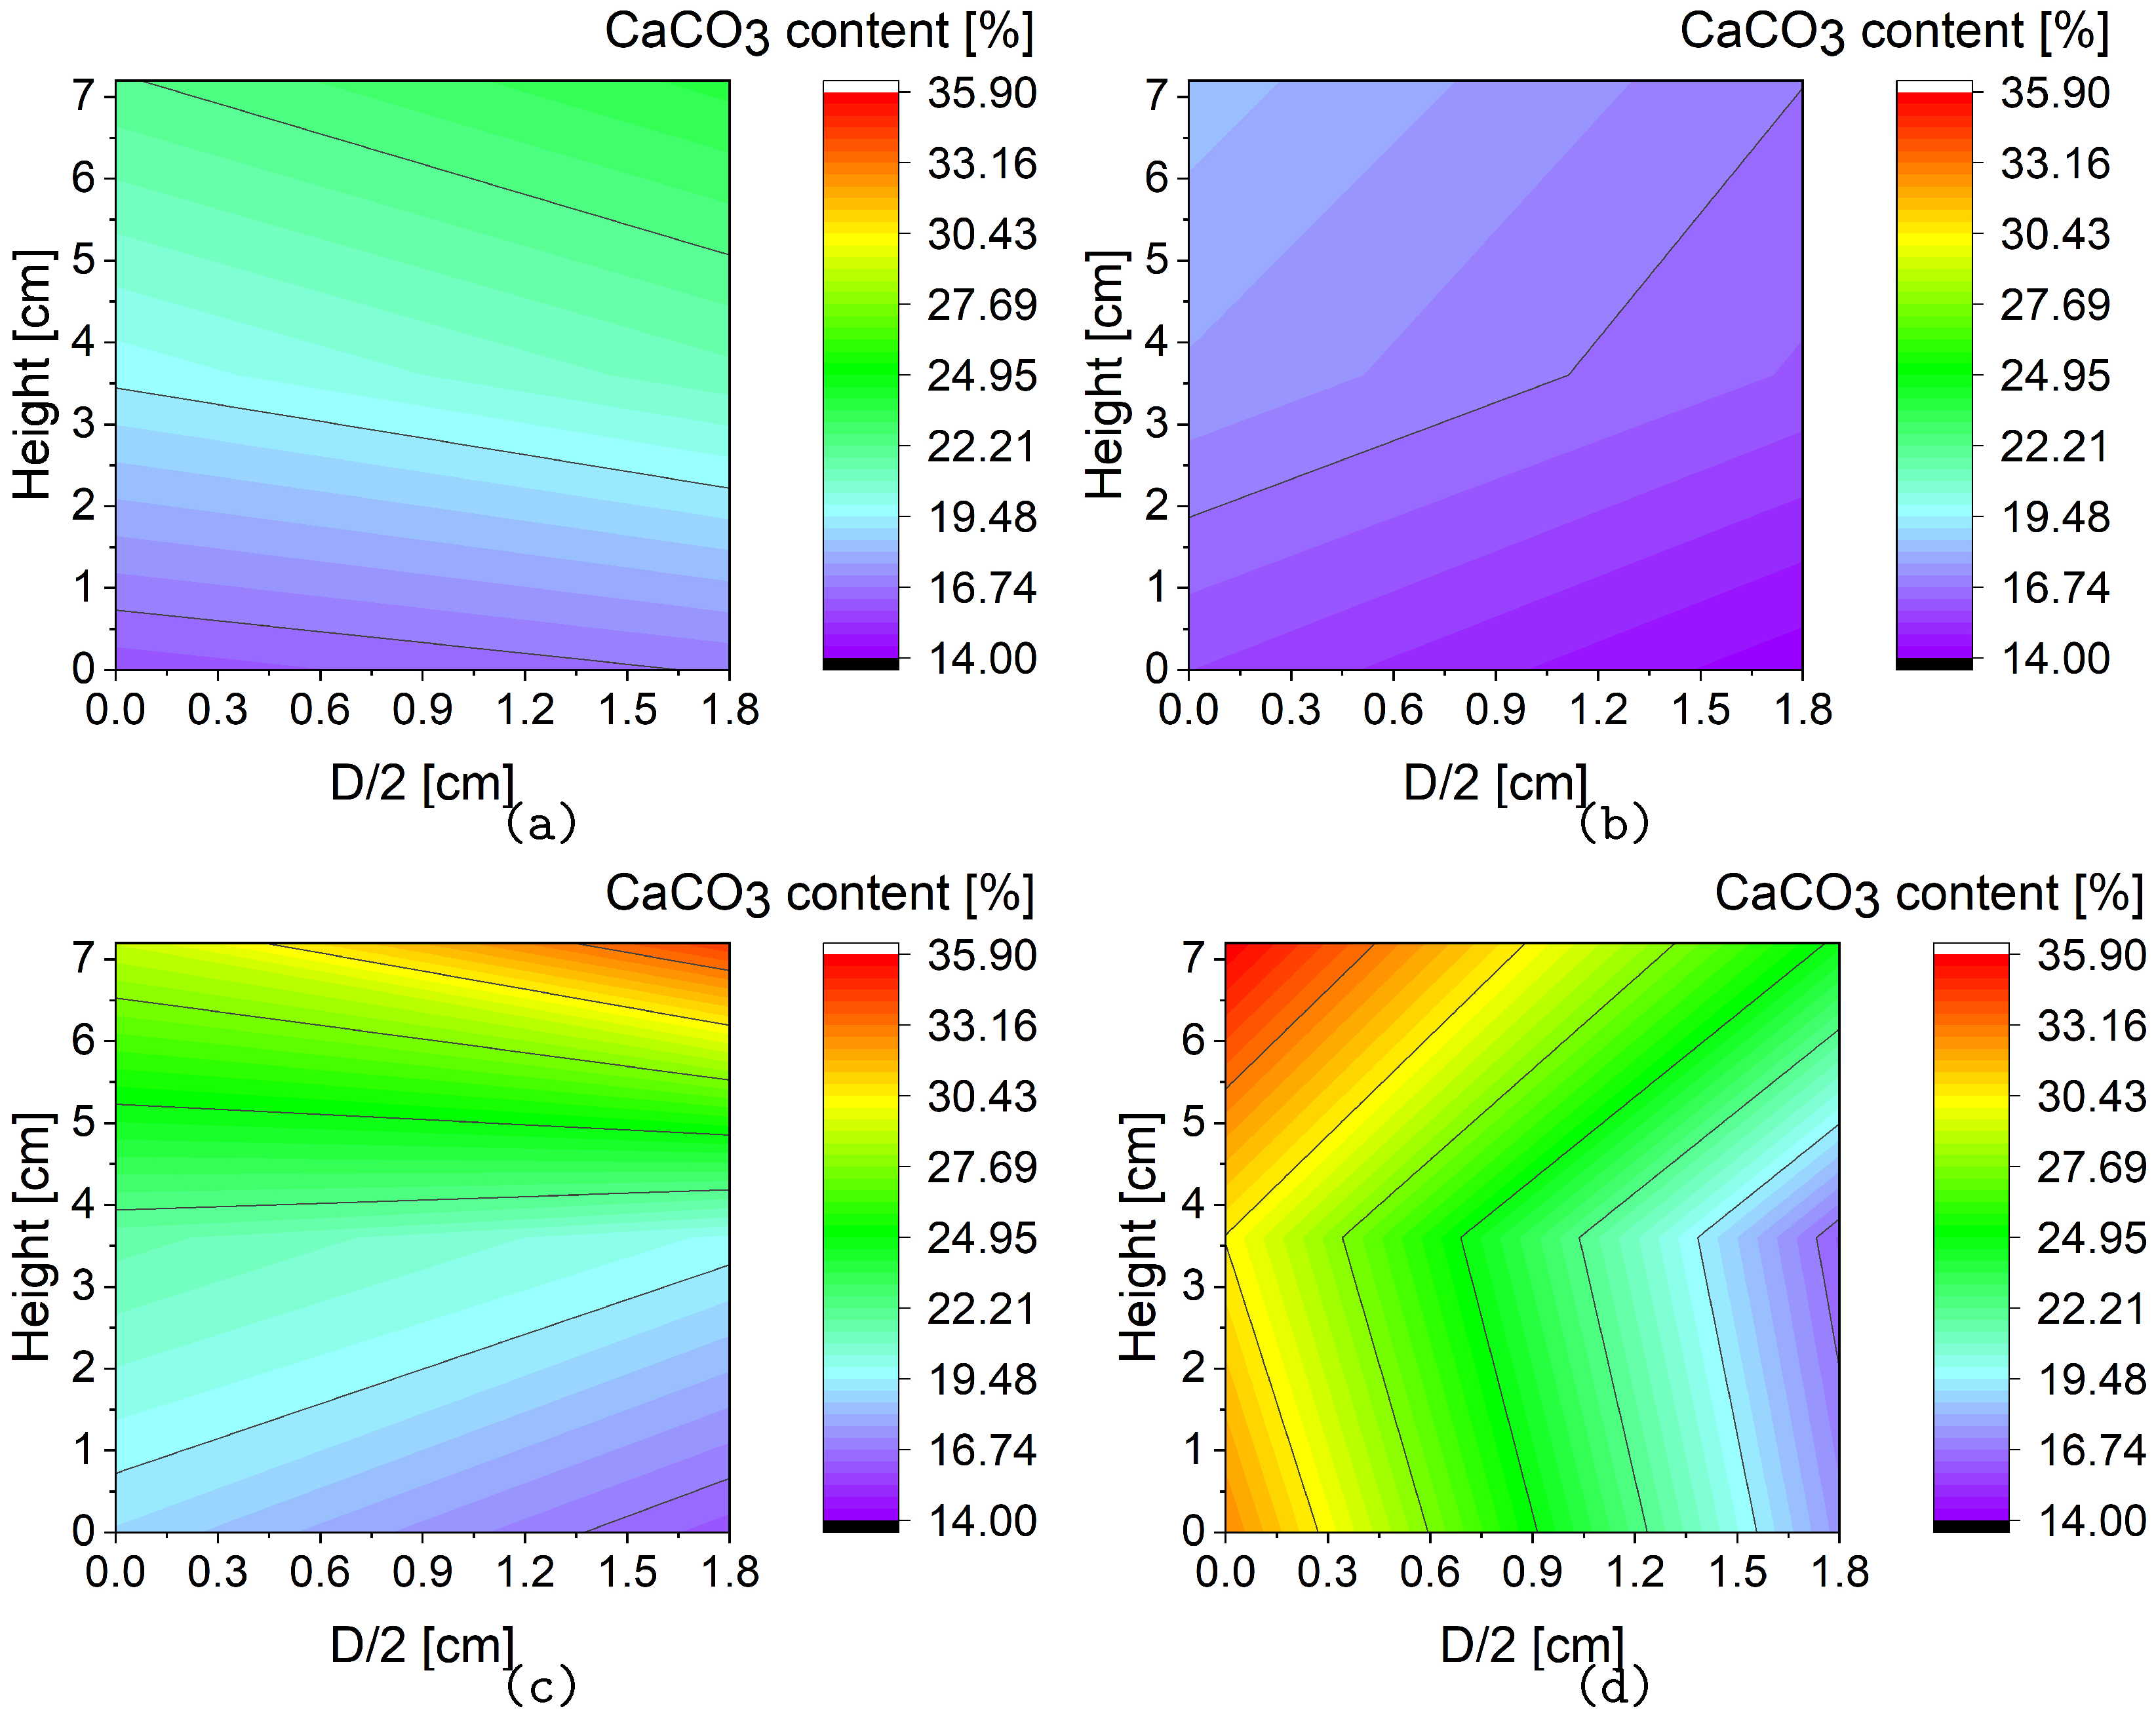
  • Applying the combined method, calcium carbonate was well-distributed throughout the sample, with the exception of a lower concentration at the center of the lower section of the sample. In samples prepared by the percolation procedure, the content of calcium carbonate gradually decreased along the direction away from the sample’s surface.
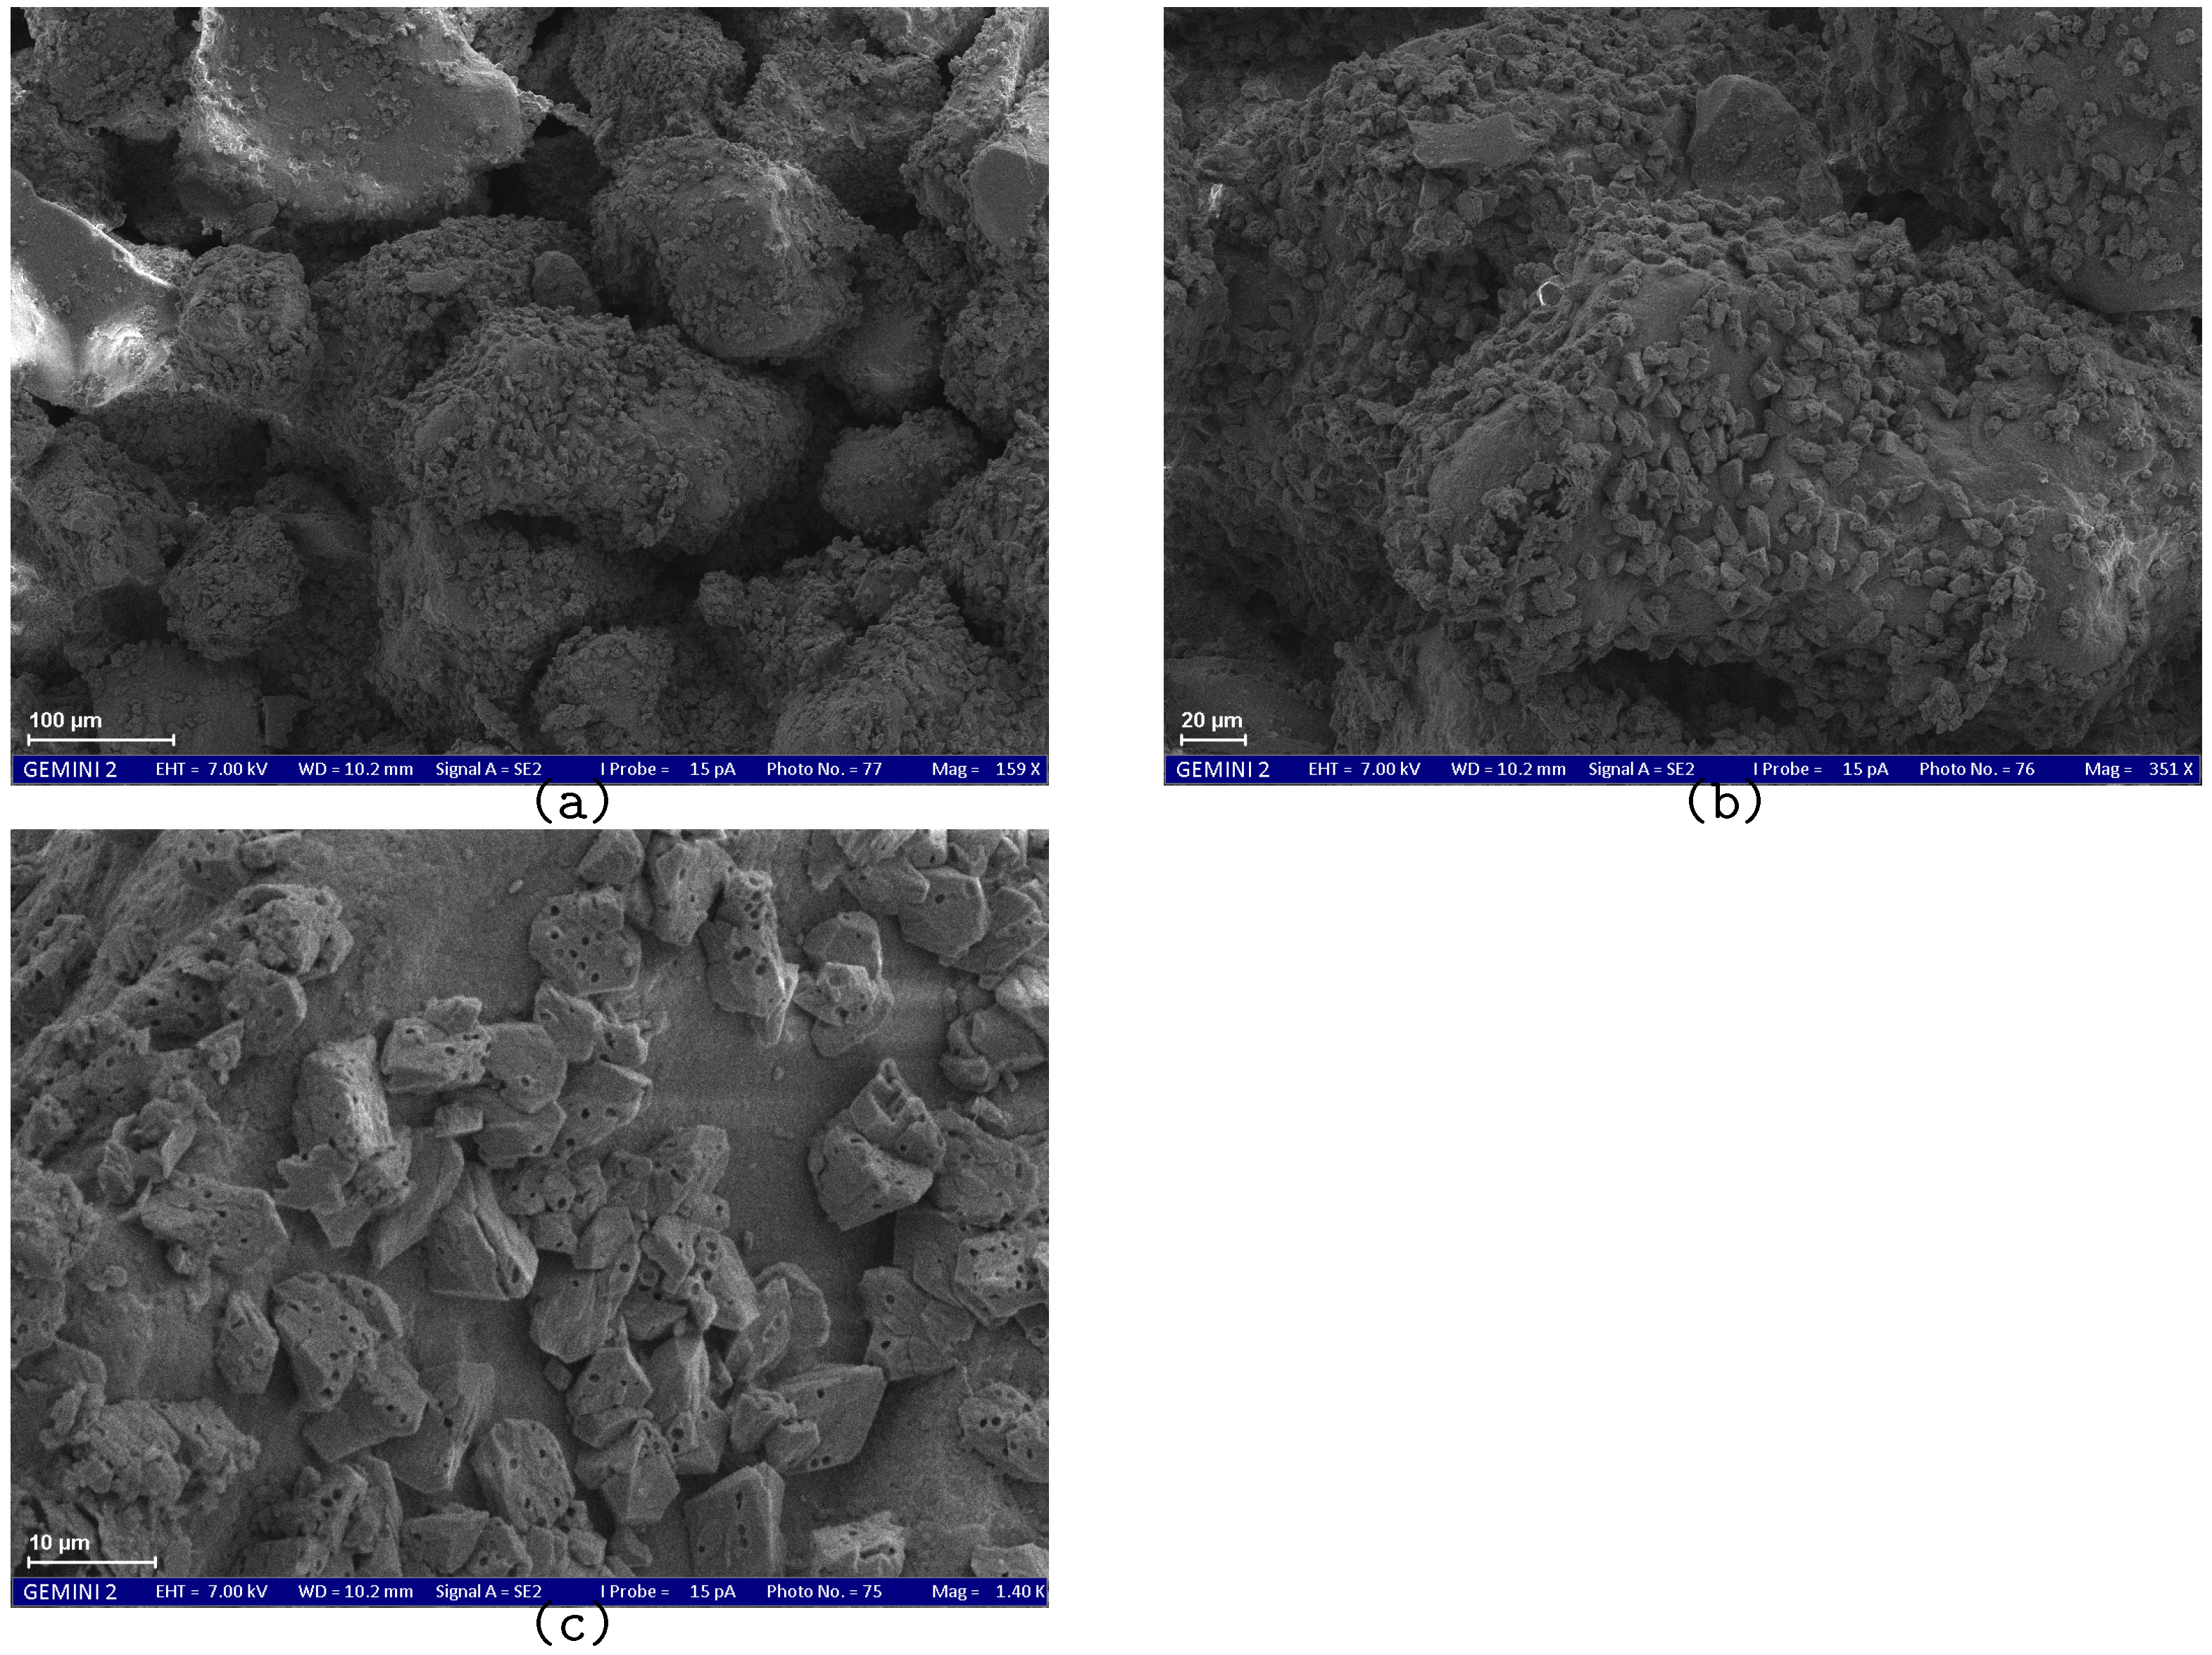
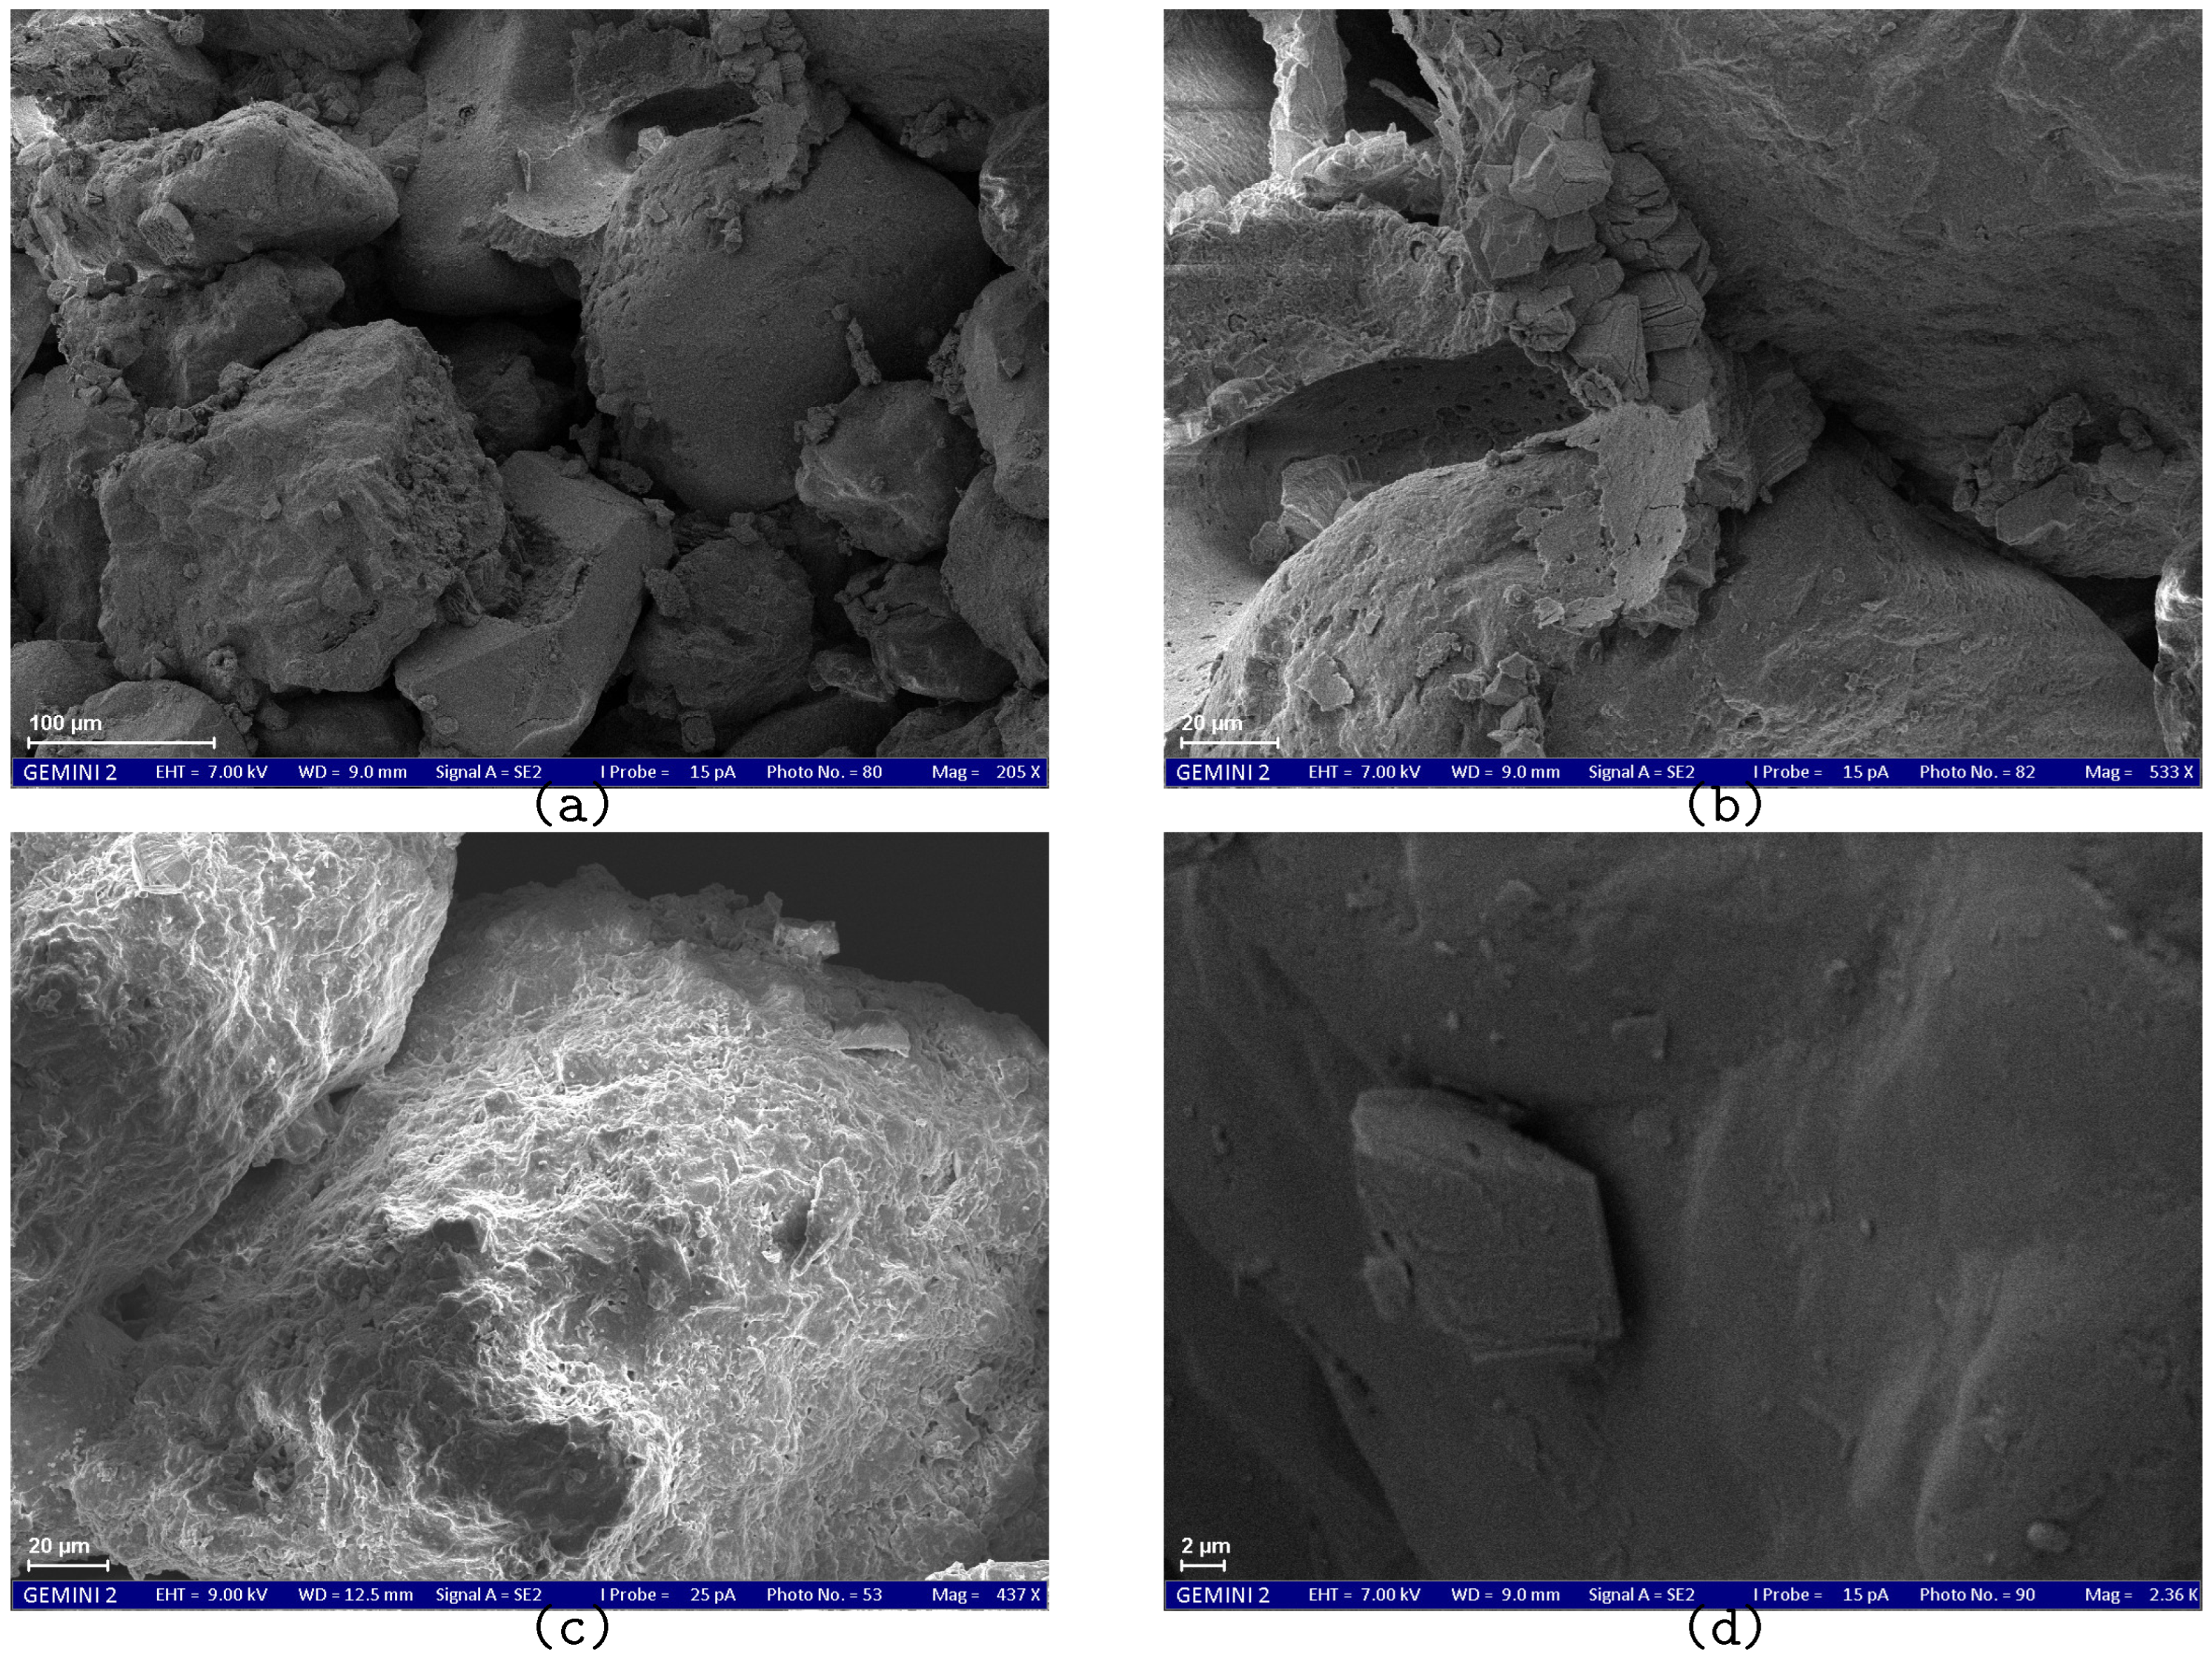
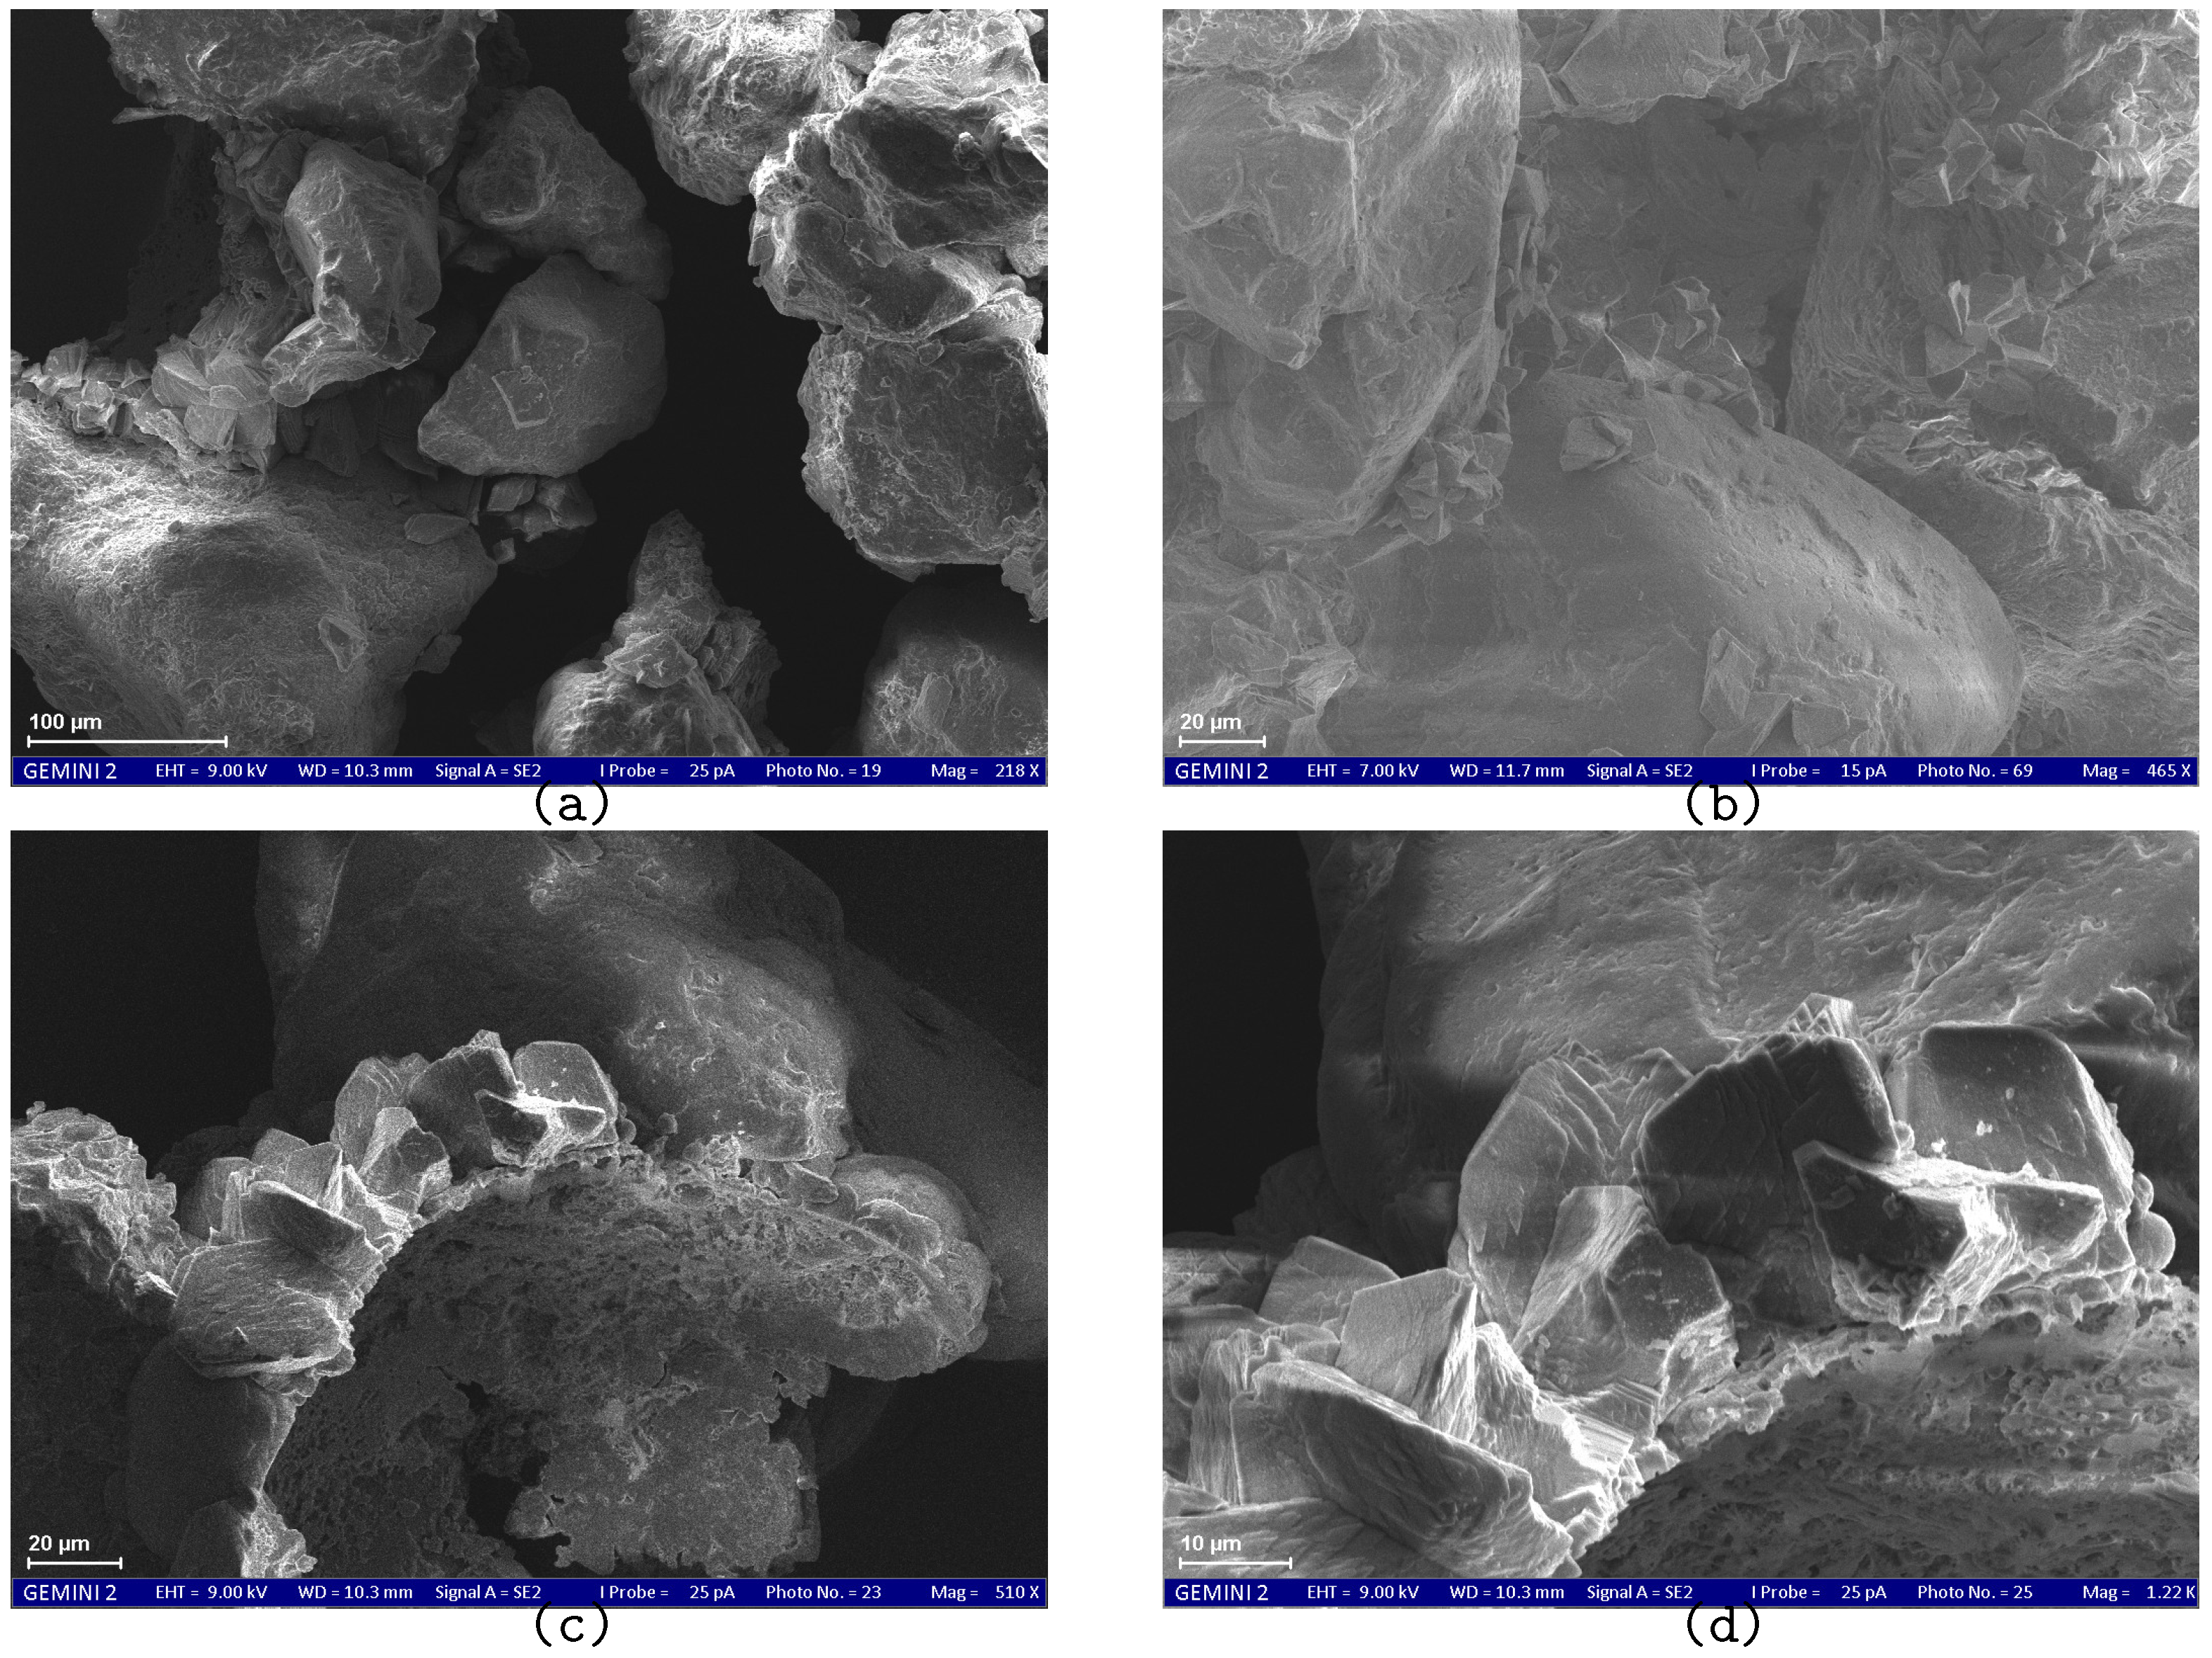
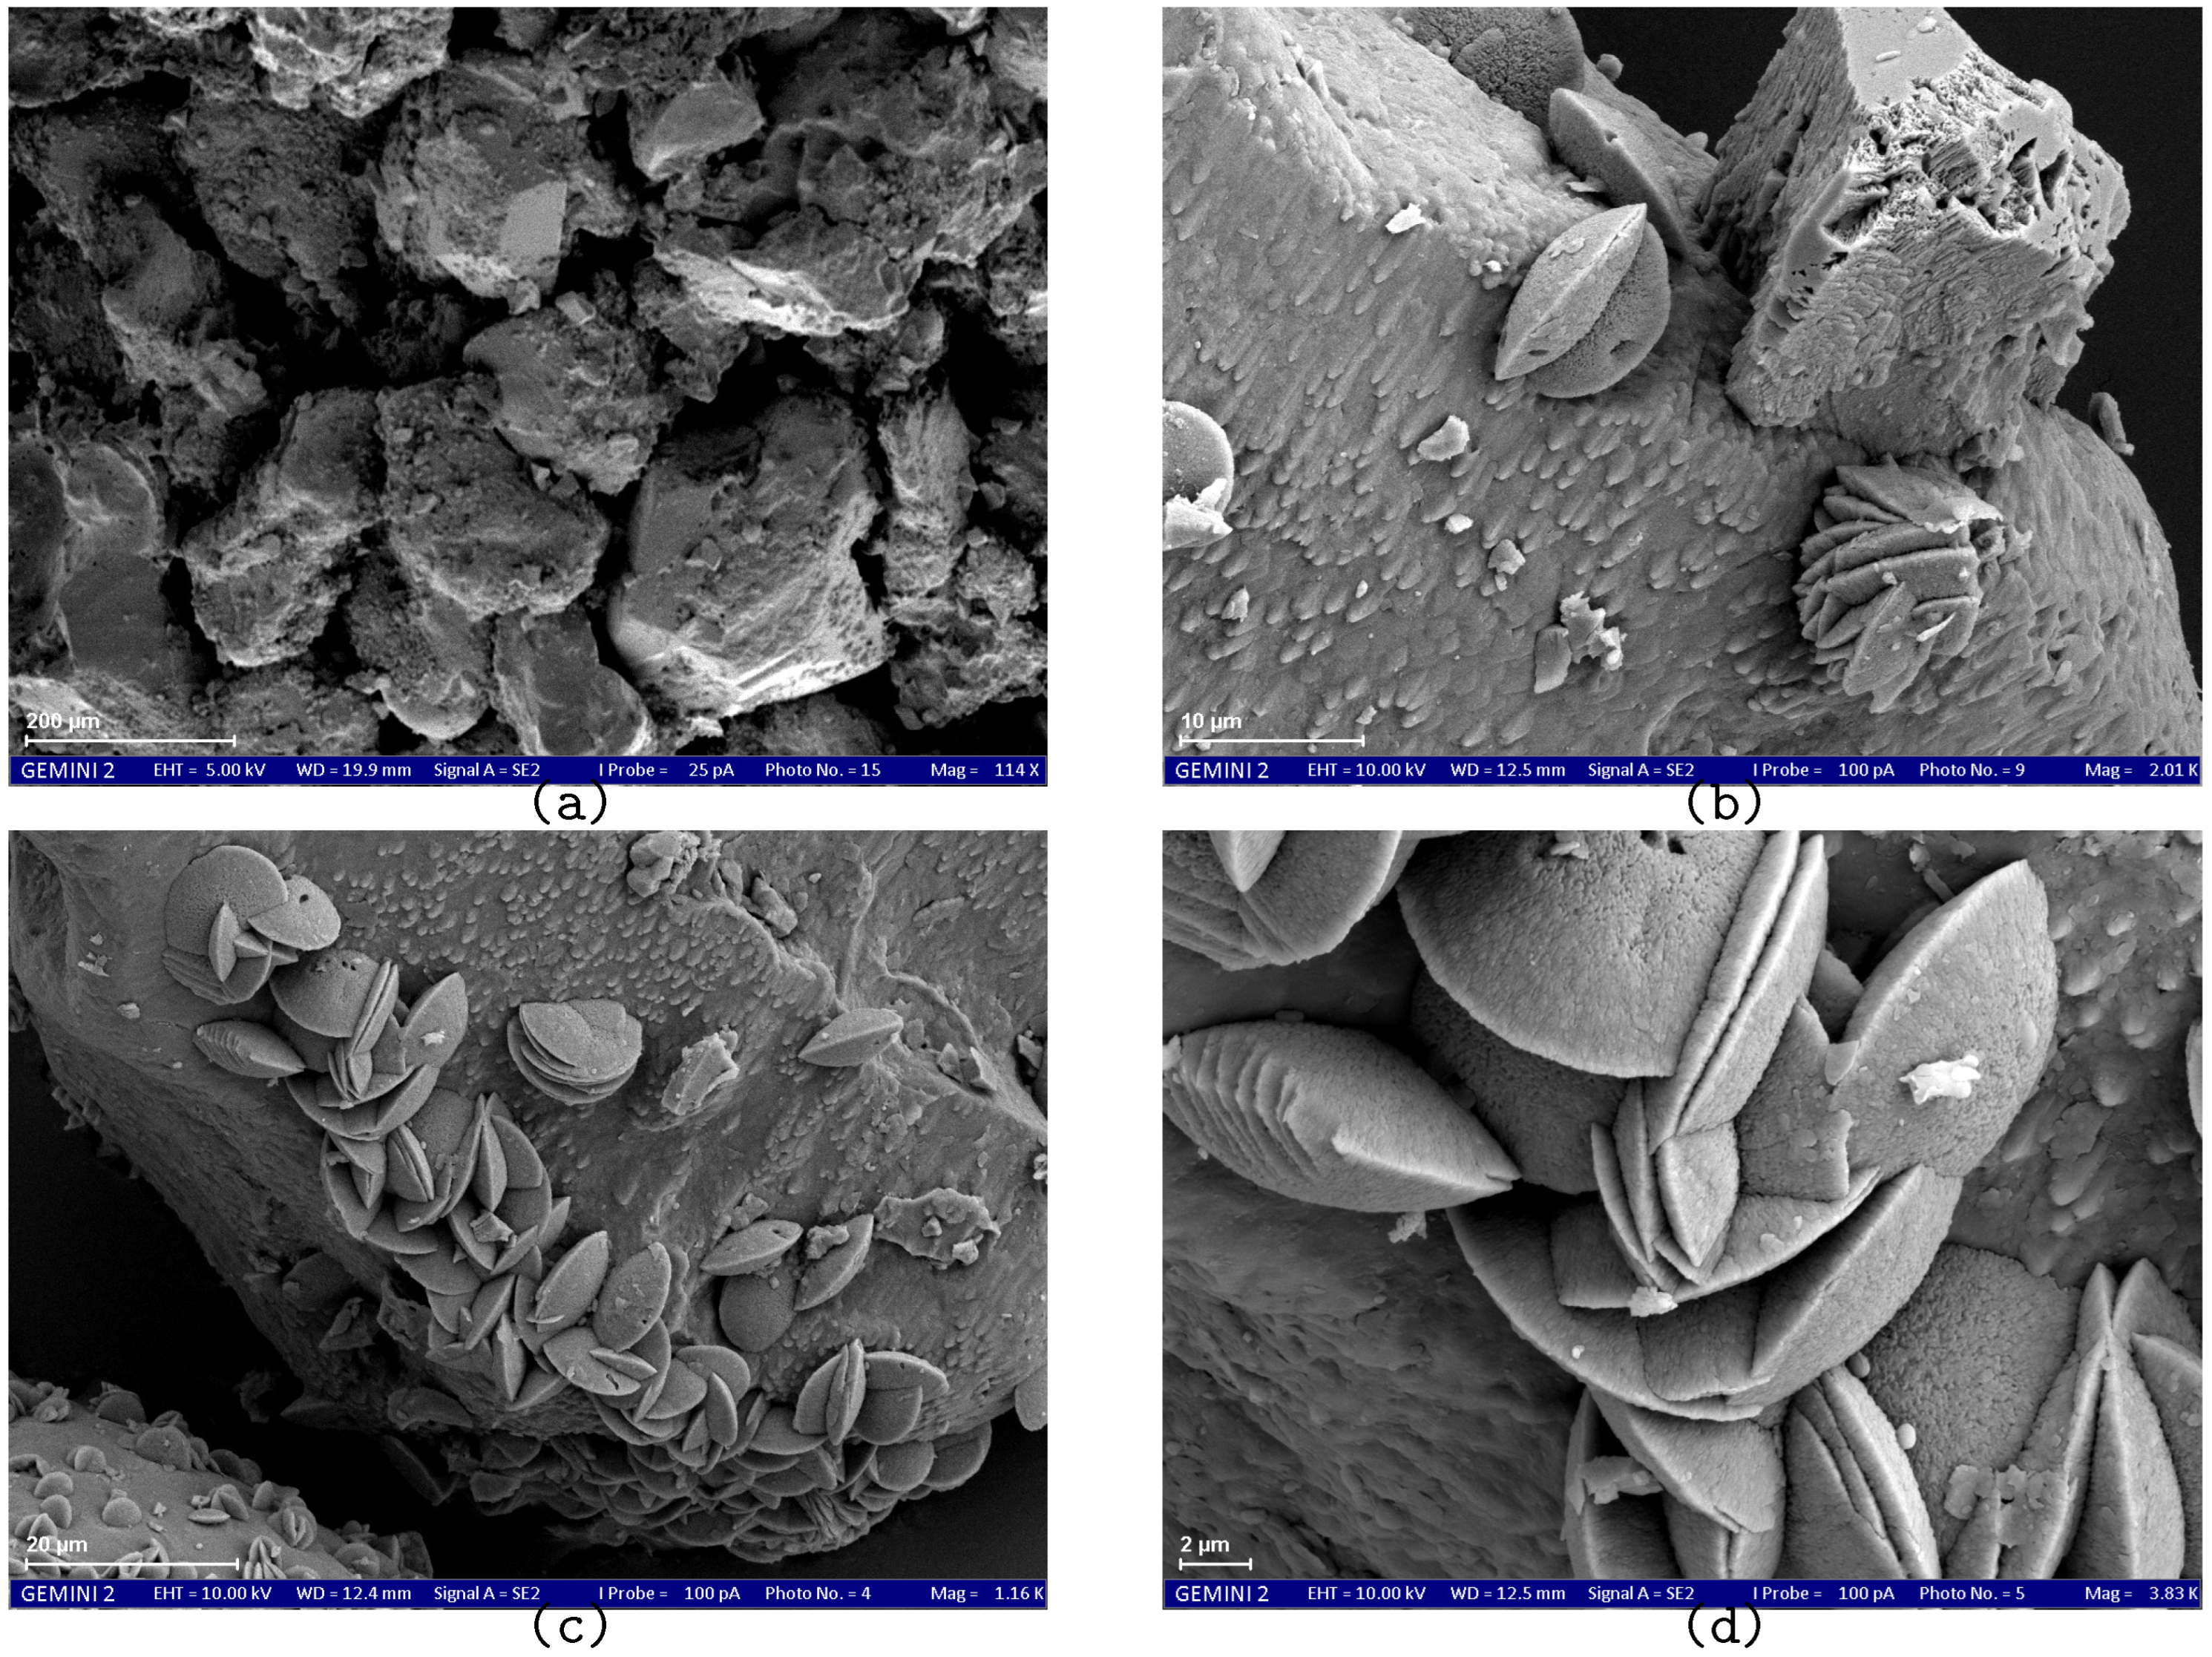
  • SEM results demonstrate the effect of the treatment method on the size and morphology of calcium carbonate crystals.
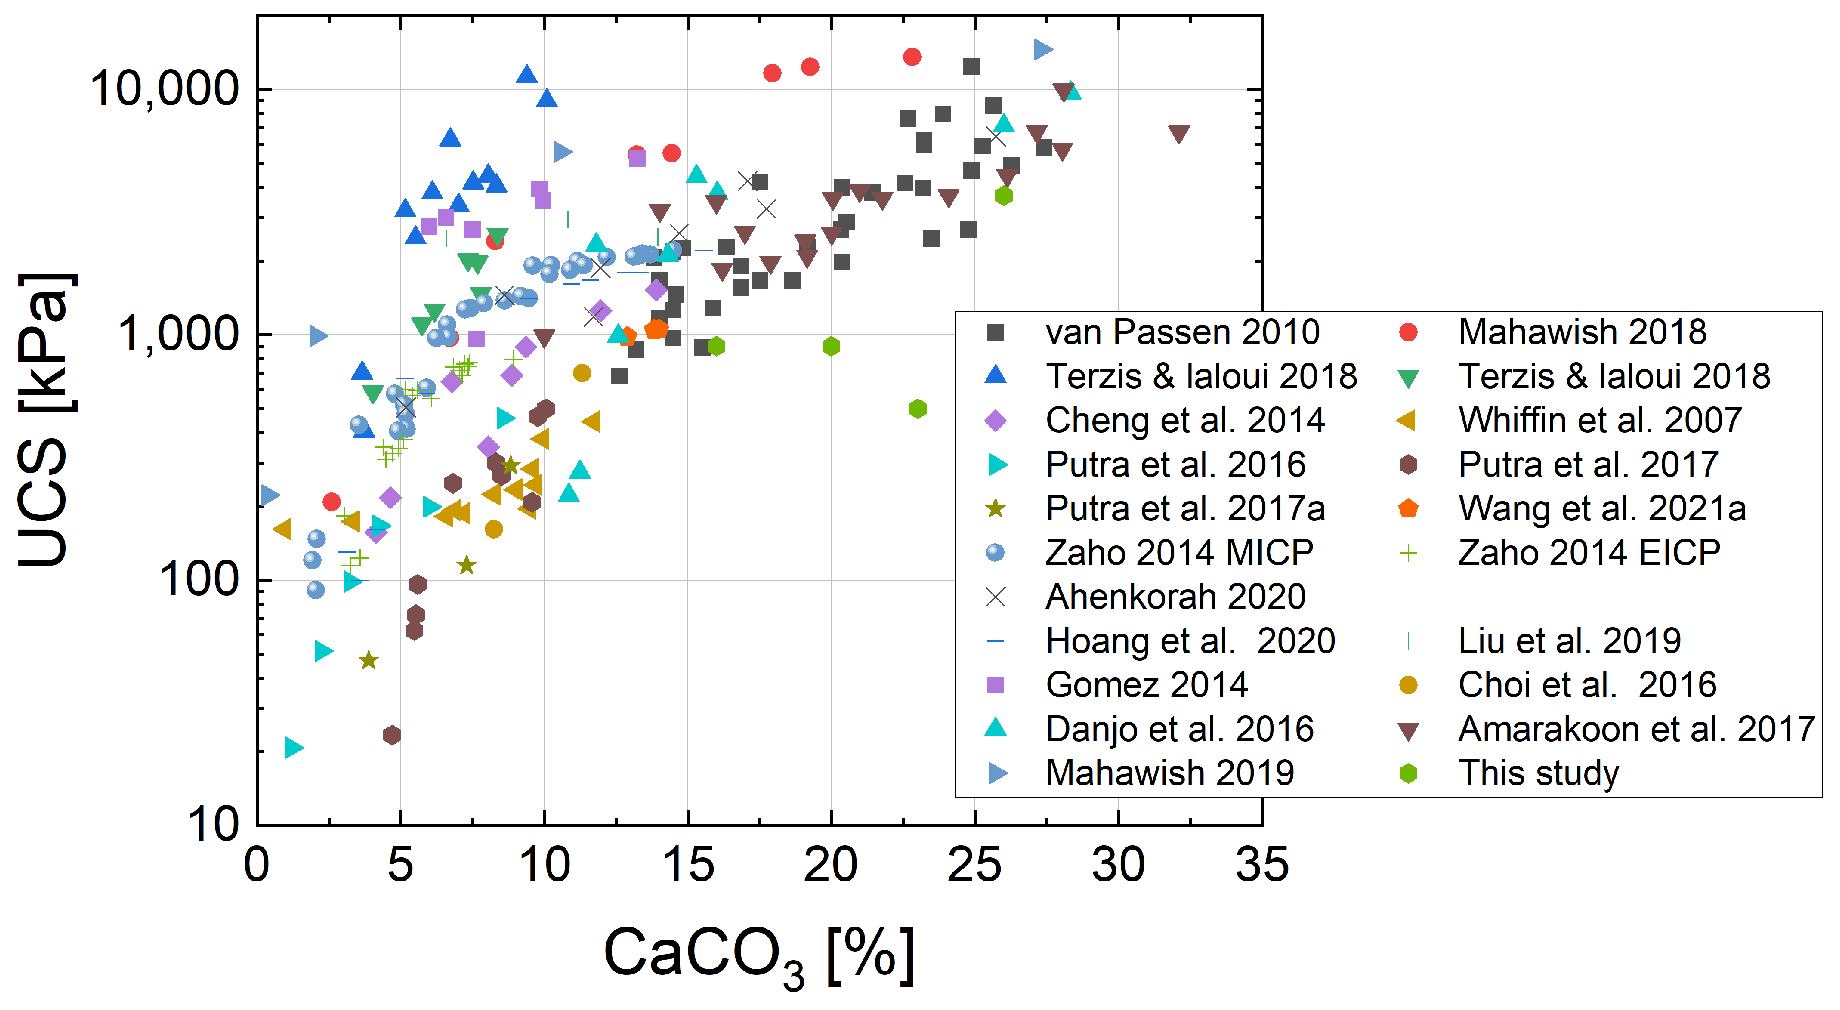
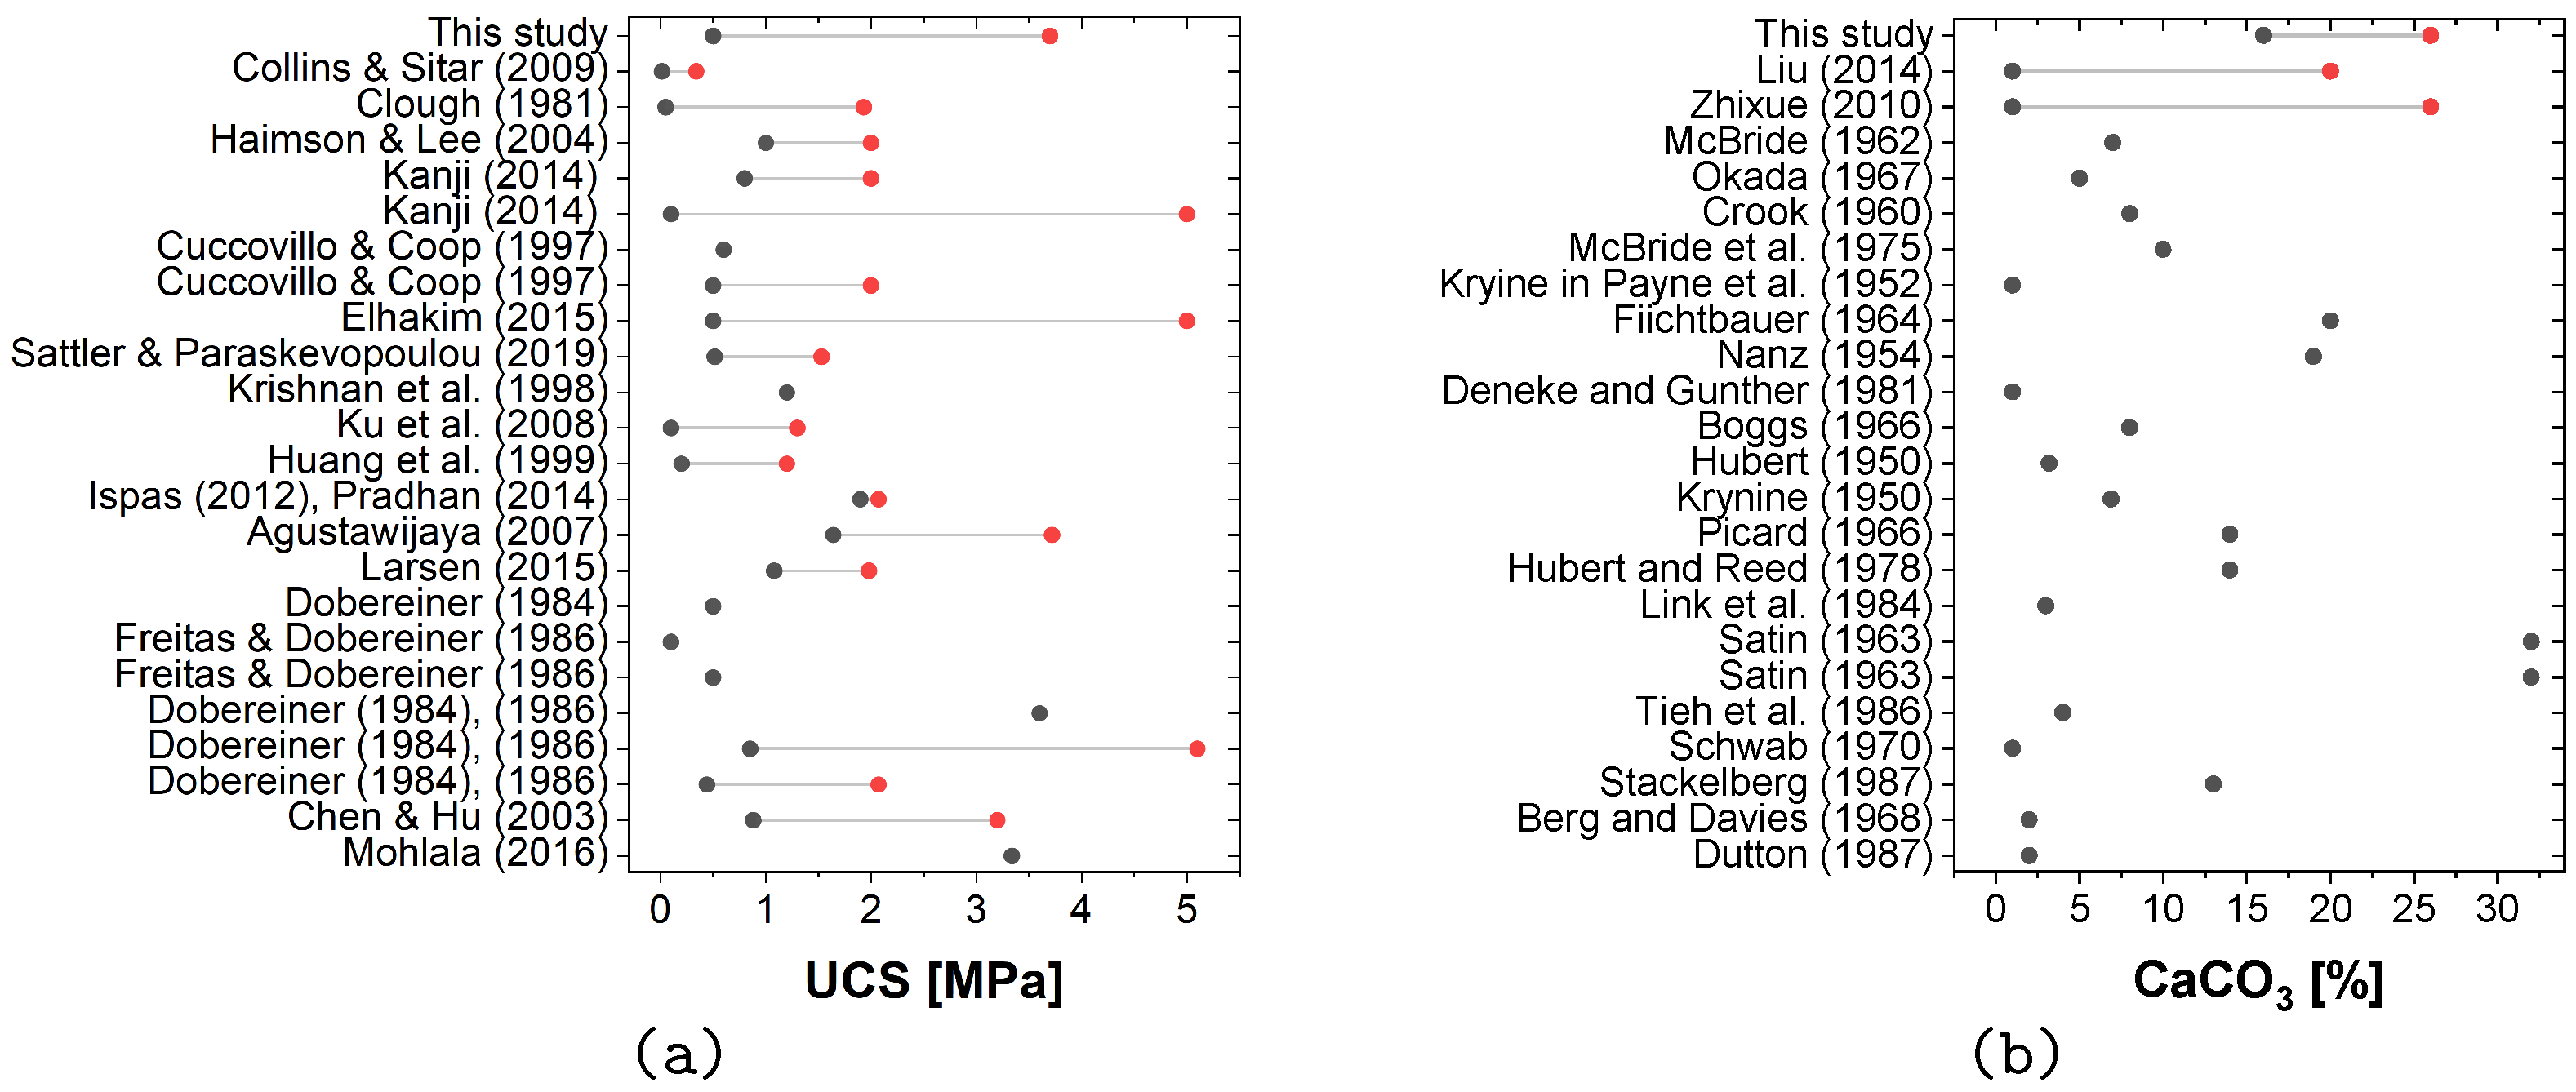
  • The results obtained for MICP-cemented samples were in line with the UCS values and calcium carbonate contents of naturally cemented sand.
The MICP method proposed in this study offers a possible time-efficient solution for enhancing the strength and the homogeneity of the precipitation distribution. The combined method may lay the groundwork for future research to reach higher strength by repeating the treatment with more cycles and to achieve an even higher homogeneity by flipping the sample inside the box containing the cementation solution upside down during the treatment to reverse the preferable flow induced by gravity. This study is limited to the laboratory scale with a few numbers of samples to mimic the behavior of naturally cemented soil. Further studies need to be carried out to examine the repeatability of the method, the compatibility with different grain size distributions of the soil, the cyclic behavior of the bio-cemented soil, the progressive bonding breakage, and the generalization for future engineering applications.

Author Contributions

J.Z.: Analysis, Writing, Editing, Methodology, Investigation; W.L.: Conceptualization, Methodology, Review, Supervision; A.A.L.: Conceptualization, Methodology, Review, Supervision; E.H.: Methodology; M.W.:Methodology; T.W.: Review, Supervision, Administration of the project. All authors have read and agreed to the published version of the manuscript.

Funding

The PhD research study of the first author (J.Z.) at Ruhr University Bochum was funded by the German Academic Exchange Service (DAAD) through the program “Research Grants–Doctoral Studies”.

Data Availability Statement

Not aplicable.

Acknowledgments

The first author would like to thank the German Academic Exchange Service (DAAD) for the financial support during her PHD research at Ruhr University Bochum, Germany.

Conflicts of Interest

The authors declare no conflict of interest.

References

  1. Airey, D.W. Triaxial testing of naturally cemented carbonate soil. J. Geotech. Eng. 1993, 119, 1379–1398. [Google Scholar] [CrossRef]
  2. Konstantinou, C.; Biscontin, G.; Jiang, N.J.; Soga, K. Application of microbially induced carbonate precipitation to form bio-cemented artificial sandstone. J. Rock Mech. Geotech. Eng. 2021, 13, 579–592. [Google Scholar] [CrossRef]
  3. Clough, W.; Sitar, N.; Bachus, R. Cemented Sands under Static Loading. J. Geotech. Eng. Div. 1981, 107, 799–817. [Google Scholar] [CrossRef]
  4. Ahmed Ali, K.; Ahmad, M.I.; Yusup, Y. Issues, Impacts, and Mitigations of Carbon Dioxide Emissions in the Building Sector. Sustainability 2020, 12, 7427. [Google Scholar] [CrossRef]
  5. Ashraf, M.S.; Hassan Shah, M.U.; Bokhari, A.; Hasan, M. Less is more: Optimising the biocementation of coastal sands by reducing influent urea through response surface method. J. Clean. Prod. 2021, 315, 128208. [Google Scholar] [CrossRef]
  6. Omoregie, A.I. A Feasibility Study to Scale-Up The Production of Sporosarcina pasteurii, Using Industrial-Grade Reagents, For Cost-Effective In-Situ Biocementation. Ph.D. Thesis, Swinburne University of Technology Sarawak Campus, Kuching, Malaysia, 2020. [Google Scholar]
  7. Ahenkorah, I.; Rahman, M.M.; Karim, M.R.; Teasdale, P.R. A comparison of mechanical responses for microbial-and enzyme-induced cemented sand. Geotech. Lett. 2020, 10, 559–567. [Google Scholar] [CrossRef]
  8. Whiffin, V.S. Microbial CaCO3 Precipitation for the Production of Biocement. Ph.D. Thesis, Murdoch University, Perth, Australia, 2004. [Google Scholar]
  9. Venuleo, S.; Laloui, L.; Terzis, D.; Hueckel, T.; Hassan, M. Microbially induced calcite precipitation effect on soil thermal conductivity. Geotech. Lett. 2016, 6, 39–44. [Google Scholar] [CrossRef] [Green Version]
  10. Kou, H.l.; Wu, C.; Jang, B.A.; Wang, D. Spatial Distribution of CaCO3 in Biocemented Sandy Slope Using Surface Percolation. J. Mater. Civ. Eng. 2021, 33, 6021004. [Google Scholar] [CrossRef]
  11. Cheng, L.; Shahin, M.A.; Cord-Ruwisch, R. Bio-cementation of sandy soil using microbially induced carbonate precipitation for marine environments. Géotechnique 2014, 64, 1010–1013. [Google Scholar] [CrossRef] [Green Version]
  12. Haouzi, F.Z.; Courcelles, B. Major applications of MICP sand treatment at multi-scale levels: A review. In Proceedings of the Geo Edmonton, Edmonton, AB, Canada, 23–26 September 2018. [Google Scholar]
  13. Xu, X.; Guo, H.; Cheng, X.; Li, M. The promotion of magnesium ions on aragonite precipitation in MICP process. Constr. Build. Mater. 2020, 263, 120057. [Google Scholar] [CrossRef]
  14. Abdel Gawwad, H.A.; Mohamed, S.A.E.A.; Mohammed, S.A. Impact of magnesium chloride on the mechanical properties of innovative bio-mortar. Mater. Lett. 2016, 178, 39–43. [Google Scholar] [CrossRef]
  15. Cui, M.J.; Lai, H.J.; Hoang, T.; Chu, J. One-phase-low-pH enzyme induced carbonate precipitation (EICP) method for soil improvement. Acta Geotech. 2021, 16, 481–489. [Google Scholar] [CrossRef]
  16. Cheng, L.; Shahin, M.A.; Chu, J. Soil bio-cementation using a new one-phase low-pH injection method. Acta Geotech. 2019, 14, 615–626. [Google Scholar] [CrossRef] [Green Version]
  17. Xiao, P.; Liu, H.; Stuedlein, A.W.; Evans, T.M.; Xiao, Y. Effect of relative density and biocementation on cyclic response of calcareous sand. Can. Geotech. J. 2019, 56, 1849–1862. [Google Scholar] [CrossRef] [Green Version]
  18. Yasuhara, H.; Neupane, D.; Hayashi, K.; Okamura, M. Experiments and predictions of physical properties of sand cemented by enzymatically-induced carbonate precipitation. Soils Found. 2012, 52, 539–549. [Google Scholar] [CrossRef] [Green Version]
  19. Mujah, D.; Shahin, M.A.; Cheng, L. State-of-the-Art Review of Biocementation by Microbially Induced Calcite Precipitation (MICP) for Soil Stabilization. Geomicrobiol. J. 2017, 34, 524–537. [Google Scholar] [CrossRef]
  20. Centeno Dias, F.; Borges, I.; Duarte, S.O.; Monteiro, G.A.; Cardoso, R. Comparison of experimental techniques for biocementation of sands considering homogeneous volume distribution of precipitated calcium carbonate. In E3S Web of Conferences; EDP Sciences: Les Ulis, France, 2020; Volume 195. [Google Scholar] [CrossRef]
  21. Terzis, D.; Hicher, P.; Laloui, L. Benefits and drawbacks of applied direct currents for soil improvement via carbonate mineralization. In E3S Web of Conferences; EDP Sciences: Les Ulis, France, 2020; Volume 195. [Google Scholar] [CrossRef]
  22. Zhao, Q.; Li, L.; Li, C.; Li, M.; Amini, F.; Zhang, H. Factors affecting improvement of engineering properties of MICP-treated soil catalyzed by bacteria and urease. J. Mater. Civ. Eng. 2014, 26, 4014094. [Google Scholar] [CrossRef]
  23. Wen, K.; Li, Y.; Liu, S.; Bu, C.; Li, L. Development of an Improved Immersing Method to Enhance Microbial Induced Calcite Precipitation Treated Sandy Soil through Multiple Treatments in Low Cementation Media Concentration. Geotech. Geol. Eng. 2019, 37, 1015–1027. [Google Scholar] [CrossRef]
  24. Wichtmann, T.; Triantafyllidis, T. An experimental database for the development, calibration and verification of constitutive models for sand with focus to cyclic loading: Part I—Tests with monotonic loading and stress cycles. Acta Geotech. 2016, 11, 739–761. [Google Scholar] [CrossRef]
  25. Wichtmann, T.; Triantafyllidis, T. An experimental database for the development, calibration and verification of constitutive models for sand with focus to cyclic loading: Part II—Tests with strain cycles and combined loading. Acta Geotech. 2016, 11, 763–774. [Google Scholar] [CrossRef]
  26. Zwietering, M.H.; Jongenburger, I.; Rombouts, F.M.; Van’t Riet, K. Modeling of the bacterial growth curve. Appl. Environ. Microbiol. 1990, 56, 1875–1881. [Google Scholar] [CrossRef]
  27. Cui, M.J.; Zheng, J.J.; Zhang, R.J.; Lai, H.J. Soil bio-cementation using an improved 2-step injection method. Arab. J. Geosci. 2020, 13. [Google Scholar] [CrossRef]
  28. Terzis, D.; Bernier-Latmani, R.; Laloui, L. Fabric characteristics and mechanical response of bio-improved sand to various treatment conditions. Geotech. Lett. 2016, 6, 1–8. [Google Scholar] [CrossRef] [Green Version]
  29. ASTM. Standard Test Method of Unconfined Compressive Strength of Intact Rock Core Specimens; ASTM Publication: West Conshohocken, PA, USA, 1986. [Google Scholar]
  30. Rebata-Landa, V. Microbial Activity in Sediments: Effects on Soil Behavior. Ph.D. Thesis, Georgia Institute of Technology, Atlanta, GA, USA, 2007. [Google Scholar]
  31. Li, Y.; Guo., Z.; Yang, Z.; Li, Y.; Xu, M. Experimental study on the reaction process and engineering characteristics of marine calcareous sand reinforced by eco-friendly methods. Appl. Ocean. Res. 2023, 138, 103641. [Google Scholar] [CrossRef]
  32. Karimian, A.; Hassanlourad, M.; Karimi, G. Insight into the Properties of Surface Percolated Biocemented Sand. Geomicrobiology 2020, 38, 138–149. [Google Scholar] [CrossRef]
  33. Al Qabany, A.; Soga, K.; Santamarina, C. Factors affecting efficiency of microbially induced calcite precipitation. J. Geotech. Geoenviron. Eng. 2012, 138, 992–1001. [Google Scholar] [CrossRef]
  34. Lai, H.J.; Cui, M.J.; Wu, S.F.; Yang, Y.; Chu, J. Retarding effect of concentration of cementation solution on biocementation of soil. Acta Geotech. 2021, 16, 1457–1472. [Google Scholar] [CrossRef]
  35. Liu, L.; Chen, Y.; Gao, Y.; Liu, B.; Zhou, Y.; Li, C. Effect of urease enrichment degree of multiple sources of urease on bio-cementation efficacy via enzyme-induced carbonate precipitation. Can. Geotech. J. 2023. [Google Scholar] [CrossRef]
  36. Fu, T.; Saracho, A.C.; Haigh, S.K. Microbially induced carbonate precipitation (MICP) for soil strengthening: A comprehensive review. Biogeotechnics 2023, 1, 100002. [Google Scholar] [CrossRef]
  37. Chu, J.; Ivanov, V.; Naeimi, M.; Stabnikov, V.; Liu, H.L. Optimization of calcium-based bioclogging and biocementation of sand. Acta Geotech. 2014, 9, 277–285. [Google Scholar] [CrossRef]
  38. Yang, X.; Xiao, W.; Ma, G.; He, X.; Wu, H.; Shi, J. Mechanical Performance of Biotreated Sandy Road Bases. J. Perform. Constr. Facil. 2022, 36, 4021111. [Google Scholar] [CrossRef]
  39. Mujah, D.; Cheng, L.; Shahin, M.A. Microstructural and Geomechanical Study on Biocemented Sand for Optimization of MICP Process. J. Mater. Civ. Eng. 2019, 31, 04019025. [Google Scholar] [CrossRef] [Green Version]
  40. Cheng, L.; Cord-Ruwisch, R.; Shahin, M.A. Cementation of sand soil by microbially induced calcite precipitation at various degrees of saturation. Can. Geotech. J. 2013, 50, 81–90. [Google Scholar] [CrossRef] [Green Version]
  41. Fang, X.; Yang, Y.; Chen, Z.; Liu, H.; Xiao, Y.; Shen, C. Influence of Fiber Content and Length on Engineering Properties of MICP-Treated Coral Sand. Geomicrobiol. J. 2020, 37, 582–594. [Google Scholar] [CrossRef]
  42. Basu, A.; Mishra, D.; Roychowdhury, K. Rock failure modes under uniaxial compression, Brazilian, and point load tests. Bull. Eng. Geol. Environ. 2013, 72, 457–475. [Google Scholar] [CrossRef]
  43. Chakraborty, S.; Bisai, R.; Palaniappan, S.K.; Pal, S.K. Failure modes of rocks under uniaxial compression tests: An experimental approach. J. Adv. Geotech. Eng. 2019, 2, 1–8. [Google Scholar]
  44. Yu, T.; Souli, H.; Pechaud, Y.; Fleureau, J.M. Review on engineering properties of micp-treated soils. Geomech. Eng. 2021, 27, 13–30. [Google Scholar] [CrossRef]
  45. Yin, J.; Wu, J.X.; Zhang, K.; Shahin, M.A.; Cheng, L. Comparison between MICP-Based Bio-Cementation Versus Traditional Portland Cementation for Oil-Contaminated Soil Stabilisation. Sustainability 2022, 15, 434. [Google Scholar] [CrossRef]
  46. Rahman, M.M.; Hora, R.N.; Ahenkorah, I.; Beecham, S.; Karim, M.R.; Iqbal, A. State-of-the-Art Review of Microbial-Induced Calcite Precipitation and Its Sustainability in Engineering Applications. Sustainability 2020, 12, 6281. [Google Scholar] [CrossRef]
  47. Putra, H.; Yasuhara, H.; Erizal; Sutoyo; Fauzan, M. Review of enzyme-induced calcite precipitation as a ground-improvement technique. Infrastructures 2020, 5, 66. [Google Scholar] [CrossRef]
  48. Mahawish, A.; Bouazza, A.; Gates, W.P. Unconfined compressive strength and visualization of the microstructure of coarse sand subjected to different biocementation levels. J. Geotech. Geoenviron. Eng. 2019, 145, 4019033. [Google Scholar] [CrossRef]
  49. Hoang, T.; Alleman, J.; Cetin, B.; Choi, S.G. Engineering properties of biocementation coarse-and fine-grained sand catalyzed by bacterial cells and bacterial enzyme. J. Mater. Civ. Eng. 2020, 32, 4020030. [Google Scholar] [CrossRef]
  50. Liu, L.; Liu, H.; Stuedlein, A.W.; Evans, T.M.; Xiao, Y. Strength, stiffness, and microstructure characteristics of biocemented calcareous sand. Can. Geotech. J. 2019, 56, 1502–1513. [Google Scholar] [CrossRef]
  51. Gomez, M.G.; Anderson, C.M.; DeJong, J.T.; Nelson, D.C.; Lau, X.H. Stimulating in situ soil bacteria for bio-cementation of sands. In Proceedings of the Geo-Congress 2014: Geo-characterization and Modeling for Sustainability, Atlanta, GA, USA, 23–26 February 2014; pp. 1674–1682. [Google Scholar]
  52. Choi, S.G.; Wang, K.; Chu, J. Properties of biocemented, fiber reinforced sand. Constr. Build. Mater. 2016, 120, 623–629. [Google Scholar] [CrossRef]
  53. Danjo, T.; Kawasaki, S. Microbially induced sand cementation method using Pararhodobacter sp. strain SO1, inspired by beachrock formation mechanism. Mater. Trans. 2016, 57, 428–437. [Google Scholar] [CrossRef] [Green Version]
  54. Amarakoon, G.; Kawasaki, S. Factors Affecting Sand Solidification Using MICP with Pararhodobacter sp. Mater. Trans. 2017, 59, 72–81. [Google Scholar] [CrossRef] [Green Version]
  55. Putra, H.; Yasuhara, H.; Kinoshita, N.; Neupane, D.; Lu, C.W. Effect of magnesium as substitute material in enzyme-mediated calcite precipitation for soil-improvement technique. Front. Bioeng. Biotechnol. 2016, 4, 37. [Google Scholar] [CrossRef] [Green Version]
  56. Putra, H.; Yasuhara, H.; Kinoshita, N.; Hirata, A. Application of magnesium to improve uniform distribution of precipitated minerals in 1-m column specimens. Geomech. Eng. 2017, 12, 803–813. [Google Scholar] [CrossRef]
  57. Putra, H.; Yasuhara, H.; Kinoshita, N. Applicability of natural zeolite for NH-forms removal in enzyme-mediated calcite precipitation technique. Geosciences 2017, 7, 61. [Google Scholar] [CrossRef] [Green Version]
  58. Wang, Y.; Li, C.; Wang, C.; Gao, Y. Improving the Erosion Resistance Performance of Pisha Sandstone Weathered Soil Using MICP Technology. Crystals 2021, 11, 1112. [Google Scholar] [CrossRef]
  59. Whiffin, V.S.; Van Paassen, L.A.; Harkes, M.P. Microbial carbonate precipitation as a soil improvement technique. Geomicrobiol. J. 2007, 24, 417–423. [Google Scholar] [CrossRef]
  60. van Paassen, L.A.; Ghose, R.; van der Linden, T.J.M.; van der Star, W.R.L.; van Loosdrecht, M.C.M. Quantifying Biomediated Ground Improvement by Ureolysis: Large-Scale Biogrout Experiment. J. Geotech. Geoenviron. Eng. 2010, 136, 1721–1728. [Google Scholar] [CrossRef]
  61. Collins, B.D.; Sitar, N. Geotechnical properties of cemented sands in steep slopes. J. Geotech. Geoenviron. Eng. 2009, 135, 1359–1366. [Google Scholar] [CrossRef]
  62. Liu, S.; Huang, S.; Shen, Z.; Lü, Z.; Song, R. Diagenetic fluid evolution and water-rock interaction model of carbonate cements in sandstone: An example from the reservoir sandstone of the Fourth Member of the Xujiahe Formation of the Xiaoquan-Fenggu area, Sichuan Province, China. Sci. China Earth Sci. 2014, 57, 1077–1092. [Google Scholar] [CrossRef]
  63. Sun, Z.; Sun, Z.; Lu, H.; Yin, X. Characteristics of carbonate cements in sandstone reservoirs: A case from Yanchang Formation, middle and southern Ordos Basin, China. Pet. Explor. Dev. 2010, 37, 543–551. [Google Scholar] [CrossRef]
  64. McBride, E.F. Quartz cement in sandstones: A review. Earth-Sci. Rev. 1989, 26, 69–112. [Google Scholar] [CrossRef]
  65. Terzis, D.; Laloui, L. Cell-free soil bio-cementation with strength, dilatancy and fabric characterization. Acta Geotech. 2019, 14, 639–656. [Google Scholar] [CrossRef]
  66. Al-Thawadi, S. High Strength In-Situ Biocementation of Soil by Calcite Precipitating Locally Isolated Ureolytic Bacteria. Ph.D. Dissertation, Murdoch University, Perth, Australia, 2008. [Google Scholar]
  67. Terzis, D.; Hicher, P.; Laloui, L. Direct currents stimulate carbonate mineralization for soil improvement under various chemical conditions. Sci. Rep. 2020, 10, 17014. [Google Scholar] [CrossRef]
  68. Omoregie, A.I.; Palombo, E.A.; Ong, D.E.L.; Nissom, P.M. A feasible scale-up production of Sporosarcina pasteurii using custom-built stirred tank reactor for in-situ soil biocementation. Biocatal. Agric. Biotechnol. 2020, 24, 101544. [Google Scholar] [CrossRef]
  69. Al-Thawadi, S.; Cord-Ruwisch, R. Calcium carbonate crystals formation by ureolytic bacteria isolated from Australian soil and sludge. J. Adv. Sci. Eng. Res. 2012, 2, 12–26. [Google Scholar]
  70. Bosak, T.; Newman, D.K. Microbial kinetic controls on calcite morphology in supersaturated solutions. J. Sediment. Res. 2005, 75, 190–199. [Google Scholar] [CrossRef] [Green Version]
Figure 1. Grain size distribution curve for Karlsruhe fine sand.
Geotechnics 03 00036 g001
Figure 2. Growth curve of Sporsarcina pastuerii.
Geotechnics 03 00036 g002
Figure 3. A comparison of the optical density at various wavelengths.
Geotechnics 03 00036 g003
Figure 4. Schematic representation of bio-cementation methods. (a) Percolation method, (b) submerging method.
Geotechnics 03 00036 g004
Figure 5. (a) Syringe mold, (b) geotextile mold.
Geotechnics 03 00036 g005
Figure 6. Flow chart explaining the methodology for preparing bio-cemented sand and Portland-cemented sand samples.
Geotechnics 03 00036 g006
Figure 7. Results of UCS for bio-cemented samples using (a) the percolation method and (b) the combined method.
Geotechnics 03 00036 g007
Figure 8. Results of UCS for Portland-cemented samples with different levels of cementation.
Geotechnics 03 00036 g008
Figure 9. Failure modes for bio-cemented samples (a) PF 1 C l , (b) PF 2 C l , (c) PGC h using the percolation method, and (d) P-S 1 using the combined method.
Geotechnics 03 00036 g009
Figure 10. Failure modes for Portland-cemented samples with different levels of cementation: (a) 5%; (b) 10%; (c) 15%; (d) 20%; (e) 25%; and (f) 30%.
Geotechnics 03 00036 g010
Figure 11. Calcium carbonate distribution in bio-cemented samples (a) PF 1 C l , (b) PF 2 C l , (c) PGC h using the percolation method, and (d) P-S 1 using the combined method.
Geotechnics 03 00036 g011
Figure 12. Relationship between calcium carbonate or Portland cement content and UCS.
Geotechnics 03 00036 g012
Figure 13. SEM micrographs for sample PF 1 C l : (a) void space at a scale of 100 μ m, (b) calcium carbonate crystals at a scale of 20 μ m, and (c) rhombohedral calcium carbonate crystals with holes on the surface at a scale of 10 μ m.
Geotechnics 03 00036 g013
Figure 14. SEM micrographs for sample PF 2 C l : (a) void space at a scale of 100 μ m, (b) group of calcium carbonate crystals at a scale of 20 μ m, (c) calcium carbonate crystals at contact point at a scale of 20 μ m, and (d) rhombohedral shape of calcium carbonate crystals at a scale of 2 μ m.
Geotechnics 03 00036 g014
Figure 15. SEM micrographs for sample PGC h : (a) void space at a scale of 100 μ m, (b) group of rhombohedral calcium carbonate crystals forming a flower-like shape at a scale of 20 μ m, (c) series of calcium carbonate crystals at a scale of 20 μ m, and (d) series of calcium carbonate crystals with higher magnification at a scale of 10 μ m.
Geotechnics 03 00036 g015
Figure 16. SEM micrographs for sample P-S 1 using the combined method: (a) void space at a scale of 200 μ m, (b) rhombohedral and flower-like shape of calcium carbonate crystals at a scale of 10 μ m, (c) series of spherical calcium carbonate crystals at a scale of 20 μ m, and (d) a hole on spherical calcium carbonate crystals at a scale of 2 μ m.
Geotechnics 03 00036 g016
Figure 17. Schematic representation of different failure modes observed in the previous literature.
Geotechnics 03 00036 g017
Figure 18. Compilation of data from previous research on the relationship between UCS and level of cementation of MICP-treated samples [22,40,46,47,48,49,50,51,52,53,54,55,56,57,58,59].
Geotechnics 03 00036 g018
Figure 19. Compiled data for naturally cemented sand and sandstones: (a) UCS and (b) calcium carbonate content [2,3,61,62,63,64].
Geotechnics 03 00036 g019
Table 1. Ingredients of the growth medium for bacteria.
Peptone from CaseinSoy MealNaClUreaAgarWater
15 g5 g5 g20 g15 g1 L
Table 2. Ingredients of the cementation solution.
UreaCalcium ChlorideAmmonium ChlorideSodium CarbonateNutrient Broth
0.25 M0.25 M0.187 M2.12 g/L3 g/L
0.5 M0.5 M0.187 M2.12 g/L3 g/L
Table 3. Ingredients of the loading solutions.
Loading SolutionUreaCalcium ChlorideAmmonium ChlorideNutrient Broth
F 1 0.5 M00.187 M3 g/L
F 2 00.1 M0.187 M3 g/L
Table 4. Summary of the bio-cemented samples included in the experimental program.
SpecimenMethodStrategyCS
PF 1 C l PercolationPercolating F 1 0.25 M
FP 2 C l PercolationSuspending in F 2 0.25 M
PGC h PercolationSuspending in G0.5 M
P-S 1 Combined-0.25 M
Table 5. Young’s modulus for bio-cemented samples.
MethodSpecimen q u (MPa) ε f (%) E f * (MPa)
Percolation PF 1 C l 0.94.023
Percolation PF 2 C l 0.92.635
Percolation PGC h 0.52.418
Combined P-S 1 3.70.8467
* E f = q u / ε f .
Table 6. Young’s modulus for Portland-cemented samples.
Cement Content (%) q u (MPa) ε f (%) E f (MPa)
50.60.4128
101.60.9169
154.41.0453
207.71.1722
2512.81.21071
3017.21.51161
Disclaimer/Publisher’s Note: The statements, opinions and data contained in all publications are solely those of the individual author(s) and contributor(s) and not of MDPI and/or the editor(s). MDPI and/or the editor(s) disclaim responsibility for any injury to people or property resulting from any ideas, methods, instructions or products referred to in the content.

