Article

Empirical Equations Expressing the Effects of Measured Suction on the Compaction Curve for Sandy Soils Varying Fines Content

by
Bhargavi Chowdepalli
and
Kenji Watanabe
*
Department of Civil Engineering, University of Tokyo, Tokyo 113-8656, Japan
*
Author to whom correspondence should be addressed.
Geotechnics 2023, 3(3), 760-780; https://doi.org/10.3390/geotechnics3030042
Submission received: 5 July 2023 / Revised: 31 July 2023 / Accepted: 4 August 2023 / Published: 8 August 2023

Abstract

:
To effectively apply various soil types for embankments, understanding their compaction characteristics is crucial. One crucial factor affecting compaction is suction, which plays a significant role as it is typically performed under unsaturated conditions. Suction varies with soil density, water content, and fines content. This study directly measures suction after soil compaction using the triaxial apparatus, unlike the Soil water characteristic curve (SWCC), assessing its impact on compaction characteristics. Immediate suction measurement after compaction provides apparent suction, resembling on-site conditions with open pore air pressure. Comparing SWCC with apparent suction at each compacted state reveals that suction and air entry value increase with initial density, positively impacting compaction. Notably, apparent suction aligns better with wetting process suction from the SWCC due to added water during specimen preparation. Empirical equations are derived to obtain suction contours across various density and saturation ranges, aiding in understanding suction variations on the compaction curve. Even slight variations in saturation causes noticeable changes in apparent suction during higher compaction efforts, affecting soil compaction characteristics. Therefore, the precise control of saturation control is needed to achieve desired properties of compacted soil, especially at higher compaction efforts and with various soil types. This understanding significantly impacts the mechanical behavior of unsaturated soils.

1. Introduction

In modern times, there is an increasing demand for high-performance embankment structures that exhibit greater stability. To achieve this, it is crucial to properly compact the different types of soils used in constructing such embankments. The conventional soil compaction procedure controls the dry density ( ρ d ) and the water content (w) based on the compaction curve by laboratory compaction tests on the soil sample using a certain compaction energy level CEL. However, recent research of [1,2] suggests that the dry density and degree of saturation ( S r ) are key indicators. Since the compaction work at the site is usually performed under unsaturated conditions, the compaction effect, strength, and deformation characteristics of compacted soil are considered to be greatly influenced by “suction”. The study also mentions changes in the degree of saturation strongly influence the microstructure of the soil, which reflects the suction at the time of compaction. This shows the need to understand the soil suction according to the degree of saturation in the compacted state.
Understanding the effect of suction and the degree of saturation on compaction for different types of soils has opened the door to developing unsaturated soil mechanics. In the past, several methods have been developed to measure the suction in the field and in terms of the Soil Water Characteristic Curve (SWCC) [3]. Matric suction, ( s = u a u w ) has been considered an important variable in defining the state of stress in unsaturated soil. Consequently, significant efforts have been made to control and measure matric suction precisely.
In general, the relationship between soil suction and volumetric water content is widely used in unsaturated soil mechanics, and it is called the soil water characteristics curve (SWCC) or soil water retention curve (SWRC) [4]. The volumetric water content ( θ w = V w / V ) is often replaced by gravimetric water content or the degree of saturation, S r . The SWCC is one of the most important physical properties of unsaturated soils since there is a relationship between the SWCC and the shear strength of unsaturated soil [3,5,6]. The suction dependency on the mechanical behavior of unsaturated soils has been discussed by many researchers [7,8]. Therefore, to encourage geotechnical engineers to implement unsaturated soil mechanics theory in practice, several methods for the prediction of SWCC have been developed.
Some of the techniques are Axis translation techniques [9] and Hanging column techniques [10]. The axis translation technique does not have the ability to measure air pressure under atmospheric conditions, whereas the hanging column technique imposes the suction in terms of negative pressure for supplying/draining from the saturated sample to the unsaturated state. In addition, this technique primarily utilizes ceramic disks, which can take several months to achieve the equilibrium stage needed to obtain the SWCC [11]. Neither of these methods directly measures suction values during soil compaction, which represents unsaturated field conditions.
In spite of that, it is a fact that several researchers have investigated the impact of density on SWRCs using the axis translation technique, particularly over a wide range of suction values. As it has been established by [12] that the soil-water retention curve (SWRC), which relates suction and the degree of saturation, is primarily influenced by the current density rather than the stress state.
Romero et al. [13] analyzed wetting and drying data of Boom clay with two different densities using the axis translation technique and vapor equilibrium procedures across a suction range of 0.01 to 200 MPa. Birle et al. [14] also explored the effects of initial water content and dry density of a compacted Lias-clay on SWRCs within the suction range of 1 to 200 MPa. Salager et al. [15] studied the impact of water retention behavior of deformable soils with varying densities in the suction range of 0.01 to 300 MPa. However, these studies mainly focused on the macroscopic behavior of SWRCs on clayey-type soils and did not extensively investigate the entire suction range. Therefore, it is essential to continue exploring the relationship between soil density and SWRCs, particularly over a wide range of low suction values for sandy soils.
Although there have been some direct measurements of suction conducted by [16,17,18], using the tensiometer indicating the similar conditions as the field. However, these studies mostly dealt with the SWCCs for sandy clay determined by means of high suction tensiometers. In summary, there is a lack of studies that have investigated changes in suction with density due to compaction when using embankment banking material (sandy soils).
To the author’s knowledge, the question of the precise measurement of suction under the conditions of the compaction at the site is still open. Very limited research is done on: 1. Measurement of the suction in the low suction range for sandy soils; and 2. Understanding the influence of the degree of saturation on suction in compaction curve; 3. Verifying the effect of suction on soil compaction characteristics and compaction curves.
The objective of the current study is to develop a methodology to evaluate suction directly after compacting at specific density and degree of saturation in a time-efficient manner. As indicated by [19,20], the equilibrium time required for SWCC measurements using the membrane filter is much shorter than using the ceramic disk. Also, they proved that the SWCC obtained through the membrane filter technique is more efficient and reliable. Therefore, the current study utilizes the membrane filter technique to obtain the SWCC in a time-efficient manner (takes 14–20 days to obtain SWCC). Additionally, the current study develops a methodology to evaluate suction directly after compacting at specific density and degree of saturation using the same membrane filter technique in the triaxial apparatus. The suction obtained using the membrane filter technique from the two different methods is compared while varying the soil type and compaction level to understand the disparity. This comparison would help to understand how suction changes with compaction in the field, which could be different from the drying/wetting curve of SWCC. Such a trial for measuring suction in two different methods using the membrane filter technique is a unique contribution of this study. Using the suction obtained from the triaxial apparatus, empirical equations are derived to develop the suction contours on the compaction curve. The findings based on suction contours provide insights into the influence of suction on compaction characteristics and compaction curves, providing an accurate prediction of soil behavior. Such understanding would help to propose an effective compaction procedure for practice, considering the significance and management of the degree of saturation in relation to soil suction.

2. Materials and Methods

2.1. Materials

The current study employed two different materials, namely Inagi sand and Katori sand. Inagi sand used in this study is a type of natural deposit sand that has been extensively studied due to the large-scale construction plan of Tama New Town in the 1960s in Tokyo [20]. Katori sand is also a natural deposit of sand that is collected in larger quantities for a wide range of testing. Essentially, the two testing materials used in the current study are actual banking materials that were collected from the earthwork construction site in Japan.
Wet sieving analyses were performed on Inagi sand and Katori sand as these materials contain fines (particles finer than 0.075 mm) contents of 4.75%, and 18.8%, respectively. The particle size distribution curves and the physical properties for the soils are shown in Figure 1 and Table 1, respectively. The maximum dry density ( ρ d m a x ) and optimum water content ( W o p t ) are obtained from the standard proctor test of 1.0 E c following the JGS 0711-2009 method. In this study, it is shown that the optimum degree of saturation ( S r , o p t ) is defined as the degree of saturation ( S r ) when ρ d m a x is obtained for a given compaction energy level (CEL). The optimum degree of saturation for Inagi sand and Katori sand is 86.5% and 83.1%, respectively.

2.2. Experimental Setup

2.2.1. Suction Measurement Using Membrane Filter Method in Pressure Plate Apparatus (SWCC)

A standard pressure plate apparatus is modified by installing a membrane filter (SUPOR 450) to conduct the SWCC test in the suction range of 0.1–20 kPa. The membrane filter technique is an efficient and reliable procedure compared to ceramic disk, despite their great difference in thickness and air entry value for obtaining SWCC [19,20]. Since the current study focuses on sandy soils, the membrane filter is used as a good alternative to ceramic disks, particularly for testing sandy materials with relatively low suction ranges. In addition, the membrane filter technique reduces the duration of the test.
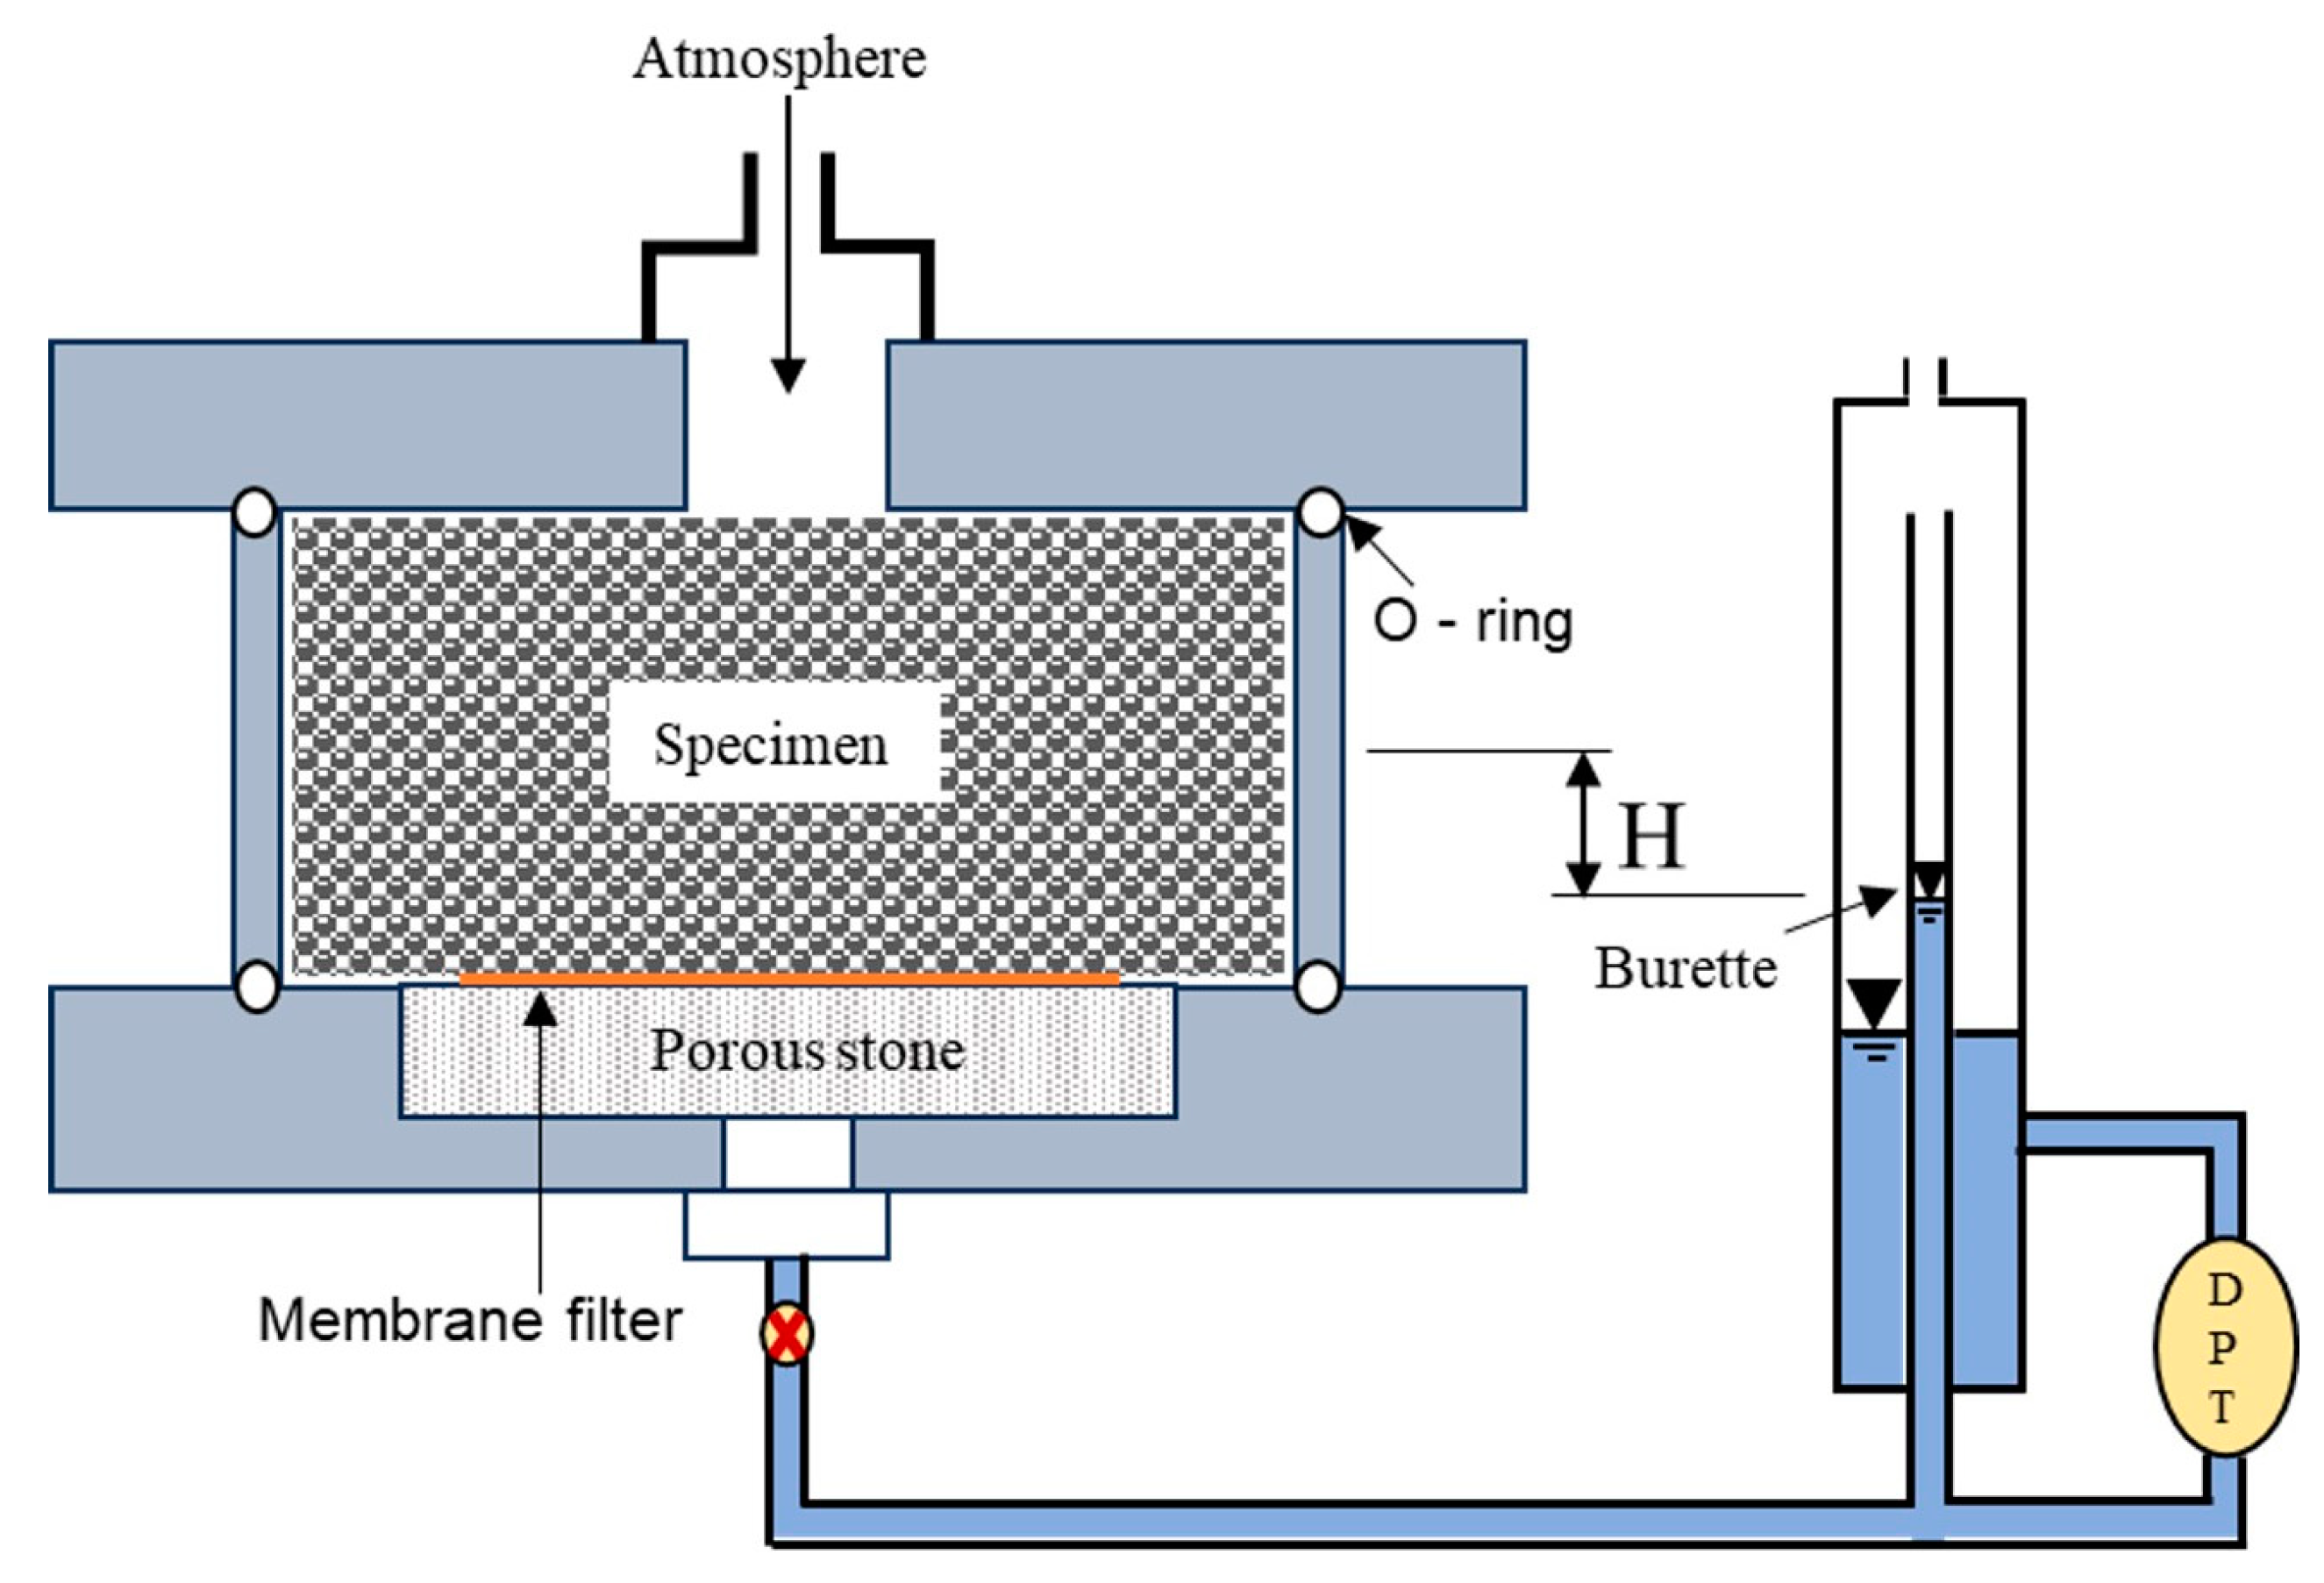
A flexible microporous membrane filter from the Pall Corporation Supor series 450 (Hydrophilic acrylic copolymer) was used in this work [19]. The pore size of the membrane is 0.45 μm, with the membrane thickness is 140 μm, and an air-entry value is around 250 kPa. The hydraulic conductivity of the membrane filter is 1 × 10⁻⁵ cm/s. The description of the membrane filter can be found in [19,20]. For each test conducted in this study, a new membrane filter was pre-saturated and then used. Figure 2 shows the full layout of the membrane filter pressure plate apparatus used. A differential pressure transducer (DPT) was used with the apparatus to record the volume of water flowing in/out during a test.
The applied suction, with a maximum value of around 20 kPa (water elevation difference of 2 m), was introduced by the elevation difference between the specimen and water level in a burette (H in Figure 2). By doing so, a negative pore water pressure was applied to the specimens. The time taken for each suction step to achieve the equilibrium stage is around 12 h, as the membrane filter technique provides easy movement of water. Thus, the time taken to complete each test is very fast, which is about 12 to 15 days. As the test period using membrane filter is much shorter when compared to the ceramic disk, the evaporation effect should be minor. Thus, the evaporation effect was not considered in the current study.
All the specimens tested were made by moist tamping, and special care was taken to ensure proper contact between the specimen and the pedestal of the apparatus. The specimens were saturated by supplying water from the supply tank to the specimen bottom and collecting water from the top of the specimen. However, it is worth noting that this testing method may yield SWCC data that may not fully represent the actual soil compaction process at a real-world earthwork site, as it involves continuous drainage of water from a saturated specimen and/or water supply to unsaturated soil, which differs from typical soil compaction practices.

2.2.2. Suction Measurement Using Membrane Filter Method in Triaxial Apparatus

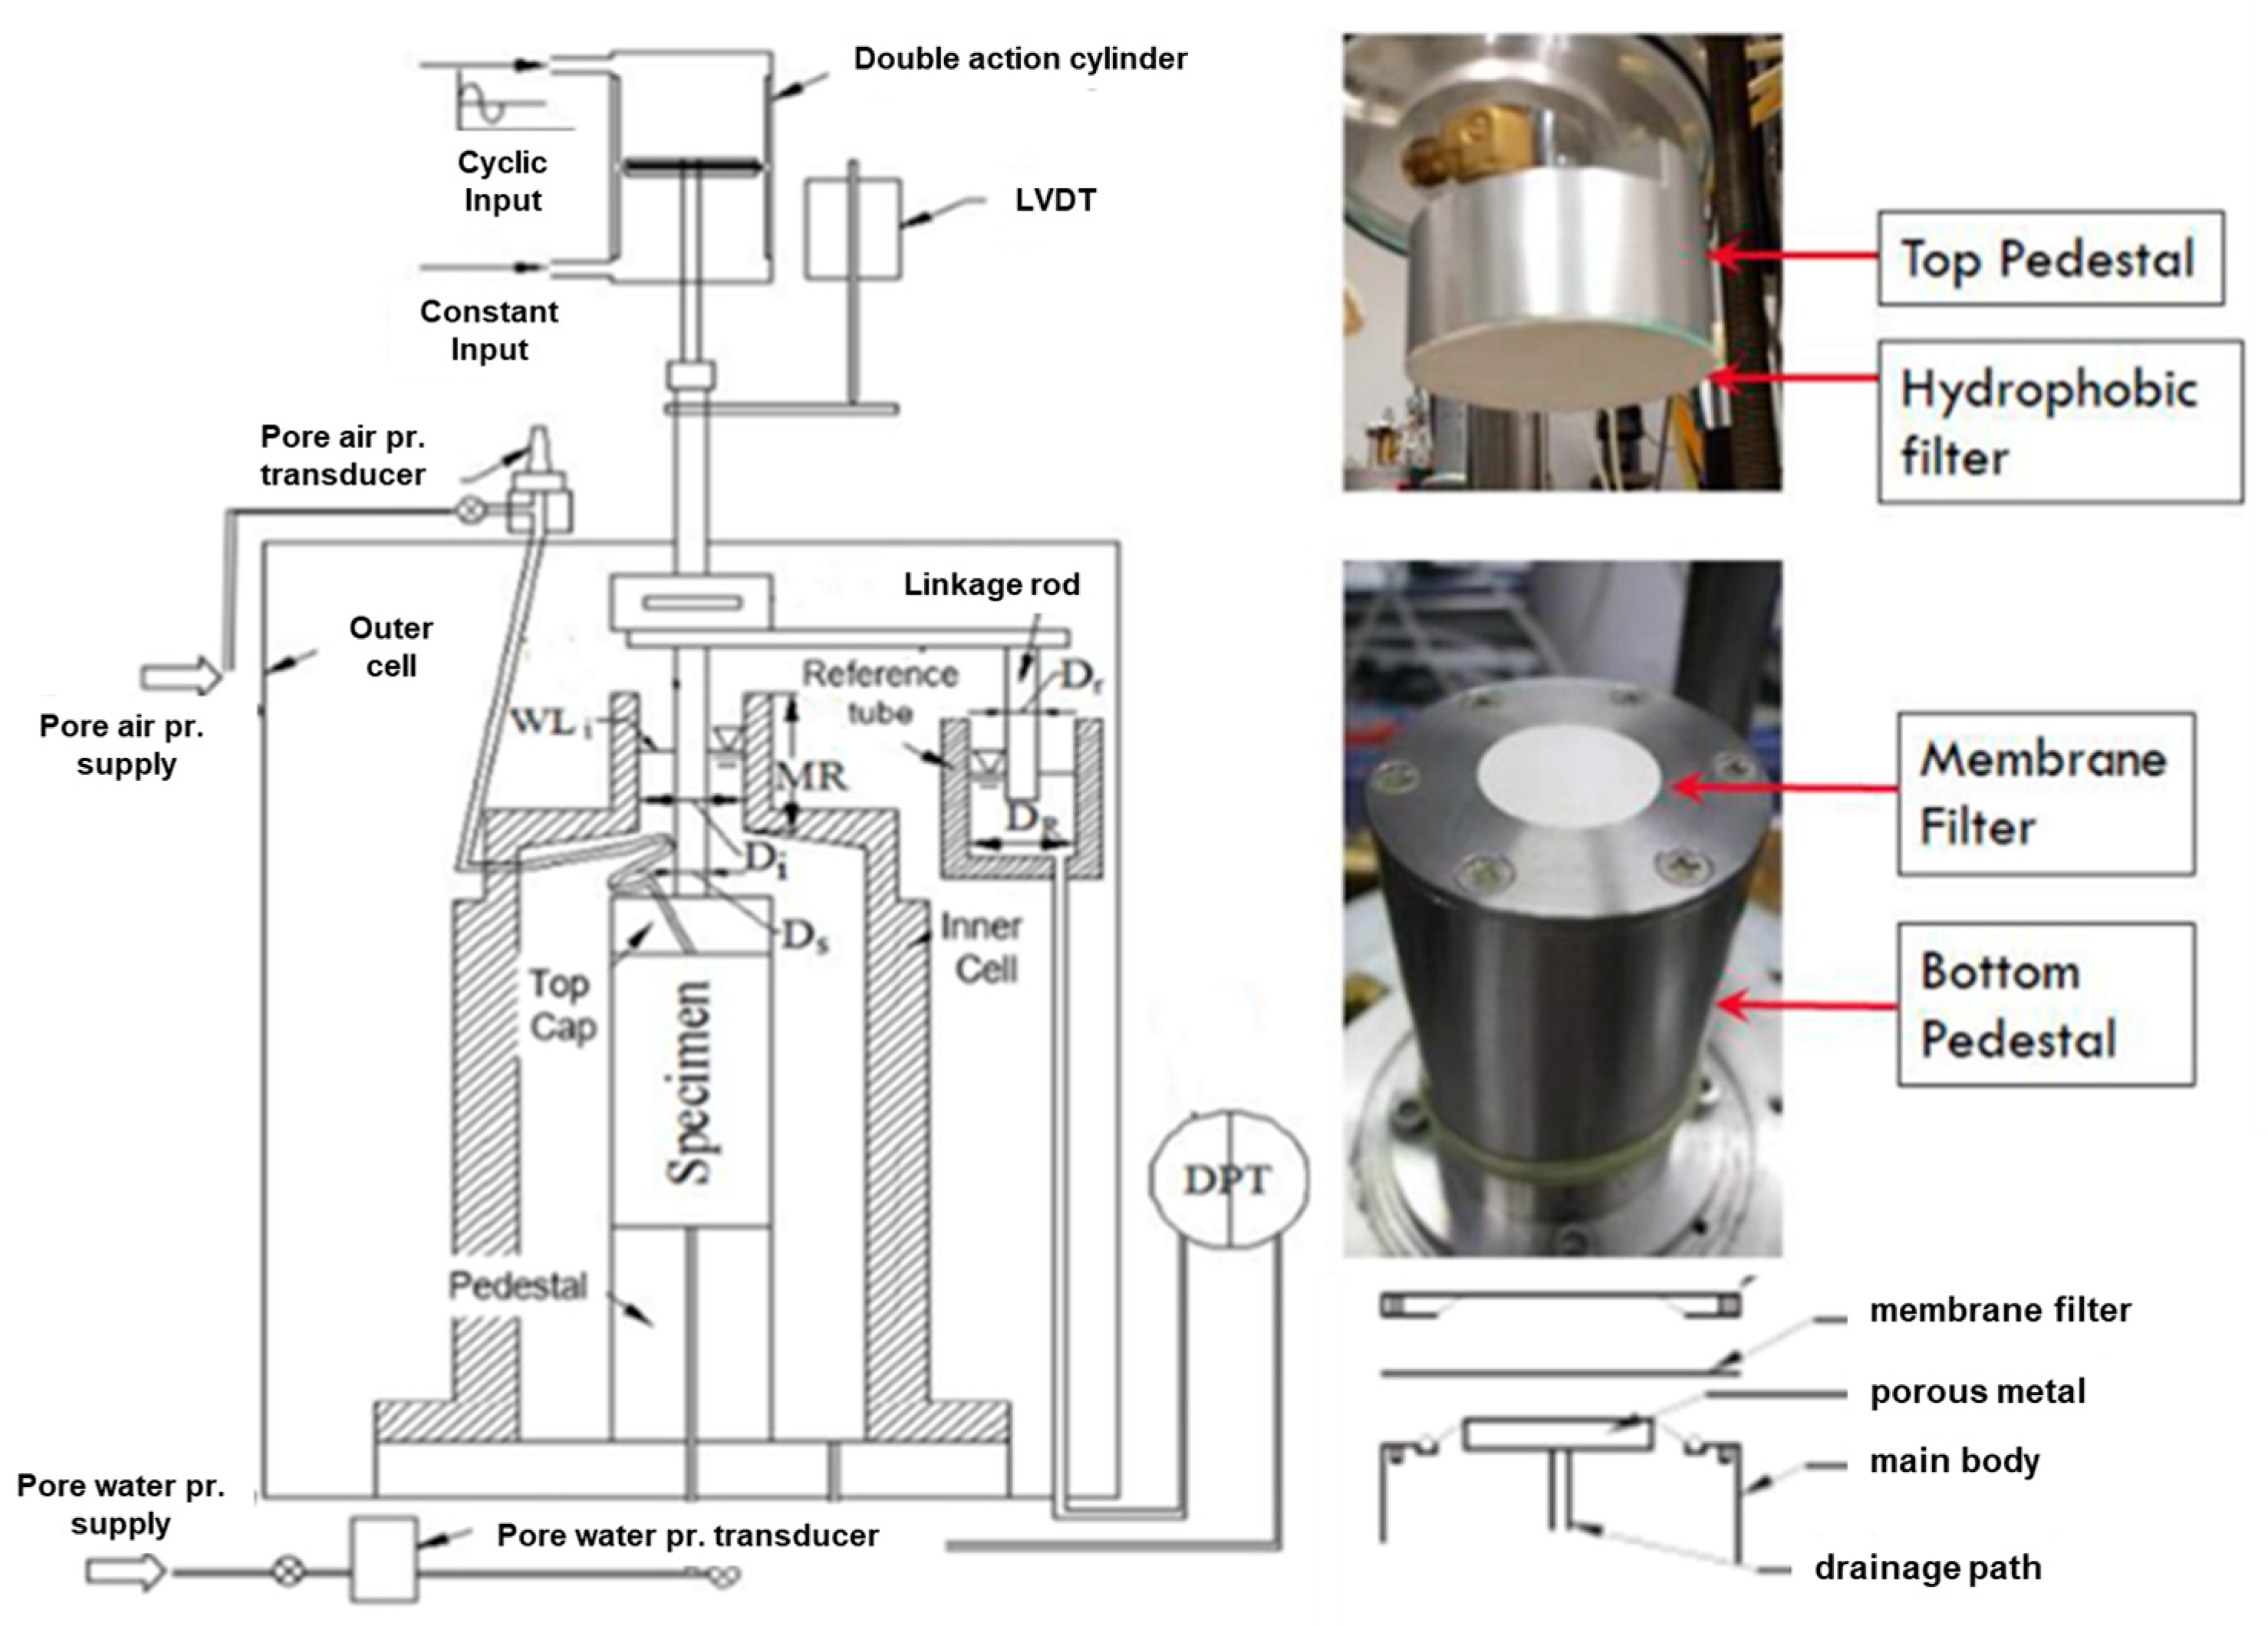
The measurement of soil suction for each compacted state was carried out using a specialized apparatus known as the linkage double cell triaxial apparatus, as depicted in Figure 3. The suction was directly evaluated at specific density and degree of saturation conditions. This evaluation was conducted using pore air pressure and pore water pressure transducers in conjunction with the membrane filter method within the triaxial apparatus. Notably, the measurements were performed under unsaturated conditions, while maintaining the pore air pressure open to atmospheric conditions. As a result, the suction measured using this method is more representative of the actual suction that would be encountered at the site. The suction obtained from this procedure is termed as “Apparent suction” in the current study.
(a)
Sample preparation
The soil specimens were prepared using moist tamping by the undercompaction technique [21]. Cylindrical specimens with a diameter of 50 mm and height of 100 mm were prepared in five equal layers of 20 mm each in a split specimen mold. This method prevents over-compaction of lower layers when the upper layers are compacted by the rammer blows, and resulting in uniformity of the specimen in density throughout the height of the sample. Hence, the intended density for each layer was achieved using this method.
(b)
Measurement procedure
The prepared sample is carefully placed onto the bottom pedestal of the triaxial apparatus and then sealed with the top pedestal. The compacted soil specimen needs to be properly fixed in the isotropic condition. Before placing the specimen, the porous stone and the membrane filter are pre-saturated. In addition, a hydrophobic filter was attached to the top cap, which prevented water flow and measured air pressure with the help of a pore air pressure transducer. At the bottom pedestal, a membrane filter (same as the one used for SWCC) was attached, which prevented airflow and measured water pressure using a pore water pressure transducer. The membrane filter is saturated before installing it on the porous stone of the bottom pedestal (shown in Figure 2). This membrane filter technique was previously used in the simple shear and Triaxial apparatus for monotonic or cyclic loading tests [19,20,22,23].
The measurement of pore air pressure and pore water pressure starts immediately after the compaction (after placing the specimen onto the apparatus) using the pore air pressure and pore water pressure transducers. Suction ( s ) is calculated as the difference between pore air pressure ( u a ) and pore water pressure ( u w ), which can be written as:
s = u a u w
where, u a = pore air pressure, P a t m = 0 kPa and u w = pore water pressure (kPa). The pore air pressure transducer is open to the atmospheric pressure ( P a t m ), considering the pore air pressure as 0 kPa.
So, the suction can be evaluated by the negative value of the measured pore water pressure. Hence Equation (1) can be rewritten as:
s = u w
The measurement is recorded until the suction achieves an equilibrium state. Generally, it would be around 6–8 h. The suction obtained from this procedure is termed as “apparent suction” in the current study. The time taken to achieve the equilibrium state depends on the type of soil, degree of saturation used for the soil specimen, etc. The changes in the suction after the equilibrium state are probably due to the redistribution of pore water network in the specimen. This discussion is detailed in Section 3.2. Therefore, the term “apparent suction” would be more appropriate, which reflects that the suction is determined by the researcher while still capturing the general time-independent, out-of-equilibrium nature of the state being studied.
To ensure the reliability, the apparent suction is compared with the standard method of obtaining suction from the soil water characteristic curve (SWCC). The current study compares the suction measured from the triaxial apparatus to the SWCC, which is discussed later in the paper.

3. Experimental Results and Discussion

The two laboratory suction measurement techniques were evaluated in this study: 1. Membrane filter technique in Pressure plate apparatus (SWCC). 2. Membrane filter method using triaxial apparatus (apparent suction).

3.1. Measurement of Suction Using Pressure Plate Apparatus

A series of tests were conducted to obtain the SWCC in this study. The effect of density on the water retention ability of two types of soils with different fines content was compared and discussed. The test conditions of the soil specimens for SWCC are listed in Table 2. Notably, some of the target densities considered in the study were higher than the traditional maximum dry density of the soil. This is due to recent advancements in soil compaction techniques, enabling higher dry densities to be achieved in the field [2]. Consequently, investigating the influence of suction at these higher dry densities has become necessary to enhance construction practices and ensure the long-term stability of engineered structures.
The experimental results of SWCC were best fitted using the predicted model suggested by [24]. Mualem [25] provided a model for extrapolating the knowledge of SWCC to predict the permeability of unsaturated porous media. The proposed model defines a dimensionless water content parameter ( Θ ) in terms of volumetric water content ( θ ), saturated volumetric water content ( θ s ), and residual volumetric water ( θ r ), and it can be written as:
Θ = θ θ r θ s θ r
For solving the model proposed by Mualem [25], van Genuchten [24] employed an equation to correlate Θ with pressure head h:
Θ = 1 [ 1 + h n ] 1 1 / n   , h < 0 1 ,   h 0
where h denotes the pressure head (m). In this study, suction ( s , in kPa) was written in terms of pressure head ( h ) and unit weight of water ( γ w ) as s = γ w h α (m−1) and n represent the model parameters.
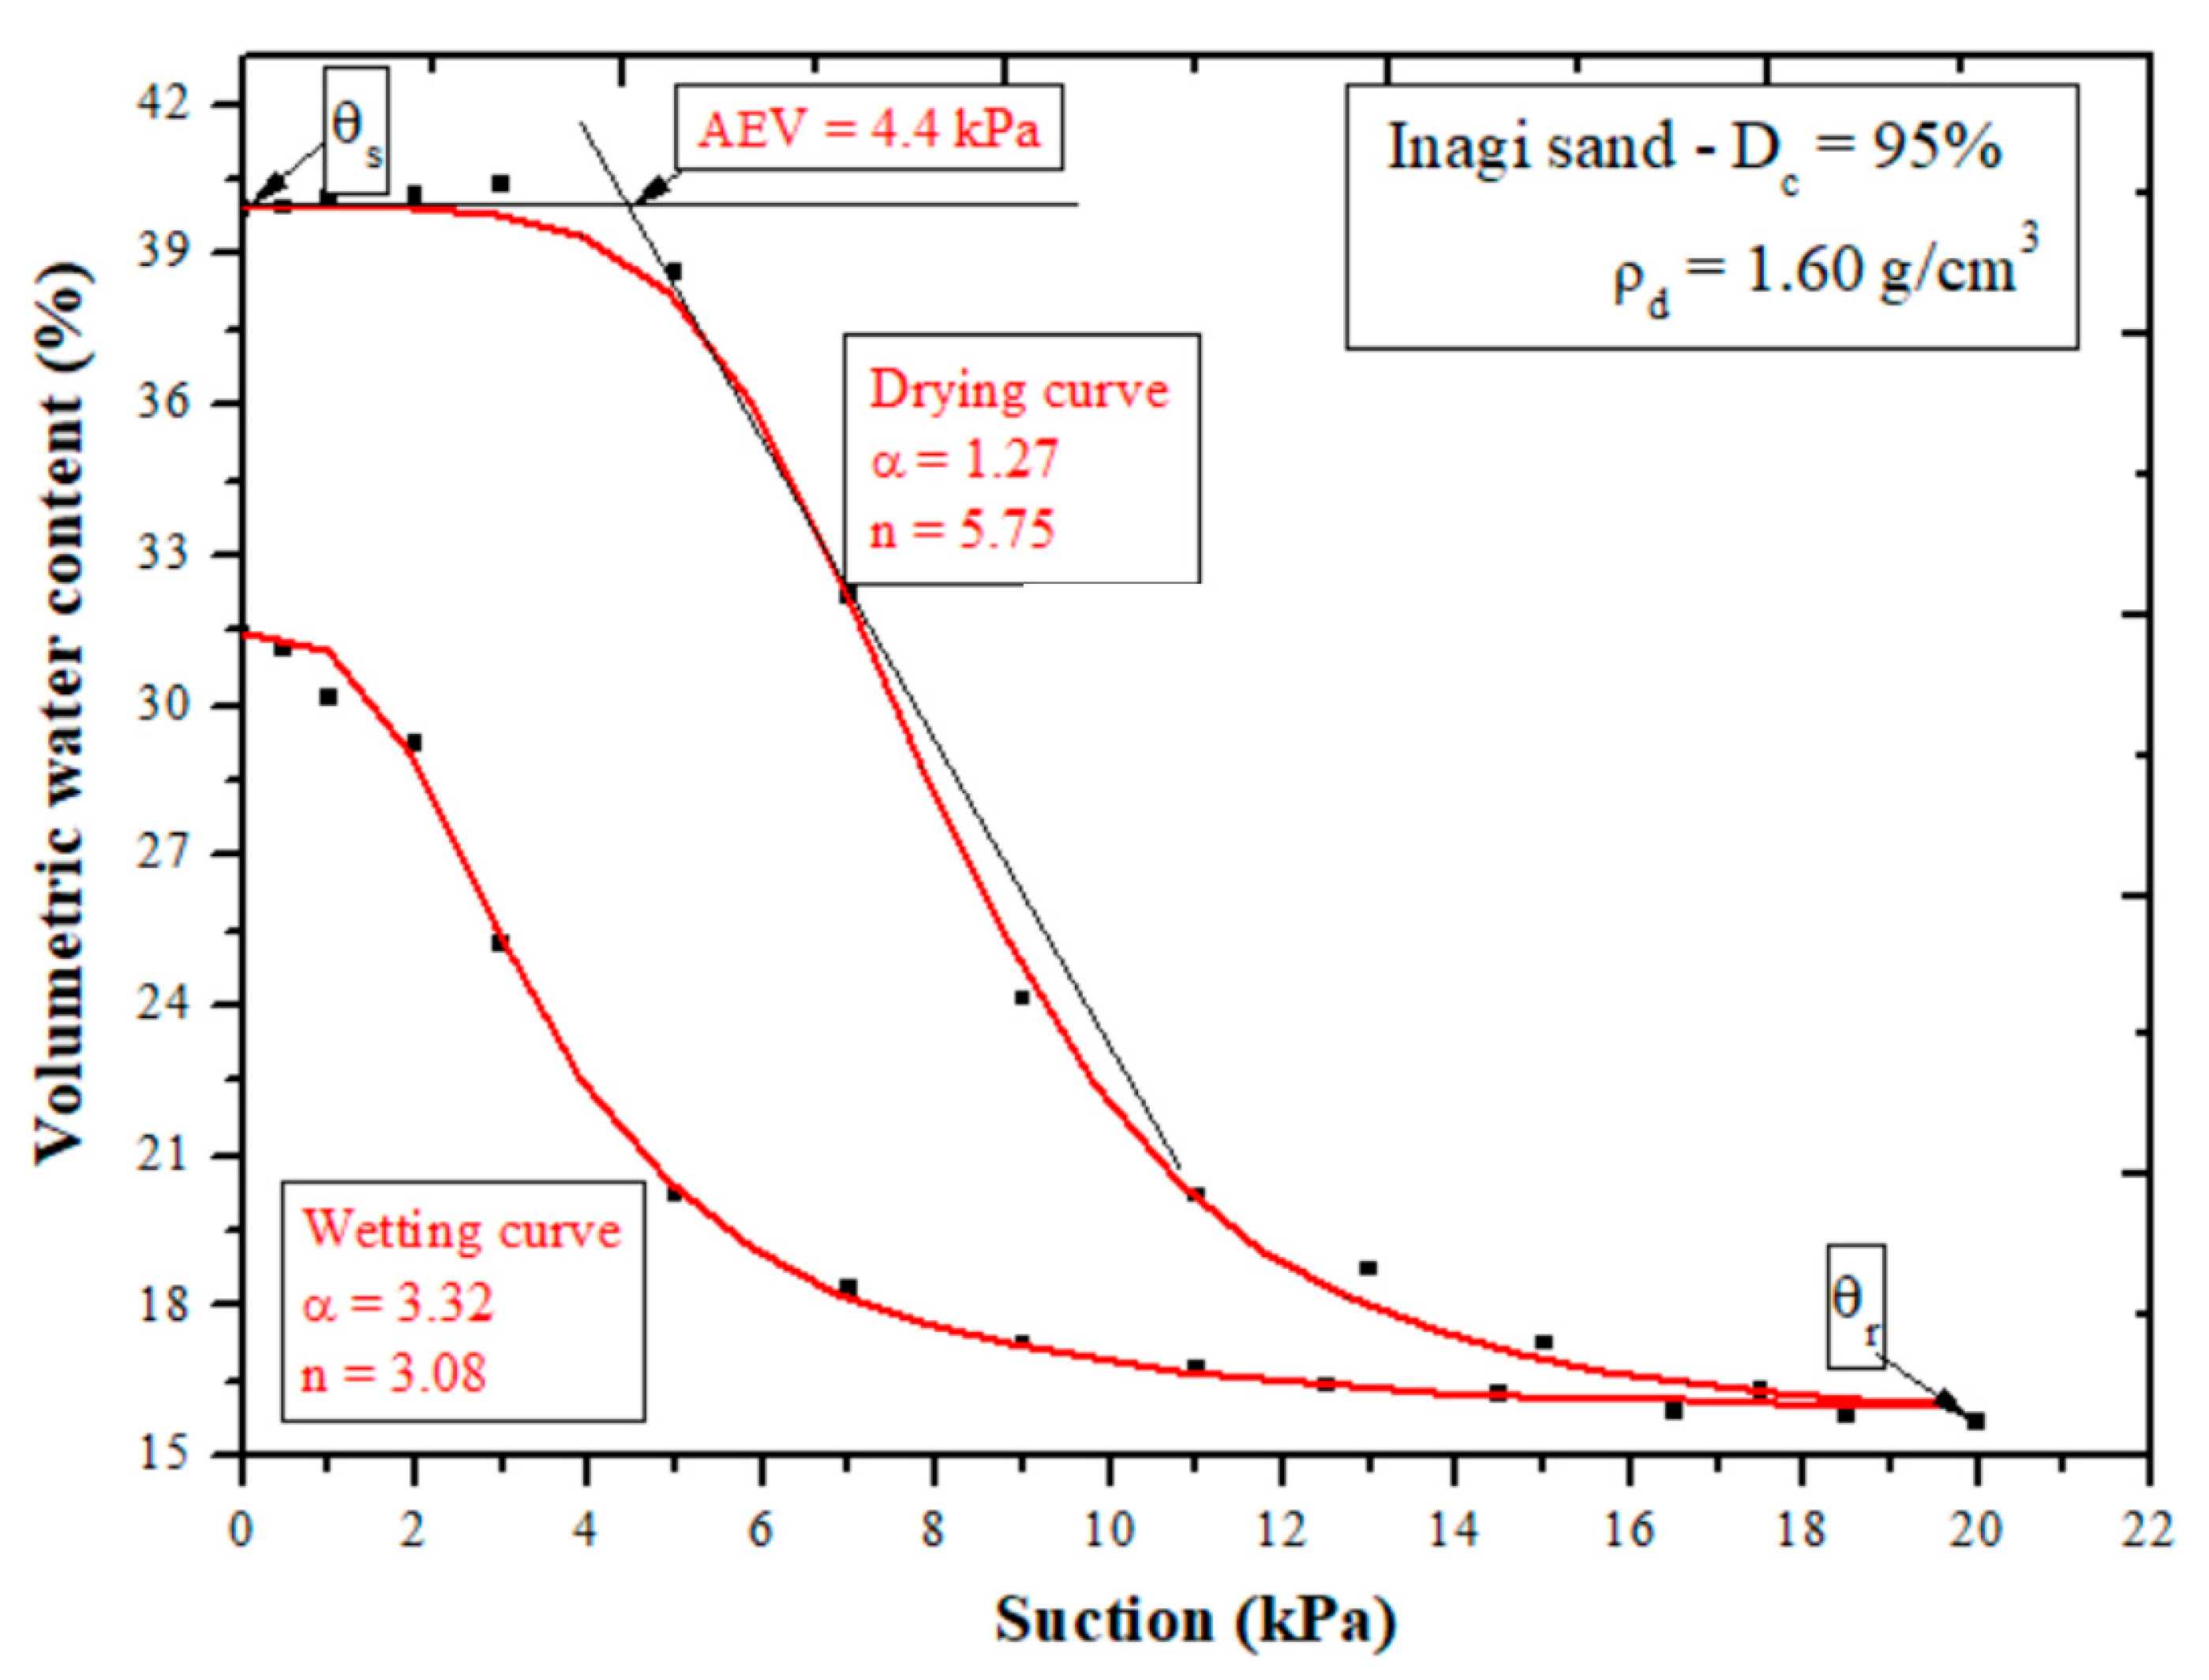
The van Genuchten [24] model was used to fit the experimental data of SWCC. A nonlinear curve-fitting algorithm and least square optimization, as outlined by [24], were used to obtain the best fit for the experimental data. The van Genuchten [24] fitting parameters (α and n) for the SWCC curve and the air entry values are mentioned in Table 2 for each testing case. The model parameters α and n were determined for each testing case. The air entry values are determined by the fitting curve of the drying SWCC. The determination of AEV and the SWCC curve for all the tested conditions are calculated as shown in Figure 4.

3.1.1. Effect of Initial Density of Sandy Soils on SWCC

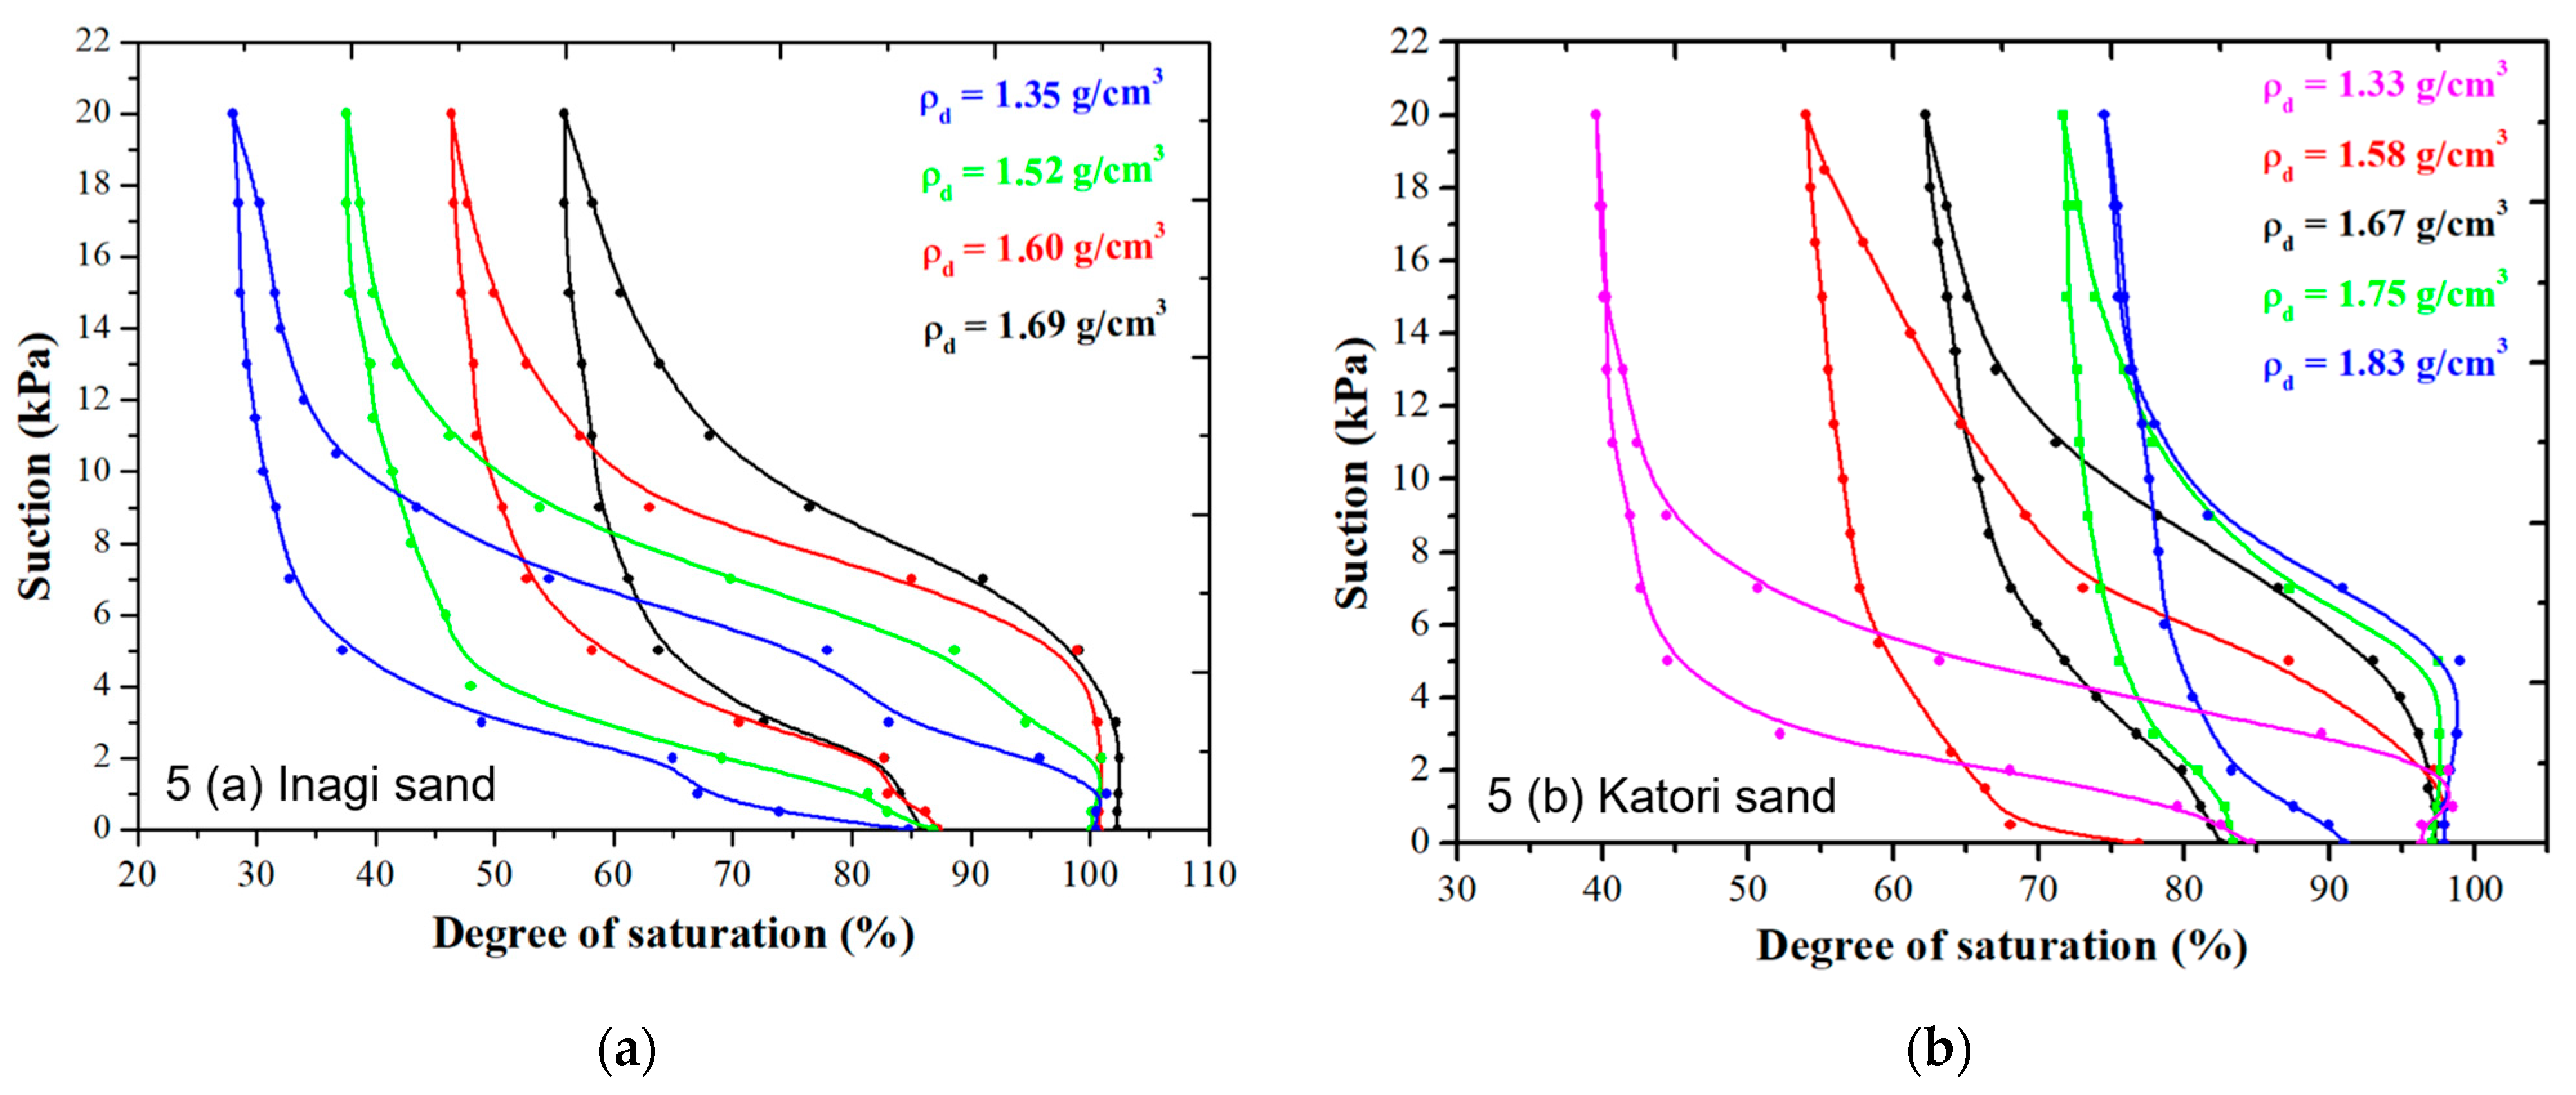
The initial dry density of the soil specimen has some significant effects on the soil-water characteristic curve. The SWCCs for Inagi sand and Katori sand were obtained for the different initial density conditions to observe the effects of the initial dry density. Figure 5a and Figure 5b show the relationship between suction and degree of saturation ( S r ) with the different initial density conditions for the Inagi sand and Katori sand, respectively. As the initial density of the soil specimen increases, the SWCC shifts to the right side, showing the increasing trend of suction under the same degree of saturation. Along the same suction, the volumetric water content and S r increases with an increase in specimen density for either drying or wetting curves.
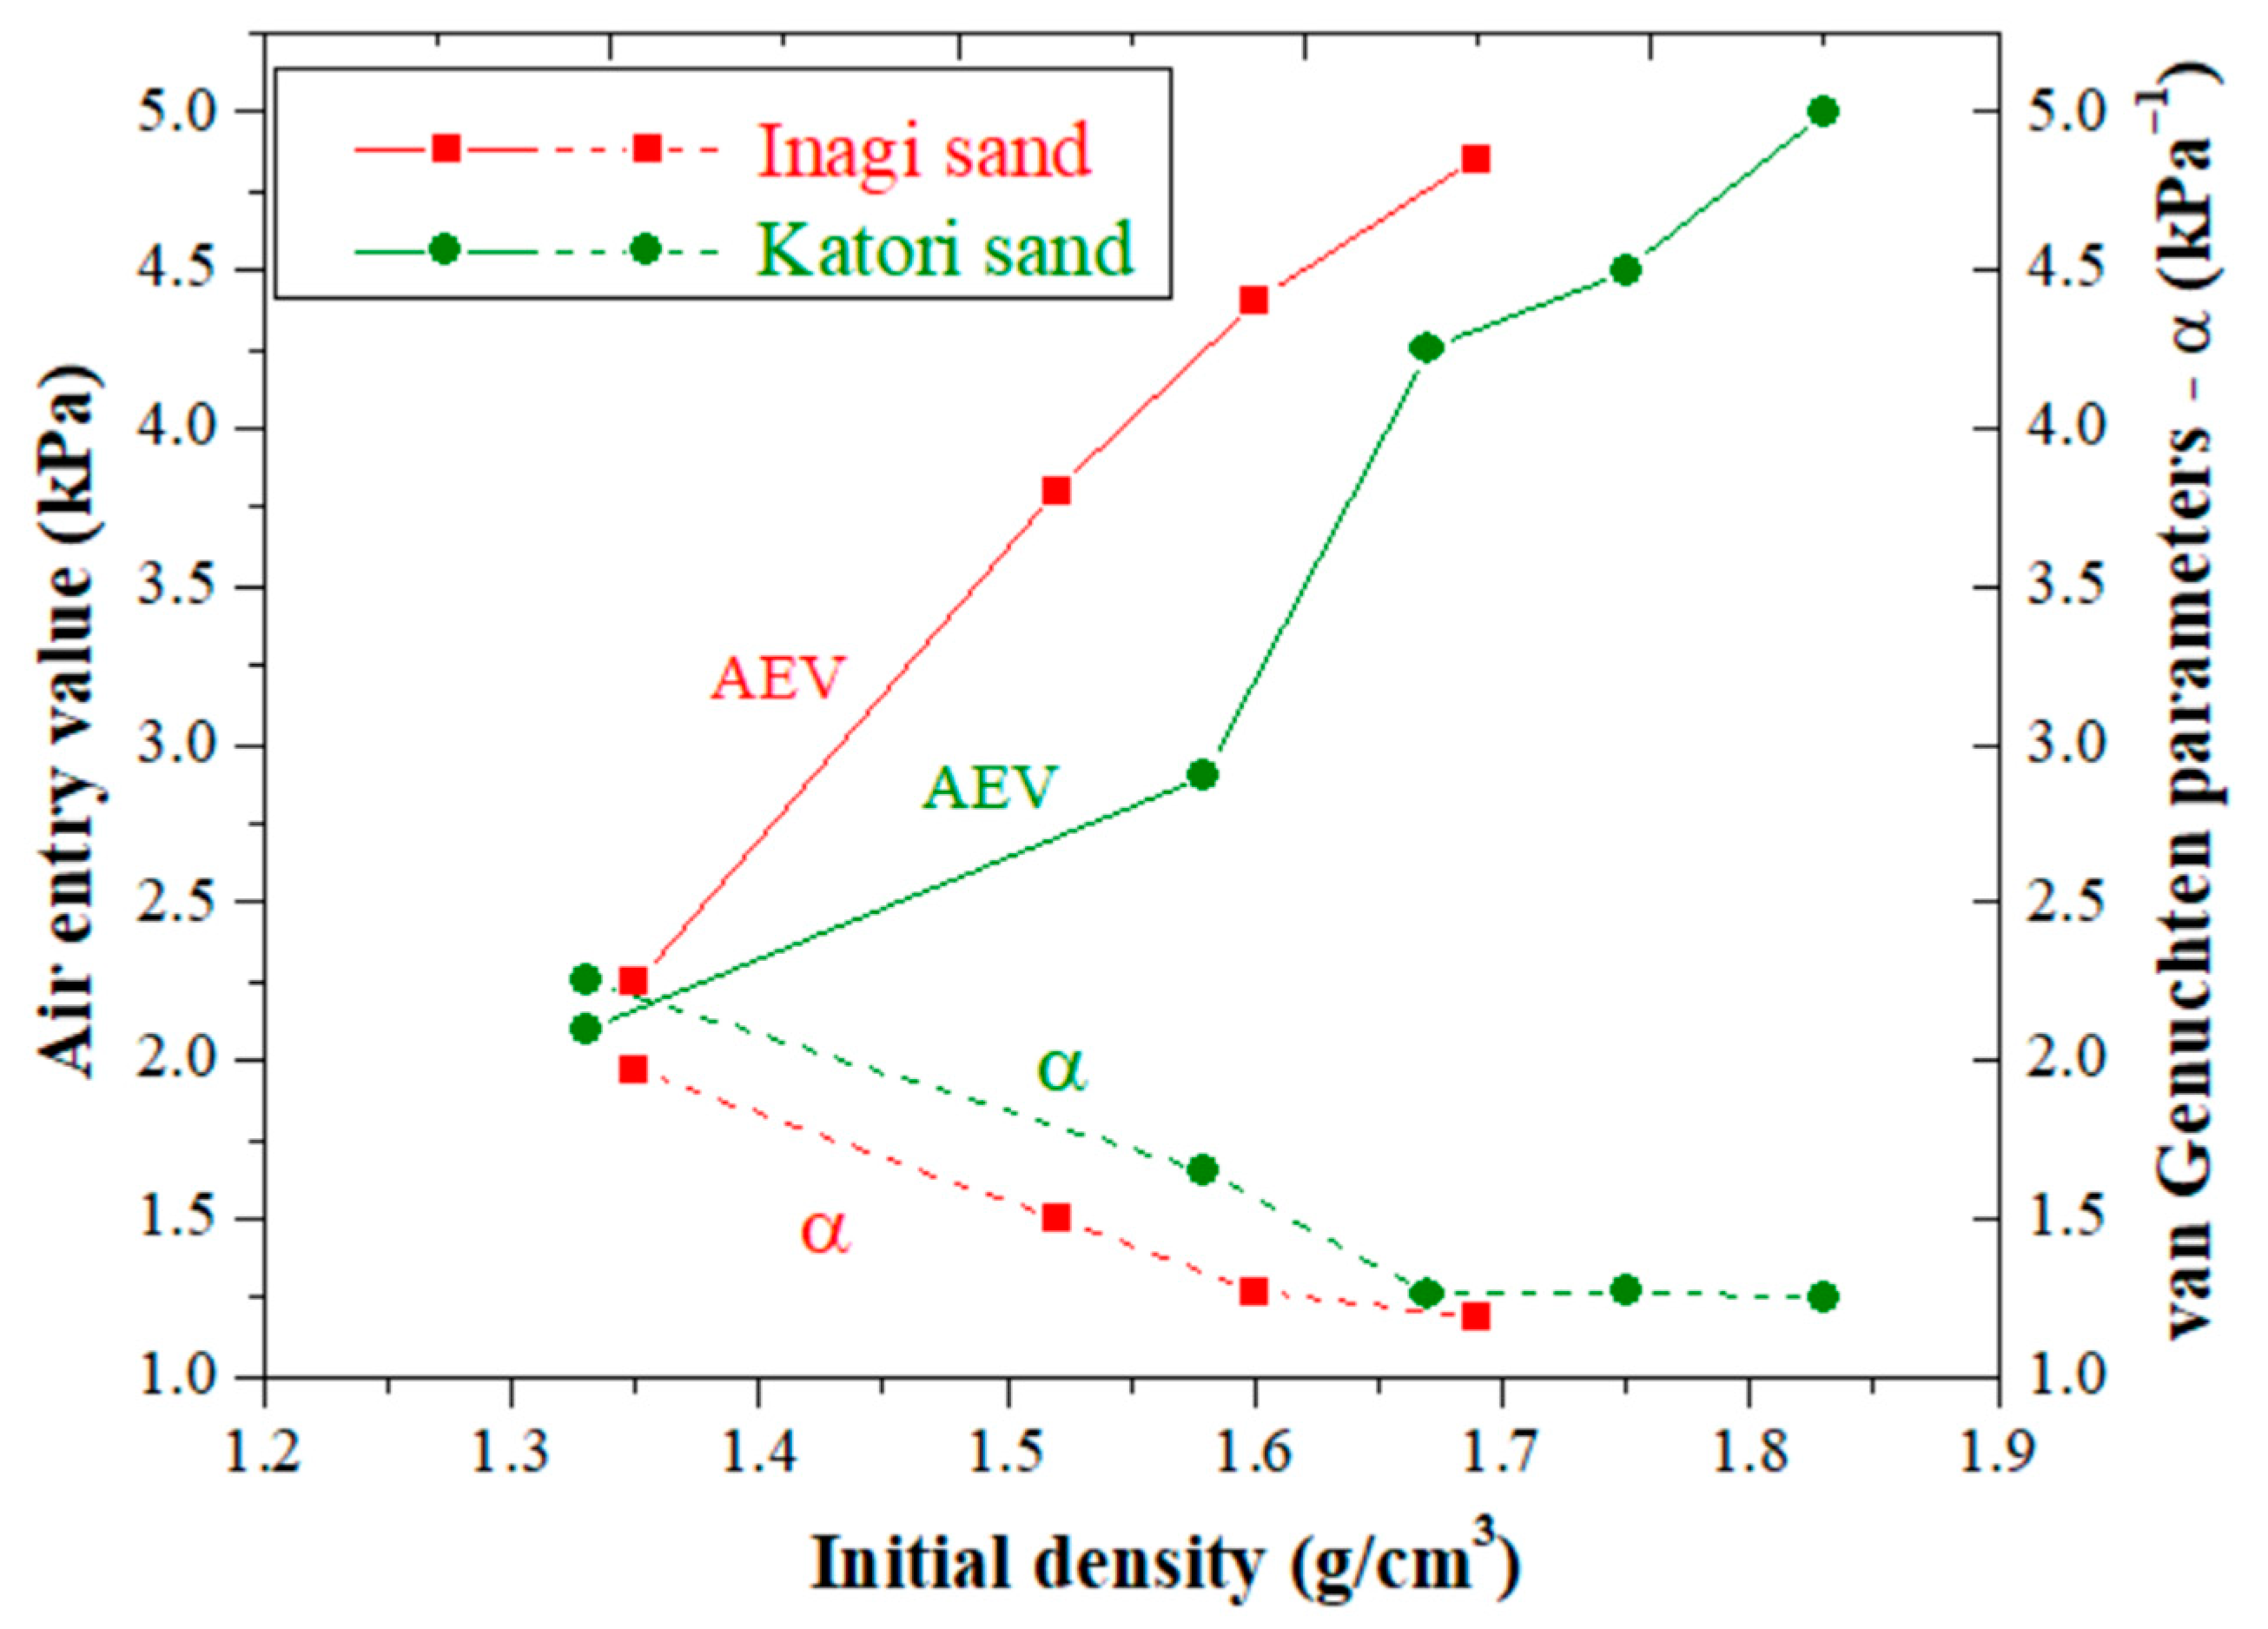
Figure 6 shows the comparison of the initial density and AEV and van Genuchten parameter α. It is found that there is a linear correlation between the dry density and AEV. Aitchison [26] has given an equation for matric suction which obeys the simple capillary model such as:
u a u w = 2 T s R s
where T s is the surface tension force of water and R s is the radius of curvature of the meniscus. With the increase in the density of the soil specimen at the same degree of saturation in Figure 5, the suction value increases. This is due to the reduction in pore size and the number of pores in the soil matrix. As a result, the radius of the meniscus decreases while the corresponding suction increases. Consequently, more suction is required for air to penetrate into the soil matrix. Similarly, the higher the density for a given volumetric water content, the greater the suction value. A similar kind of behavior is found in [27]. This can lead to an increase in the air entry value and the residual water content as mentioned in Table 2. Kimoto et al. [28] and Kawai et al. [29] also observed a similar trend of an increase in air entry values with the increase in density for the sandy soils and clayey soils, respectively.
The van Genuchten [24] parameters like α and n change with the increase in the initial density, as noted in Table 2. The α value decreases with the density, whereas the n value increases with the density. As the n value increased, the slope of the SWCC was observed to be steeper. Figure 6 shows the relationship between the van Genuchten [24] parameters like α with the Air entry values (AEV) for Inagi sand and Katori sand. It indicates that the α value is inversely proportionate to the air entry value.

3.1.2. Effect of Fines Content on SWCC

Figure 6 illustrates that with the increase in fines content, the air entry values decrease at the same initial density or amount of compaction. This means that as the fines content increases, the suction required for air to enter the soil matrix decreases. This can be due to the increasing porosity with the increase in fines content while keeping density constant. Similar behavior was found in [30]. It was suggested that the porosity might affect how well fluids transport through porous soil, i.e., more porosity meant the soil could drain more effectively. At this point, the soil’s ability to retain water decreased, while the soil’s ability to drain became stronger as the fines content gradually increased. Therefore, with the increase in fines content, the volumetric water content decreases at the same level of suction and increases the suction at the same degree of saturation. The fines content affected the SWCC by modifying the porosity of the soil, and porosity was the main influencing factor of the water-holding characteristics of the soil. Thus, the increase in fines content decreases the air entry value at the same amount of compaction or initial density.
Because of this, as the fines content increases, the volumetric water content gets reduced at the same level of suction. Meanwhile, suction increases with an increase in fines content at the same level of saturation. The SWCC was impacted by the fines content because it changed the soil’s porosity, which was the primary determinant of the soil’s capacity to retain water [30]. As a result, the air entry value decreases with an increase in 316 fines content at the same initial density or level of compaction.

3.2. Measurement of Suction Using Triaxial Apparatus

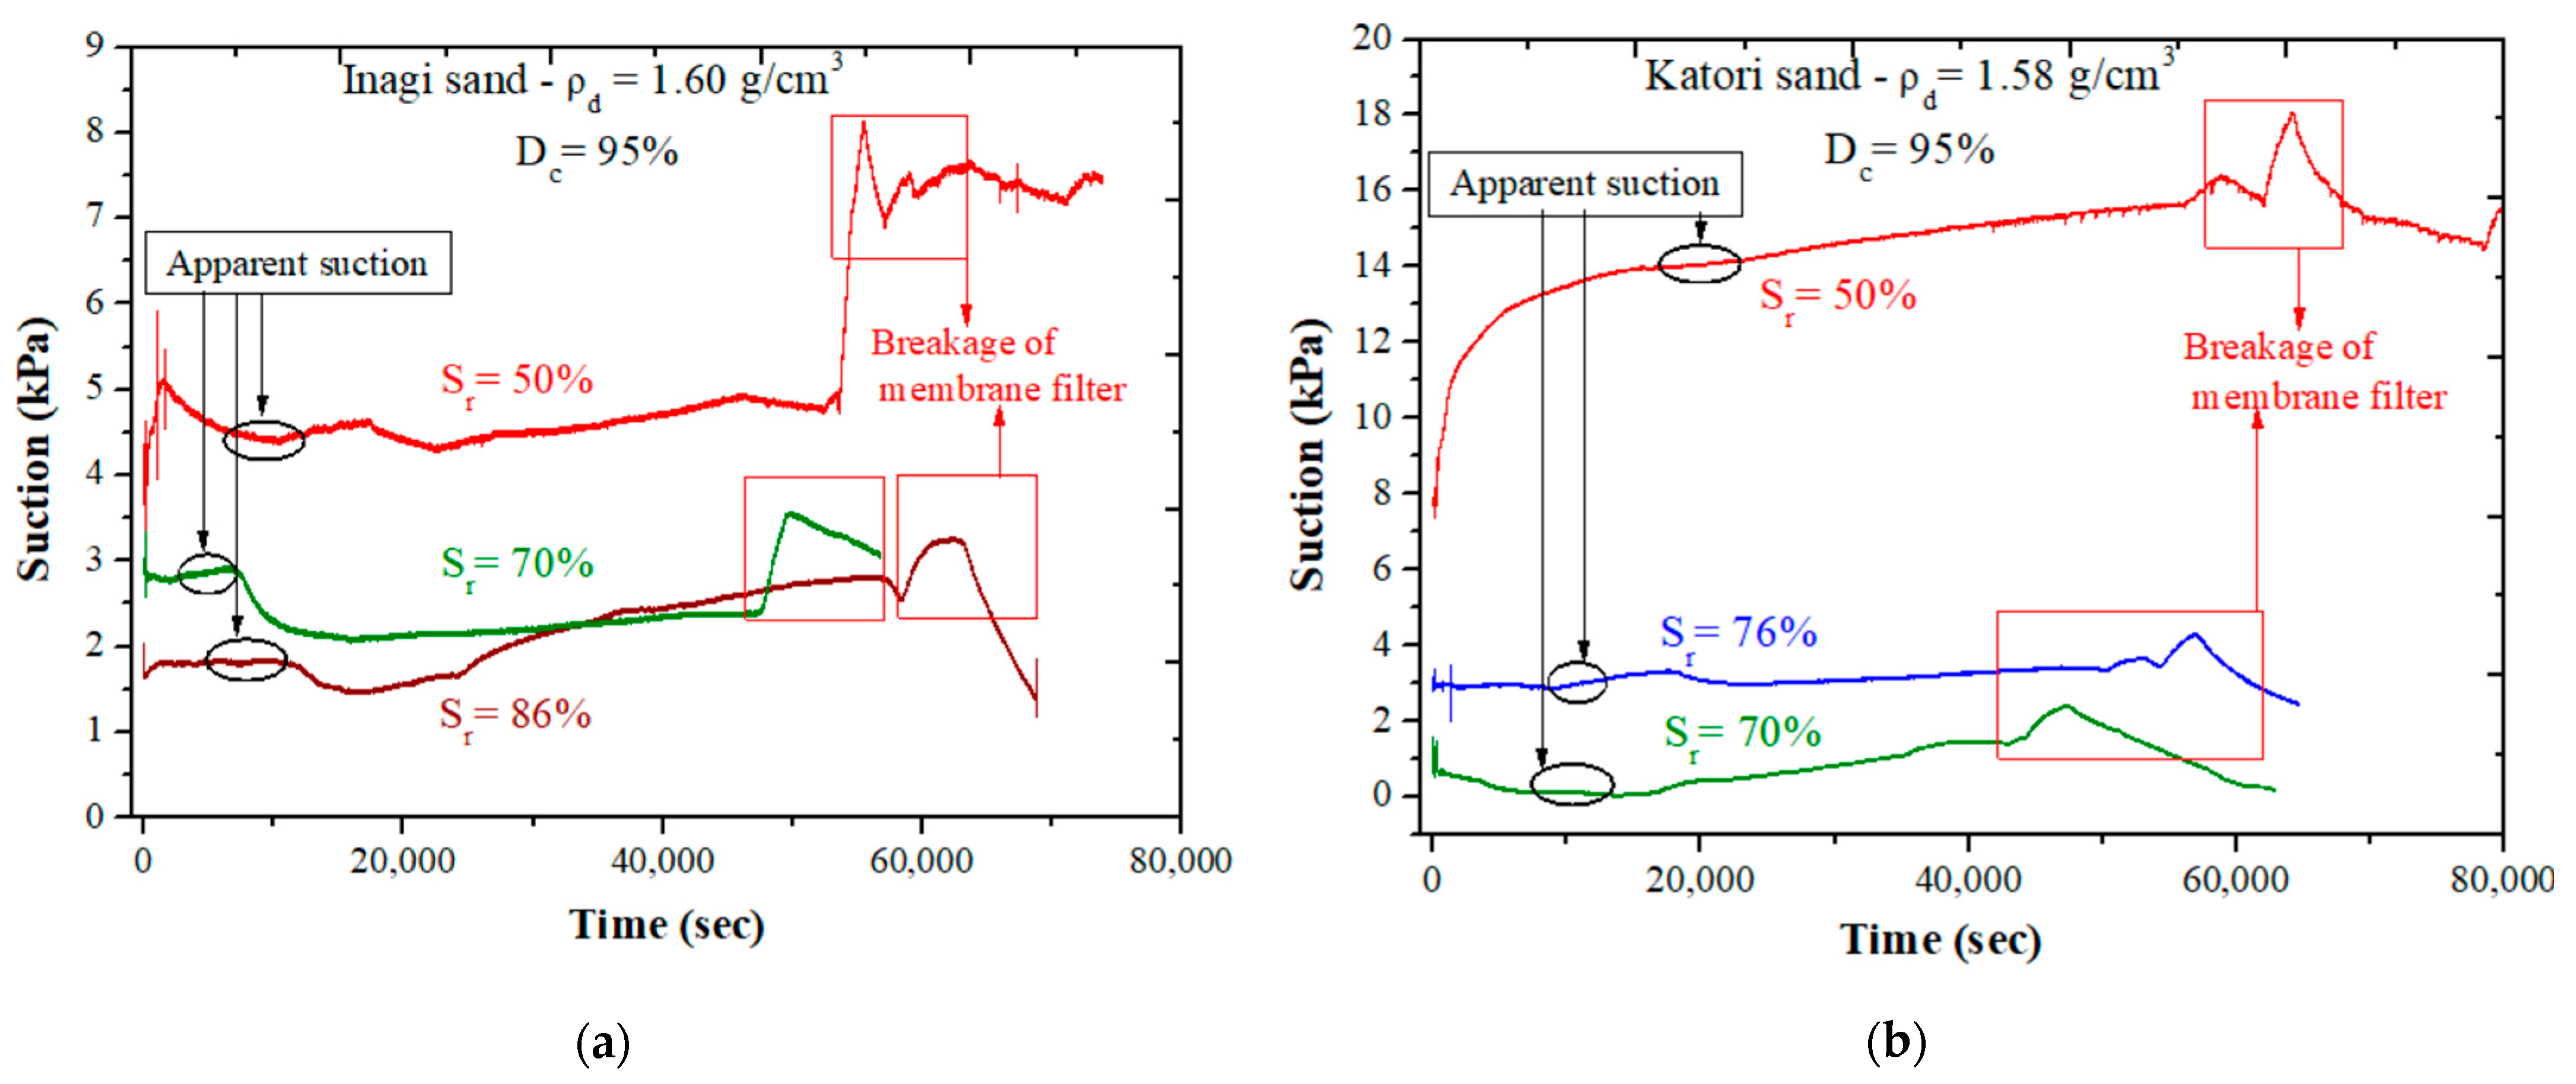
To replicate the natural conditions at the earthwork in an unsaturated state, the measurement of suction is started immediately after the compaction. The suction measured from the triaxial apparatus is termed to be “apparent suction” in the current study. Figure 7 shows the determination of apparent suction from the time history of suction for Inagi sand at ρ d = 1.60 g/cm3. Figure 8a and Figure 8b show the typical time history of the soil compacted at the same initial density with varying degrees of saturation for Inagi sand and Katori sand, respectively. The time history of suction clearly identifies the commencement of the measurement of the suction at t = 0 s. It takes some time to achieve the suction in an equilibrium state. The equilibrium state of the suction is marked in circles in Figure 7 for Inagi sand. The average value of the suction in the equilibrium state is defined to be the apparent suction. It should be noted that the equilibrium state of the suction ranges for 3000 s and is attained before 20,000 s in all the cases. The changes in the suction after the equilibrium state are because of the redistribution of pore water network in the specimen. Therefore, the term “apparent suction” would be more appropriate, which reflects that the suction is determined by the researcher, while still capturing the general time-independent, out-of-equilibrium nature of the state being studied. The apparent suction is the average value of the suction from equilibrium state in the time history of the suction for Inagi sand and Katori sand, as shown in Figure 8a and Figure 8b, respectively.
After a certain time in the recorded measurement, a sudden jump in the suction value can be observed, and then it either gradually approaches 0 kPa or tends to increase indefinitely. This is because of a problem in the membrane filter, which is directly connected to the pore water measurement. During the measurement of pore water pressure, the water in the membrane filter was expected to make contact with the pore water network in the specimen. However, in some areas, there is a possibility the contacts were lost due to the re-distribution of the pore water. The loss of contact may cause the invasion of pore air into the membrane filter. This loss of contact may not easily happen for the small average particle size of soil particles. If the particle size of soil particles increases, the failure of the membrane filter happens easily. It is the point where the membrane filter fails to do its purpose. At that point, there is a sudden jump of decrease or increase in the pore water measurement and then either gradually approaches 0 kPa value or tends to increase indefinitely, which represents the failure of the membrane filter. The failure with the breakage of the membrane filter is clearly marked in Figure 8a,b.
Table 3 shows the measured apparent suction values with varying initial density and degree of saturation for Inagi sand and Katori sand. The apparent suction values increased with the increase in initial density, whereas they decreased with the increase in the degree of saturation. This trend can be clearly noticed in Figure 8a and Figure 8b, for both the cases of Inagi sand and Katori sand, respectively. The time required to attain the equilibrium condition is shorter for soil specimens compacted at high degrees of saturation when compared to soil specimens compacted at low degrees of saturation. This is probably due to the soil specimen’s formation of a well-distributed microstructure and relatively homogeneous soil pores when compacted at high saturation levels. These homogeneous pores result in a stronger pore water distribution network and greater contact with membrane pores, making it easier to quantify in a short time. In addition, it can be observed that the Katori sand with high fines content compacted at a low degree of saturation ( S r = 50%) has taken a longer time to achieve the equilibrium state (shown in Figure 8b). The time taken to achieve the equilibrium state depends on the type of soil, the degree of saturation used for the soil specimen, etc.
To ensure the reliability of these measured suction values, they are compared with the suction obtained from the soil water characteristic curve in the next section.

4. Discussion

4.1. Comparison of Measured Suction from Triaxial Apparatus and SWCC

Figure 9a and Figure 9b present the comparison of the apparent suction and the SWCC for Inagi sand and Katori sand, respectively. Both methods show that the results exhibit an increase in suction with the increase in the initial density, indicating a positive effect of suction with increasing density. On the other hand, a decreasing trend of suction is observed with the increase in the degree of saturation.
When the apparent suction values are compared with the soil-water characteristic curve (SWCC), it is observed that the apparent suction follows the trend of the wetting curve of the SWCC. This behavior might be attributed to the addition of water to the specimen during specimen preparation for compaction. In addition, it could also be because of an increase in pore pressures at the same water content while undergoing the process of compaction, if compaction is considered as exhausted or undrained cyclic loading. Thus, leading to a decrease in the suction of the sample while measurement. This could imply that the specimen might have achieved the wetting curve state after compaction. Therefore, the apparent suction moves towards the minimum hysteresis range in the SWCC, which is the wetting curve. This kind of behavior has also been observed by [20], for Inagi sand under one specific density condition.
The comparison between the two methods in this study can be a very important implication for understanding the strength and deformation characteristics of unsaturated soils. Prior studies [31,32,33] have often relied on the suction derived from the drying curve of the Soil-Water Characteristic Curve (SWCC) to interpret unsaturated soil behavior. However, our current investigation highlights the reliability of measuring suction (termed as apparent suction) using the triaxial apparatus, as it effectively replicates real-field conditions. The data analysis indicates that the apparent suction follows a similar trend to the wetting curve of the SWCC. Consequently, this significant finding provides a unique perspective and has the potential to mitigate the risk of misinterpreting the unsaturated soil behavior while conducting suction-controlled unsaturated drained loading tests of soils. Furthermore, employing these apparent suction values allows us to derive empirical equations for understanding the suction behavior on the compaction curve.

4.2. Empirical Relationship Derived to Obtain Suction Contours on Compaction Curve

The empirical relationship is derived by considering the statement “Suction is a function of the degree of saturation and the dry density.” The function of the degree of saturation is assumed to vary based on a hyperbolic function in which f S r = 100 % = 0 and S r = 100 % = n o n e . Tatsuoka et al. [34] followed a similar approach to derive the empirical relationship for the suction data of clayey soils. In the case of clayey soils, the suction increases rapidly as the degree of saturation decreases from 100%. Thus, the function of density is assumed to be a linear relationship.
s = f S r × g ρ d f S r = 100 S r 1 100 S r 100 g ρ d = A + B × ρ d ρ w
where s is apparent suction, A, and B are parameters.
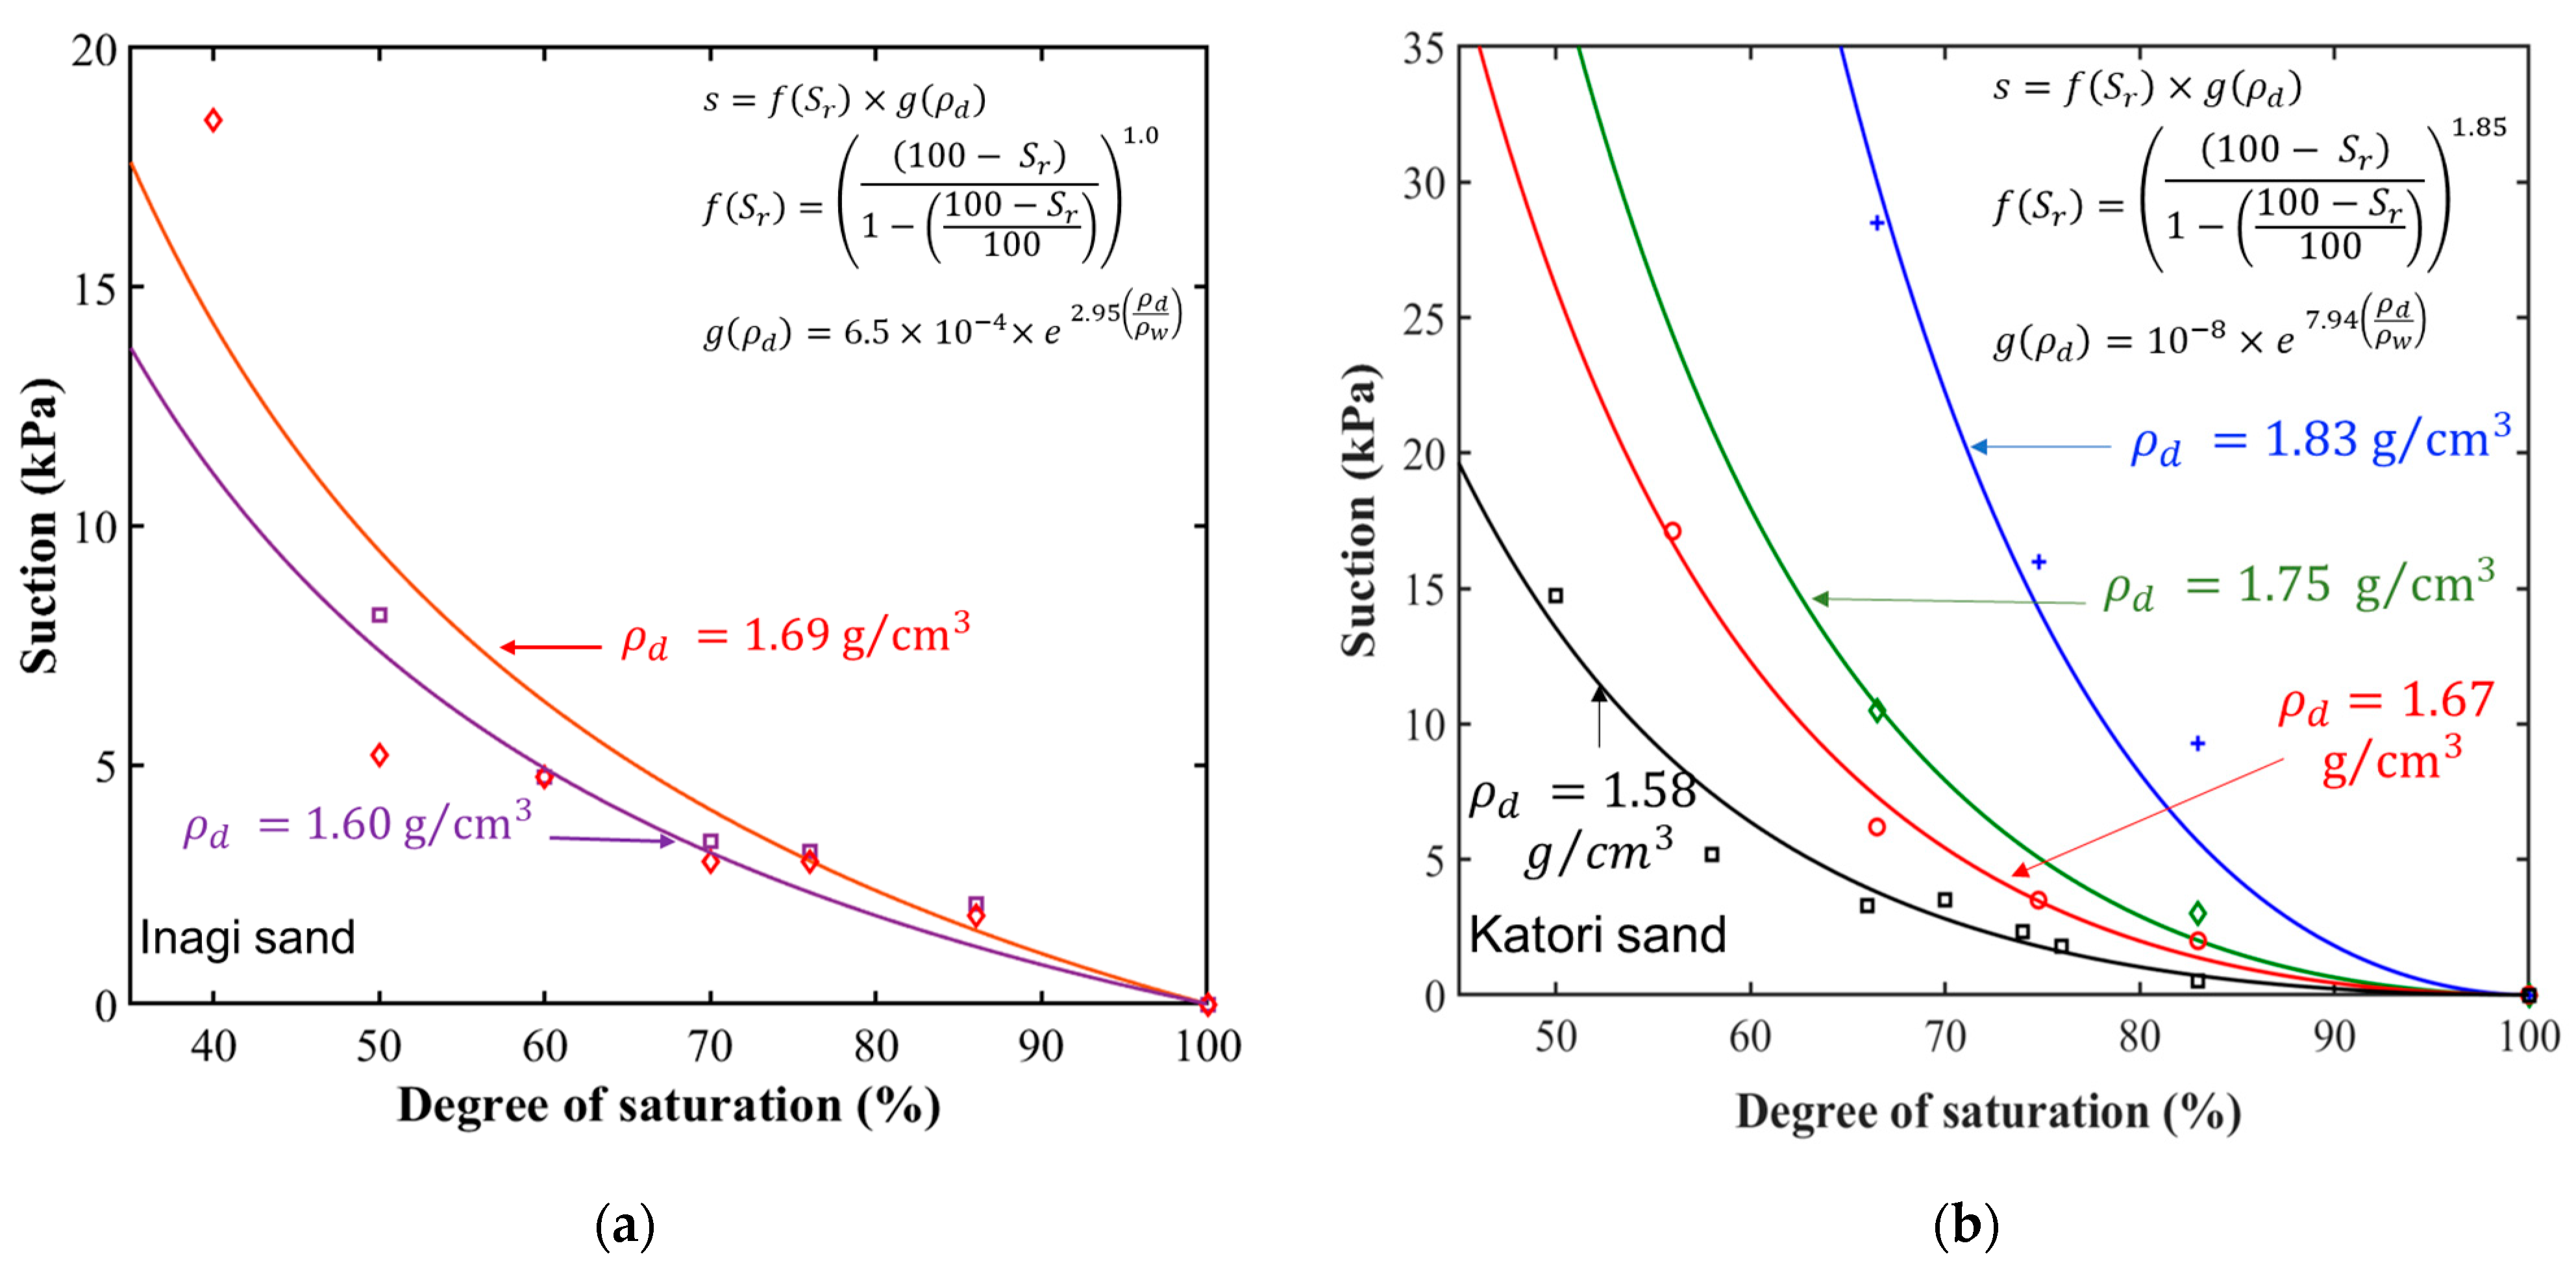
However, in the case of sands, the suction increases slowly and then rapidly as the degree of saturation decreases from 100% in any compacted density. Thus, to obtain the empirical relationship for the apparent suction data based on the sandy soils which are listed in Table 3, the function of the degree of saturation and dry density needs to be changed accordingly. Consequently, the function of dry density is changed from a linear to an exponential relationship to meet the requirements of the current study. Figure 10a and Figure 10b show the relationship between the suction and degree of saturation at different densities for Inagi sand and Katori sand, respectively.
s = f S r × g ρ d f S r = 100 S r 1 100 S r 100 n g ρ d = A × e B ρ d ρ w
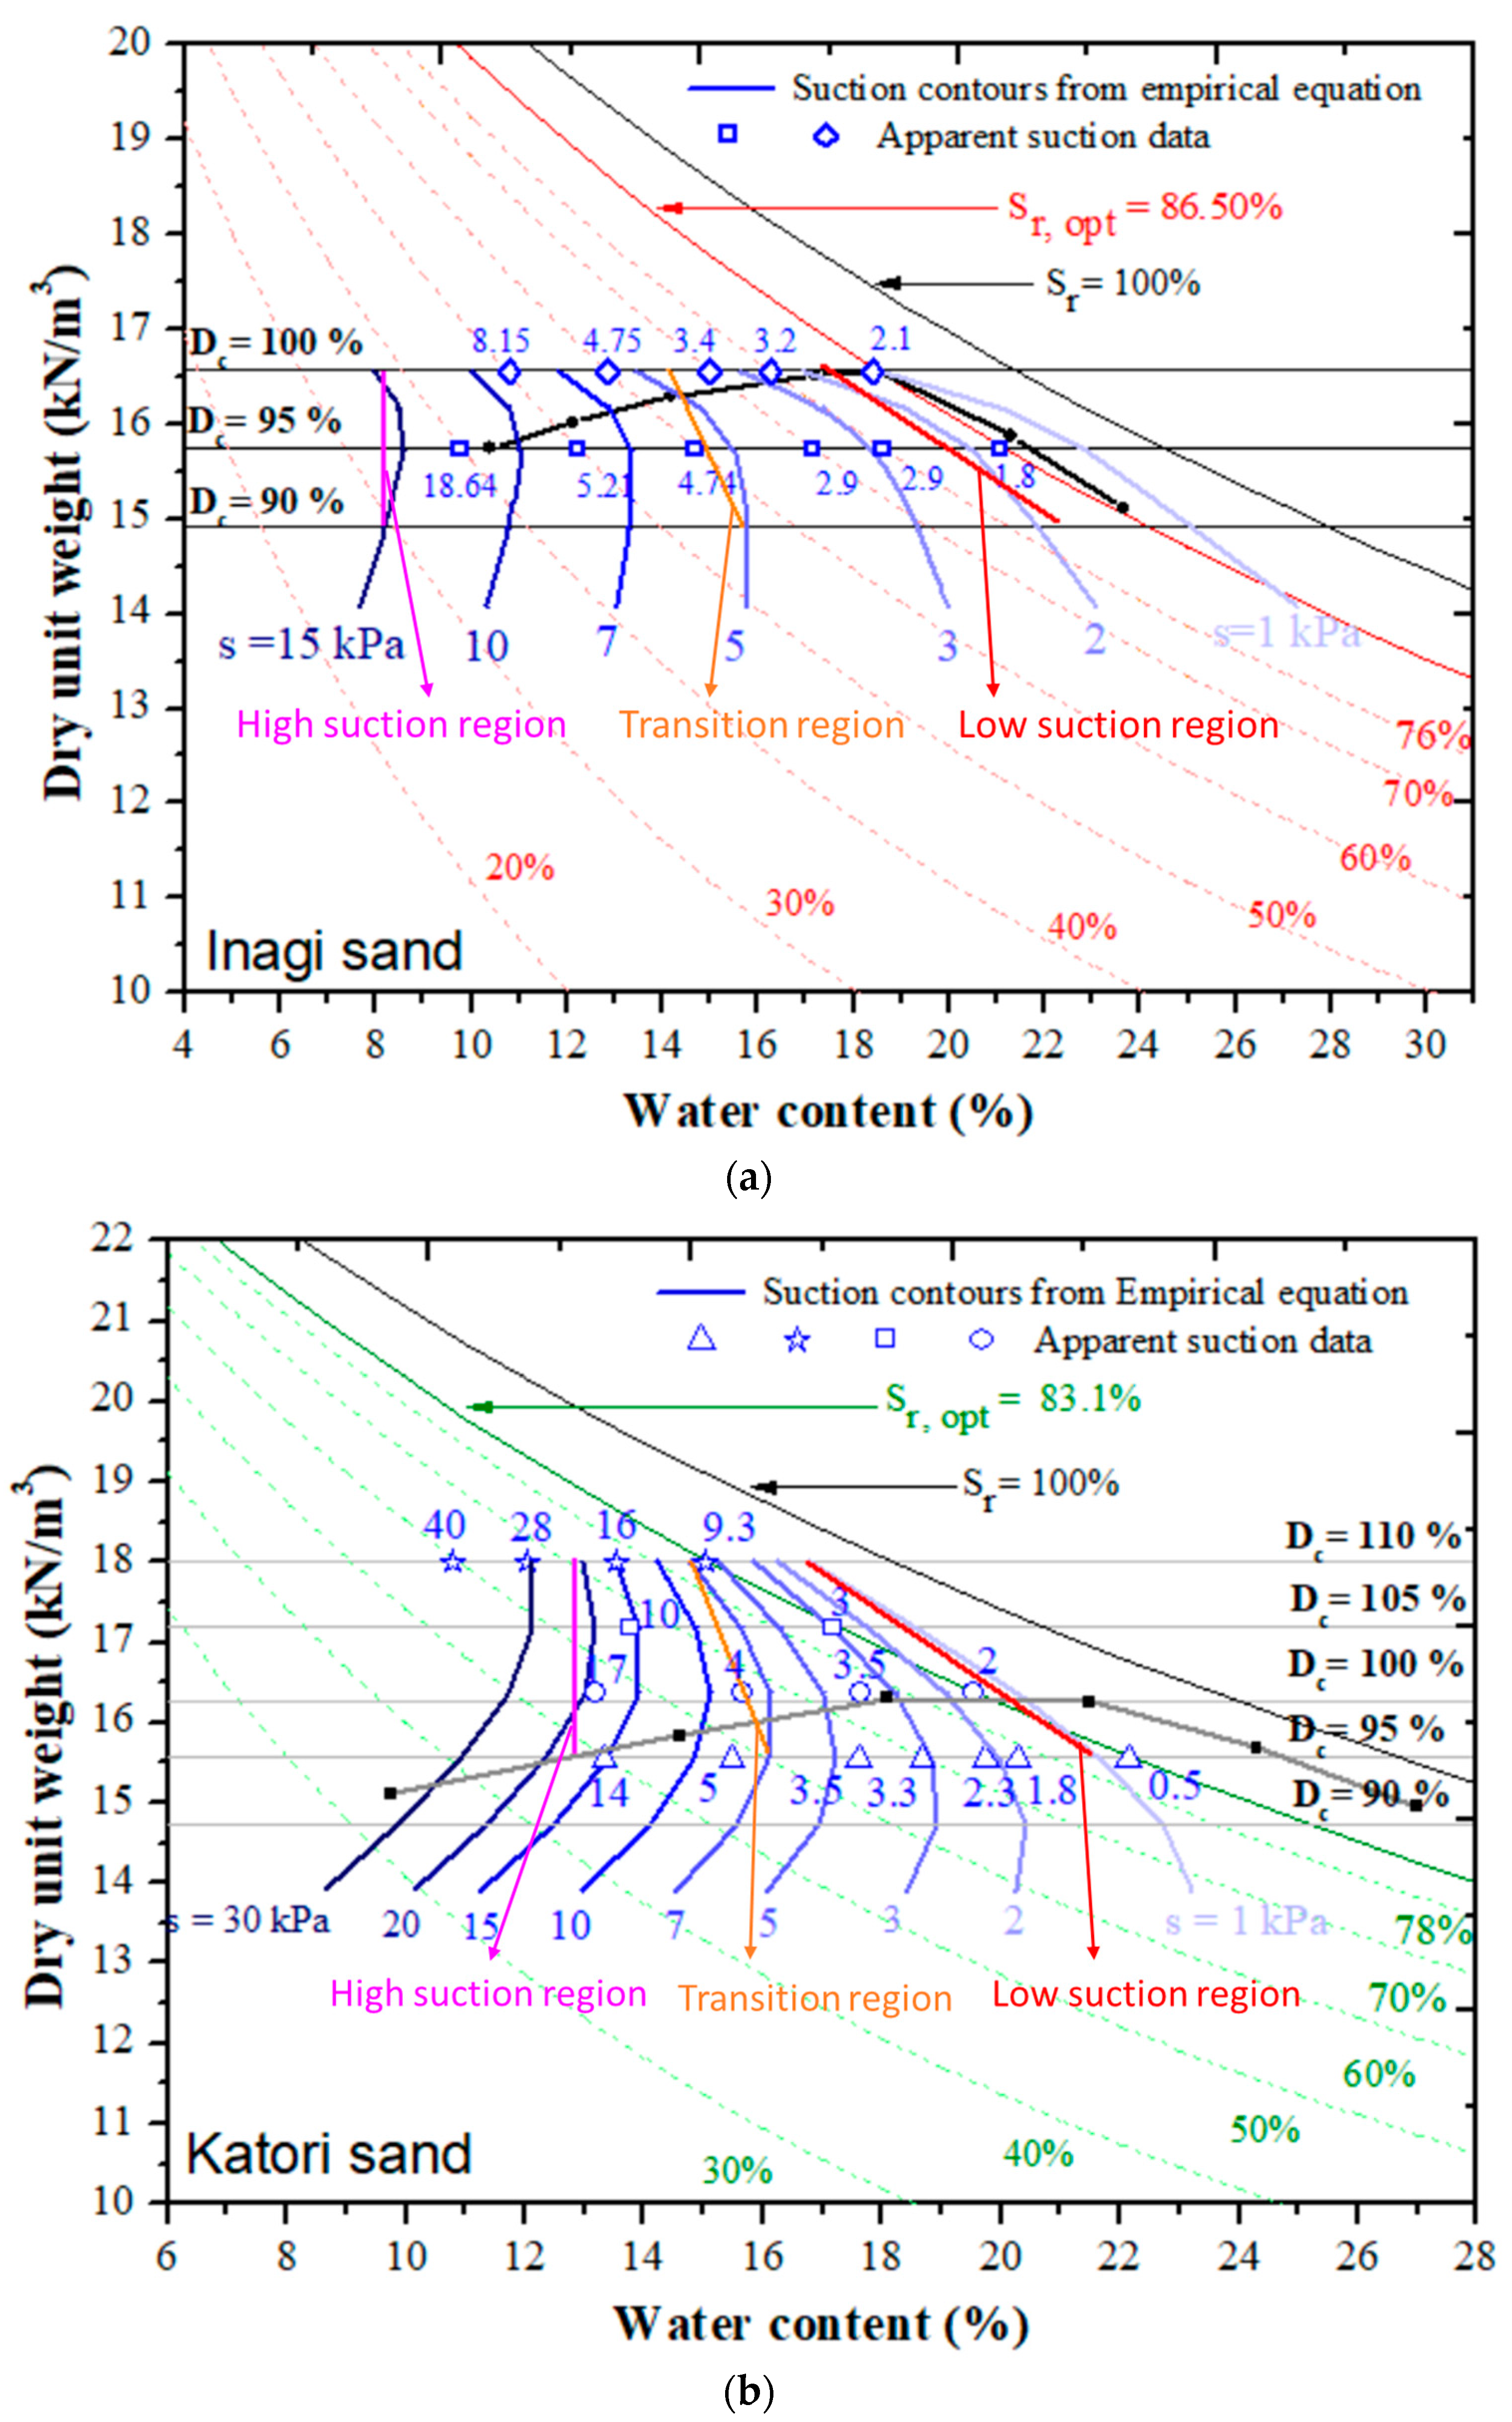
where s is the apparent suction, n, A , and B are parameters. To best fit the experimental data, these parameters can be obtained by the least square optimization method using experimental data. Using this empirical relationship with the parameters, the suction contour lines are drawn on the compaction curve in Figure 11a,b for the cases of Inagi sand and Katori sand, respectively. In Figure 11a,b, it can be seen that the red line-marked region shows the suction contours which are asymptotic to degree of saturation. The orange line-marked region shows the transition state, and the pink line-marked region converges to the unique line of suction contours. The derived suction contours could explain the effect of suction on each compacted state, such as with density and CEL. To explain the characteristics of the suction contours at different saturations, the microstructure of the soil with changes in saturation is illustrated in the next section.

4.3. Variation of Suction Contours along the Compaction Curve

4.3.1. Effect of Density on Suction at Same Degree of Saturation

Figure 12a and Figure 12b illustrate the suction contours plotted with varying density and saturation for Inagi sand and Katori sand, respectively. It can be observed that across the full range of saturation, the suction contours exhibited an increase in suction with the increase in density at the same degree of saturation. This behavior is explained by the fact that as the the density increases at same saturation, the pore size decreases due to higher compaction. Additionally, the water content also decreases. So, both the reduction in pore size and water content contributes to the increase in suction.
At low saturations, the reduction in pore size is mainly due to the compression of pore air. In such cases, the effect of the reduction in water content is more significant at low saturations. This is why there is a rapid increase in suction with an increase in density at the same saturation in the low saturation range. Hence, the slope of the suction contours is less at low saturations.
Therefore, the slope of the suction contours increases with the increase in the saturation. At high saturations, since the water content is adequately high, the effect of water content on the pressure of the capillary liquid is less. This leads to an increase in the slope of the contours.

4.3.2. Effect of Density on Suction at Same Water Content

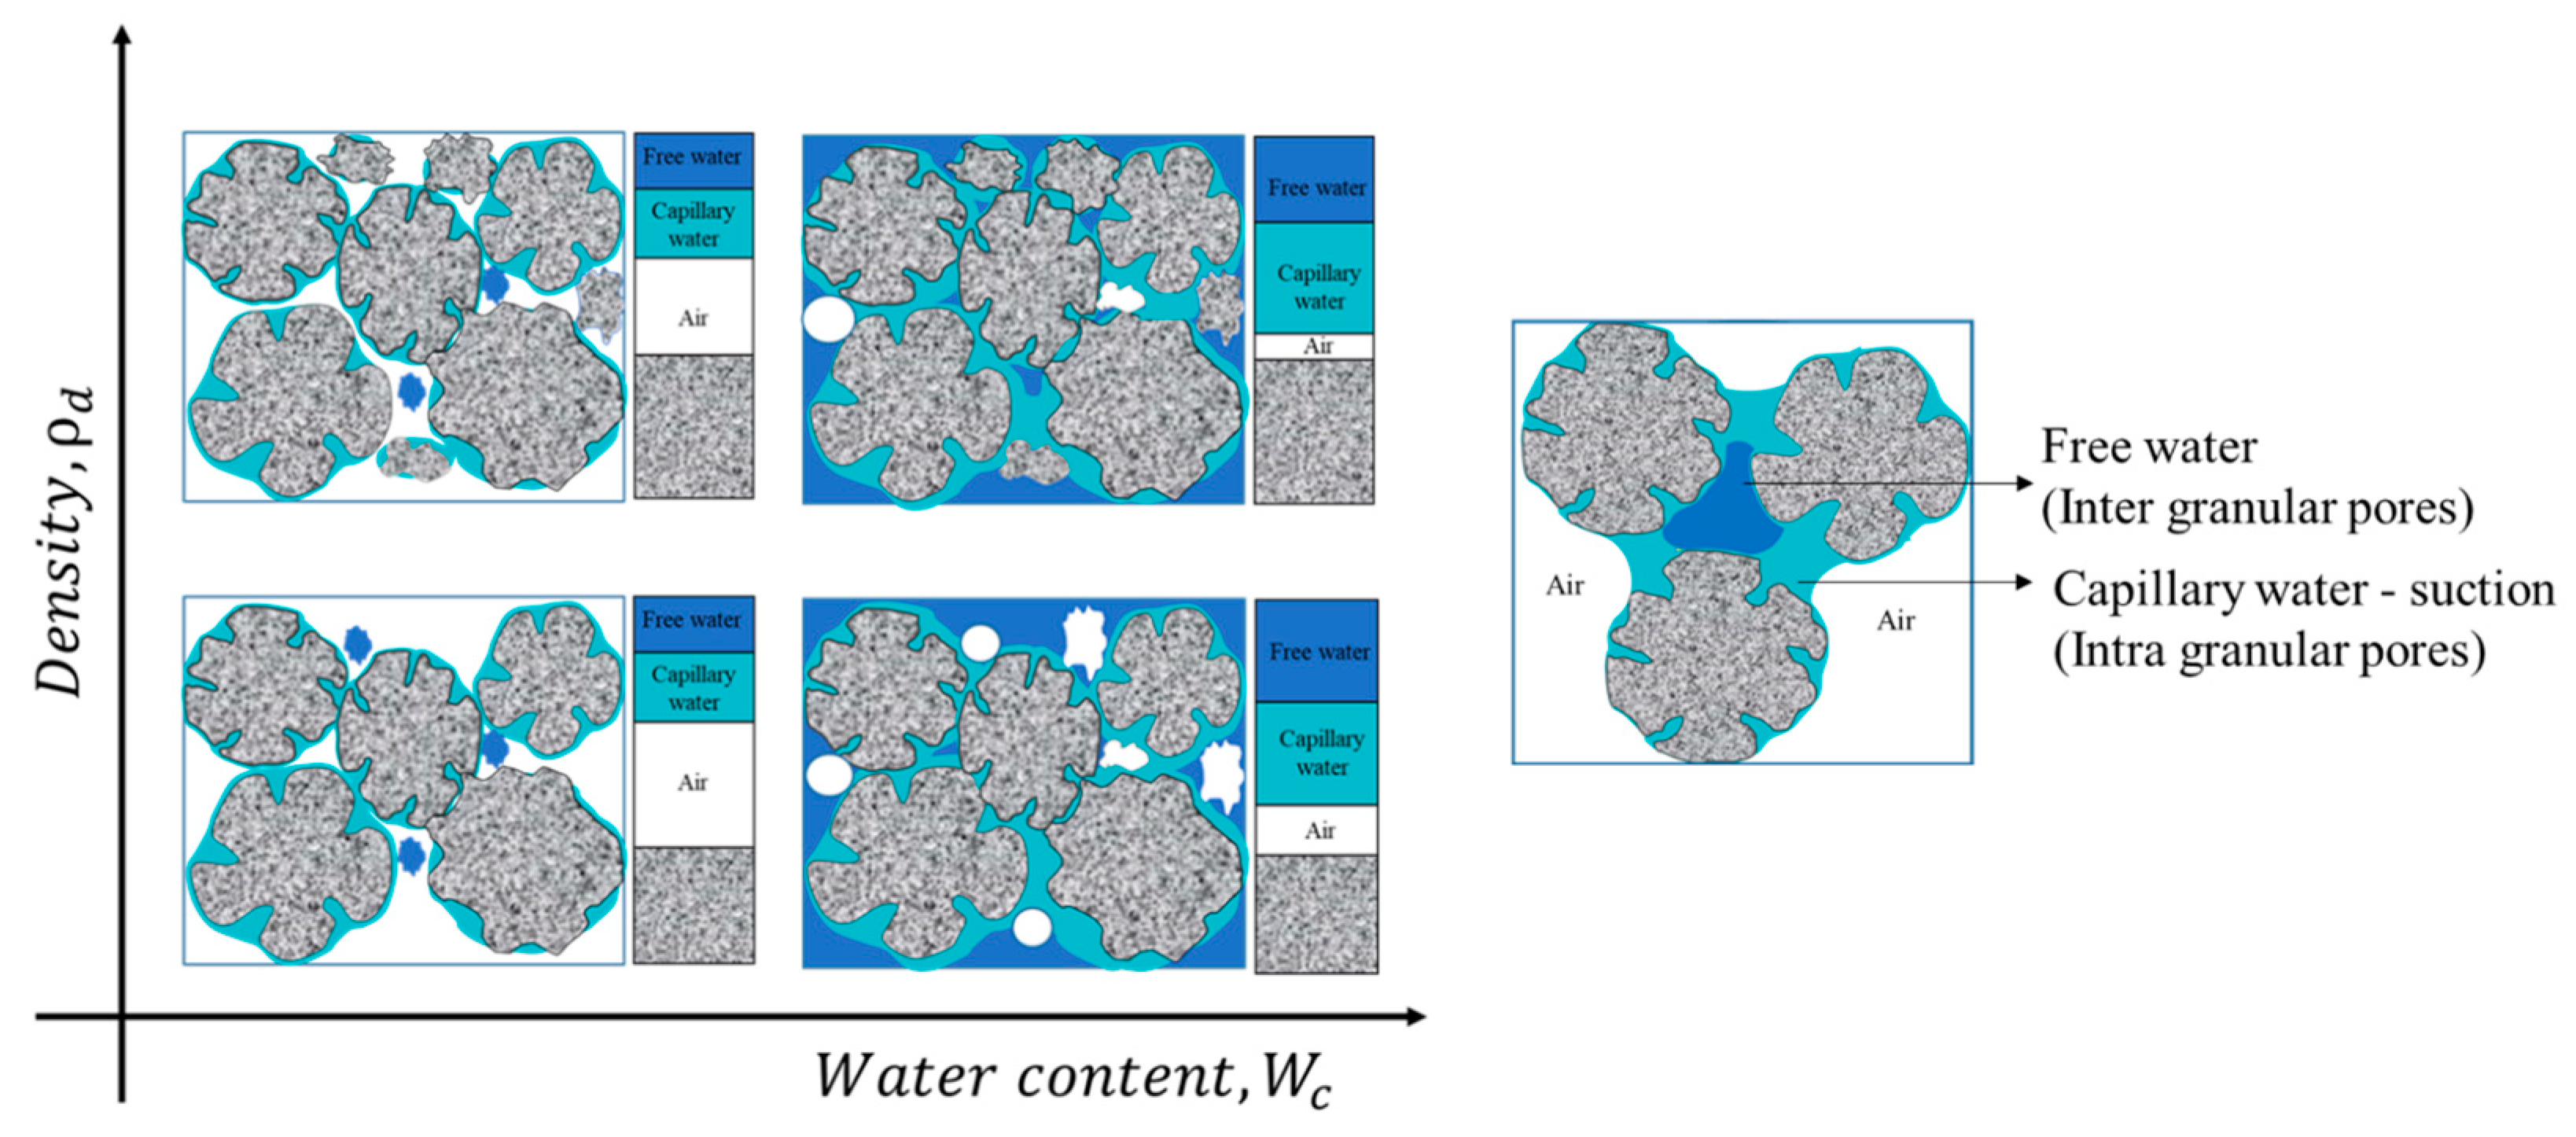
To comprehend the impact of density on suction at a constant water content, it is necessary to consider the microstructure of the soil. Typically, unsaturated soil consists of both pore air and pore water. The pore water can be further classified into capillary water, which is held in intragranular pores (micropores), and free water in intergranular pores (macropores). This is illustrated in Figure 13.
At low suction range or high degree of saturation:
At high degrees of saturation, the suction decreases with an increase in density at the same water content. The suction contours become asymptotic to the degree of saturation curve at high saturation. It can be observed that the contour in Figure 11a,b is reverse S-shaped (for s < 3 kPa), indicating a decrease in suction with increasing density and decreasing void ratio at the same water content.
The probable reason could be that when the materials are densified, the free water from intergranular pores decreases, and the capillary water from intragranular pores increases. However, Delage [35] observed that when the soil is compacted at the range of high saturation, it is difficult to clearly distinguish whether the compression is done by draining the capillary water from micropores or free water from intergranular pores. As a result, it is assumed that the changes in density at the relatively low suction range should have some effect on the capillary water. The microstructure of the soil in Figure 13 at high water content with the changes in density is illustrated clearly. This leads to the conclusion that the amount of water in the specimens may still be controlled by the void ratio, and thus, decreasing the void ratio has a significant effect on the suction value. Therefore, the change in the suction can be significantly observed with the density in the low suction range or at a high degree of saturation.
At high suction range or low degree of saturation:
The fluctuation of suction contours (s > 3 kPa) in Figure 11a,b does not significantly change with the increase in density at high suction range. This is due to the possibility that, at high suction ranges, capillary water retained by van der Waals forces and by micro pores in individual soil particles may prevail. The volume of comparatively large pores can be compressed more easily than that of relatively small pores when the granular materials are densified. It is likely that the volumes of relatively small pores in the specimens with varied densities are similar, despite the fact that the amount of water retained between particles is controlled by relatively small pores. This kind of phenomenon was observed in iron ore material by [36].
This leads to the conclusion that the compression of dry specimens occurs at constant suction because compression is done on air-filled pores of the soil while the pores retained capillary water remain same. The microstructure of the soil in Figure 13 at low water content with the changes in density is illustrated clearly. Therefore, minimal changes in suction are observed with different densities in the high suction range or at a low degree of saturation. Other studies have also shown similar findings for clayey and silty sand materials [15] and bentonite [13,37]. The reason for this phenomenon in clayey materials can be attributed to the presence of a significant amount of water within the clay particle layers, which is known as intra-aggregate water. The amount of intra-aggregate water in clay is mainly determined by the clay particles themselves, and thus the void ratio has less impact on the gravimetric water content [38,39].
Thus, the void ratio at the high suction range did not significantly affect the relationship between suction and gravimetric water content. Hence, the relationship between the suction and water content converges to the unique line of suction contours with increasing density.

4.3.3. Effect of Suction on Compaction Energy Level

In Figure 11a,b, at the same compaction energy level (CEL), the suction increases with the decrease in water content ( w < w o p t ). This leads to a rapid increase in the strength and rigidity of the soil specimen, posing challenges for field compaction. Consequently, despite using the same compaction energy level, the density of the soil decreases. Furthermore, Figure 11b clearly demonstrates that even a slight change in the degree of saturation at higher compaction energy levels causes a significant and immediately noticeable rise or decline in apparent suction. This phenomenon observed in the Katori sand highlights how such sudden variations in suction promptly impact the compaction characteristics of the soil. As a result, these abrupt changes in suction can significantly influence the behavior of the compacted soil over its lifespan when considering changes in saturation (drying/wetting). However, further research is needed to gain a better understanding of how the behavior of compacted soil changes after compaction under the influence of saturation. Given these findings, it is crucial to exercise precise control over the degree of saturation to achieve the desired properties of compacted soil, particularly when employing higher compaction efforts for utilizing the various types of soils.

5. Conclusions

The current study outlines the influence of suction on the compaction curve of the two types of soil using the two different measurement techniques. A comparative study was conducted by obtaining the SWCC using pressure plate apparatus and the measuring apparent suction values using a membrane filter method with a triaxial apparatus. Empirical equations were derived from the measured apparent suction values to understand the suction behavior on the compaction curve. Accordingly, the following conclusions were drawn:
  • The measurement of suction using the membrane filter method with a triaxial apparatus (apparent suction) is an efficient and reliable technique that replicates field conditions.
  • With an increase in the initial density at the same degree of saturation, the suction value increases as the pore size and number of pores increases. Therefore, the air entry value increases with the increase in the initial dry density.
  • Comparison of apparent suction with the imposed suction from the soil-water characteristic curve (SWCC) reveals that apparent suction closely follows the wetting curve of the SWCC. This suggests that the suction during field compaction is more closely related to the imposed suction from the minimum hysteresis range of the SWCC, which is the wetting curve.
  • At high water contents, the suction decreases with increasing density, indicating that the compression of intergranular pores and an increase in capillary water in micropores dominate the changes in suction. However, at low water contents, the suction contours show minimal changes with increasing density, suggesting that the compression of air-filled pores and retention of capillary water in micropores remain relatively constant.
  • At the same compaction energy level (CEL), the suction in compacted soil tends to increase as the water content decreases ( w < w o p t ), which in turn makes compaction more difficult in the field. Additionally, it is crucial to note that at higher compaction efforts, even slight changes in the degree of saturation can lead to significant variations in apparent suction. This highlights the need for precise control of the degree of saturation during compaction at higher efforts to achieve the desired characteristics of the compacted soil.
Overall, the results suggest that suction plays a significant role in the compaction behavior of unsaturated soils, and the variation of suction contours along the compaction curve is influenced by factors such as density, saturation, and water content. Understanding the effect of suction on the compaction behavior of unsaturated soils is crucial for predicting their mechanical properties and performance in geotechnical applications.
By establishing the link between suction and compaction parameters, our research offers valuable insights for practical applications. Geotechnical engineers and construction professionals can use this information to optimize the compaction process of unsaturated soils, ensuring the desired level of density and saturation for specific engineering projects. Proper compaction control is vital for achieving the desired soil behavior and stability, which, in turn, ensures the safety and long-term performance of geotechnical structures. Further research and experimentation are, however, needed to fully comprehend the complex interactions and enhance the reliability of proposed empirical equations related to suction, density, and water content in unsaturated soil compaction.

Author Contributions

B.C.—Conceptualization, Methodology, Data curation, Investigation, Writing—original draft. K.W.—Supervision, Writing—review & editing. All authors have read and agreed to the published version of the manuscript.

Funding

The authors declare no specific funding for this work.

Data Availability Statement

Data will be made available on request.

Acknowledgments

The authors gratefully acknowledge Hiroyuki Kyokawa (Nagoya Institute of Technology, formerly the University of Tokyo, Japan) and Takeshi Sato (Integrated Geotechnology Institute, Japan) for their valuable feedback and suggestions. The authors also like to express their gratitude to Akshay Singh Rathore (Senior manager, NHSRCL, India, formerly the University of Tokyo) for his kind support in the experimental methodology.

Conflicts of Interest

The authors declare no conflict of interest.

References

  1. Tatsuoka, F.; Fujishiro, K.; Tateyama, K.; Kawabe, S.; Kikuchi, Y. Properties of Compacted Soil as a Function of Dry Density and the Degree of Saturation. In Proceedings of the 15th Asian Regional Conference on Soil Mechanics and Geotechnical Engineering (15 ARC), Fukuoka, Japan, 9–13 November 2015; pp. 247–252. [Google Scholar] [CrossRef] [Green Version]
  2. Tatsuoka, F.; Gomes Correia, A. Importance of Controlling the Degree of Saturation in Soil Compaction Linked to Soil Structure Design. Transp. Geotech. 2018, 17, 3–23. [Google Scholar] [CrossRef]
  3. Fredlund, D.G.; Rahardjo, H. Soil Mechanics for Unsaturated Soils; John Wiley & Sons: Hoboken, NJ, USA, 1993. [Google Scholar]
  4. Al-Mahbashi, A.M.; Al-Shamrani, M.A.; Moghal, A.A.B. Soil–Water Characteristic Curve and One-Dimensional Deformation Characteristics of Fiber-Reinforced Lime-Blended Expansive Soil. J. Mater. Civ. Eng. 2020, 32, 1–9. [Google Scholar] [CrossRef]
  5. Deng, D.; Wen, S.; Lu, K.; Li, L. Calculation Model for the Shear Strength of Unsaturated Soil under Nonlinear Strength Theory. Geomech. Eng. 2020, 21, 247. [Google Scholar]
  6. Zhai, Q.; Rahardjo, H.; Satyanaga, A.; Dai, G. Estimation of Tensile Strength of Sandy Soil from Soil–Water Characteristic Curve. Acta Geotech. 2020, 15, 3371–3381. [Google Scholar] [CrossRef]
  7. Cui, Y.J.; Delage, P. Yielding and Plastic Behaviour of an Unsaturated Compacted Silt. Geotechnique 1996, 46, 291–311. [Google Scholar] [CrossRef]
  8. Fredlund, D.G.; Vanapalli, S.K. Shear Strength of Unsaturated Soils. Methods Soil Anal. Part 4 Phys. Methods 2018, 321, 329–361. [Google Scholar] [CrossRef]
  9. Hilf, J.W. An Investigation of Pore-Water Pressure in Compacted Cohesive Soils; University of Colorado at Boulder: Boulder, CO, USA, 1956. [Google Scholar]
  10. Vanapalli, S.K.; Nicotera, M.V.; Sharma, R.S. Axis Translation and Negative Water Column Techniques for Suction Control. Geotech. Geol. Eng. 2008, 26, 645–660. [Google Scholar] [CrossRef]
  11. Hedayati, M.; Hossain, M.S.; Mehdibeigi, A.; Thian, B. Real-Time Modeling of Moisture Distribution in Subgrade Soils. In Proceedings of the Geo-Congress 2014: Geo-Characterization and Modeling for Sustainability, Atlanta, GA, USA, 23–26 February 2014; pp. 3015–3024. [Google Scholar]
  12. Sun, D.; Sheng, D.; Xu, Y. Collapse Behaviour of Unsaturated Compacted Soil with Different Initial Densities. Can. Geotech. J. 2007, 44, 673–686. [Google Scholar] [CrossRef]
  13. Romero, E.; Gens, A.; Lloret, A. Water Permeability, Water Retention and Microstructure of Unsaturated Compacted Boom Clay. Eng. Geol. 1999, 54, 117–127. [Google Scholar] [CrossRef]
  14. Birle, E.; Heyer, D.; Vogt, N. Influence of the Initial Water Content and Dry Density on the Soil–Water Retention Curve and the Shrinkage Behavior of a Compacted Clay. Acta Geotech. 2008, 3, 191–200. [Google Scholar] [CrossRef]
  15. Salager, S.; Nuth, M.; Ferrari, A.; Laloui, L. Investigation into Water Retention Behaviour of Deformable Soils. Can. Geotech. J. 2013, 50, 200–208. [Google Scholar] [CrossRef]
  16. Lourenço, S.; Gallipoli, D.; Toll, D.; Evans, F.; Medero, G. Determination of the Soil Water Retention Curve with Tensiometers. In Experimental Unsaturated Soil Mechanics; Springer: Berlin/Heidelberg, Germany, 2007; pp. 95–102. [Google Scholar]
  17. Murray, E.J.; Sivakumar, V. Unsaturated Soils: A Fundamental Interpretation of Soil Behaviour; John Wiley & Sons: Hoboken, NJ, USA, 2010. [Google Scholar]
  18. Toll, D.G.; Lourenço, S.D.N.; Mendes, J. Advances in Suction Measurements Using High Suction Tensiometers. Eng. Geol. 2012, 165, 29–37. [Google Scholar] [CrossRef] [Green Version]
  19. Nishimura. Earthquake-Induced Landslides. In Proceedings of the International Symposium on Earthquake-Induced Landslides, Kiryu, Japan, 7–9 November 2013. [Google Scholar] [CrossRef]
  20. Wang, H.; Koseki, J.; Nishimura, T.; Miyashita, Y. Membrane Filter Properties and Application of the Filter to Undrained Cyclic Triaxial Test of Unsaturated Materials. Can. Geotech. J. 2017, 54, 1196–1202. [Google Scholar] [CrossRef]
  21. Rs, L. Preparing Test Specimens Using Undercompaction. Int. J. Rock Mech. Min. Sci. Geomech. Abstr. 1979, 16, 50. [Google Scholar] [CrossRef]
  22. Ishikawa, T.; Zhang, Y.; Tokoro, T.; Miura, S. Medium-Size Triaxial Apparatus for Unsaturated Granular Subbase Course Materials. Soils Found. 2014, 54, 67–80. [Google Scholar] [CrossRef] [Green Version]
  23. Wang, H.; Koseki, J.; Sato, T.; Chiaro, G.; Tan Tian, J. Effect of Saturation on Liquefaction Resistance of Iron Ore Fines and Two Sandy Soils. Soils Found. 2016, 56, 732–744. [Google Scholar] [CrossRef]
  24. Van Genuchten, M.T. A Closed-Form Equation for Predicting the Hydraulic Conductivity of Unsaturated Soils. Soil Sci. Soc. Am. J. 1980, 44, 892–898. [Google Scholar] [CrossRef] [Green Version]
  25. Mualem, Y. A New Model for Predicting the Hydraulic Conductivity of Unsaturated Porous Media. Water Resour. Res. 1976, 12, 513–522. [Google Scholar] [CrossRef] [Green Version]
  26. Aitchison, G.D. Relationships of Moisture Stress and Effective Stress Functions in Unsaturated Soils. In Golden Jubilee of the International Society for Soil Mechanics and Foundation Engineering: Commemorative Volume; Institution of Engineers: Barton, ACT, Australia, 1985; pp. 20–25. [Google Scholar]
  27. Gallage, C.P.K.; Uchimura, T. Effects of Dry Density and Grain Size Distribution on Soil-Water Characteristic Curves of Sandy Soils. Soils Found. 2010, 50, 161–172. [Google Scholar] [CrossRef] [Green Version]
  28. Kimoto, S.; Oka, F.; Fukutani, J.; Yabuki, T.; Nakashima, K. Monotonic and Cyclic Behavior of Unsaturated Sandy Soil under Drained and Fully Undrained Conditions. Soils Found. 2011, 51, 663–681. [Google Scholar] [CrossRef] [Green Version]
  29. Kawai, K.; Karube, D.; Ashida, W.; Kado, Y. Modeling of Water Retention Curves with Effects of Void Ratio. Doboku Gakkai Ronbunshu 2000, 2000, 291–302. [Google Scholar] [CrossRef] [PubMed]
  30. Jiang, X.; Wu, L.; Wei, Y. Influence of Fine Content on the Soil–Water Characteristic Curve of Unsaturated Soils. Geotech. Geol. Eng. 2020, 38, 1371–1378. [Google Scholar] [CrossRef]
  31. Gu, C.; Zhan, Y.; Wang, J.; Cai, Y.; Cao, Z.; Zhang, Q. Resilient and Permanent Deformation of Unsaturated Unbound Granular Materials under Cyclic Loading by the Large-Scale Triaxial Tests. Acta Geotech. 2020, 15, 3343–3356. [Google Scholar] [CrossRef]
  32. Zheng, F.; Shao, S.; Wang, J.; Shao, S. Experimental Study on the Mechanical Behaviour of Natural Loess Based on Suction-Controlled True Triaxial Tests. KSCE J. Civ. Eng. 2020, 24, 2304–2321. [Google Scholar] [CrossRef]
  33. Nam, S.; Gutierrez, M.; Diplas, P.; Petrie, J. Determination of the Shear Strength of Unsaturated Soils Using the Multistage Direct Shear Test. Eng. Geol. 2011, 122, 272–280. [Google Scholar] [CrossRef]
  34. Tatsuoka, F.; Hashimoto, T.; Tateyama, K. Soil Stiffness as a Function of Dry Density and the Degree of Saturation for Compaction Control. Soils Found. 2021, 61, 989–1002. [Google Scholar] [CrossRef]
  35. Delage, P. Experimental Unsaturated Soil Mechanics. Vadose Zo. J. 2008, 9, 196. [Google Scholar] [CrossRef] [Green Version]
  36. Wang, H.; Koseki, J.; Nishimura, T. Water Retention Characteristics of Iron Ore Fines. Can. Geotech. J. 2020, 57, 1427–1437. [Google Scholar] [CrossRef]
  37. Lloret, A.; Villar, M.V.; Sànchez, M.; Gens, A.; Pintado, X.; Alonso, E.E. Mechanical Behaviour of Heavily Compacted Bentonite under High Suction Changes. Geotechnique 2003, 53, 27–40. [Google Scholar] [CrossRef]
  38. Bradbury, M.H.; Baeyens, B. Nuclear Energy and Safety Research Department Porewater Chemistry in Compacted Re-Saturated MX-80 Bentonite: Physico-Chemical Characterisation and Geochemical Modelling Porewater Chemistry in Compacted Re-Saturated MX-80 Bentonite: Physico-Chemical Char; PSI Bericht 02-10; Paul Scherrer Institut: Villigen, Switzerland, 2002. [Google Scholar]
  39. Jacinto, A.C.; Villar, M.V.; Ledesma, A. Influence of Water Density on the Water-Retention Curve of Expansive Clays. Geotechnique 2012, 62, 657–667. [Google Scholar] [CrossRef]
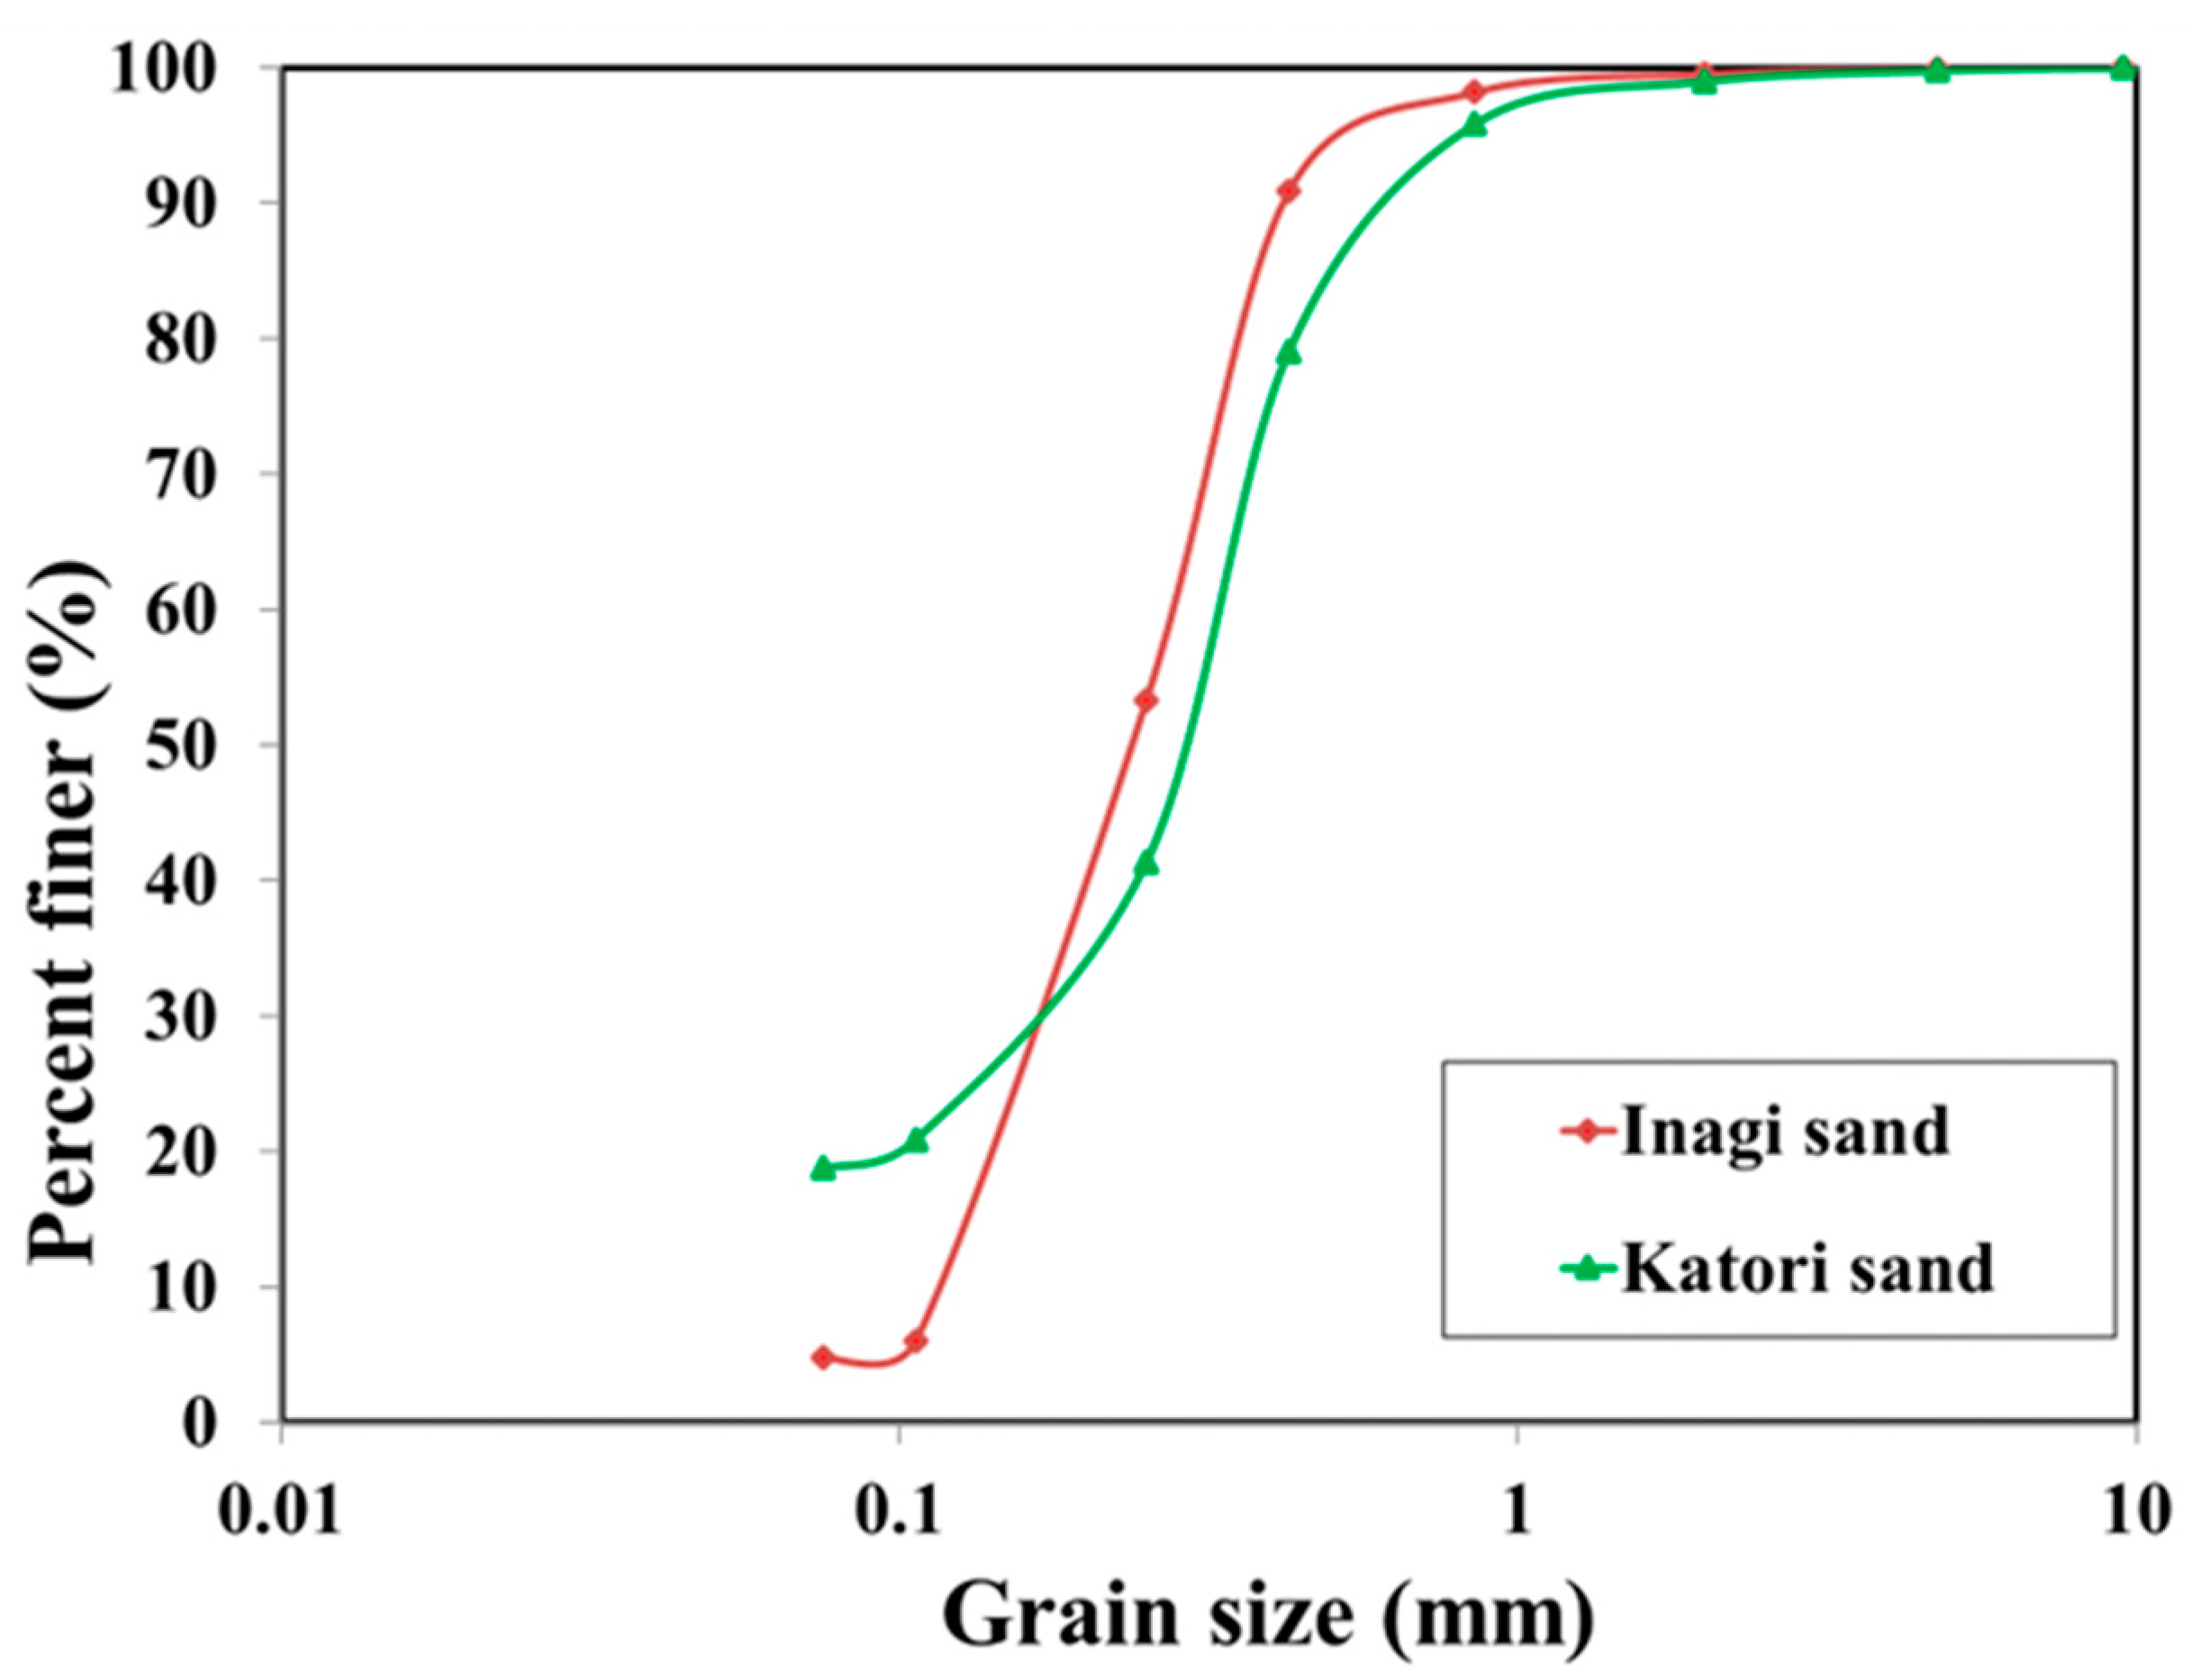
Figure 1. Particle size distribution curves of soils.
Geotechnics 03 00042 g001
Figure 2. Pressure plate apparatus equipped with a membrane filter.
Geotechnics 03 00042 g002
Figure 3. Linkage double cell triaxial apparatus with ability to control and measure suction (modified from [20]).
Geotechnics 03 00042 g003
Figure 4. Soil water characteristic curve for Inagi sand at ρ d = 1.60 g/cm3 ( D c = 95%). Black square—Experimental data—SWCC; red line—Curve fit (Van genuchten [24]).
Geotechnics 03 00042 g004
Figure 5. Comparison of SWCC with different initial densities: (a) Inagi sand (b) Katori sand.
Geotechnics 03 00042 g005
Figure 6. Effect of initial density on air entry value (AEV) and van Genuchten (1980) parameters α.
Geotechnics 03 00042 g006
Figure 7. Determining the apparent suction from the time history of suction for Inagi sand at D c = 95%.
Geotechnics 03 00042 g007
Figure 8. Detailed full range measurement showing time history of suction for sandy soils at D c = 95%. (a) Inagi sand (b) Katori sand.
Geotechnics 03 00042 g008
Figure 9. Comparison of measured apparent suction from Triaxial apparatus and SWCC curve. (a) Inagi sand (b) Katori sand.
Geotechnics 03 00042 g009
Figure 10. Variation of suction in dry density—degree of saturation relationship ( ρ d S r ) and fitted empirical function. (a) Inagi sand (b) Katori sand.
Geotechnics 03 00042 g010
Figure 11. Suction contours drawn on compaction curve based on empirical fitted function along with the measured apparent suction values. (a) Inagi sand (b) Katori sand.
Geotechnics 03 00042 g011
Figure 12. Suction contours plotted with variation of density and saturation. (a) Inagi sand (b) Katori sand.
Geotechnics 03 00042 g012
Figure 13. Schematic illustration of the microstructure of the soil with the changes in density and water content.
Geotechnics 03 00042 g013
Table 1. Physical properties of the soils.
MaterialInagi SandKatori Sand
Fines Content ( F c   % )4.7518.80
Specific Gravity, G s 2.6452.754
ρ d m a x (g/cm3)1.691.67
D 10 (mm)0.120.07
D 30 (mm)0.180.17
D 60 (mm)0.280.33
U c 0.961.14
U c 2.384.48
W o p t ( % )18.519.6
S r ,   o p t ( % )86.583.1
Table 2. Test conditions of soil specimens tested for SWCC using membrane filter technique.
Test
Material
Fines ContentSpecific GravityVoid RatioDry
Density
Degree of CompactionVan Genuchten Parameters [24] Saturated
Water Content
Residual
Water
Content
Air Entry Value
F c (%) G s e ρ d , m a x (g/cm3) D c (%) α n θ s (%) θ r (%) AEV
Inagi sand4.752.641.0101.35801.973.470.490.132.25
0.741.52901.54.660.420.153.8
0.6491.60951.275.750.390.184.4
0.5661.691001.194.930.370.204.85
Katori sand—F1818.82.751.0611.33802.254.460.490.202.1
0.7351.58951.653.380.410.222.9
0.6491.671001.264.530.380.244.25
0.571.751051.274.80.360.274.5
0.491.831101.256.650.310.245
Table 3. Measured apparent suction values using membrane filter method in triaxial apparatus from triaxial apparatus for soils varying degree of compaction and degree of saturation.
Test MaterialFines Content Specific GravityVoid RatioDry DensityDegree of
Compaction
Degree of
Saturation
Apparent
Suction
F c (%) G s e ρ d (g/cm3) D c (%) S r (%) s (kPa)
Inagi sand4.752.640.6491.60954018.64
0.6491.6095505.21
0.6491.6095604.74
0.6491.6095702.99
0.6491.6095762.98
0.6491.6095861.85
0.5661.69100508.15
0.5661.69100604.75
0.5661.69100703.4
0.5661.69100763.2
0.5661.69100862.1
Katori sand—F1818.82.750.7351.5895830.5
0.7351.5895761.8
0.7351.5895742.34
0.7351.5895703.5
0.7351.5895663.3
0.7351.5895585.2
0.7351.58955014.75
0.6491.67100832.0
0.6491.6710074.83.5
0.6491.6710066.56.2
0.6491.671005617.12
0.571.75105833.0
0.571.7510566.510.5
0.491.83110839.3
0.491.8311074.816
0.491.8311066.528.5
0.491.831105843.4
Disclaimer/Publisher’s Note: The statements, opinions and data contained in all publications are solely those of the individual author(s) and contributor(s) and not of MDPI and/or the editor(s). MDPI and/or the editor(s) disclaim responsibility for any injury to people or property resulting from any ideas, methods, instructions or products referred to in the content.