Review

Relationships between Soil Moisture and Visible–NIR Soil Reflectance: A Review Presenting New Analyses and Data to Fill the Gaps

by
Savannah L. McGuirk
1,2 and
Iver H. Cairns
1,2,*
1
CUAVA, ARC Centre for CubeSats, UAVs and Their Applications, University of Sydney, Camperdown, NSW 2006, Australia
2
School of Physics, University of Sydney, Camperdown, NSW 2006, Australia
*
Author to whom correspondence should be addressed.
Geotechnics 2024, 4(1), 78-108; https://doi.org/10.3390/geotechnics4010005
Submission received: 18 October 2023 / Revised: 24 November 2023 / Accepted: 29 November 2023 / Published: 4 January 2024
(This article belongs to the Special Issue Recent Advances in Geotechnical Engineering (2nd Edition))

Abstract

:
The ability to precisely monitor soil moisture is highly valuable in industries including agriculture and civil engineering. As soil moisture is a spatially erratic and temporally dynamic variable, rapid, cost-effective, widely applicable, and practical techniques are required for monitoring soil moisture at all scales. If a consistent numerical relationship between soil moisture content and soil reflectance can be identified, then soil spectroscopic models may be used to efficiently predict soil moisture content from proximal soil reflectance and/or remotely sensed data. Previous studies have identified a general decrease in visible–NIR soil reflectance as soil moisture content increases, however, the strength, best wavelengths for modelling, and domain of the relationship remain unclear from the current literature. After reviewing the relevant literature and the molecular interactions between water and light in the visible–NIR (400–2500 nm) range, this review presents new analyses and interprets new 1 nm resolution soil reflectance data, collected at >20 moisture levels for ten soil samples. These data are compared to the results of other published studies, extending these as required for further interpretation. Analyses of this new high-resolution dataset demonstrate that linear models are sufficient to characterise the relationship between soil moisture and reflectance in many cases, but relationships are typically exponential. Equations generalising the relationship between soil MC and reflectance are presented for a number of wavelength ranges and combinations. Guidance for the adjustment of these equations to suit other soil types is also provided, to allow others to apply the solutions presented here and to predict soil moisture content in a much wider range of soils.

1. Introduction

Soil moisture content (MC) refers to the amount of water present in the soil at any given point in time and is measured in units of relative volume or relative weight. As moisture is a critical component of productive soils, it is important to be able to monitor soil MC across a landscape. In agricultural settings, the monitoring of soil MC allows the efficient allocation of resources (e.g., irrigation water), synchronisation of planting and harvest activities with climatic conditions, the prevention of salinisation and the maintenance of soil moisture levels for optimal crop growth, disease management and many other purposes [1,2,3,4,5]. In engineering scenarios, soil moisture is relevant to the behaviour and structural integrity of soils [6,7,8]. The measurement and monitoring of soil MC is thus relevant to many real-world contexts and research in this field is ongoing in multiple disciplines. For those applications and many other purposes, there is clear value in the development of rapid, cost-effective, broadly applicable methods for soil moisture monitoring [9,10,11].
A number of experimental methods currently exist for monitoring soil moisture content in a particular location, for example, via soil probes or soil samples and gravimetric measurement [12]. However, these methods are not appropriate for the generation of spatially or temporally continuous, or high-resolution datasets, especially over large areas [13]. At broad scales, point-based data (discrete data points) are limited in their application by the discontinuity between data points, as well as the resources and cost associated with data collection, and the dynamic nature of soil hydraulic properties [14,15]. A rapid, cost-effective and spatially efficient method is instead required, especially to facilitate monitoring over large areas at arbitrary points in time [16,17].
Defined as the study of the interaction of light with matter [18], spectroscopy (also known as spectrophotometry [19]), can be used to characterise the nature and composition of almost any material, including soil. Spectroscopic analysis works by measuring the incident light reflected from a surface or material, and then closely inspecting the data for absorption features or other patterns generated by specific bond vibrations. The bond vibrations and associated wavelengths of interest are determined by the chemistry of the material under analysis. Similarly, the intensity of absorption is typically determined by the number of atoms or molecules able to absorb the radiation. Spectroscopy is an attractive method for soil moisture monitoring as data can be collected with highly efficient, non-destructive means. Remote sensing tools also extend the potential of spectroscopic monitoring of soil moisture content, by offering an opportunity to efficiently collect spatially continuous data over a large area [16,20]. Soil moisture is also relevant to optical remote sensing data products as soil reflectance/albedo is dramatically altered by soil moisture [21,22,23,24,25].
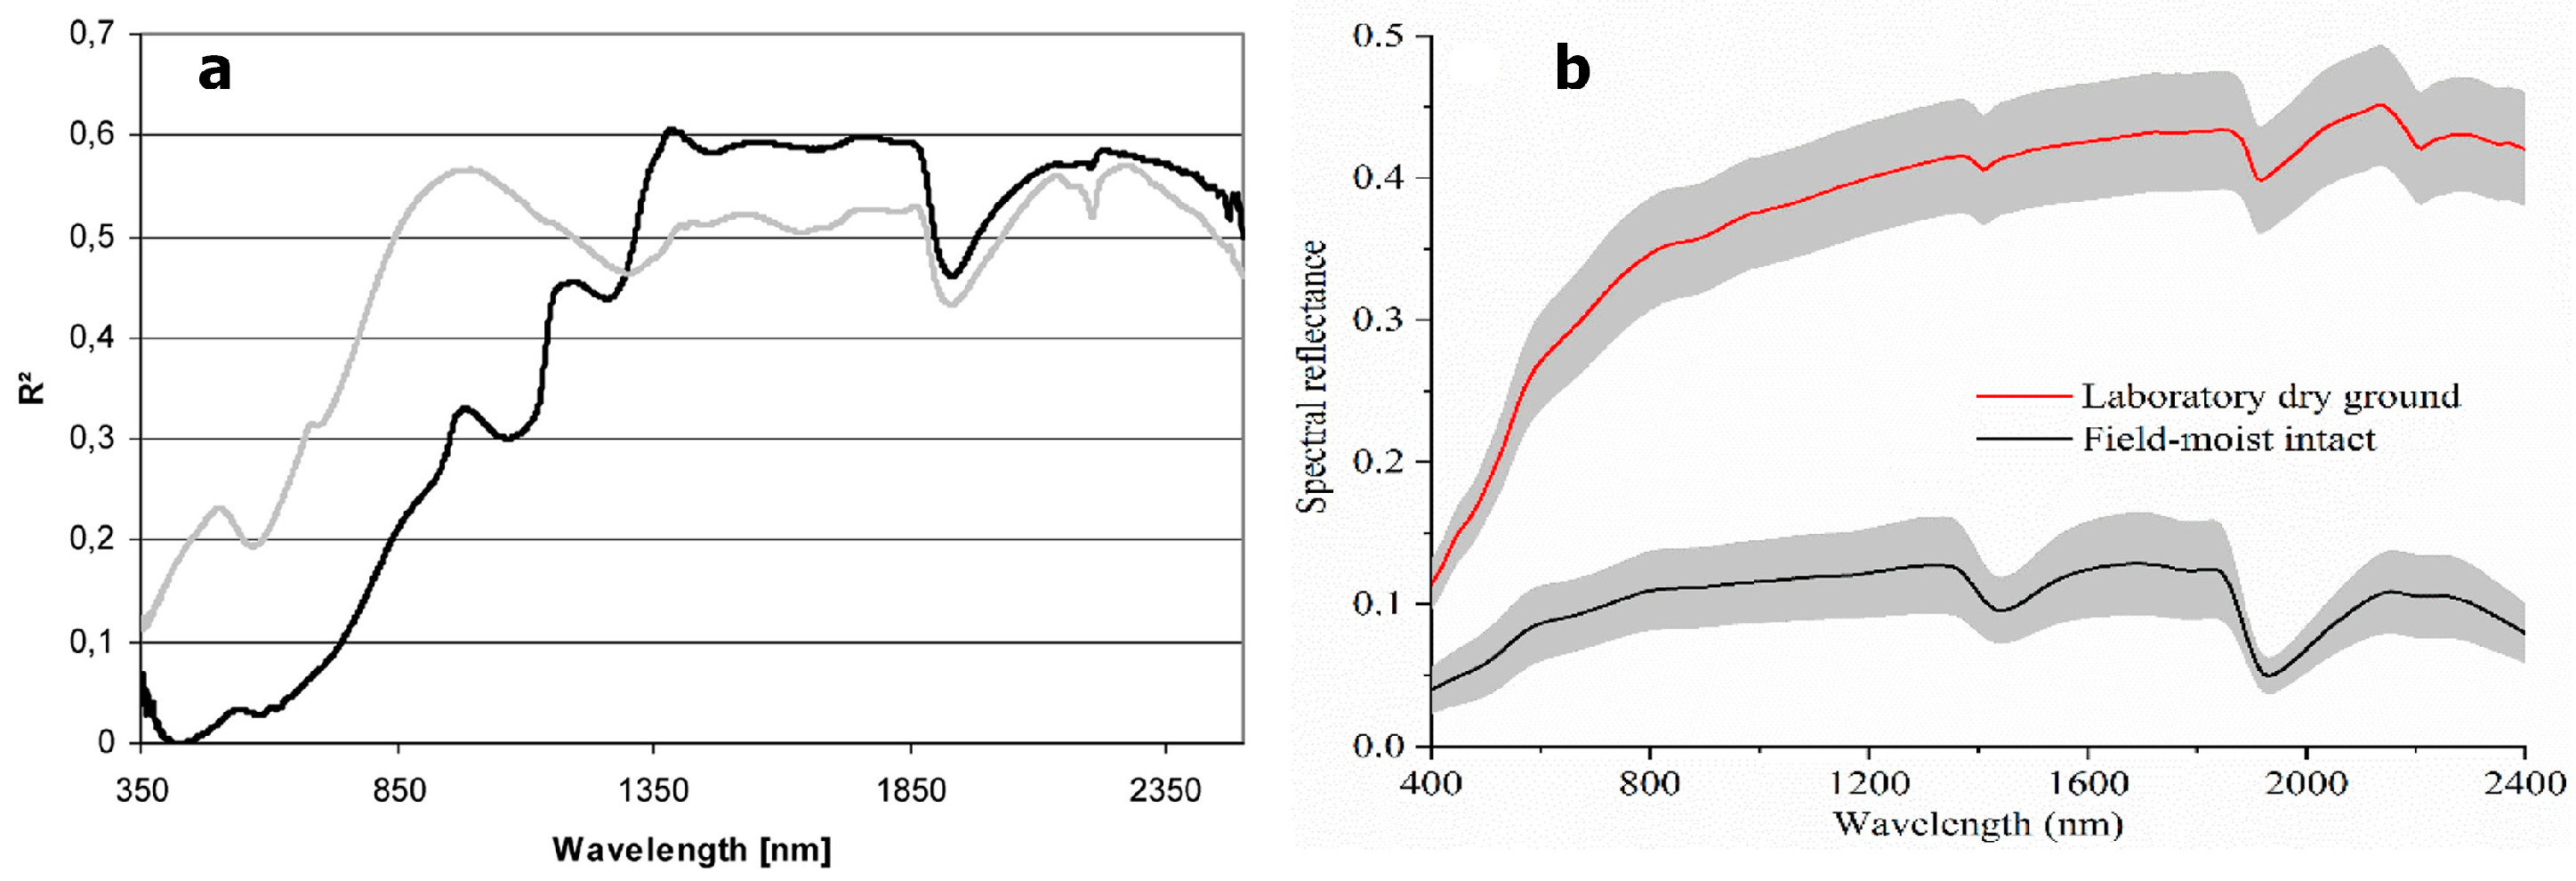
Comprised of two O–H bonds, water molecules generate strong, characteristic absorption features near 1400 nm and 1944 nm [26,27] in the near-infrared (NIR) wavelengths. While these features are clearly apparent in soil reflectance curves (Figure 1, black line) the presence of these absorption features is not sufficient in themselves to identify the moisture content of a sample. Soil characteristics such as texture and organic matter content influence the shape of soil reflectance curves [13,16,28,29,30].
Some general relationships such as a decrease in reflectance with increasing soil MC and the existence of absorption features around 1400 nm and 1900 nm [23,28,32,33] are commonly reported in the relevant literature and investigations of the relationship between soil reflectance and moisture content have been ongoing for more than 50 years, e.g., Bowers and Hanks [34]. Yet, there is still disagreement regarding the nature, intensity (e.g., the y-coefficient), and domain of the relationship. At present, there is also no consensus on the best wavelengths to determine soil moisture content, or which information about co-variates is required for accurate predictions. These disagreements currently prevent the prediction of soil moisture content from soil reflectance data, the correction of soil reflectance data for the purpose of predicting other soil properties [21,33,35], and the correction of remote sensing data for the effects of soil moisture.
Various statistical approaches have been trialled for the estimation of the moisture content of a soil sample. These approaches include estimating soil MC from the first derivative of various NIR bands [36], or applying the Normalised Soil Moisture Index (NSMI) [13,21,30], partial least squares regression [37,38], or generalised least squares weighting algorithms [33]. Using the soil organic carbon (SOC) content of a sample to estimate soil MC [21], fitting a Gaussian function to visible and NIR spectra [39], and estimating soil MC from a decrease in reflectance [40] have also been trialled. These approaches return different results between soil types [13,26,40] and therefore are not broadly applicable.
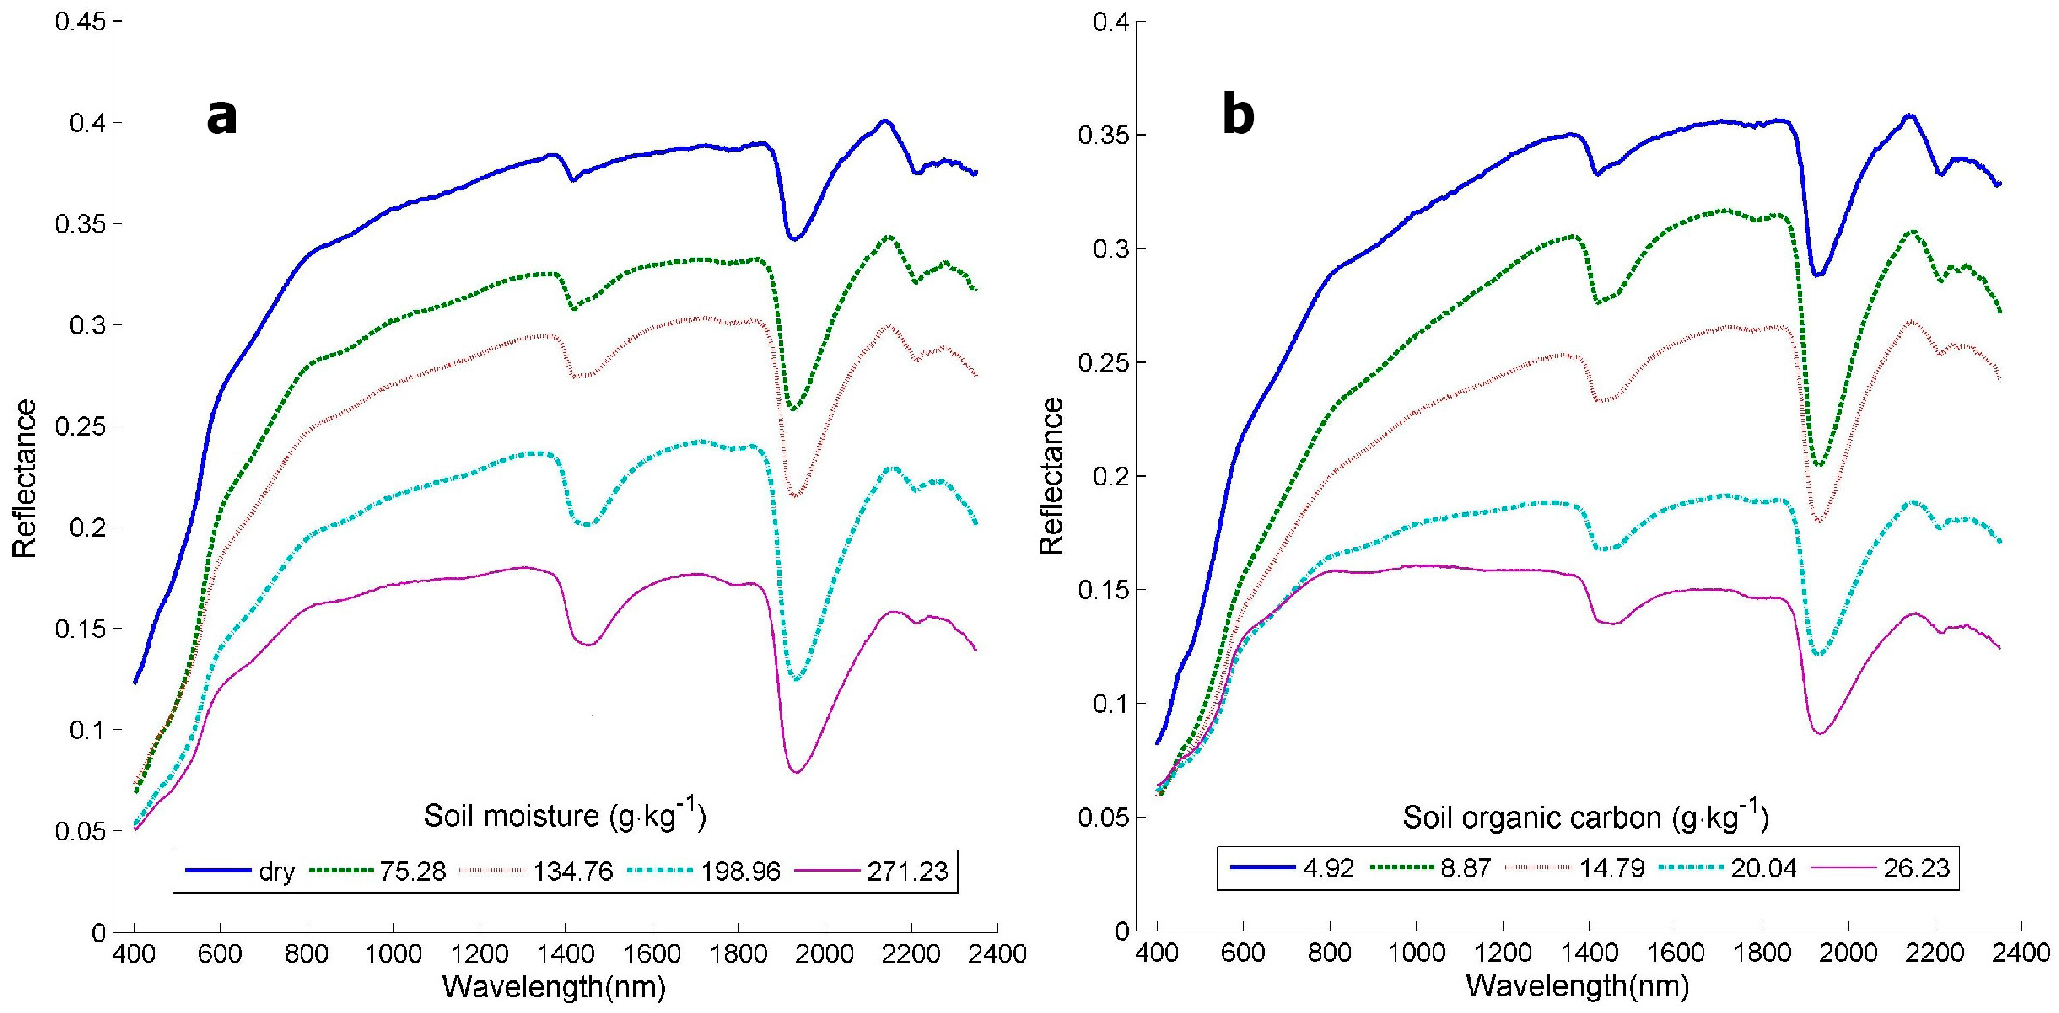
Understanding the relationship between soil reflectance and MC is also valuable for addressing the problem of correcting soil reflectance data for the effects of soil moisture when other soil variables such as soil carbon are the primary interest [21,23,33,41]. Correction of soil spectra for the effects of soil moisture is particularly important in the case of SOC prediction, as soil moisture and soil carbon generate similar spectral features [42] and have a similar influence on soil reflectance (Figure 2a,b). Therefore, the accuracy of SOC prediction algorithms based on remotely sensed, or visible–NIR soil reflectance data should be greatly improved following correction for the spectral effects of soil moisture.
Various approaches for removing the influence of soil moisture on soil reflectance have been evaluated. These approaches include the application of an External Parameter Orthogonalization (EPO) [23,43] or Direct Standardisation [44] to “correct” soil spectra for the effects of soil moisture. Another approach is grouping samples according to their approximate moisture content prior to analysis [45], as opposed to removing the spectral influence of soil moisture. While these statistical techniques are reported to improve the accuracy of predictions from moist soil spectral data [23], interactions between soil reflectance and soil properties are complex [46,47]. Smoothing, spiking or grouping data reduces data resolution and may disguise or remove other important spectral features [48]. Also, none of these approaches currently allow direct quantification of soil moisture content from visible–NIR soil reflectance data.
In summary, the published literature provides the following insights into the relationships between soil MC and visible–NIR soil reflectance:
  • Soil reflectance decreases with increasing MC [30,34,40];
  • Soil moisture generates absorption features around 1400 and 1900 nm [26,28];
  • Absorption associated with soil moisture is higher in the NIR compared to visible wavelengths [30,36].
Three other themes are also prevalent in the published literature, though often poorly characterised or quantified. These are:
4.
The relationship between soil moisture and reflectance differs between soils [40,49];
5.
There is a limited domain for the relationship between increasing soil MC and decreasing reflectance [28,34,40,43];
6.
The upper limit (higher MC) of the relationship between soil MC and reflectance appears under different names such as “Moisture Threshold” (MT) by Whiting, Li [40] and Liu, Zhang [50], and “critical point” by Weidong, Baret [26].
One of the primary discrepancies in the relevant literature is the nature, linear or non-linear, of the relationship between soil MC and reflectance. A systematic search of the literature review reveals classifications of linear [51], non-linear [40,50], logarithmic [26] and exponential [28,34] relationships reported between soil MC and visible–NIR reflectance. There are also claims that no relationship exists between soil reflectance and soil MC [52].
The primary objective of this review is to determine the type (linear or non-linear) and domain of the relationship/s between soil MC and visible–NIR reflectance. This review first summarises and compares the data and results from other studies. Then, new data are presented to facilitate a comprehensive analysis of the effects of soil MC on visible and NIR soil reflectance and to clarify and quantify the relationships between soil MC and reflectance. Some results and models presented in the following sections are entirely new; others support, unify and extend the themes and relationships presented in other studies. This review builds on the work of others by applying a systematic approach to the collection of high-resolution data from 10 soil samples at numerous, regularly spaced MC intervals. Based on this data, new and valuable insights into the nuances of the relationships between soil MC and reflectance are presented.
In Section 2, Section 3 and Section 4, soil reflectance is considered a function of MC for all visible–NIR wavelengths (400–2500 nm). In Section 5, the effect of soil moisture on visible–NIR is examined in soil reflectance data averaged across visible–NIR wavelengths. The general trends are then quantified explicitly in Section 6, with equations describing linear and non-linear relationships between soil MC and soil reflectance for specific wavelength combinations. In Section 7, the accuracy and appropriateness of the Normalised Soil Moisture Index (NSMI) is analysed. Section 2, Section 3 and Section 4, Section 6.1, Section 6.2 and Section 7 directly compare the results of other studies to the new data and results presented. The results of Section 5 and Section 6.3 are not compared to other studies as it appears that these analyses and results are unique.

2. The Effects of Soil MC on Soil Reflectance—Insights from the Literature
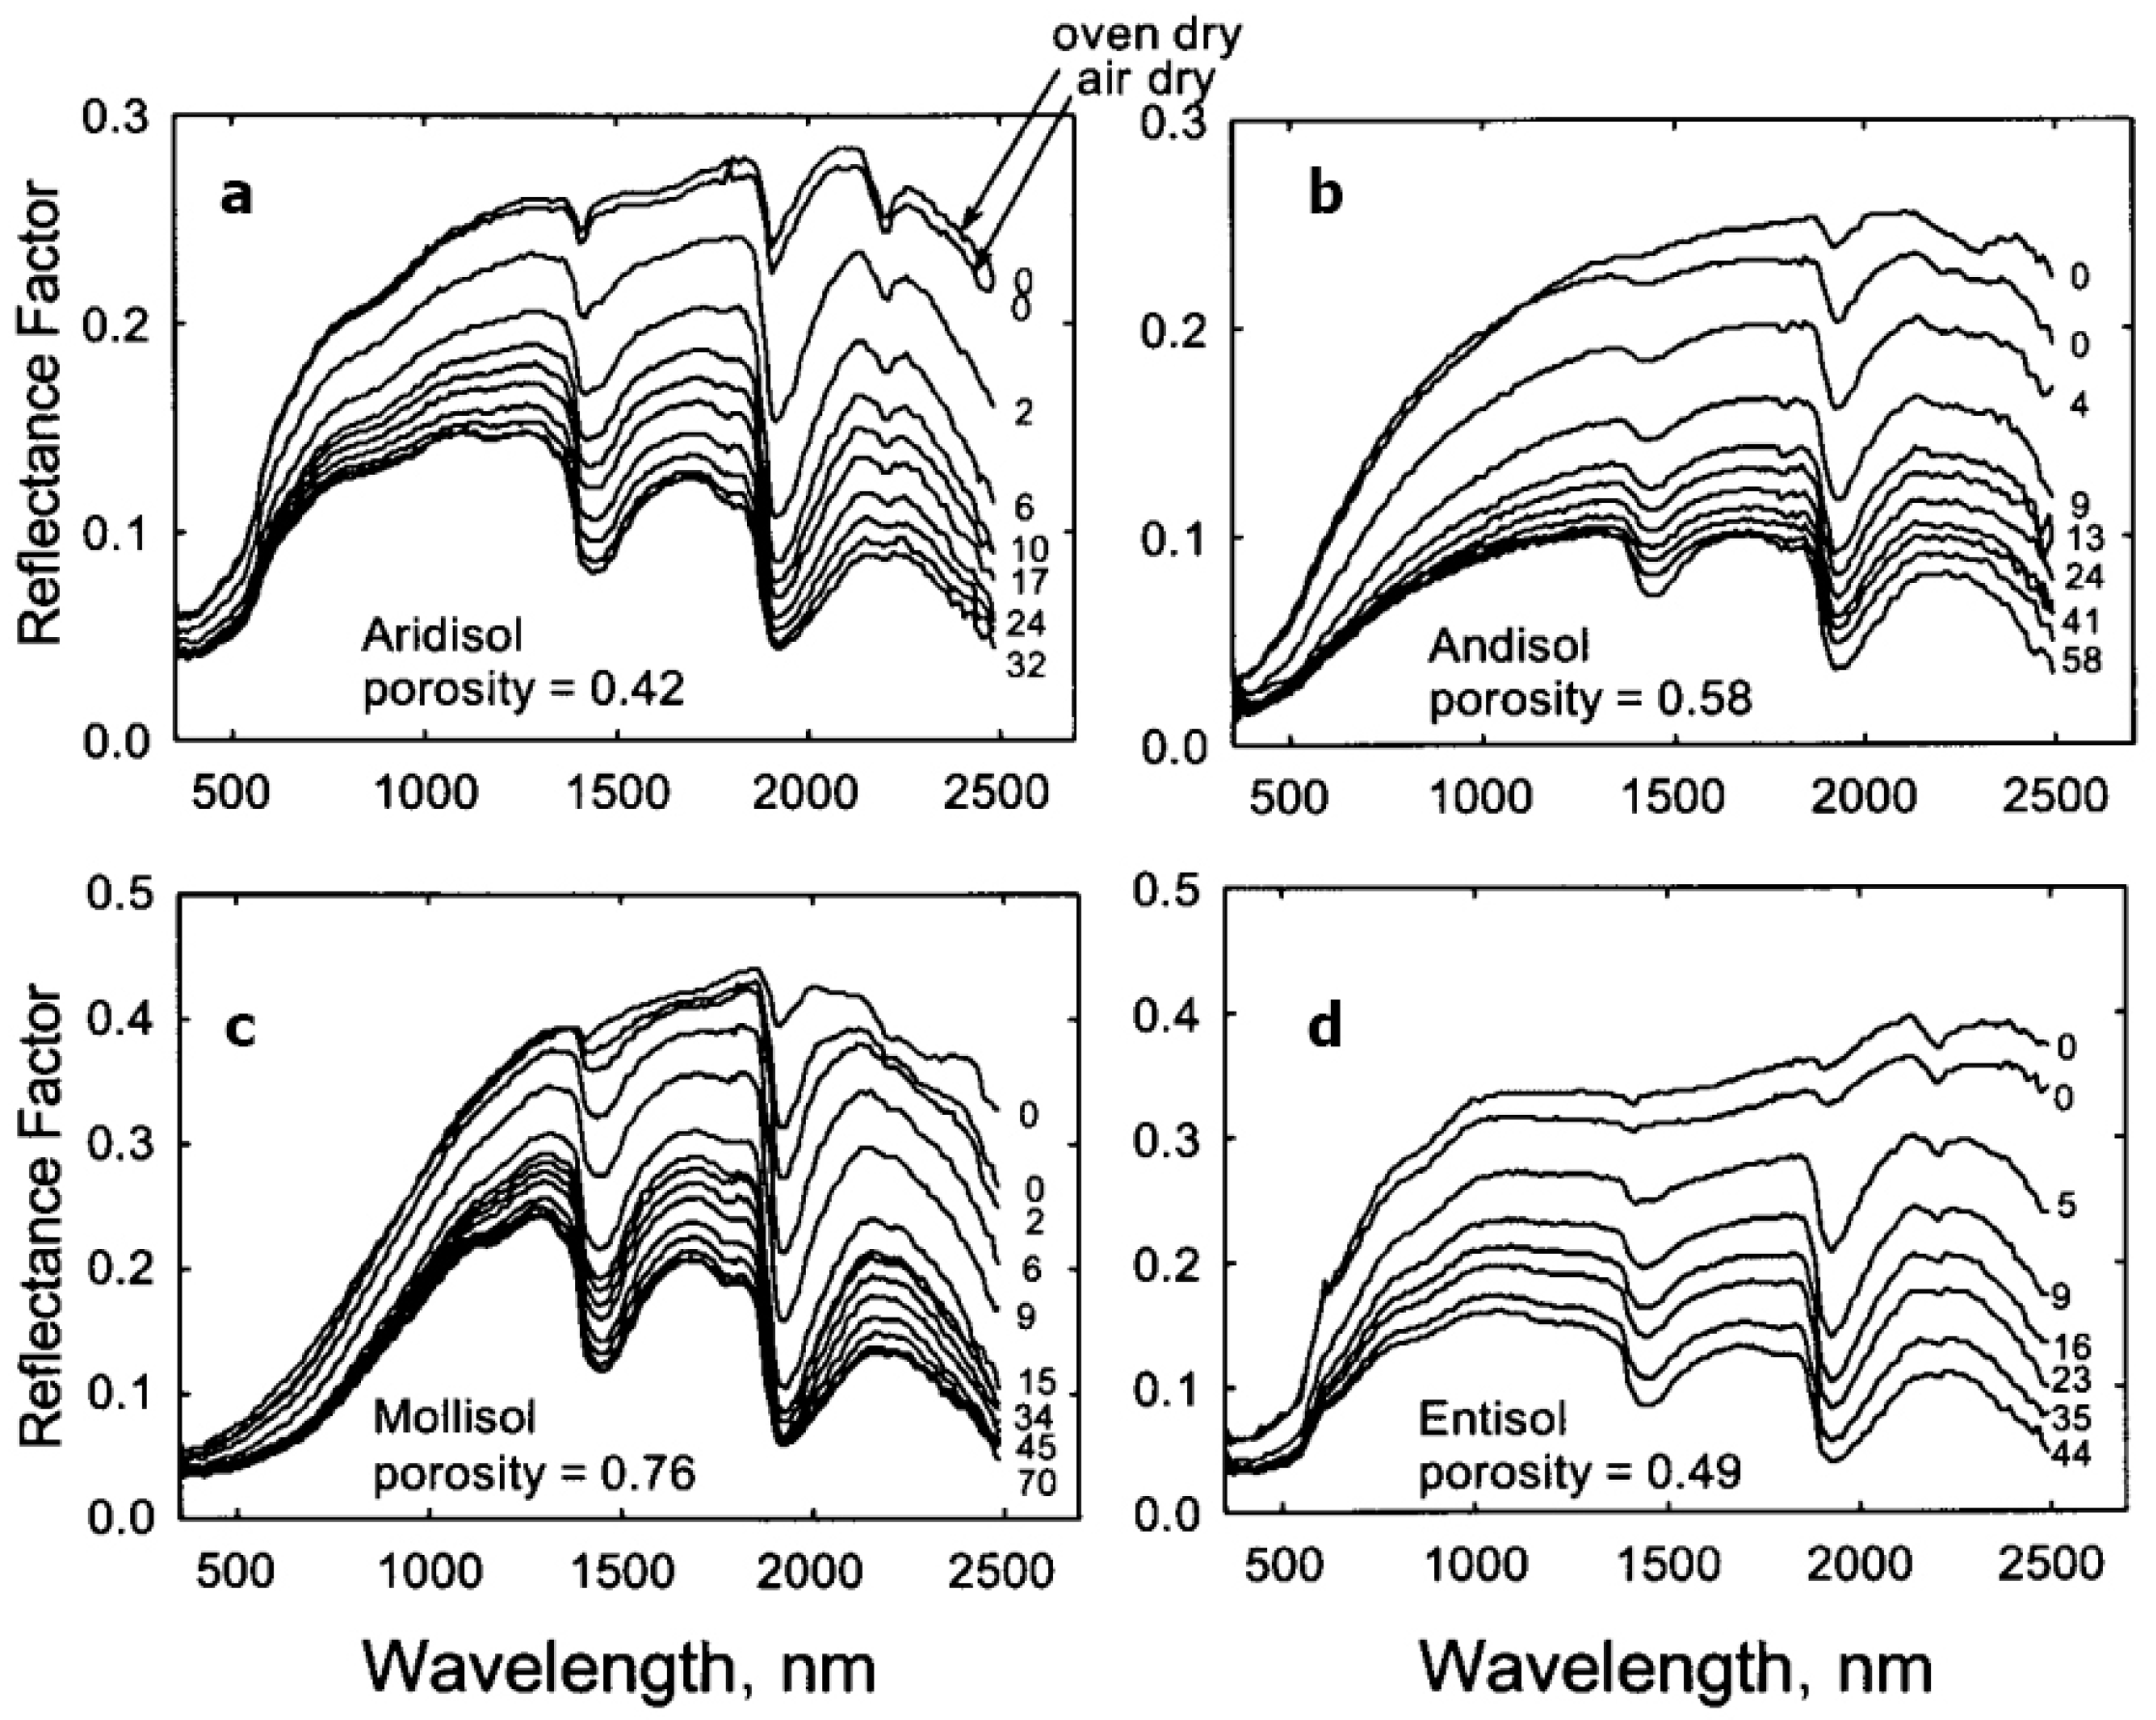
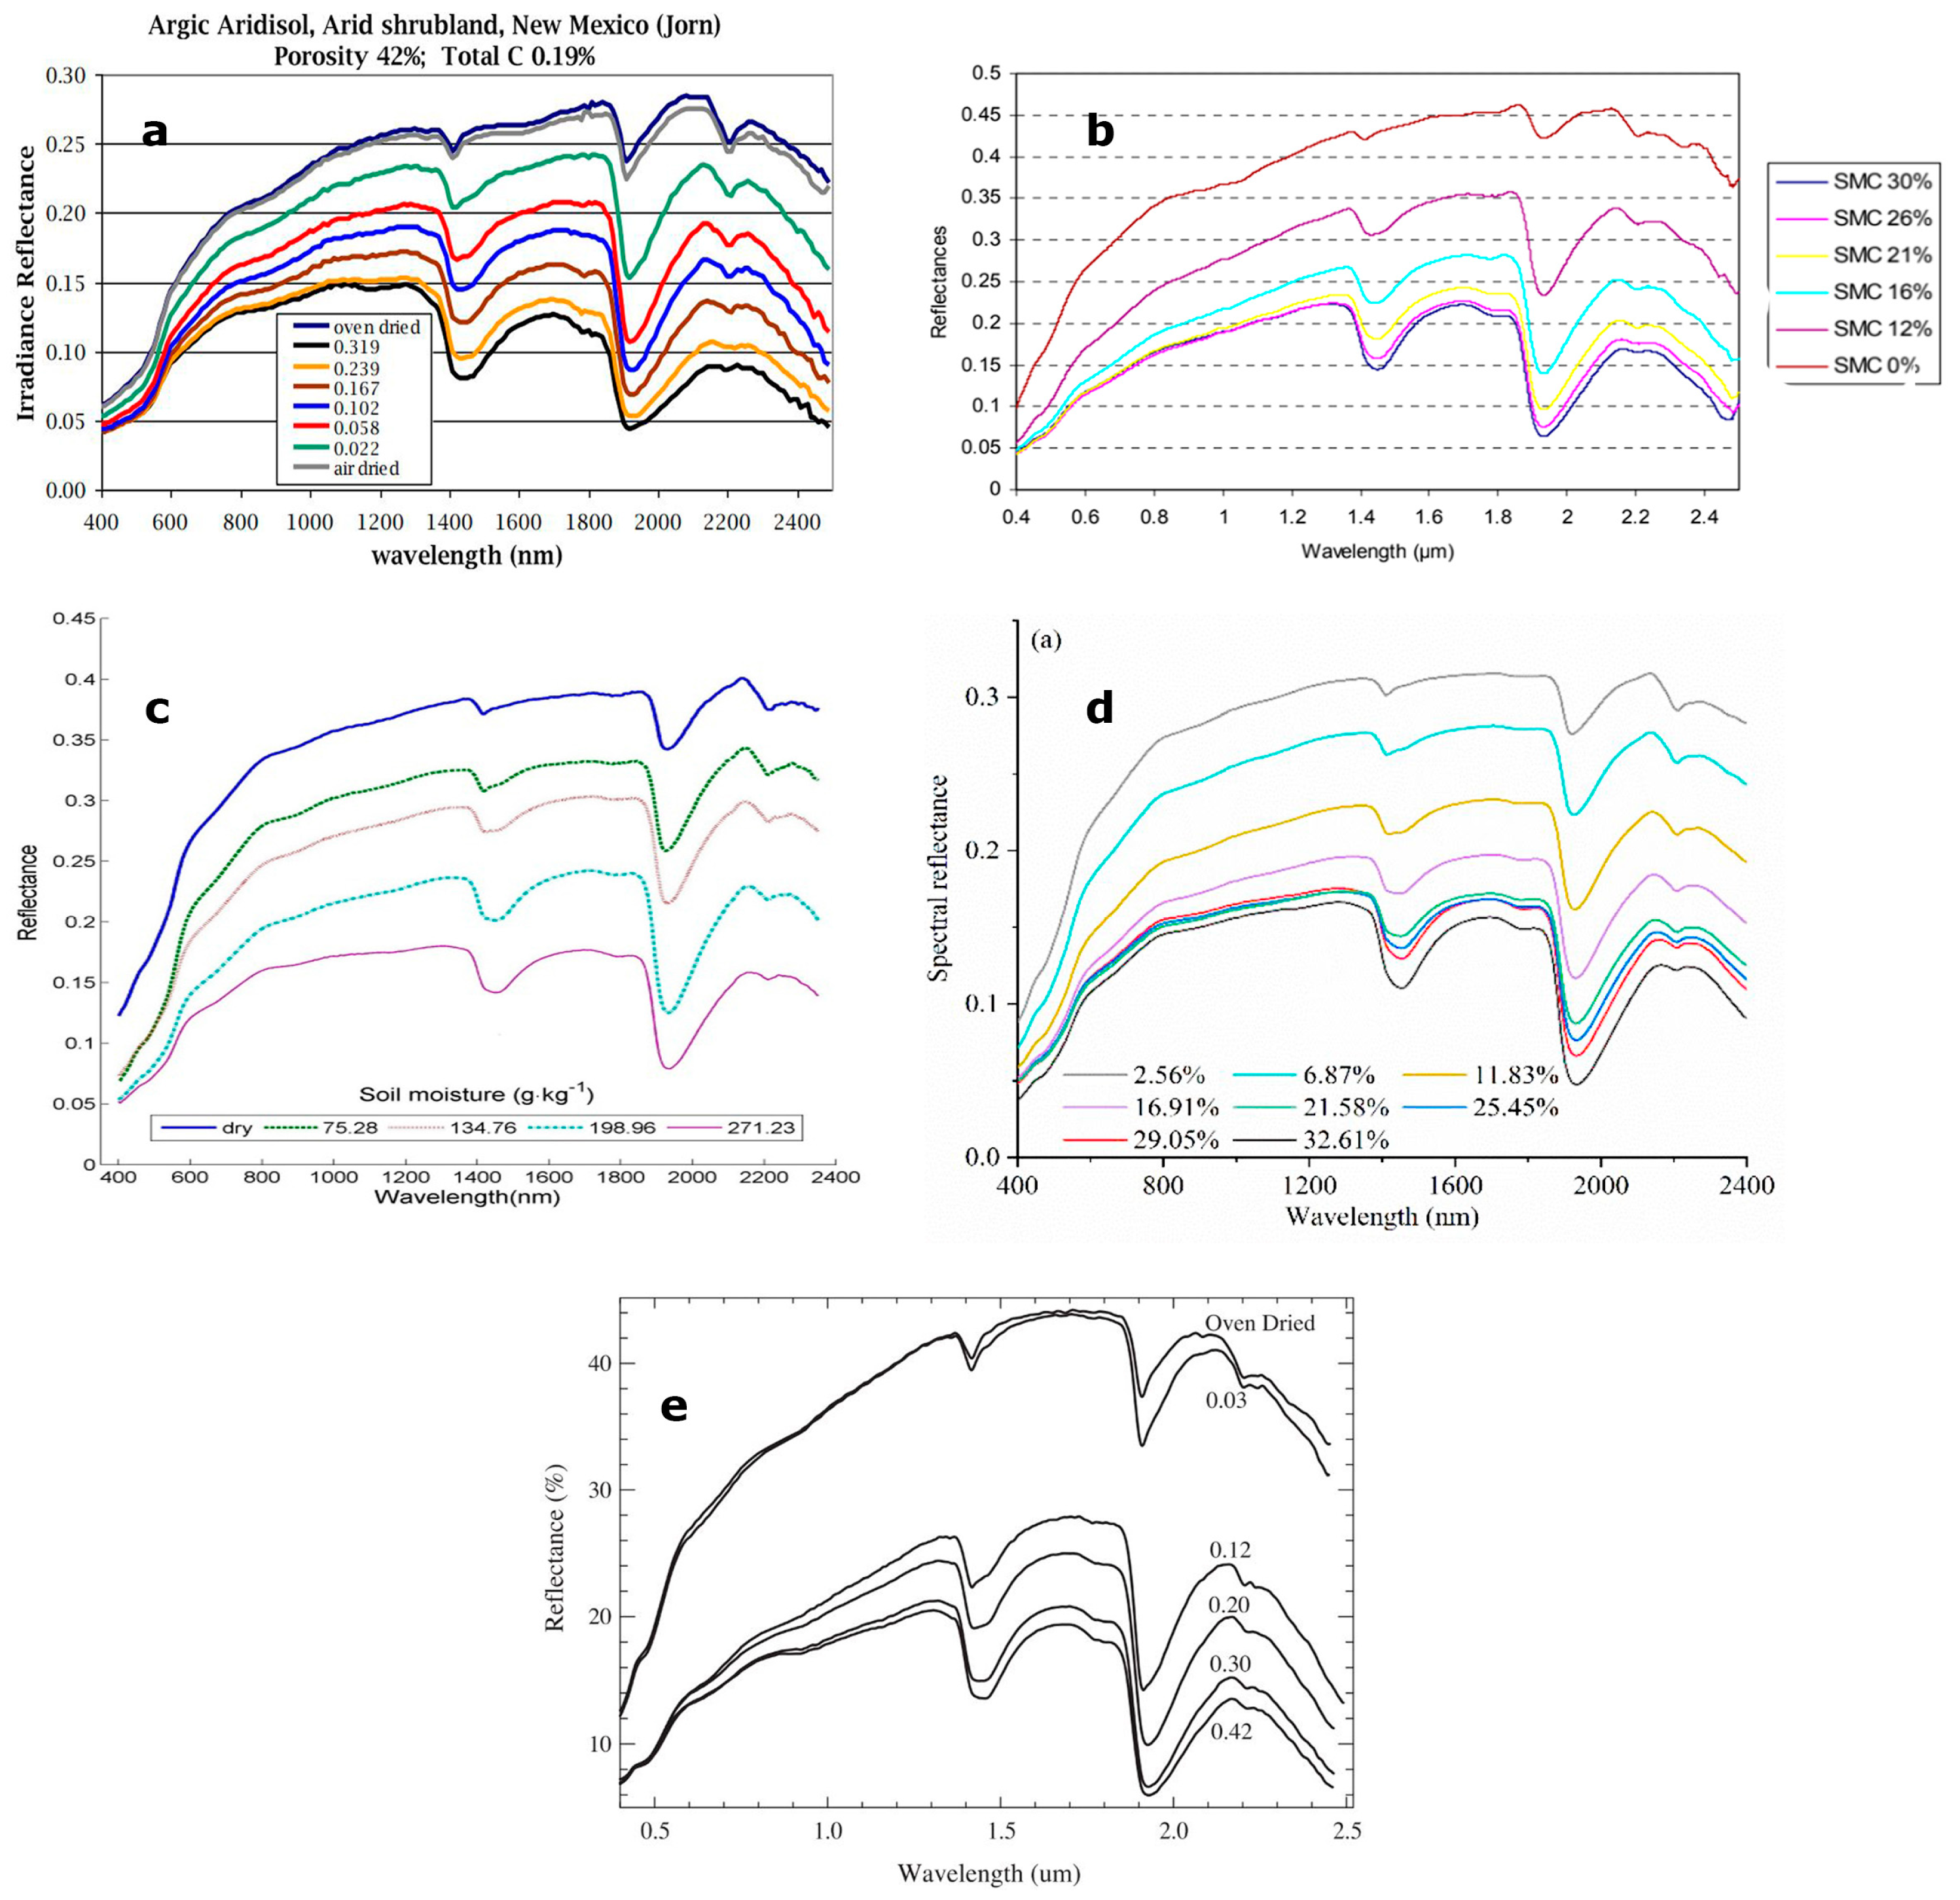
While soil characteristics vary widely, moist soil reflectance curves have a typical qualitative shape (Figure 2 and Figure 3). Soil reflectance is lowest in the visible wavelengths, before increasing into the NIR as a convex curve, punctuated by absorption features. As soil MC increases, soil reflectance decreases, the curve becomes flatter, and absorption features around 1400 and 1900 nm become more pronounced. Reflectance then decreases again between 2100–2500 nm (Figure 3, Figure 4, Figure 5 and Figure 6) [13,21,23,28,32,33,34,40,43,53].
It is common for authors, e.g., Mouazen, De Baerdemaeker [45], to associate the absorption feature observed near 2200 nm with soil moisture. Interestingly though, upon careful inspection of the data, it becomes apparent that this absorption feature actually decreases in size with increasing soil MC (Figure 3). This feature also varies substantially with the soil analysed, as can be inferred from Figure 3 but is shown directly in Figure 4 [28] using reflectance data for four different soils; an Aridisol, an Andisol, a Mollisol and an Entisol collected across the USA. Further investigation of the relevant literature indicates that absorption features near 2200 nm are instead produced by organic matter compounds and clay minerals such as kaolinite [47,54].
Figure 4. In four soils from (a) an arid shrubland in the Chihuahuan Desert, New Mexico, (b) a coniferous forest in Oregon, (c,d) a savanna in North Texas, USA, soil reflectance decreases as soil MC increases and the absorption feature ~2200 nm becomes shallower with increasing MC. From Lobell and Asner [28].
Geotechnics 04 00005 g004
There is also a limit to the nominally monotonic relationship between soil MC and decreasing soil reflectance apparent in Figure 2, Figure 3 and Figure 4. Referred to as the “Moisture Threshold” by Whiting, Li [40] and Liu, Baret [55] and the “critical point” by Weidong, Baret [26], there is evidence of a change in behaviour at a high MC, above which soil reflectance no longer decreases at all wavelengths with increasing soil MC. Once this “Moisture Threshold” is reached, soil reflectance decreases around the 1400 and 1900 nm absorption features, while increasing at other wavelengths. The Moisture Threshold is apparent in Figure 5, where soil reflectance at 29.3% is higher than soil reflectance at 22.1% MC and 25.8% MC for the 800–1350 nm range but dips below the corresponding reflectances for 1400–1500 nm and 1850–2400 nm Hong, Yu [30].
Hong, Yu [30] modelled the position of this apparent boundary and reported the Moisture Threshold as 17.66% MC, as indicated by the dashed line in Figure 5. The soil samples utilised by Hong, Yu [30] were collected in rice paddies of the Jianghan Plain in Hubei Province, China.
Figure 5. Recognised differences in the relationship between soil MC and reflectance at “high” and “low” MCs. The division between these two categories was modelled to be 17.66% MC (indicated by the dashed line).
Geotechnics 04 00005 g005
The absorption, usually equal to 1 minus the reflectance (R), caused by soil moisture also varies with the wavelength [28,56]. All studies compared here (Figure 2, Figure 3, Figure 4 and Figure 5) record higher absorption in the near-infrared (NIR), compared to visible wavelengths. There are, however, differences in the magnitude of the absorption between samples (compare the y-axes in Figure 2, Figure 3, Figure 4 and Figure 5).
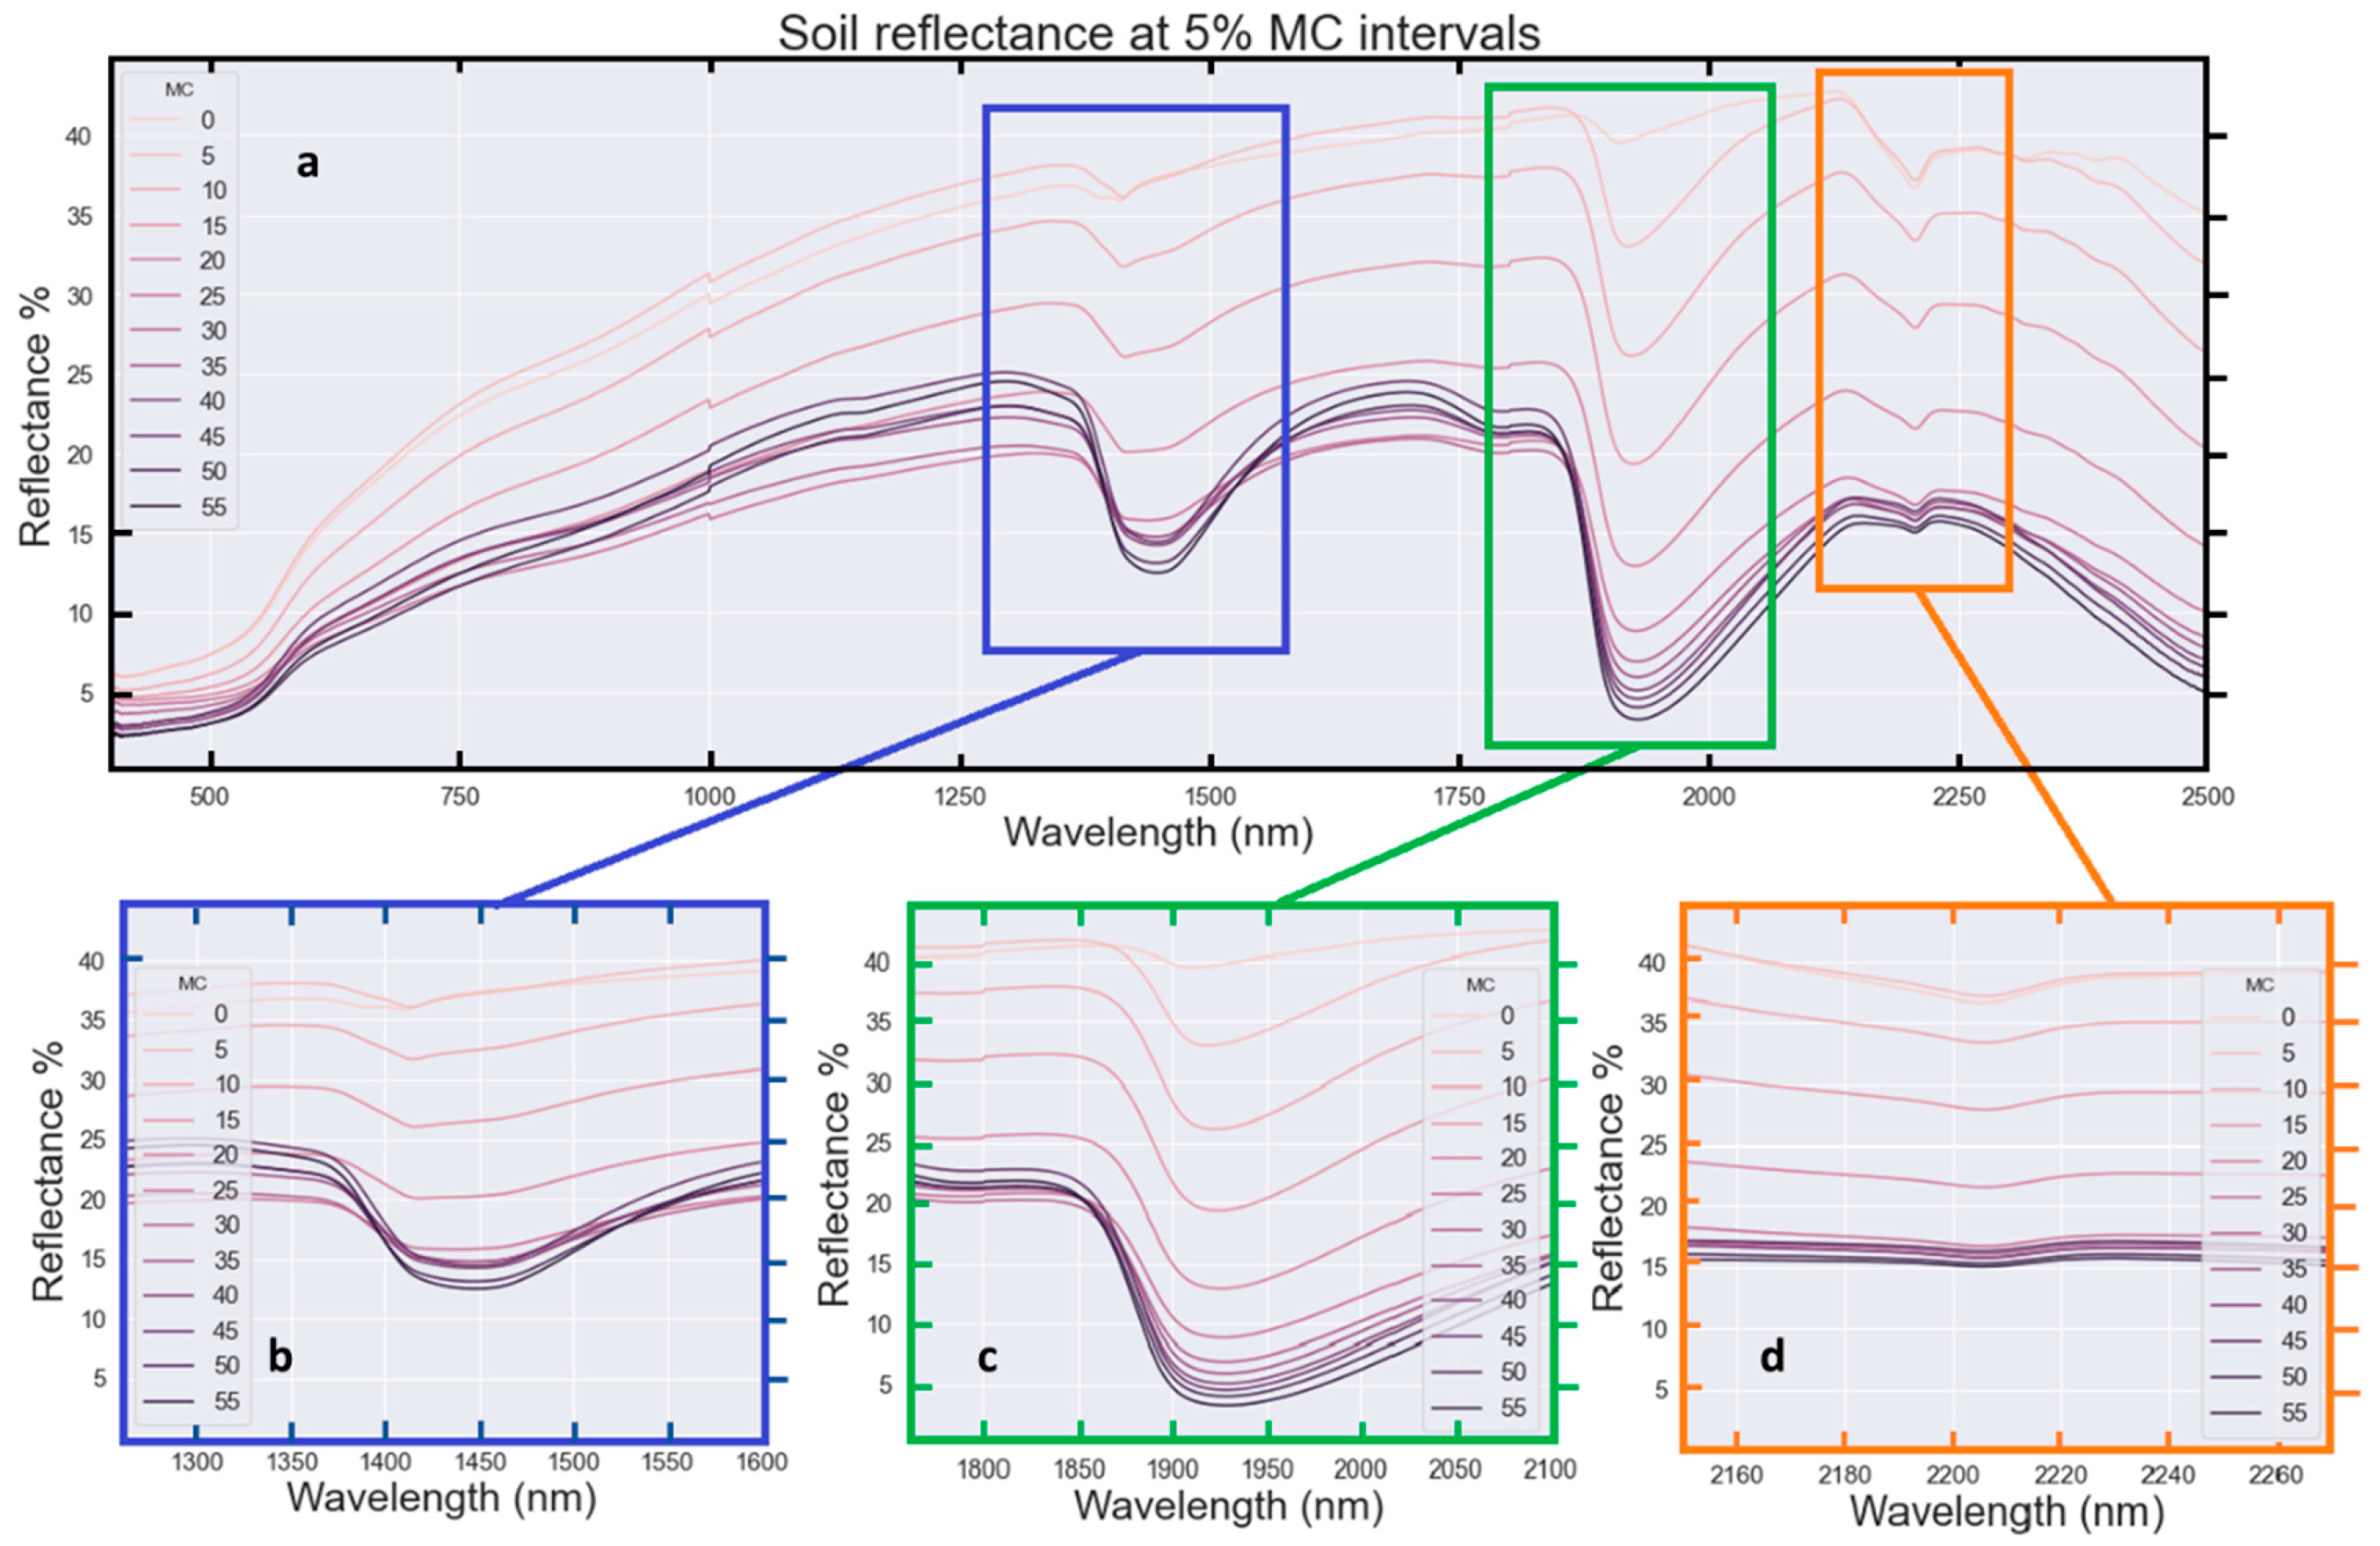
Figure 6. Reflectance averaged across all samples at 5% MC intervals (a) between 0% (dry) and 55% (saturated) MC. Soil moisture decreases soil reflectance at all wavelengths until approximately 25% MC, at which point spectral curves cross and absorption features around 1400 (b) and 1900 nm (c) continue to increase in depth while reflectance at other wavelengths increases. The feature around 2200 nm (d) is minor and decreases in size with increasing MC.
Geotechnics 04 00005 g006
Unfortunately, most authors report soil reflectance at irregular MC intervals. This makes it difficult to directly compare results between studies. In Section 3, new soil reflectance data collected for this review at 1% or 5% MC intervals between oven-dry and saturated states are presented. These high-resolution data have allowed for more detailed and comprehensive analyses than are presented in other studies identified to date in the relevant literature.

3. The Relationship between Soil MC and Reflectance—New Data

This review improves upon and clarifies results reported in other peer-reviewed literature on the relationship between soil MC and visible–NIR reflectance, by applying a systematic, repeatable method for data collection, and collecting very high spectral resolution soil reflectance data at regular MC intervals. In other published literature, soil reflectance data were presented for less than ten irregular MC intervals.
Here, as described in Appendix A, soil reflectance data were collected for each sample at 1% or 5% MC intervals to a maximum of 55% MC. The moisture content of samples was precisely controlled by incrementally adding measured amounts of water to the samples with a pipette, then gently mixing the water and soil before the collection of reflectance spectra. Soil reflectance data were then measured at 1 nm resolution, at each MC, between 400–2500 nm for ten soil samples from the region of Muttama, NSW, Australia (Figure A1).
New high-resolution spectral and MC data (Figure A2) from the Muttama soil samples (Figure A1b) have allowed more detailed and rigorous data analyses than presented in other literature to be conducted. In turn, this has led to the identification and quantification of multiple general and subtle relationships between soil MC and reflectance. Comparative analyses and modelling with robust error analyses should improve confidence in the integrity and repeatability of all results presented. For example, the relationship between soil MC and visible–NIR reflectance has been reported in the literature as linear [51], non-linear [40,50], exponential [28,34] or otherwise. The new equations presented in this review define the linear and other relationships between soil MC and reflectance for a range of wavelength combinations and for a range of representative soils from Southeastern Australia. The error analyses provided alongside each equation allow future users a high degree of confidence in the accuracy and appropriateness of these equations, especially once recommendations for calibrating the equations for different soil types (see Section 8) are implemented.
There are numerous potential applications for the results presented. For example, the new equations defined in this review may be used for soil MC prediction, or for the correction of soil spectral data for the effects of soil moisture. Clarification of the type of relationship (linear versus non-linear) between soil MC and reflectance is also highly valuable for informing the selection of appropriate machine learning or other algorithms, for automated and complex soil moisture model-building scenarios.
Turning now to analysis, results from this review confirm that absorption features near 1400 nm (more precisely ~1390 to 1500 nm) and 1900 nm (~1870 to 2100 nm) monotonically increase in depth with increasing soil moisture (Figure 6a–c). However, there is a limit to this monotonic relationship at other wavelengths (e.g., 1600 to 1370 nm and 1500 to 1870 nm) where the spectral curves cross. These differences in absorption profiles are identified here to be associated with the “Moisture Threshold” or “critical point” described by Whiting, Li [40], Weidong, Baret [26], Yue, Tian [27]. This non-monotonic effect is apparent in the data from some relevant literature (e.g., Figure 5) and is clarified in detail by this review (Figure 6).
The position of these absorption features is inconsistently reported in the literature, however, with reports of these features centred at 1400 nm [57], 1444 nm [54], 1450 nm [58], 1470 nm [16], 1900 nm [54], 1920 nm [13], 1930 nm [58] and 1944 nm [55]. The high-resolution data presented here allows close inspection of the position of these features (Figure 6b,c). Figure 6 shows the features to be consistently centred at neither 1900 nm nor 1444 nm. Instead, there is a gradual drift in the vertex of the absorption features towards higher wavelengths as soil MC increases (Figure 7). This result is important not only for the interpretation and reporting of relationships between soil MC and reflectance but is also highly significant for the choice of wavelengths utilised for soil MC prediction from soil spectral data. This demonstration of evolution in the wavelength of the absorption feature with MC also shows that data from a range of wavelengths (such as the average value of a multispectral imaging band) is better suited to the monitoring of absorption feature depth rather than using data from a single fixed wavelength.
The absorption feature around 2200 nm clearly decreases in size with increasing MC (Figure 2, Figure 3, Figure 4, Figure 5, Figure 6 and Figure 7). Since this feature is associated with bending and stretching vibrations of clay minerals such as Al-OH and Mg-OH [54,59], as opposed to water, the decreasing size of this absorption feature can be attributed to “feature masking” [60]. The masking of spectral features by soil moisture is an important consideration when applying soil reflectance models and algorithms in the field or to moist soil samples (such as a fresh soil core) [61].
Figure 8 demonstrates a monotonic decrease in soil reflectance for a single soil sample at all wavelengths from 600–2500 nm between 5 and 25% MC. This result is consistent with Figure 6 and Figure 7 but is now shown for an individual soil sample (rather than the average of ten soil samples). The change in soil reflectance between 0 and 5% MC in Figure 8 can be positive or negative as discussed in Section 5.2 below.
As demonstrated in Figure 2, Figure 3, Figure 4 and Figure 5, when comparing soil reflectance curves between previous studies, soil reflectance curves display both qualitative and quantitative differences between samples such as the apparent depth of the 1400 nm absorption feature at 0% MC, the slopes of reflectance curves in the ranges of 700–1000 nm and 2300–2500 nm, as well as the presence of absence of a clear peak in reflectance around 2150 nm. This is also the case for the ten samples (Figure A2) utilised in this study. Though the ten soil samples were collected from the same farm paddock, differences in soil characteristics relating to the hillslope position and the underlying geology are known. Such differences are highlighted here as a reminder that spatial proximity in sampling locations does not ensure consistency in soil mineralogy, properties or spectra.
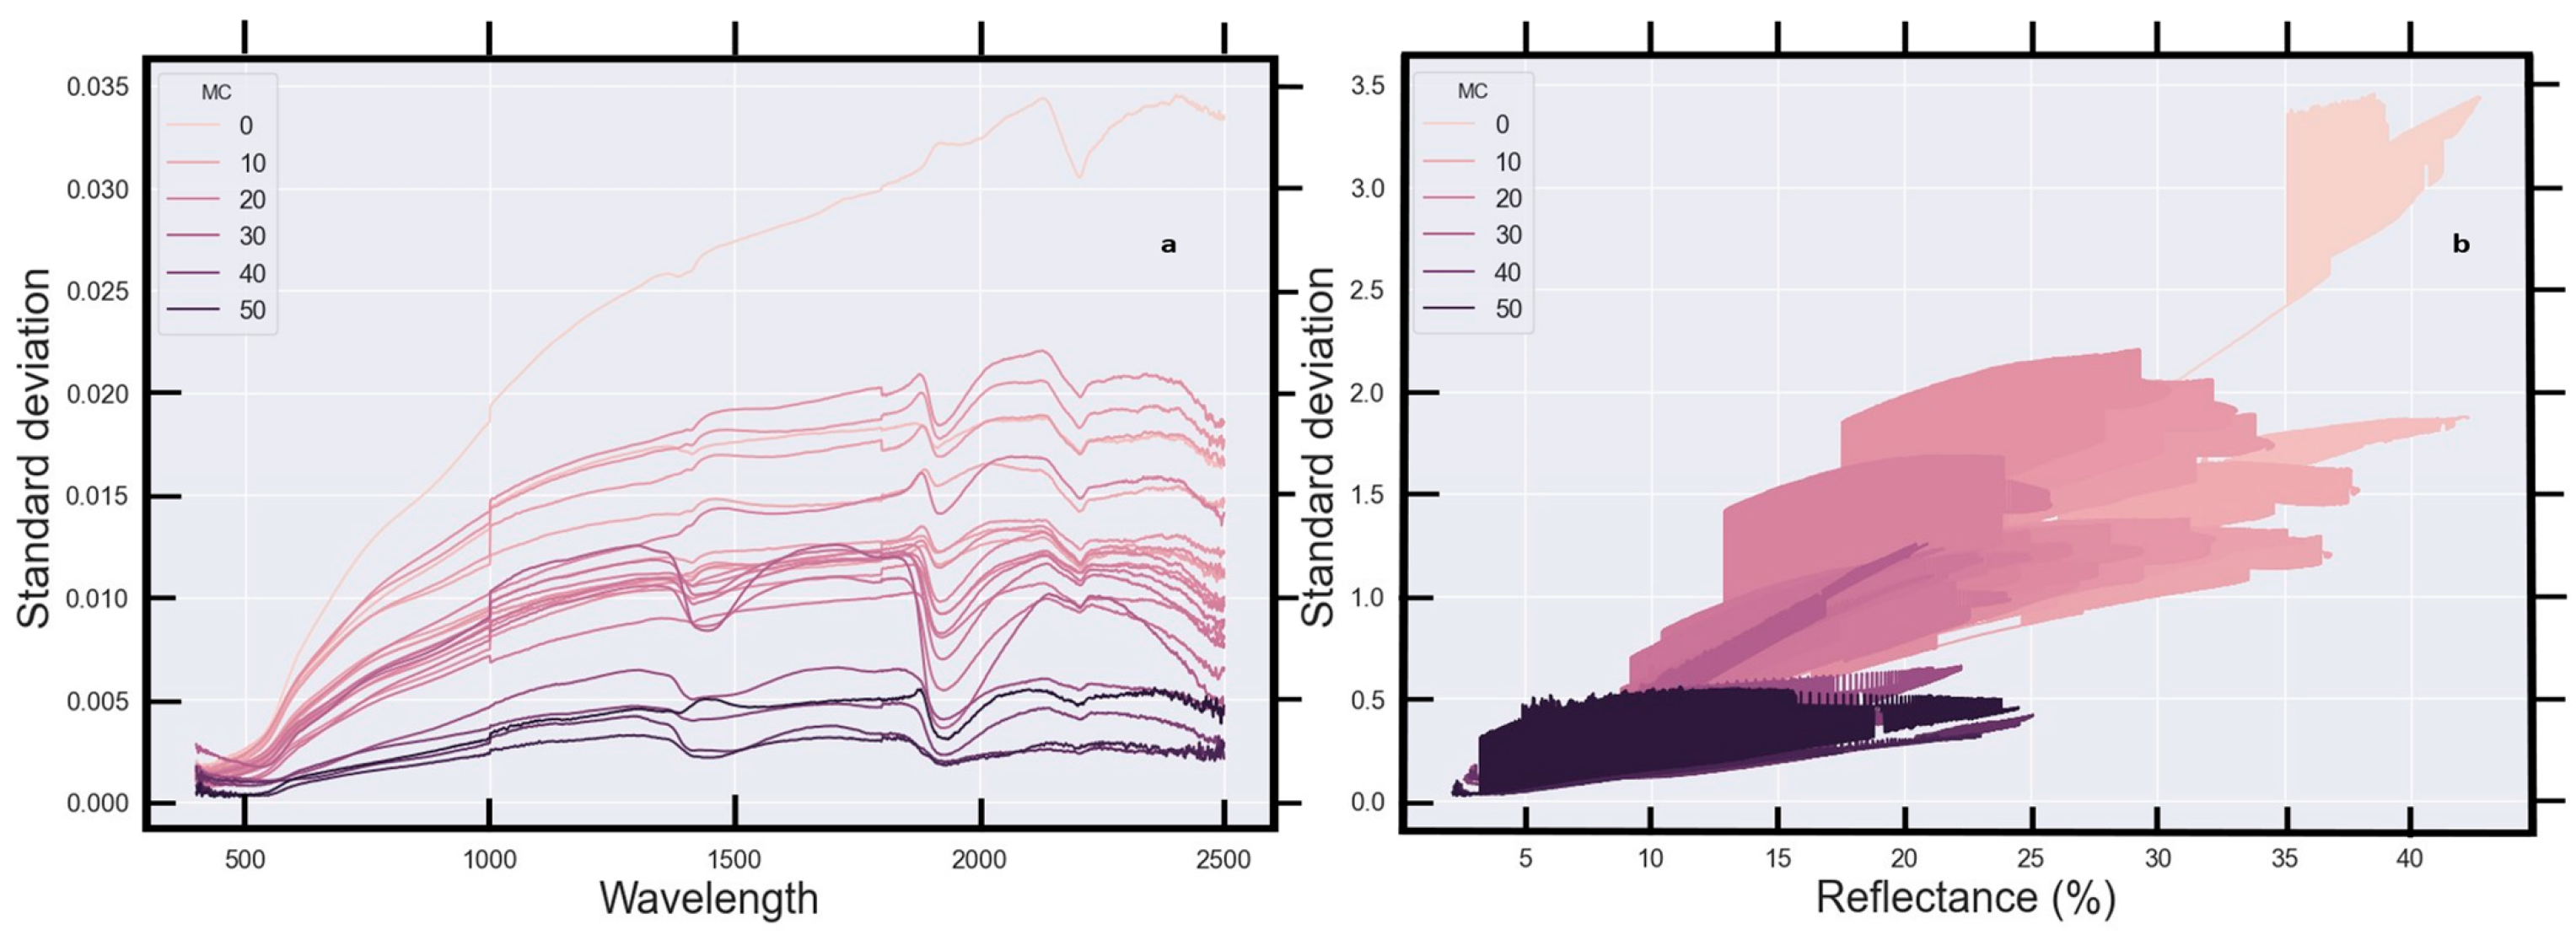
To quantify the uncertainty in spectral data, soil reflectance measurements were repeated five times for each soil sample at each MC (Figure A2). The standard deviation of the reflectance typically increases with wavelength (Figure 9a) to approximately 1800 nm, before plateauing and then decreasing slightly between 2300 and 2500 nm. The standard deviation also increases as a function of absolute reflectance (Figure 9b). As soil reflectance is a function of soil biological, physical and chemical properties [62], increased heterogeneity in soil properties at a low MC is a likely explanation for these phenomena, as opposed to faults with the measurement instrument, calibration method or sample preparation procedure. For example, finer-grained soils such as clay have a lower surface roughness than sand or gravelly soils, and therefore higher reflectance [63]. Darker soil components such as organic matter and moisture also decrease soil reflectance [52,64]. Variability in soil surface characteristics and consequently soil reflectance is an intrinsic property of soil [47], so collecting multiple measurements for each sample and analysing the averaged result will increase the robustness of soil reflectance measurements.
It seems worth mentioning that standard soil sample handling procedures typically involve sieving, drying and chemically or physically dispersing soil samples during sample preparation in the lab [41]. These procedures are designed to homogenise soil samples and surface characteristics, in preparation for soil testing or data collection. However, by nature, these procedures also change the intrinsic properties of the soil such as particle size, soil organic carbon content, and soil surface roughness [13,34,42,47]. Therefore, reflectance data collected from samples prepared with these laboratory-standard methods are not representative of the reflectance of the same soils in the field, as shown in Figure 10 [13,23]. Soil samples described in Appendix A were not chemically or physically dispersed. Hence, new data collected from the 10 soil samples are expected to be representative of the same soils in the field, and so, relevant to soil moisture prediction activities undertaken in the field. However, these new soil samples were subject to temperature-controlled storage for 1 year and drying at 105 °C, which may have influenced some soil properties and, consequently, soil reflectance.

4. Spectral Intensity at Visible–NIR Wavelengths as a Function of MC for Individual Soils

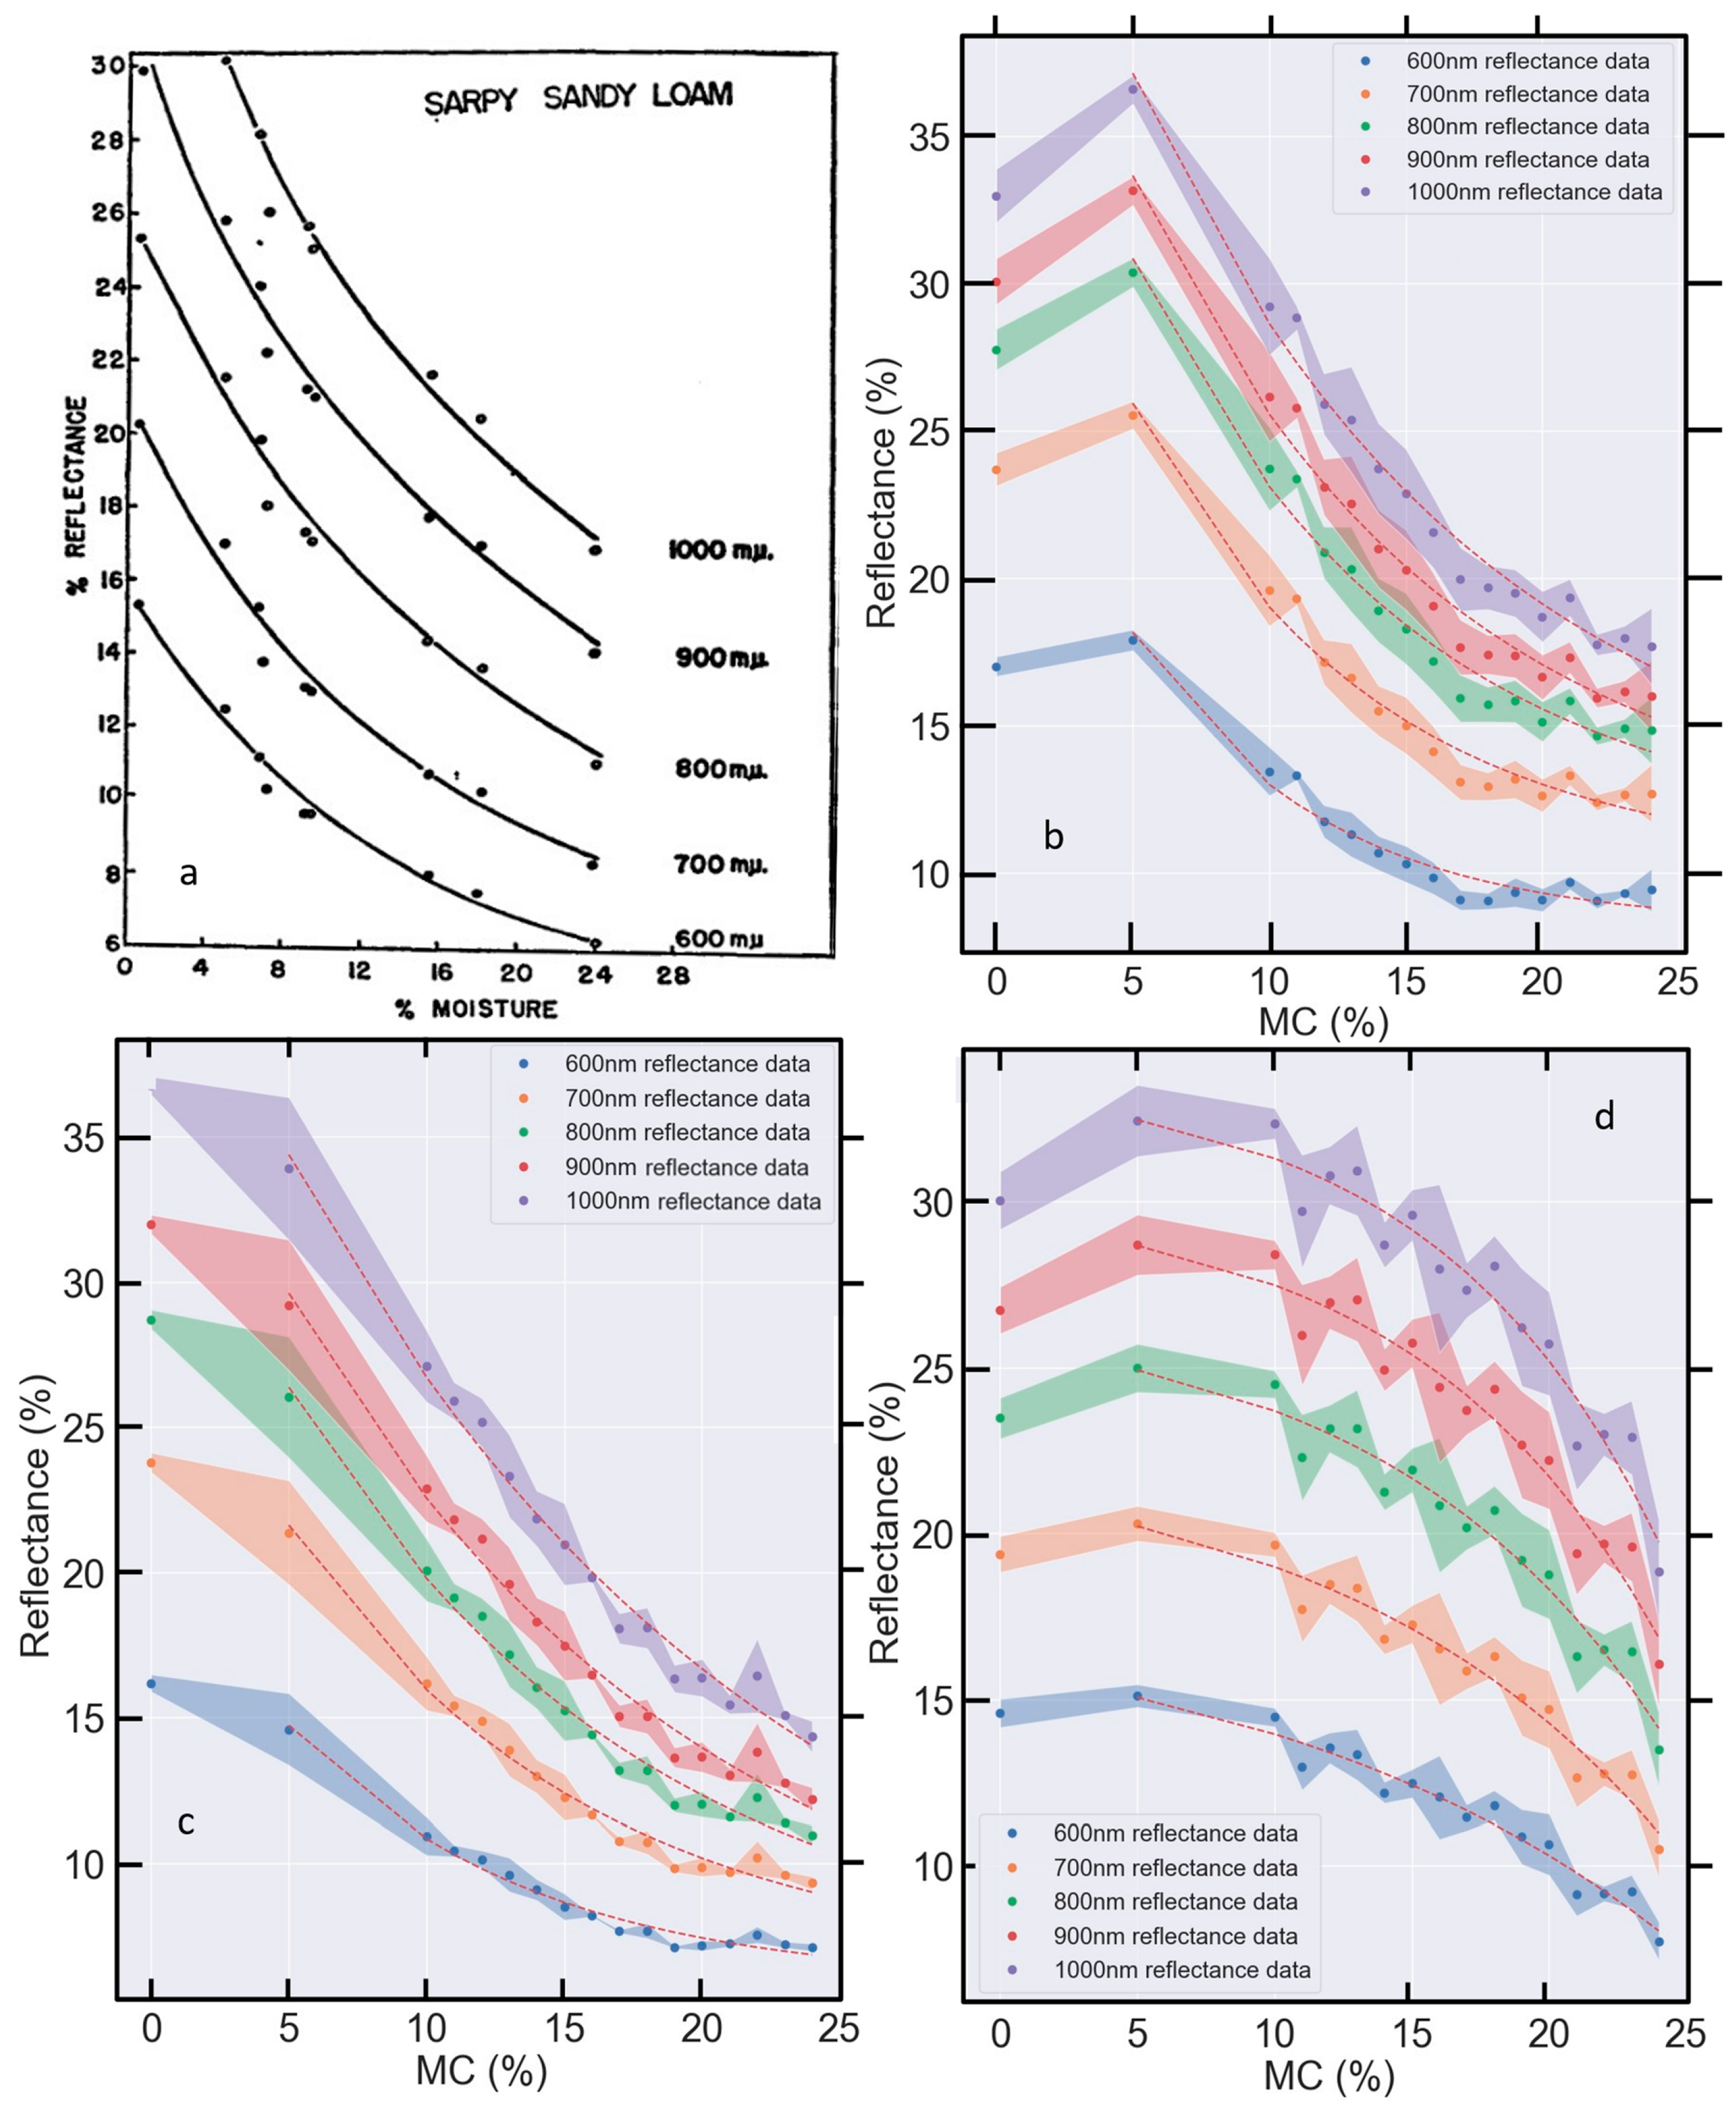
Previous studies only describe the relationship between soil MC and visible–NIR reflectance as linear [51], non-linear [40,50], logarithmic [26] or exponential [28,34]. Claims that there is no relationship between soil reflectance and soil MC also exist [52]. One exception is the work of Bowers and Hanks [34], where an inverse exponential relationship between soil moisture and soil reflectance is demonstrated.
Though data points are non-uniformly located in Bowers and Hanks [34] (Figure 11a), exponential relationships are apparent at 600, 700, 800, 900 and 1000 nm: all of the wavelengths presented. Comparable relationships are apparent for some but not all Muttama samples analysed for this review. For example, sample ISS11 (Figure 11c) exhibits an exponential decay in reflectance at 600, 700, 800, 900 and 1000 nm when plotted as a function of MC from 5 to 25% MC, but not 0–5% MC. The function also becomes increasingly linear as the wavelength increases. Similarly, exponential functions fitted to the reflectance data from ISS20 (Figure 11b) at lower wavelengths (600 nm, 700 nm, 800 nm and 900 nm) exhibit progressively decreasing exponential curves, becoming increasingly linear at 1000 nm. Sample ISS26 (Figure 11d) demonstrates a different exponential relationship with MC, where there is a positive offset but a negative exponent. This is a stark contrast to other samples (e.g., ISS11 and ISS20), which exhibit positive exponents. Sample ISS26 (Figure 11d) also becomes increasingly non-linear as the wavelength increases. This sample is an outlier, but importantly, it demonstrates that exceptions exist. It should be noted that models demonstrate an improved fit for the domain of 5–24% MC as data points at 0% MC are clearly inconsistent with the models fitted to the data points at higher MCs. Reducing the domain as such improves the model fit in all cases. This point is explored further in Section 5.

5. Averaged Reflectance vs. MC—Generalising the Relationship between Soil MC and Visible–NIR Reflectance

5.1. Averaging across All Samples

In an effort to generalise the relationship between soil MC and visible–NIR soil reflectance, soil reflectance data from the 10 Muttama soils (Figure A2) was averaged across all visible and NIR wavelengths (400–2500 nm). This was undertaken by averaging data from all samples at specific wavelengths (Figure 12) and then all samples and all wavelengths (Figure 13). It is shown that linear models may be fitted to the average reflectance (for all samples) at each of the visible and NIR wavelengths of 600 nm, 700 nm, 800 nm, 900 nm and 1000 nm, presented by Bowers and Hanks [34]. While Figure 11a (Bowers and Hanks, 1965) demonstrates that exponential fits can be viable, it is also apparent, with extra data, that the relationship becomes increasingly linear at higher wavelengths, and that model fits may be substantially improved by restricting the domain of the relationship appropriately (e.g., not including the range 0–5% MC). Restriction of the model domain is necessary because the reflectance does not vary monotonically above >25% MC, at all wavelengths (Figure 5, Figure 6, Figure 7 and Figure 9), or below 5% MC (Figure 11).
In Figure 12, y represents the soil MC (%) and x is the average reflectance. It is evident that this averaged reflectance is well described using a linear functional form but is not well described with an exponential function. Evaluations of (Figure 13b) model R2 and standard error (SE) show well-fitting linear models in all cases.
A generalised linear relationship between soil reflectance and MC is also apparent when the reflectance is averaged across all visible and NIR wavelengths (Figure 13a). The equation for the line of best fit describing the linear relationship between 5 and 25% MC is
y = −1.09x + 40.63
where y represents MC % and x is the sample—and wavelength—averaged reflectance. Within this domain, a linear relationship with a negative slope is apparent (Figure 13a) and soil reflectance decreases monotonically as MC increases. Beyond 25% MC, the relationship saturates.
Equation (1) describes an extremely well-fitted linear model, with an R² of 1.0, standard error (SE) of 0.02 and reduced chi-squared of 0.21. The fit and low uncertainty in the model demonstrate that the generalised linear relationship is broadly applicable to the average of all samples in this study, despite variability in sample properties including texture and soil organic carbon content, shown in Table A1 of Appendix A.

5.2. Individual Samples

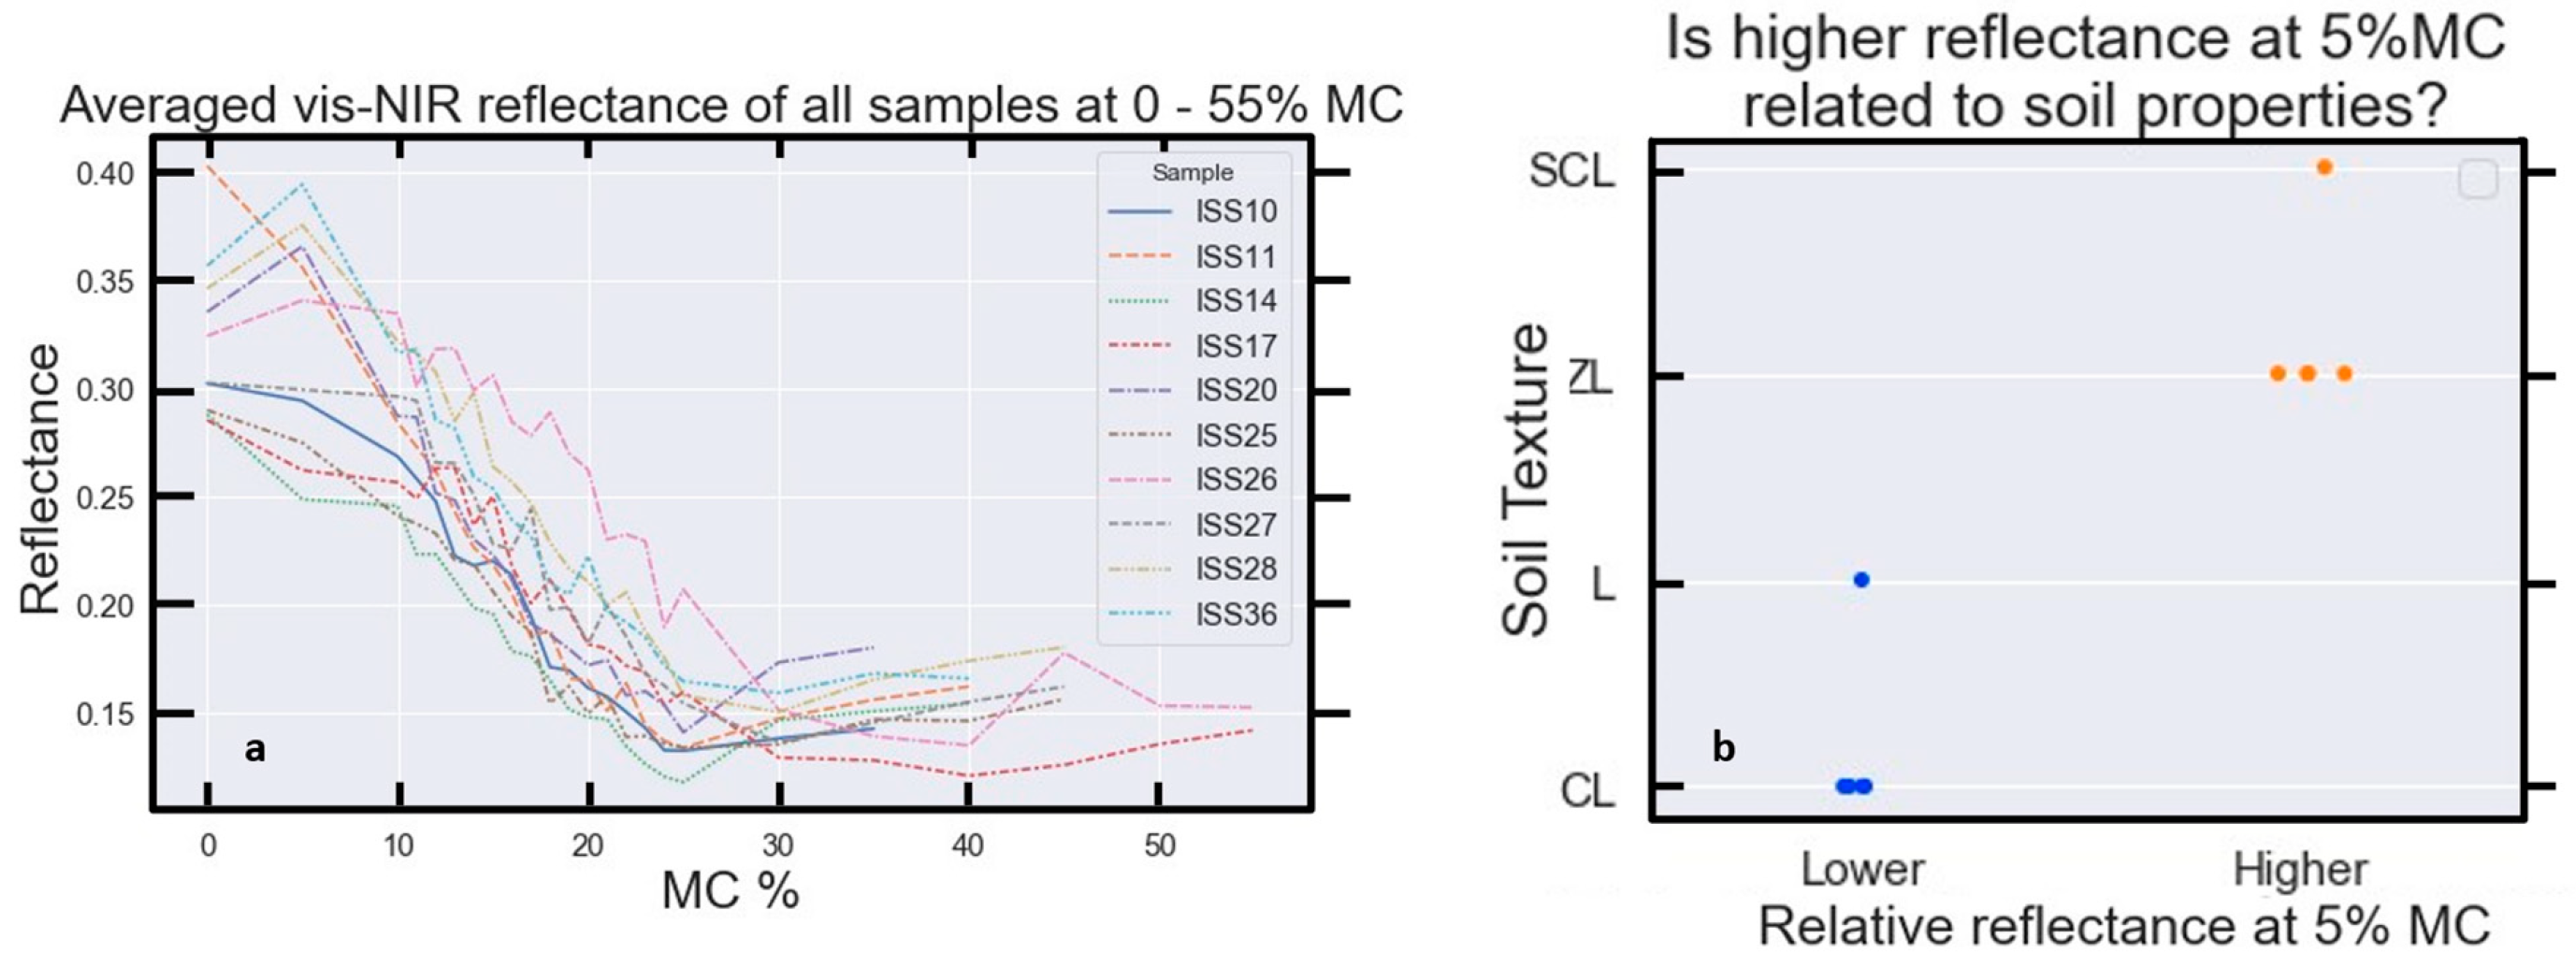
Figure 13a demonstrates a broad trend of soil reflectance decreasing as soil MC increases between 5 and approximately 25% MC. Figure 14a shows this is true for each individual sample; however, the slope and precise domain of the relationship varies slightly between samples as soil reflectance between 0 and 5% MC is found to be texture dependent (Figure 14b). For example, for silty loam (ZL) and sandy clay loam (SCL) soils, soil reflectance at 0% MC was lower than at 5% MC, indicating that 5–25% MC was a more appropriate domain for linear models fitted to reflectance data from ZL and SCL soils. For loam (L) and clay loam (CL) soils, the linear relationship begins at 0% MC (Figure 14b). Also, there is an inflection point marking the higher MC limit of the linear relationship. The position of this inflection point varies between 22% and 30% MC for each of the samples. Some noise in the data is also apparent.
It is emphasised that each sample (Figure 13a) demonstrated a similar pattern to the averaged result in Figure 14a. This provides a strong argument that a linear relationship between reflectance and soil MC can be assumed for an arbitrary soil sample or a group of soil samples. It remains possible that exceptions exist.
As the relationship between soil MC and average reflectance appears to saturate beyond 25% MC (Figure 13a), different models must be utilised for predicting soil MC beyond 25%. A continuation of linear or other relationships should not be assumed beyond this point, based on Figure 13 and Figure 14.

6. Relationships between Soil Reflectance and MC for Specific Wavelength Combinations

In this review, detailed analyses of the relationship between soil reflectance and MC at specific wavelength combinations and bands commonly available in remote sensing data products reveal a number of opportunities for soil MC prediction from visible and NIR soil reflectance data. Indeed, linear and non-linear relationships exist for a number of wavelength combinations. These are in addition to the studies and relationships reviewed in other sections. These relationships, equations for soil MC prediction, and associated errors are reviewed next.

6.1. Averaged Reflectance for Several Bands vs. MC

Monotonic relationships between soil MC and soil reflectance data averaged over all the visible and NIR bands for Landsat-5, -7 and -9 (Figure 15) were demonstrated by McGuirk and Cairns [65]. The relationships presented are clearly apparent for the range of 5 to 25% MC and linear models fitted to this domain returned excellent model accuracy scores of R² = 0.99, 1.00 and 1.00, respectively. The standard error values of 0.01 or 0.02 for all models are also very low. These results show that linear relationships exist between soil MC and soil reflectance in the visible and NIR reflectance bands at which Landsat-5, -7 and -9 collect data (Table 1).
Description and definition (Equations (2)–(4)) of these relationships are important as a demonstration that linear correction algorithms (e.g., PLSR, OLS) are appropriate for the correction of Landsat data for the effects of soil moisture for the range of 5% to 25% soil MC.
y = −0.60x + 26.78
y = −0.73x + 30.97
y = −0.83x + 34.71
In Equations (2)–(4), x is the actual soil MC % and y is the average reflectance of all visible–NIR bands for Landsat-5, -7 and -9, respectively.

6.2. Absorption Features

Soil reflectance curves include multiple spectral features associated with mineral and other soil components [47]. The following sub-sections present a number of linear and non-linear equations quantifying changes in reflectance caused by soil moisture, for specific spectral features. Models generated with both absolute and normalised differences are trialled and compared. In general, models generated with absolute values (measured reflectance) performed well, however, models constructed with normalised (e.g., Equation (5)) data performed even better. Therefore, all models based on the new data collected for this review and proposed in Section 6 utilise normalised data unless specified otherwise.
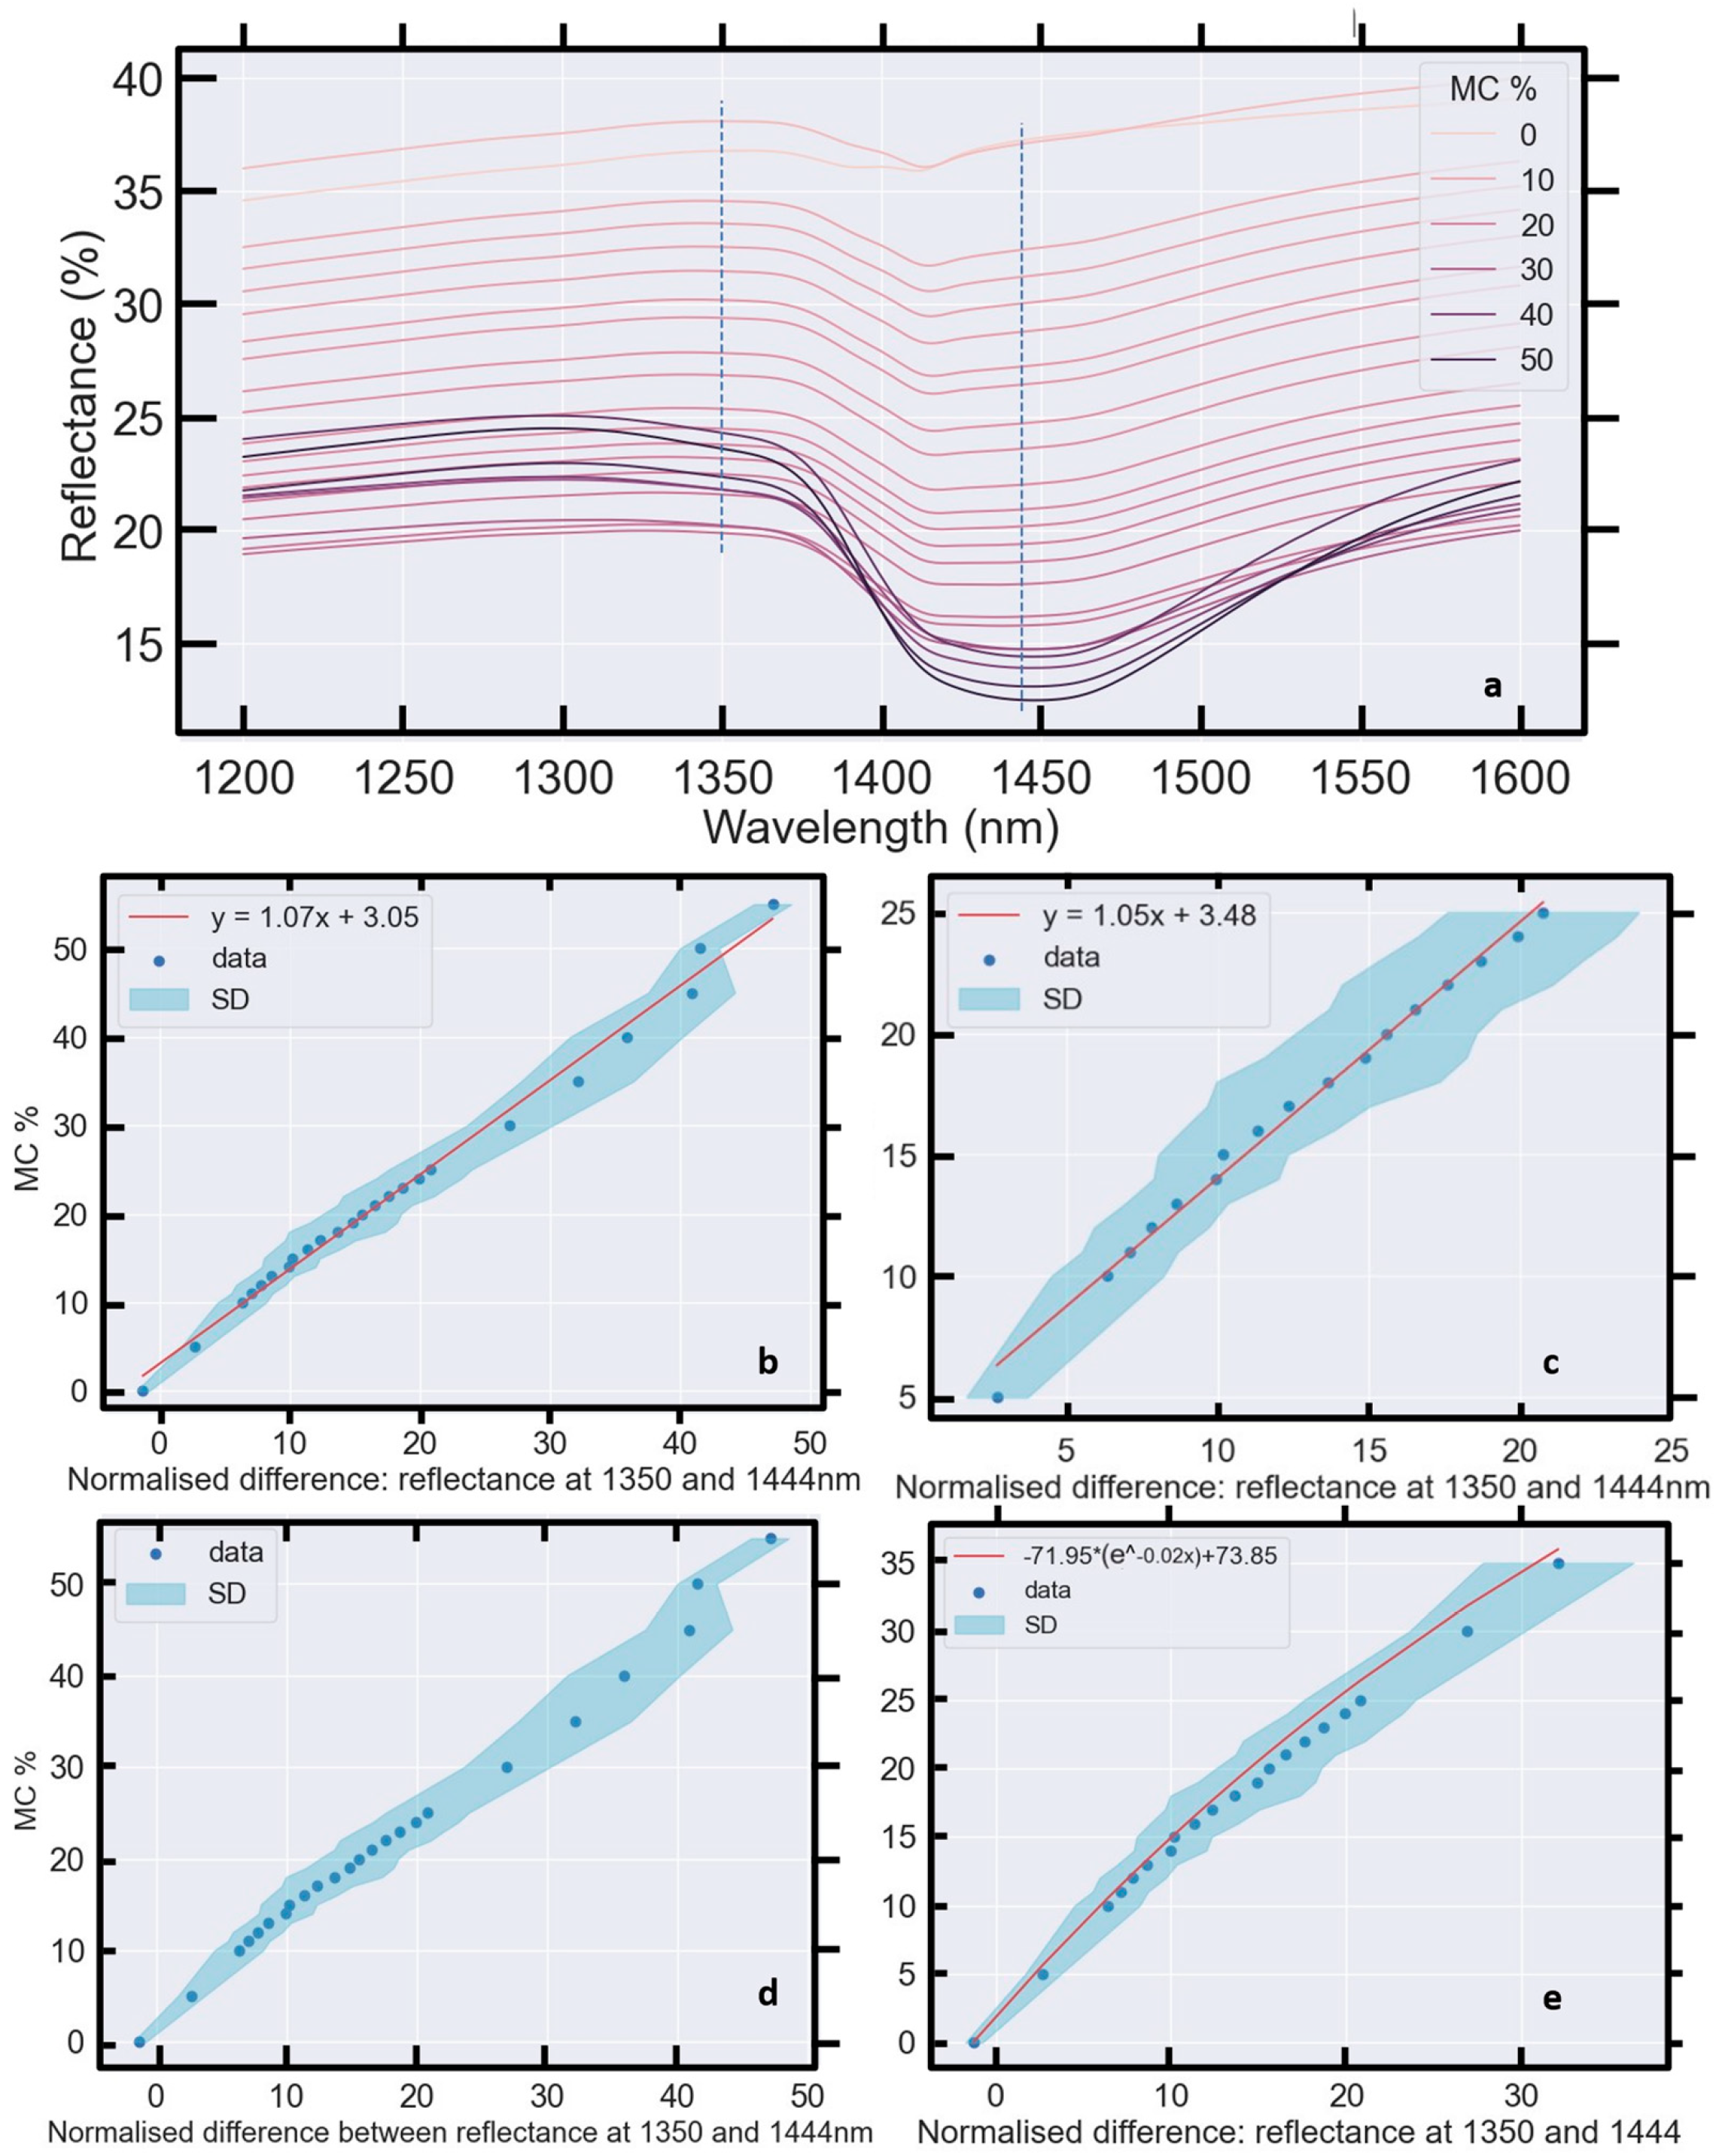
For Figure 16, Figure 17, Figure 18b–d, Figure 19, Figure 20, Figure 21 and Figure 22, y represents soil moisture content (MC %) and x is the normalised difference between the sample averaged reflectance R at two wavelengths (Equation (5)). For example, in Equations (6) and (7), the wavelengths of interest are 1350 and 1444 nm (Figure 17a) and therefore:
x = [R(1350 nm) − R(1444 nm)]/R(1350 nm).
and y = MC %.
Though taking the difference between the values within and outside of an absorption feature is not an exact measure of the “depth” or “size” of an absorption feature, this is a simple, intuitive and logical method for estimating the intensity of an absorption feature.

6.2.1. The 1400 nm Absorption Feature

A strong linear relationship between soil MC and the depth of the sample-averaged 1400 nm absorption feature was found. Figure 16 demonstrates this quantitatively by using the differences between reflectance at 1350 nm outside and 1444 nm within the absorption feature. Though it is possible to well fit (R² of 1.00, SE of 0.02 and reduced chi-squared of 1.42) a linear model (Figure 16b) to the entire range of data points (0–55% MC),
y = 1.07x + 3.05,
an improved fit according to the chi-squared (R² of 0.99, SE of 0.03 and reduced chi-squared of 0.11) is achieved (Figure 16c) by fitting an exponential model to the domain of 0–35% MC:
y = 71.95 × e−0.02x + 73.85.
Here, x is defined by Equation (5).
Equations (6) and (7) show that the absorption feature around 1400 nm increases in depth with MC and may be used to predict soil MC from reflectance data at these two wavelengths. Prediction accuracy is improved by reducing the domain of the model to 0–35% MC. By eye, Figure 16b suggests that bilinear fits would also be viable.
Based on Equations (6) and (7), soil MC (%) may be predicted for any measured difference in reflectance that is predicted for any given x. Alternatively, a measured reflectance value at either 1350 nm or 1444 nm may be used to predict the soil reflectance value at the other wavelength when the soil MC is known.
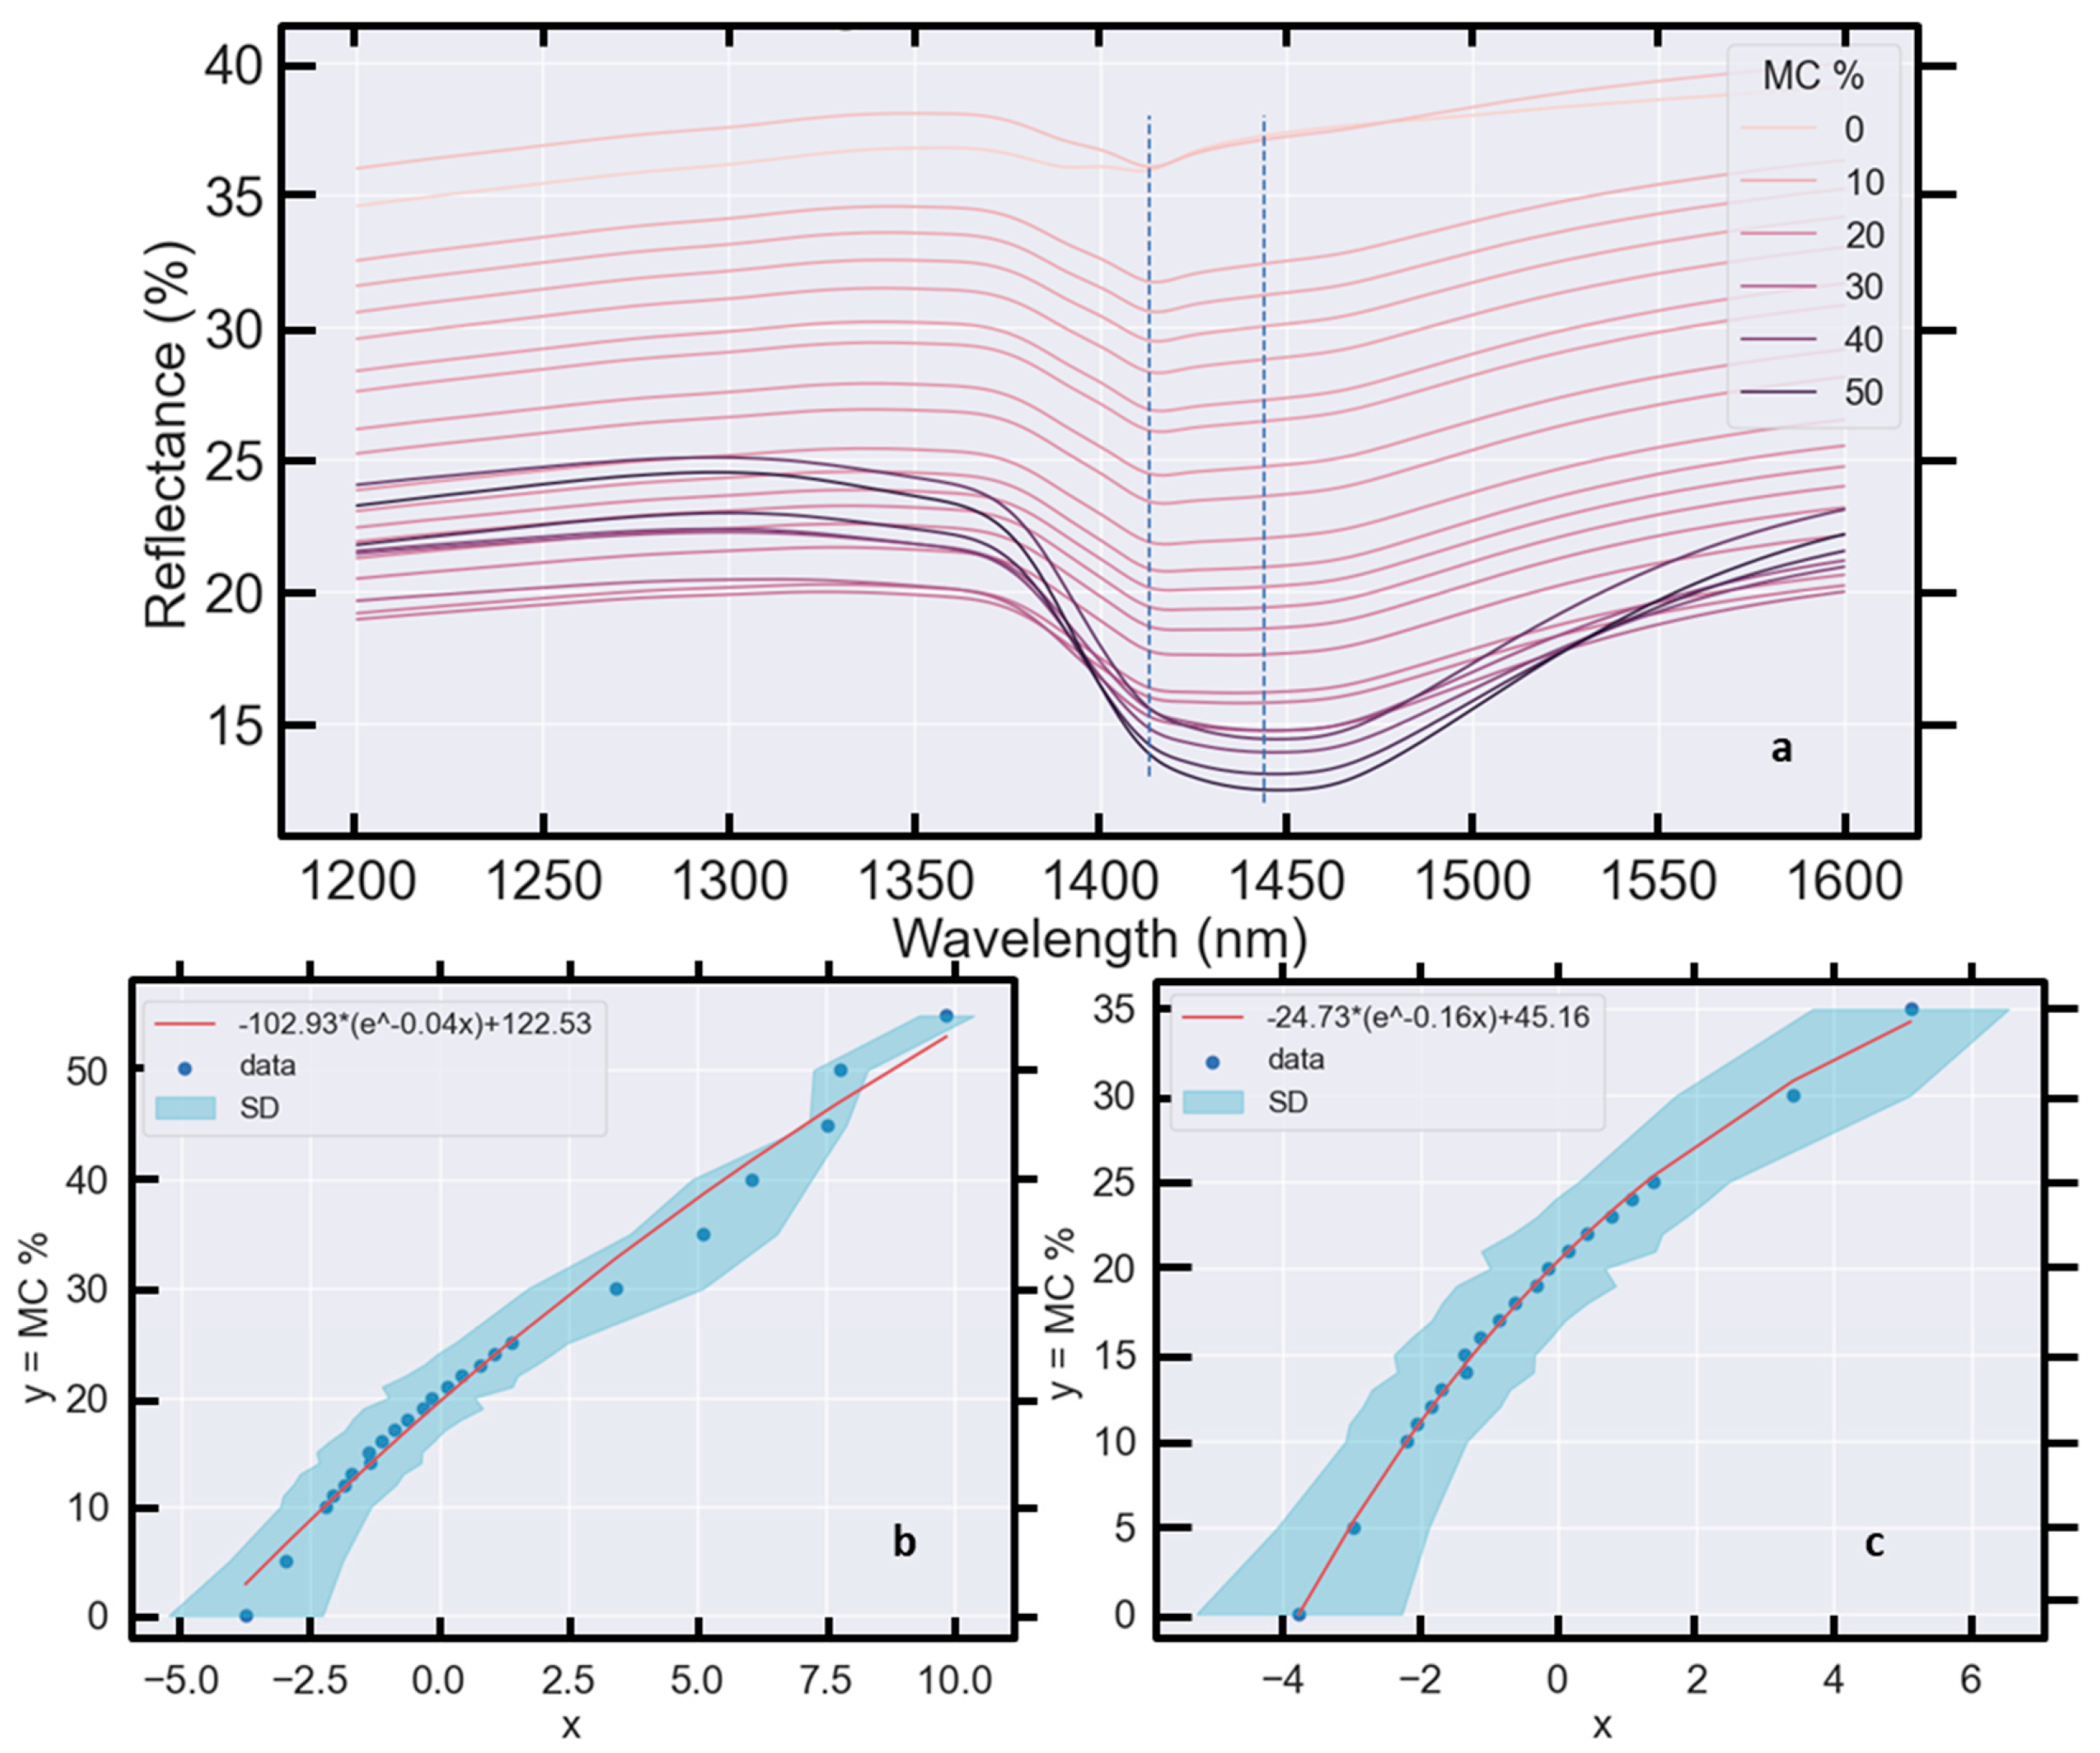
As well as the variation in feature depth, the lowest point in the 1400 nm absorption feature exhibits a drift towards higher wavelengths with increasing MC (Figure 7 and Figure 16a). Put another way, the “centre” or vertex of the absorption feature changes with MC, requiring consideration of the best way to quantify the depth of the feature as the vertex drifts. One method is presented in Figure 16, another in Figure 18. In Figure 17b, the normalised difference between reflectance at 1413 and 1444 nm is found to increase exponentially as a function of MC. Hence, exponential models are more appropriate than linear models for describing this relationship. For the MC domains of 0–55% (Figure 17b) and 0–35% (Figure 17c) the exponential fits are:
y = −102.93 × e−0.04x + 122.53
y = −24.73 × e−0.16x + 45.16
with x = [R(1413 nm) − R(1444 nm)]/R(1413 nm). For the domain of 0–55% MC (Figure 17b, Equation (8)) the r-square is 0.99, the standard error is 0.1 and the reduced chi-squared is 2.71. For the domain of 0–35% MC (Figure 17c, Equation (9)) the r-square, standard error and reduced chi-squared are 0.97, 0.21 and 0.16, respectively.

6.2.2. The 1900 nm Absorption Feature

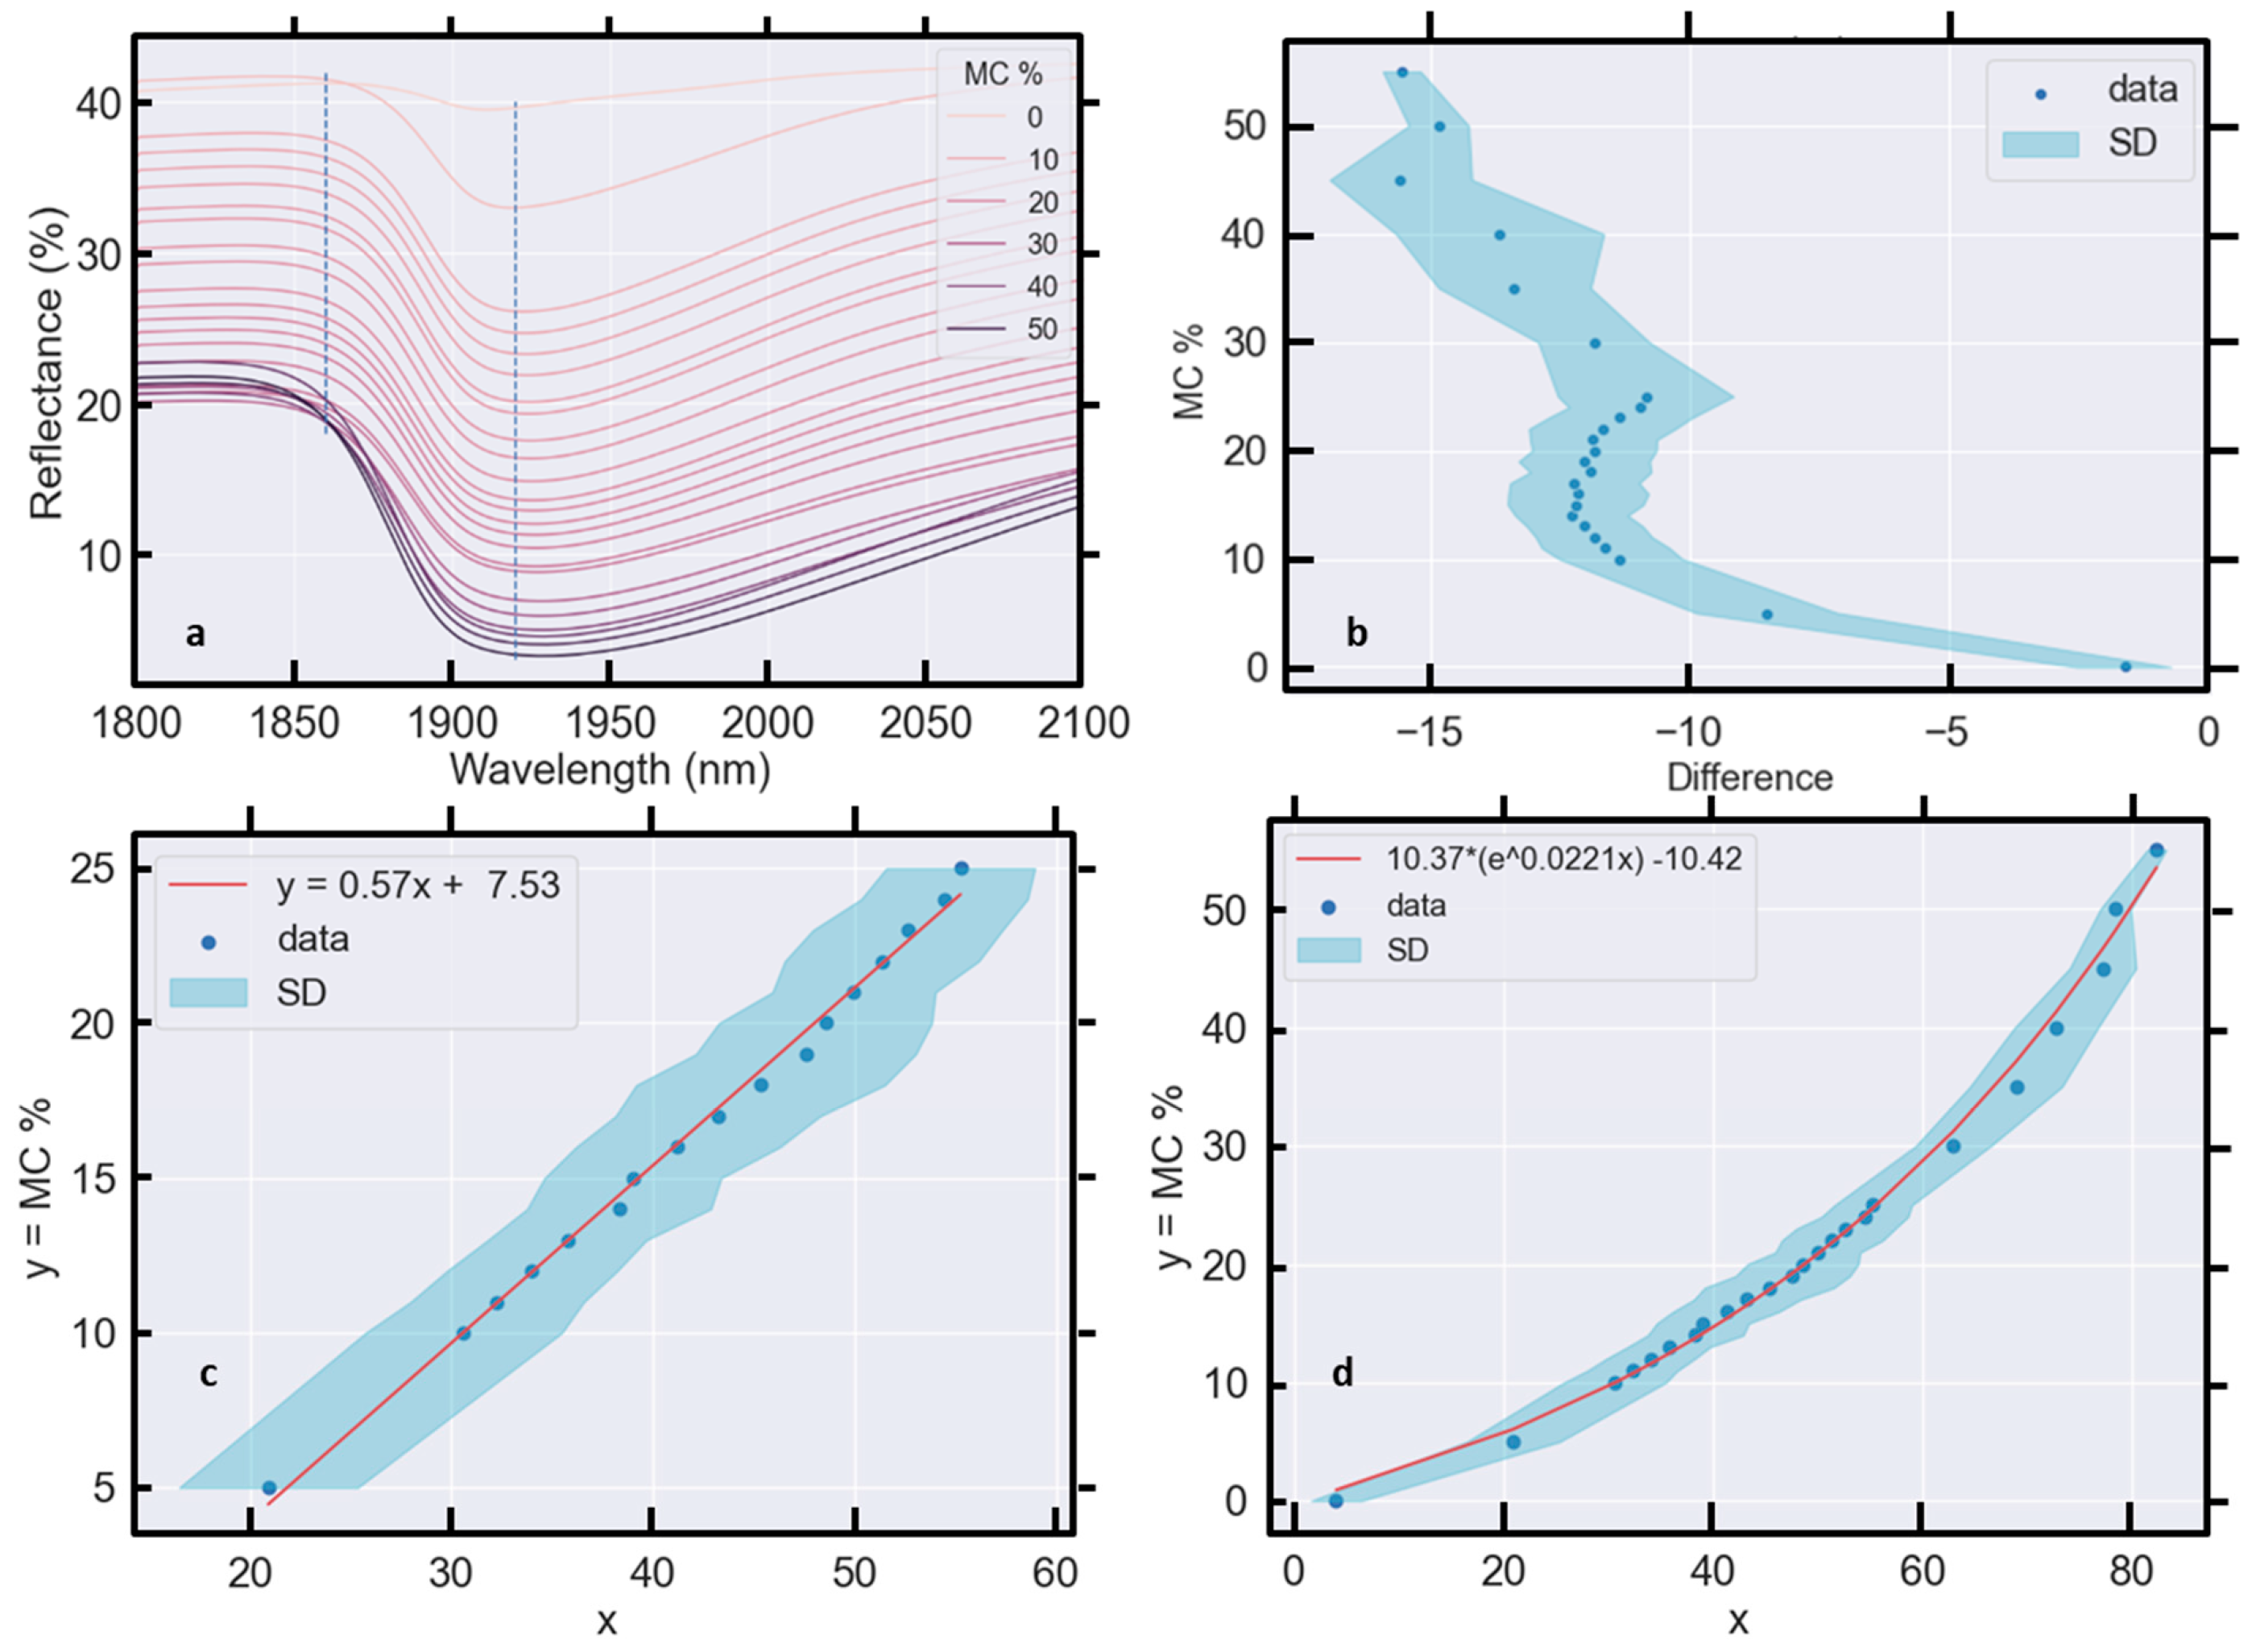
The depth of the absorption feature near 1900 nm also shows a strong relationship with MC (Figure 18) once normalised. Here, x = R(1920 nm) − R(1860 nm) in Figure 18b, and x = [R(1920 nm) − R(1860 nm)] / R(1920 m) in Figure 18c,d. In this case, the value of normalisation is clearly demonstrated: in Figure 18b it is apparent that no 1:1 relationship exists between MC and the normalised difference in reflectance at 1860 nm and 1920 nm, while linear (Figure 18c) and exponential (Figure 18d) models may be well fitted to the normalised data in the domains of 5–25% MC or 0–55% MC, respectively. The relevant equations for these models are:
y = 57.34x − 7.53
y = 10.75 × e2.1723x − 10.85
Despite having different functional forms (linear and exponential) while including overlapping data, both of the normalised models perform well. The linear model has a slightly improved fit compared to the exponential model, with an R² of 1.00 and 0.97, SE of 0.01 and 0.04, and reduced chi-squared of 0.16 and 0.95, respectively.
Equation (10) can be used to predict soil MC by collecting soil reflectance data at 1860 nm and 1920 nm and then calculating the normalised difference. For instance, if the difference was returned as 0.5, the soil MC could be estimated as 21%, ±3% (18–24% MC).

6.2.3. The 2200 nm Absorption Feature

Another absorption feature exists around 2200 nm (Figure 2, Figure 3, Figure 4, Figure 5, Figure 6, Figure 7, Figure 8, Figure 9, Figure 10 and Figure 19). This absorption feature is usually associated with clay minerals such as kaolinite [54] or metal hydroxides [52] in the soil, including AlOH, FeOH and MgOH molecules as opposed to the O–H bonds in water. However, this feature also exhibits a strong dependence upon soil MC (Figure 2, Figure 3, Figure 4, Figure 5, Figure 6, Figure 7, Figure 8, Figure 9, Figure 10 and Figure 19). Figure 19 shows this feature decreasing in size, as soil MC increases.
Figure 19 also demonstrates linear relationships between the normalised difference in reflectance at 2140 nm and 2240 nm, wavelengths on either side of the ~2200 nm absorption feature. In particular, the normalised difference between the reflectances at 2140 nm and 2240 nm shows a monotonic, linear dependence on MC for the domains of 0–55% MC (Figure 19b, Equation (12)), and, preferably, 0–25% MC (Figure 19c, Equation (13)).
The corresponding relationships are
y = −5.61x + 47.90,
and
y = −6.97x + 55.89,
with x = [R(2140 nm) − R(2240 nm)]/R(2140 nm). The R2, SE and reduced chi-squared for these models are 1.00, 0.12 and 1.97 and 1.00, 0.11 and 0.12, respectively.
Although a marginally better fit is achieved by reducing the model domain to 5–25% MC (Equation (13), Figure 19c), a model covering the entire domain (Equation (12), Figure 19b) of available data (0–55% MC) may be more valuable in some situations because it is applicable to the soil at any moisture content.
Considering absorption features are generated by the absorption of energy (light) through the vibration of specific chemical bonds, it is not surprising that there is a direct relationship between the concentration of chemicals with these specific bonds and the depth of the absorption feature. Therefore, Equations (6)–(12) (particularly Equations (6), (8), and (11)), are proposed as simple but effective algorithms for estimating soil MC from a very limited amount of soil reflectance data at only two NIR wavelengths.

6.3. Absorption Features: Other Relative Relationships

Detailed analysis of the hyperspectral data collected for this review has also revealed the presence of other relationships between soil MC and reflectance at selected wavelength combinations. The relationships presented in this sub-section are less intuitive than those presented in Section 6.2, since they involve sums rather than differences in reflectance, but have strong statistical viability.
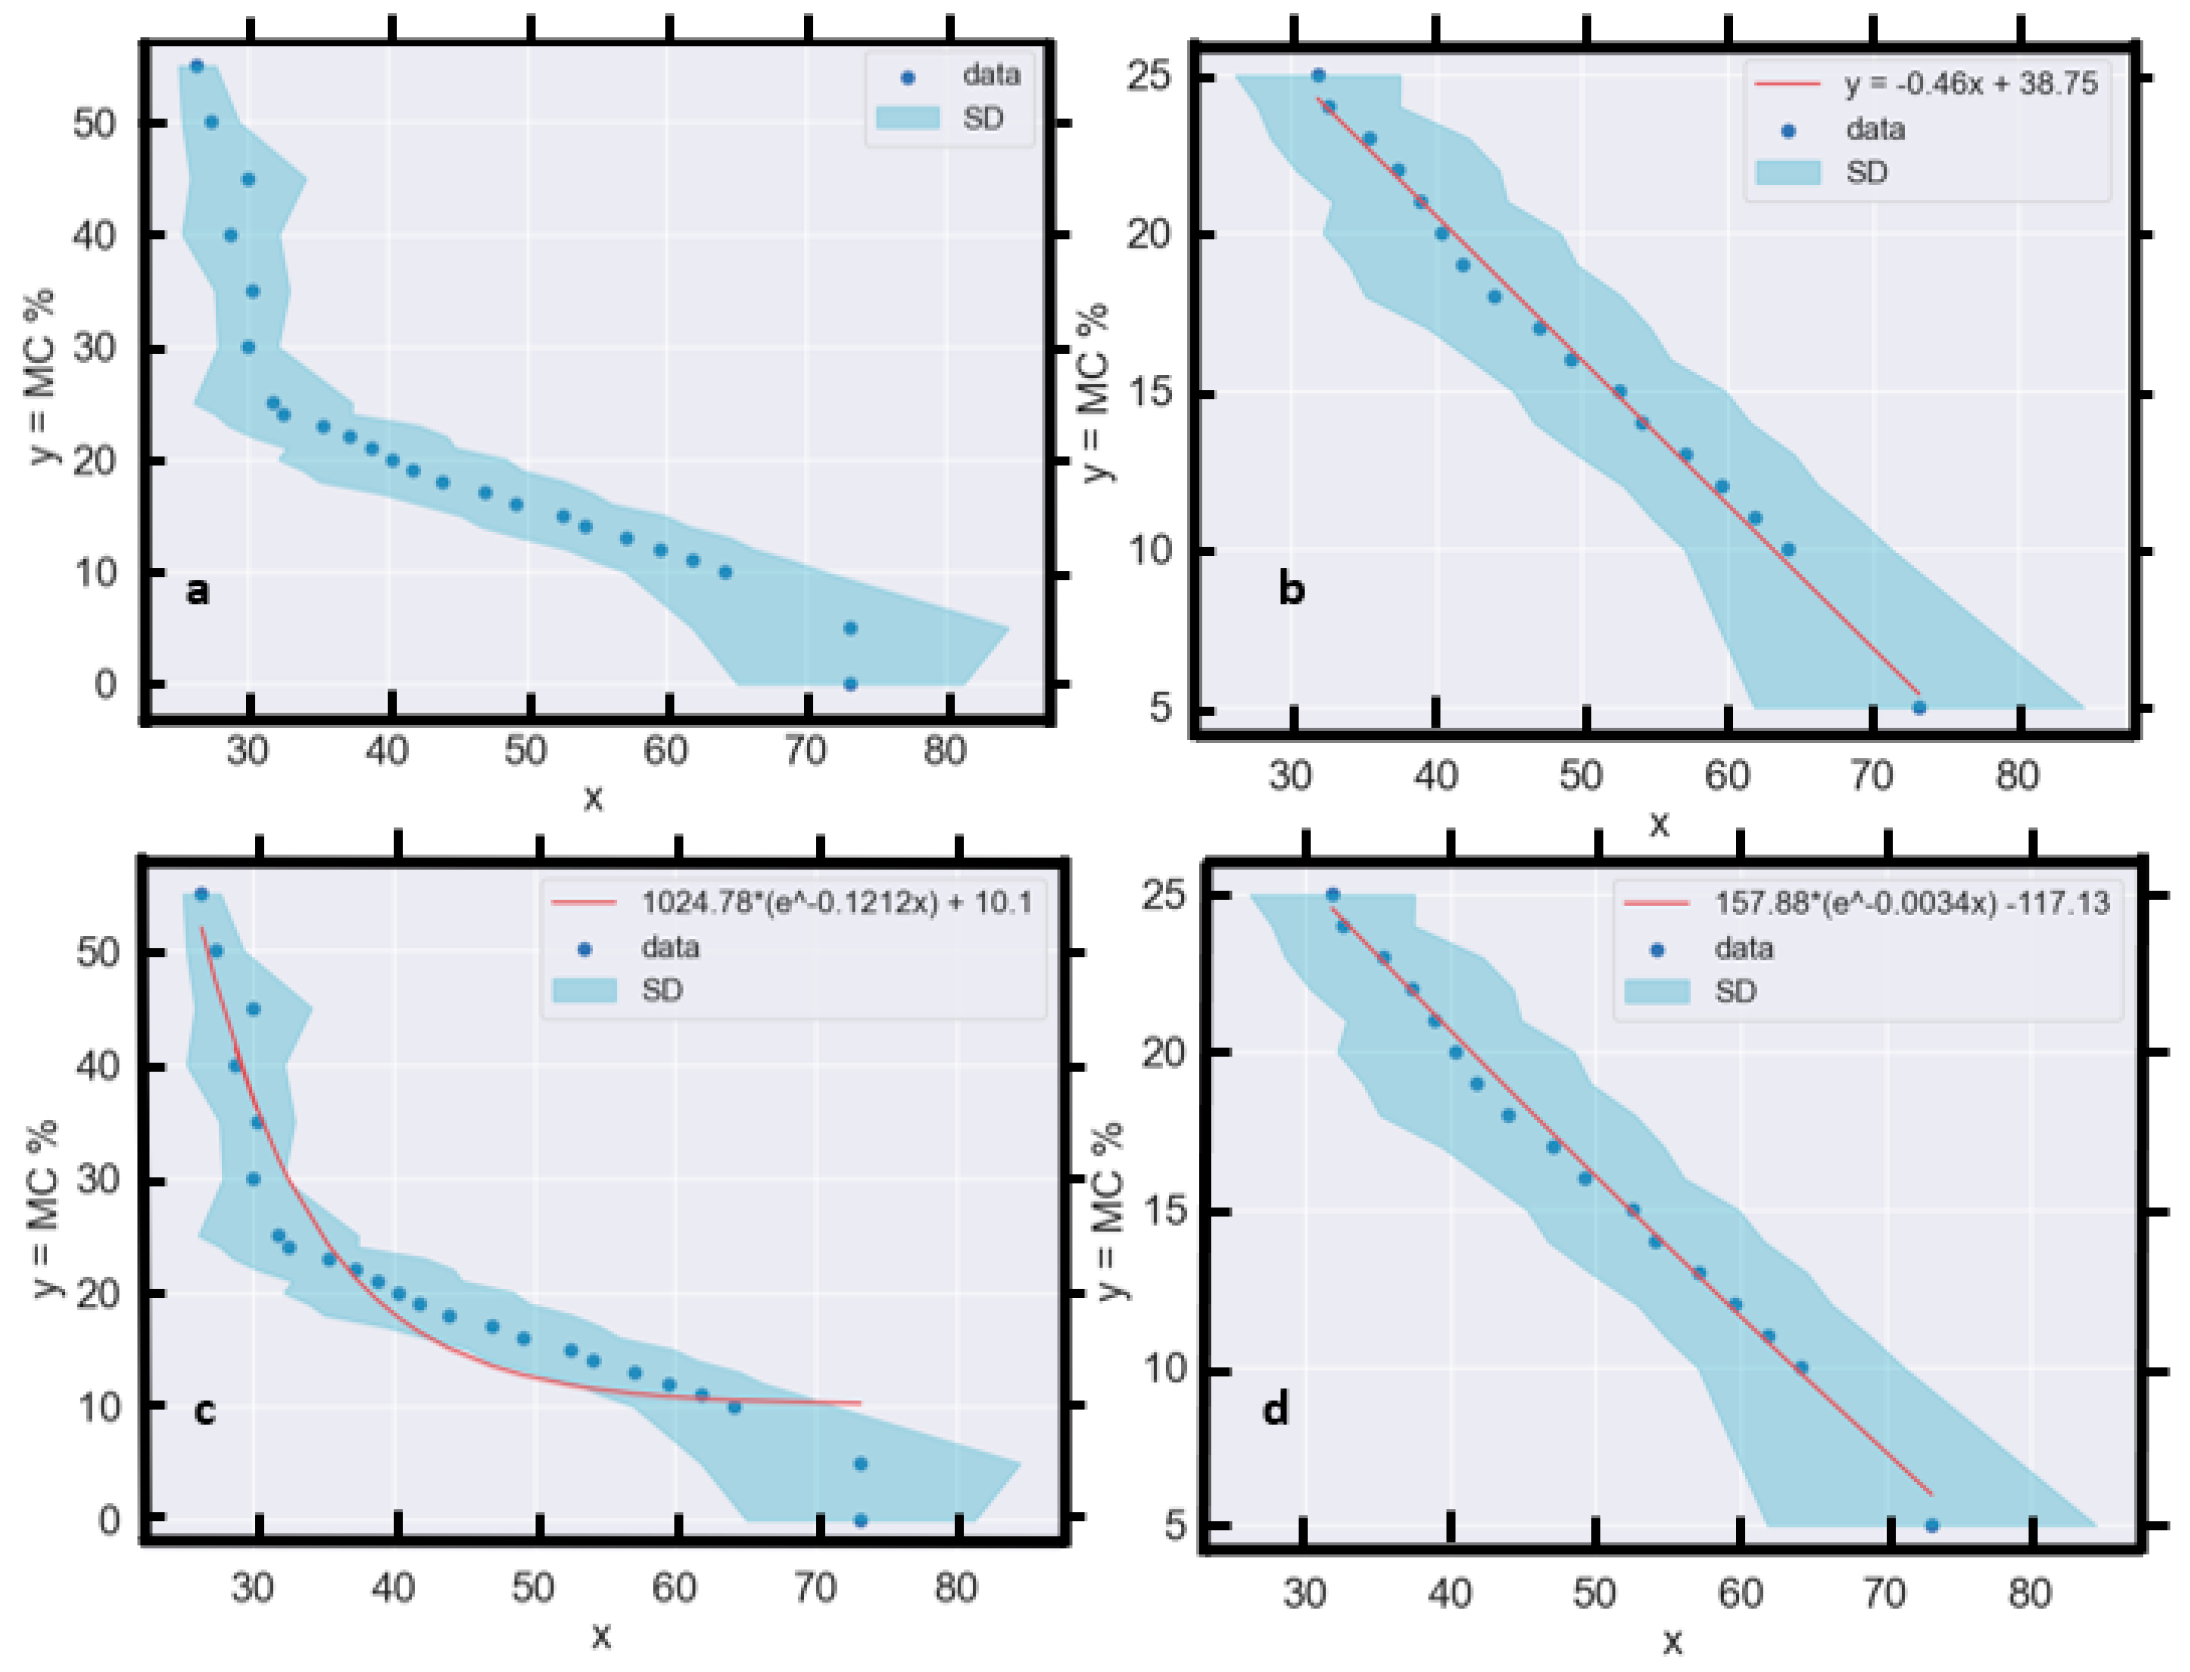
A linear (Figure 20b) or exponential (Figure 20d) model can be fit to the relationship between soil MC and the unnormalised sum of reflectance values at 1413 nm and 1444 nm, with x = R(1413 nm) + R(1444 nm) for the domain of 5–25% MC. The R2 is 1.00, the SE is 0.01 and the reduced chi-square is 0.2 for both the linear and exponential models, however, the linear model (Equation (14)) is simpler and more intuitive, and hence, is recommended. Neither linear nor exponential models are suitable for the domain of 0–55% MC, with the relationship saturated beyond 25% MC.
The equation and domain for the recommended linear model are, respectively,
y = −0.46x + 38.75,
and 5–25% MC.
Linear relationships are also apparent (Figure 21) between soil MC and the sum of reflectance values at 1350 and 1444 nm, with x = R(1350 nm) + R(1444 nm). Fitted with the linear models displayed in Figure 21, the relationships between x and MC return a R-square of 1.00 and 1.00, a SE of 0.02 and 0.01 and a reduced chi-squared of 1.42 and 0.21 for the domains of 0–55% MC and 10–45% MC, respectively. The equations describing the best fits are given in Figure 21.
When the sum of the sample-averaged reflectances at 1860 nm (outside) and 1920 nm (within the absorption feature) is considered as a function of MC (Figure 22a), a linear relationship with an R2 of 1.00 and standard error of 0.01 is apparent for the domain of 5 to 25% MC (Figure 22b). Once the reflectance data are normalised, the relationship becomes exponential (Figure 22c) and extends to the entire range of the available data (0–55% MC), with R2 = 0.97, SE = 0.04 and a reduced chi-squared of 0.95. The transformation of a linear relationship into an exponential relationship over a large range of MC upon normalisation of the data is a striking evolution in form.
The linear and exponential relationships demonstrated are described by the equations
y = −0.57x + 107.14,
and
y = 858.44 × e0.0221x − 10.42,
respectively, with x = R(1860 nm) + R(1920 nm) and x = [R(192s0) + R(1860)]/R(1920), respectively.
There is some disagreement in the literature as to the location of the O–H absorption feature around 1900 nm [13,54,55]. Figure 23 explains these discrepancies by demonstrating a progressive drift in the vertex (wavelength with the minimum reflectance) of the absorption feature (Figure 23a) that is quantified in Figure 23b: the vertex drifts between 1911 nm at 0% MC and 1930 nm at 40% MC. With the vertex at 1927 nm at 55% MC, it is clear that the reported “centre” of the absorption feature varies with MC.

7. Normalised Soil Moisture Index

The Normalised Soil Moisture Index (NSMI) was proposed by Haubrock, Chabrillat [13] to make robust predictions of soil MC from visible–NIR soil reflectance data for a wide variety of soils:
NSMI = (R[j] − R[i])/(R[j] + R[i])
In Equation (17), R[j] refers to the reflectance value at the higher wavelength and R[i] refers to the reflectance value at the lower wavelength.
After trailing the NSMI algorithm at all possible band combinations in the range of 350–2500 nm, an R² of 0.71 was the best result achieved by Haubrock, Chabrillat [13] with reflectance data at 1800 nm and 2119 nm from 271 soil samples. Nocita, Stevens [21] trialled the NSMI algorithm on reflectance data from 100 soil samples from Luxembourg using the same wavelengths as Haubrock, Chabrillat [13] and found their model returned an R2 of 0.74, a minor improvement.
Following the application of a range of pre-processing methods, including PCA and fuzzy k-means clustering, to reflectance data of 121 soil samples from the Jianghan Plain (Hubei Province, China), Hong, Yu [30] applied the NSMI to all possible wavelength combinations in the range of 400–2500 nm. Visualised with a correlogram (Figure 24a), they found that reflectance data from 1360 nm and 1940 nm returned the best R² results of 0.9194 (Figure 24b) when applied to the NSMI. However, they also reported a strong correlation between soil MC and the NSMI for a number of NIR wavelength combinations. The wavelengths of 1360 nm and 1940 nm found to be optimal by Hong, Yu [30] are considerably different from those originally proposed by Haubrock, Chabrillat [13].
Next, when the NSMI was applied by us to soil reflectance data collected for this review at 1360 nm and 1940 nm, the NSMI underestimated MC below 25% and above 40% (Figure 25a). This is true for both the 10 individual soils and the sample-averaged result. The differences between the predicted and actual MC were more pronounced at lower MC, to the point where MC values of 2% to −9% (clearly impossible) were predicted for the oven-dry (0% MC) reflectance data.
When the NSMI is applied to the new Muttama reflectance data from 1800 nm and 2119 nm, corresponding to the wavelengths returning the best results for Haubrock, Chabrillat [13], the model performs very poorly at all MCs, severely underestimating the MC of all samples (Figure 25b).
It is noted that the NSMI proposed by Haubrock, Chabrillat [13] involves the normalisation of a difference in reflectances by a sum of reflectances, both at common wavelengths. Meanwhile, the simpler normalisations of sum and differences presented in Section 6 lead to well-defined linear relationships over the range of 5–25% MC and sometimes larger domains. Hence, the simpler normalisation and equations presented in Section 6 of this review are suggested as more robust and accurate alternatives to the NSMI equations proposed.
It should be recognised that neither of the wavelength combinations for the NSMI presented in Figure 25a,b include wavelengths directly affected by O-H bond vibrations and associated absorption. Therefore, the reported NSMI relationships are likely to record a statistical correlation, instead of a direct causal link between soil MC and reflectance. This may explain why the NSMI equation and wavelengths suggested by Haubrock, Chabrillat [13] and Hong, Yu [30] appear vulnerable to variability between soil types and individual samples. Meanwhile, the equations presented in Section 6.2.1 and Section 6.2.2 should be immune, or at least less strongly affected by such differences. This insight is provided as a possible explanation for the apparent lack of consistency and transferability of the NSMI results reported in the literature.

8. Discussion

8.1. Application of the Results

New spectral data used in this research were collected from soils characteristic of those in Southeastern Australia, with a range of organic matter concentrations and soil textural properties (Appendix A.1, Table A1). Moreover, these samples were essentially selected at random, in the sense that we used samples collected for independent projects by others that were available to us. Accordingly, we expect these results to apply to soils from similar climatic, land use and geomorphic zones (temperate agricultural lands with silty/clay soils). The relationships reported for averaged data were also comparable to those for each individual soil, except where specified otherwise.

8.2. Future Research

Future research could also focus on scaling the equations provided in Section 6 according to these soil variables. In the meantime, the use of two measured data points in the range of 5–25% MC for each soil type is recommended for calibration of the linear equations provided in this study. This calibration allows the determination of the appropriate offset (y-intercept) and x-coefficient of a linear equation for each soil type. Others are encouraged to trial the equations presented in this review on other soil types and soil reflectance datasets, to test the rigour and transferability of the results presented.

8.3. Why Use Vis–NIR Data When SAR Is Available?

Some may question the value of attempts to predict soil MC with visible NIR remote sensing data considering the widespread availability, penetration capacity, and resolution of Sentinel 1 and other Synthetic Aperture Radar (SAR) data products. Certainly, the cloud and ground surface-penetration capacity and irrelevance of ambient lighting conditions (day and night imaging possible, optical shadows not a problem) make SAR an attractive choice in some situations. However, SAR data are generally more difficult to interpret and process [66], require soil surface roughness and incident angle data for model calibration [67], and may only be used for a limited range of soil MC [68]. There are also a number of independent, compelling, arguments for the development of new and improved soil MC prediction algorithms based on visible and NIR data.
  • Visible and NIR remotely sensed data covering much of Earth’s land surface over the past 50 years are readily available with, particularly in recent years, very high spatial (e.g., some planet satellite data are sub-meter resolution) and temporal resolution coverage. This is especially true when data products from multiple satellites are combined (e.g., Aqua and Terra MODIS satellites).
  • Crucially, improved data availability makes long-term and high-temporal-resolution studies of soil moisture possible.
  • Most “analysis-ready” remote sensing data products are not corrected for the effects of soil moisture. Equations used to predict soil MC can also be used to correct other remotely sensed data products for the effects of soil moisture, thereby improving prediction models for other surface, soil and atmospheric properties of interest.
  • Many existing atmospheric, soil and landscape monitoring products have been developed with visible and NIR remote sensing data. Widely applicable and robust corrections for soil moisture could further improve the performance of these models.
  • It is extremely valuable to understand the domain and other limits of any relationship. Prior to this review, there was a poor understanding of, and no consensus on, the limits and transferability of existing soil MC prediction models. Now, it is clear that different equations and data must be used to predict soil MC below and above 25% MC in many cases unless data indicating otherwise (e.g., Figure 21d) are available. It has also been demonstrated with analysis of the new data presented in this review that normalisation of reflectance data typically improves model performance.

8.4. Linear or Non-Linear Relationship?

While both linear and non-linear relationships are demonstrated from new data, linear relationships (especially in NIR wavelengths) with a domain of 5–25% MC were found to be common for a wide range of spectral quantities, including both reflectances and wavelengths. This result is particularly significant as it indicates that:
  • Simple linear models may be used to calculate or predict soil MC from NIR data in many cases;
  • Linear correction models are widely appropriate for the correction of soil reflectance data for the effects of soil moisture.
However, it should also be expected that models applied to data from less intuitive wavelength combinations (Equations (1)–(4) and (13)–(15)) are more sensitive to differences between soil types, as demonstrated in Section 7 with the NSMI.
Linear (Equations (6), (10), (12) and (14)) and exponential models (Equations (7)–(9) and (11)) presented in Section 6.2 quantify a causal relationship between soil MC and the depth of associated absorption features. These relationships are expected to be much more robust than relationships (e.g., presented in Section 6.1) utilising data from other wavelengths. This topic could be the subject of further research in this field.

8.5. Absorption Features

Three absorption features around 1400 nm, 1900 nm and 2200 nm are commonly reported in the relevant literature. This review presents results to demonstrate that the absorption feature around 2200 nm does not necessarily indicate the presence of soil moisture, as reported in some literature but instead becomes progressively masked as soil MC increases. The other absorption features around 1400 nm and 1900 nm are generated by the vibration of O-H bonds in water molecules. Though these features are widely recognised in the relevant literature, there are discrepancies in the reported position of these features. This review explains these discrepancies by demonstrating a progressive drift in the minimum (vertex) of the absorption features towards higher wavelengths as soil MC increases.

9. Conclusions

In this review, the disputed topic of the nature of the relationship between soil MC and visible–NIR reflectance reported in the relevant literature is explored, queried, tested and then addressed in detail. After building a clear picture of prevalent themes and results presented in the literature, the consistencies and inconsistencies in these reports were examined. Common themes reported in the literature included a general decrease in soil reflectance as soil MC increased, the presence of a “Moisture Threshold”, qualitative differences in reflectance between soils, absorption features around 1400 nm, 1900 nm and 2200 nm, as well as linear and non-linear models being fitted to various visible and NIR wavelength combinations. However, no equation for predicting soil MC from soil reflectance data, and no reliable method for correcting soil reflectance data for the effects of soil moisture has been identified. Hence, this review presents new, high-resolution data, which are used to develop numerical models for the accurate prediction of soil MC based on proximal soil reflectance and remotely sensed data.
The new data presented confirms the general decrease in soil reflectance as soil MC increases, as previously identified by Bowers and Hanks [34], Haubrock, Chabrillat [13], Fabre, Briottet [32], Lobell and Asner [28], Yu, Hong [23] and others. In Section 5, this general decrease is quantified by averaging reflectance across all samples and wavelengths and fitting a linear model to the resulting relationship. A limit to the “general decrease” in reflectance is also identified. Specifically, beyond ~25% MC, the relationship becomes saturated, with this saturation apparent for all samples in this study. It is also identified that at low MCs, there is an association between the soil reflectance at 0–5% MC and the soil type. However, this topic requires further research with additional data. Importantly, it is shown that the general decrease in soil reflectance exists for all soils tested here and that the relationship can be consistently expected between 5–25% MC, with slight variations between soil types.
The NSMI, an equation presented in the literature for the purpose of predicting soil MC from two NIR wavelengths was tested with new data collected for this review. For both wavelength combinations suggested previously, the NSMI under-predicted soil MC, in one case severely. In one sense, the NSMI is the division of a normalised difference by a normalised sum, each of which is shown here to be often described by an exponential or linear model, and for which the division need not be well described as a linear function. Hence, the NSMI appears to include unnecessary calculations (specifically division by a sum of reflectances at two wavelengths rather than by a reflectance for a single wavelength), and a simplified version of the NSMI is proposed.
In summary, this review provides detailed insights into the relationships between soil MC and the reflectance of soils around 1400 nm and 1900 nm absorption features and at other visible–NIR wavelengths. Section 2 shows that the relationship between soil MC and reflectance at the absorption features is not clearly quantified in the existing literature. Hence, the analysis of new soil reflectance data is used to clarify some inconsistencies in the literature, deduce and define a number of robust soil MC prediction models and then define an improved version of the NSMI.
Section 4, Section 5 and Section 6 demonstrate and quantify the monotonic, linear and non-linear relationships present for wavelength-averaged and wavelength-specific combinations of soil reflectance data. These include data in and around the 1400 nm, 1900 nm and 2200 nm absorption features. Although linear and exponential models are often both relevant, most often, linear relationships are accurate, robust and well-defined. Though many relationships are only appropriate for the domain of 5–25% MC, some models covering the entire range of new data collected (0–55% MC) are presented and it is shown that simple normalisation improves both the strength and domain of the relationship in many cases. The quantitative models proposed are particularly valuable because they allow both the determination of soil MC from soil reflectance data at a range of visible–NIR wavelength combinations, and the correction of soil reflectance data for the effects of soil moisture.

Author Contributions

Conceptualization, S.L.M.; methodology, S.L.M. and I.H.C.; software, S.L.M.; validation, S.L.M. and I.H.C.; formal analysis, S.L.M. and I.H.C.; investigation, S.L.M. and I.H.C.; resources, S.L.M. and I.H.C.; data curation, S.L.M.; writing—original draft preparation, S.L.M.; writing—review and editing, S.L.M. and I.H.C.; visualization, S.L.M.; supervision, I.H.C.; project administration, I.H.C.; funding acquisition, I.H.C. All authors have read and agreed to the published version of the manuscript.

Funding

The authors would like to thank the Australian Research Council (ARC) for funding (grant ID: IC170100023) the Australian Research Council’s Centre for CubeSats, UAVs and their Applications (CUAVA), based at the University of Sydney, which in turn, supported this work.

Data Availability Statement

The data that support this study are available at this link.

Conflicts of Interest

The authors declare no conflict of interest.

Appendix A. Methods

Appendix A.1. Soil Samples

Visible and NIR reflectance data were collected at 1 nm intervals between 400–2500 nm from ten soil samples (Table A1). The samples were effectively selected at random, to gain a representative insight into the spectral effects of moisture on soils from Southeastern Australia. The samples include a mix of clay loam, loam, sandy clay loam, and silty loam textures, with an organic matter content between 2.2–4.6% and a bulk density of 1.25–1.41. These values are comparable to other soils in the region.
Table A1. Particle size distribution (PSD), soil texture, bulk density and organic matter content of Muttama soil samples at time of collection. CL: clay loam, L: loam, ZL: silty loam, SCL: sandy clay loam.
SampleClay %Silt %Sand %Soil TextureOrganic MatterBulk Density
ISS10A25.4118.6555.93CL3.861.30
ISS11A25.2019.3555.44CL4.551.26
ISS14A22.1217.0560.84L3.191.36
ISS17A25.0620.8954.05CL4.381.27
ISS20A21.1025.8353.07ZL2.241.41
ISS25A27.1915.8656.95CL3.481.33
ISS26A18.2828.5653.16ZL4.261.27
ISS27A20.246.8472.93SCL3.711.34
ISS28A18.5526.0255.43ZL2.831.38
ISS36A14.4727.5857.94ZL3.911.31
The samples were collected in 2019 on a property near Muttama, NSW, Australia, from a southwest-facing paddock (Figure A1a,b) at 290–340 m above sea level. The paddock is part of a grazing property and is typically used for grazing livestock (sheep and cattle). After collection in 2019, the samples were dried in a soil drying oven at 40 °C then stored at room temperature in plastic, screw-top jars. Clay, silt and sand content, OM, soil texture and bulk density data were collected for each sample (Table 1). In May 2020, ~55 g of soil was removed from each jar and dried at 105 °C for 48 h in preparation for this experiment.
Figure A1. (a) Sampling locations of the ten soil samples—in a grazing paddock near (b) Muttama, NSW (red pin in lower right).
Geotechnics 04 00005 g0a1

Appendix A.2. Soil Moisture Addition

To increase the soil MC of each sample by the desired interval before soil reflectance was measured, distilled water was added with a pipette. Increments of 2.5 mL were used to increase the soil MC by 5% and 0.5 mL to increase the soil MC content by 1%. These values were calculated with Equation (A1) [69].
Gravimetric soil MC (%) = [mass of moist soil (g) − mass of oven-dried soil (g)/mass of oven-dried soil (g)] × 100
Water was incorporated into the soil by gentle mixing with a clean teaspoon. Reasonable efforts were made not to crush soil aggregates or apply excessive force during mixing. Soil reflectance data were then collected with an ASD FieldSpec Spectroradiometer at 1 nm intervals between 400–2500 nm at 0, 5, 10, 11, 12, 13, 14, 15, 16, 17, 18, 19, 20, 21, 22, 23, 24, 25, 30, 35, 40, 45, 50 and 55% MC (Figure A2), or until the sample was completely saturated and water began pooling in the Petri dish. The ASD was calibrated with a white Spectralon tile between each five measurements. Reflectance data were initially visualised and then exported as text files with the Indico Pro software package. Data cleaning, reduction to the 400–2500 nm range, visualisation and analysis were undertaken in Python using Numpy, Pandas, Matplotlib, Seaborn and other libraries. Data were also averaged across all samples and the standard deviation was added to plots to determine the variability between samples.
Figure A2. (aj) Visible–NIR reflectance data for the Figure A2: Visible–NIR reflectance data for the ten samples analysed in this study.
Geotechnics 04 00005 g0a2

References

  1. Burk, L.; Dalgliesh, N. Estimating Plant Available Water Capacity; Grains Research and Development Corporation: Barton, Australia, 2008. [Google Scholar]
  2. Petronaitis, T.; Forknall, C.R.; Simpfendorfer, S.; Flavel, R.; Backhouse, D. Is There a Disease Downside to Stripper Fronts? Harvest Height Implications for Fusarium Crown Rot Management; GRDC Update; GRDC: Barton, Australia, 2022. [Google Scholar]
  3. Slamini, M.; Sbaa, M.; Arabi, M.; Darmous, A. Review on Partial Root-zone Drying irrigation: Impact on crop yield, soil and water pollution. Agric. Water Manag. 2022, 271, 107807. [Google Scholar] [CrossRef]
  4. Lankford, B.A.; Scott, C.A. The paracommons of competition for resource savings: Irrigation water conservation redistributes water between irrigation, nature, and society. Resour. Conserv. Recycl. 2023, 198, 107195. [Google Scholar] [CrossRef]
  5. Jha, G.; Nicolas, F.; Schmidt, R.; Suvočarev, K.; Diaz, D.; Kisekka, I.; Scow, K.; Nocco, M.A. Irrigation decision support systems (idss) for california’s water–nutrient–energy nexus. Agronomy 2022, 12, 1962. [Google Scholar] [CrossRef]
  6. Rasti, A.; Pineda, M.; Razavi, M. Assessment of soil moisture content measurement methods: Conventional laboratory oven versus halogen moisture analyzer. J. Soil Water Sci. 2020, 4, 151–160. [Google Scholar]
  7. Yaghoubi, M.; Arulrajah, A.; Horpibulsuk, S. Engineering Behaviour of a Geopolymer-stabilised High-water Content Soft Clay. Int. J. Geosynth. Ground Eng. 2022, 8, 45. [Google Scholar] [CrossRef]
  8. Costa, S.; Robert, D.; Kodikara, J. Climate change and geo-infrastructures. In Sustainable Civil Engineering Principles and Applications; CRC Press: Boca Raton, FL, USA, 2023; p. 217. [Google Scholar] [CrossRef]
  9. Barnes, E.M.; Sudduth, K.A.; Hummel, J.W.; Lesch, S.M.; Corwin, D.L.; Yang, C.; Daughtry, C.S.T.; Bausch, W.C. Remote- and Ground-Based Sensor Techniques to Map Soil Properties. Photogramm. Eng. Remote Sens. 2003, 6, 619–630. [Google Scholar] [CrossRef]
  10. Hossain, F.F.; Messenger, R.; Captain, G.L.; Ekin, S.; Jacob, J.D.; Taghvaeian, S.; O’Hara, J.F. Soil moisture monitoring through UAS-assisted internet of things LoRaWAN wireless underground sensors. IEEE Access 2022, 10, 102107–102118. [Google Scholar] [CrossRef]
  11. Glimskär, A.; Hultgren, J.; Hiron, M.; Westin, R.; Bokkers, E.A.; Keeling, L.J. Sustainable Grazing by Cattle and Sheep for Semi-Natural Grasslands in Sweden. Agronomy 2023, 13, 2469. [Google Scholar] [CrossRef]
  12. Orloff, A. Technology: Rural: Soil moisture probes—Where do you place them? Irrig. Aust. 2013, 29, 6–7. [Google Scholar]
  13. Haubrock, S.N.; Chabrillat, S.; Lemmnitz, C.; Kaufmann, H. Surface soil moisture quantification models from reflectance data under field conditions. Int. J. Remote Sens. 2008, 29, 3–29. [Google Scholar] [CrossRef]
  14. Cheng, M.; Jiao, X.; Liu, Y.; Shao, M.; Yu, X.; Bai, Y.; Wang, Z.; Wang, S.; Tuohuti, N.; Liu, S. Estimation of soil moisture content under high maize canopy coverage from UAV multimodal data and machine learning. Agric. Water Manag. 2022, 264, 107530. [Google Scholar] [CrossRef]
  15. Meng, F.; Luo, M.; Sa, C.; Wang, M.; Bao, Y. Quantitative assessment of the effects of climate, vegetation, soil and groundwater on soil moisture spatiotemporal variability in the Mongolian Plateau. Sci. Total Environ. 2022, 809, 152198. [Google Scholar] [CrossRef] [PubMed]
  16. Bablet, A.; Vu, P.; Jacquemoud, S.; Viallefont-Robinet, F.; Fabre, S.; Briottet, X.; Sadeghi, M.; Whiting, M.L.; Baret, F.; Tian, J. MARMIT: A multilayer radiative transfer model of soil reflectance to estimate surface soil moisture content in the solar domain (400–2500 nm). Remote Sens. Environ. 2018, 217, 1–17. [Google Scholar] [CrossRef]
  17. Papa, F.; Crétaux, J.-F.; Grippa, M.; Robert, E.; Trigg, M.; Tshimanga, R.M.; Kitambo, B.; Paris, A.; Carr, A.; Fleischmann, A.S. Water resources in Africa under global change: Monitoring surface waters from space. Surv. Geophys. 2023, 44, 43–93. [Google Scholar] [CrossRef] [PubMed]
  18. Morris, R. Spectrophotometry. Curr. Protoc. Essent. Lab. Tech. 2015, 11. [Google Scholar] [CrossRef]
  19. Dadi, M.; Yasir, M. Spectroscopy and Spectrophotometry: Principles and Applications for Colorimetric and Related Other Analysis. In Colorimetry; IntechOpen: London, UK, 2022; p. 81. [Google Scholar] [CrossRef]
  20. Tripathi, A.; Tiwari, R.K.; Tiwari, S.P. A deep learning multi-layer perceptron and remote sensing approach for soil health based crop yield estimation. Int. J. Appl. Earth Obs. Geoinf. 2022, 113, 102959. [Google Scholar] [CrossRef]
  21. Nocita, M.; Stevens, A.; Noon, C.; van Wesemael, B. Prediction of soil organic carbon for different levels of soil moisture using Vis-NIR spectroscopy. Geoderma 2013, 199, 37–42. [Google Scholar] [CrossRef]
  22. Seidel, M.; Vohland, M.; Greenberg, I.; Ludwig, B.; Ortner, M.; Thiele-Bruhn, S.; Hutengs, C. Soil moisture effects on predictive VNIR and MIR modeling of soil organic carbon and clay content. Geoderma 2022, 427, 116103. [Google Scholar] [CrossRef]
  23. Yu, W.; Hong, Y.; Chen, S.; Chen, Y.; Zhou, L. Comparing Two Different Development Methods of External Parameter Orthogonalization for Estimating Organic Carbon from Field-Moist Intact Soils by Reflectance Spectroscopy. Remote Sens. 2022, 14, 1303. [Google Scholar] [CrossRef]
  24. Sun, H.; Gao, J. A pixel-wise calculation of soil evaporative efficiency with thermal/optical remote sensing and meteorological reanalysis data for downscaling microwave soil moisture. Agric. Water Manag. 2023, 276, 108063. [Google Scholar] [CrossRef]
  25. Salvatore, M.R.; Barrett, J.E.; Fackrell, L.E.; Sokol, E.R.; Levy, J.S.; Kuentz, L.C.; Gooseff, M.N.; Adams, B.J.; Power, S.N.; Knightly, J.P. The Distribution of Surface Soil Moisture over Space and Time in Eastern Taylor Valley, Antarctica. Remote Sens. 2023, 15, 3170. [Google Scholar] [CrossRef]
  26. Weidong, L.; Baret, F.; Xingfa, G.; Qingxi, T.; Lanfen, Z.; Bing, Z. Relating soil surface moisture to reflectance. Remote Sens. Environ. 2002, 81, 238–246. [Google Scholar] [CrossRef]
  27. Yue, J.; Tian, J.; Tian, Q.; Xu, K.; Xu, N. Development of soil moisture indices from differences in water absorption between shortwave-infrared bands. ISPRS J. Photogramm. Remote Sens. 2019, 154, 216–230. [Google Scholar] [CrossRef]
  28. Lobell, D.B.; Asner, G.P. Moisture effects on soil reflectance. Soil Sci. Soc. Am. J. 2002, 66, 722–727. [Google Scholar] [CrossRef]
  29. Stevens, A.; Nocita, M.; Tóth, G.; Montanarella, L.; van Wesemael, B. Prediction of Soil Organic Carbon at the European Scale by Visible and Near InfraRed Reflectance Spectroscopy. PLoS ONE 2013, 8, e66409. [Google Scholar] [CrossRef]
  30. Hong, Y.S.; Yu, L.; Chen, Y.Y.; Liu, Y.F.; Liu, Y.L.; Liu, Y.; Cheng, H. Prediction of Soil Organic Matter by VIS-NIR Spectroscopy Using Normalized Soil Moisture Index as a Proxy of Soil Moisture. Remote Sens. 2018, 10, 28. [Google Scholar] [CrossRef]
  31. Mohamed, E.; Saleh, A.; Belal, A.; Gad, A.A. Application of near-infrared reflectance for quantitative assessment of soil properties. Egypt. J. Remote Sens. Space Sci. 2018, 21, 1–14. [Google Scholar] [CrossRef]
  32. Fabre, S.; Briottet, X.; Lesaignoux, A. Estimation of soil moisture content from the spectral reflectance of bare soils in the 0.4–2.5 µm domain. Sensors 2015, 15, 3262–3281. [Google Scholar] [CrossRef]
  33. Jiang, Q.; Chen, Y.; Guo, L.; Fei, T.; Qi, K. Estimating soil organic carbon of cropland soil at different levels of soil moisture using VIS-NIR spectroscopy. Remote Sens. 2016, 8, 755. [Google Scholar] [CrossRef]
  34. Bowers, S.A.; Hanks, R.J. Reflection of Radiant Energy from Soils. Soil Sci. 1965, 100, 130–138. [Google Scholar] [CrossRef]
  35. Angelopoulou, T.; Tziolas, N.; Balafoutis, A.; Zalidis, G.; Bochtis, D. Remote Sensing Techniques for Soil Organic Carbon Estimation: A Review. Remote Sens. 2019, 11, 676. [Google Scholar] [CrossRef]
  36. Wu, C.-Y.; Jacobson, A.R.; Laba, M.; Baveye, P.C. Alleviating moisture content effects on the visible near-infrared diffuse-reflectance sensing of soils. Soil Sci. 2009, 174, 456–465. [Google Scholar] [CrossRef]
  37. Nduwamungu, C.; Ziadi, N.; Tremblay, G.F.; Parent, L.-É. Near-infrared reflectance spectroscopy prediction of soil properties: Effects of sample cups and preparation. Soil Sci. Soc. Am. J. 2009, 73, 1896–1903. [Google Scholar] [CrossRef]
  38. Zhang, T.; Li, L.; Zheng, B. Partial least squares modeling of Hyperion image spectra for mapping agricultural soil properties. In Remote Sensing and Modeling of Ecosystems for Sustainability VI; International Society for Optics and Photonics: Bellingham, WA, USA, 2009. [Google Scholar]
  39. Wang, S.; Guan, K.Y.; Zhang, C.H.; Lee, D.; Margenot, A.J.; Ge, Y.F.; Peng, J.; Zhou, W.; Zhou, Q.; Huang, Y.Z. Using soil library hyperspectral reflectance and machine learning to predict soil organic carbon: Assessing potential of airborne and spaceborne optical soil sensing. Remote Sens. Environ. 2022, 271, 112914. [Google Scholar] [CrossRef]
  40. Whiting, M.L.; Li, L.; Ustin, S.L. Predicting water content using Gaussian model on soil spectra. Remote Sens. Environ. 2004, 89, 535–552. [Google Scholar] [CrossRef]
  41. Viscarra Rossel, R.A.; Behrens, T.; Ben-Dor, E.; Brown, D.J.; Dematte, J.A.M.; Shepherd, K.D.; Shi, Z.; Stenberg, B.; Stevens, A.; Adamchuk, V.; et al. A global spectral library to characterise the world’s soil. Earth-Sci. Rev. 2016, 1, 198–230. [Google Scholar] [CrossRef]
  42. Zhang, Z.; Ding, J.; Wang, J.; Ge, X. Prediction of soil organic matter in northwestern China using fractional-order derivative spectroscopy and modified normalized difference indices. Catena 2020, 185, 104257. [Google Scholar] [CrossRef]
  43. Minasny, B.; McBratney, A.B.; Bellon-Maurel, V.; Roger, J.-M.; Gobrecht, A.; Ferrand, L.; Joalland, S. Removing the effect of soil moisture from NIR diffuse reflectance spectra for the prediction of soil organic carbon. Geoderma 2011, 167, 118–124. [Google Scholar] [CrossRef]
  44. Roudier, P.; Hedley, C.; Lobsey, C.; Rossel, R.V.; Leroux, C. Evaluation of two methods to eliminate the effect of water from soil vis–NIR spectra for predictions of organic carbon. Geoderma 2017, 296, 98–107. [Google Scholar] [CrossRef]
  45. Mouazen, A.; De Baerdemaeker, J.; Ramon, H. Effect of wavelength range on the measurement accuracy of some selected soil constituents using visual-near infrared spectroscopy. J. Near Infrared Spectrosc. 2006, 14, 189–199. [Google Scholar] [CrossRef]
  46. Ishida, T.; Ando, H.; Fukuhara, M. Estimation of complex refractive index of soil particles and its dependence on soil chemical properties. Remote Sens. Environ. 1991, 38, 173–182. [Google Scholar] [CrossRef]
  47. Ben-Dor, E. Quantitative Remote Sensing of Soil Properties. Adv. Agron. 2002, 75, 173–243. [Google Scholar]
  48. Člupek, M.; Matějka, P.; Volka, K. Noise reduction in Raman spectra: Finite impulse response filtration versus Savitzky–Golay smoothing. J. Raman Spectrosc. 2007, 38, 1174–1179. [Google Scholar] [CrossRef]
  49. Li, Y.; Liu, S.; Liao, Z.; He, C. Comparison of two methods for estimation of soil water content from measured reflectance. Can. J. Soil Sci. 2012, 92, 845–857. [Google Scholar] [CrossRef]
  50. Liu, H.J.; Zhang, Y.Z.; Zhang, X.L.; Zhang, B.; Kai Shan, S.; Zong Ming, W.; Na, T. Quantitative analysis of moisture effect on black soil reflectance. Pedosphere 2009, 19, 532–540. [Google Scholar] [CrossRef]
  51. Condit, H. Application of characteristic vector analysis to the spectral energy distribution of daylight and the spectral reflectance of American soils. Appl. Opt. 1972, 11, 74–86. [Google Scholar] [CrossRef] [PubMed]
  52. Stenberg, B.; Viscarra Rossel, R.A.; Mouazen, A.M.; Wetterlind, J. Visible and Near Infrared Spectroscopy in Soil Science. In Advances in Agronomy; Elsevier: Amsterdam, The Netherlands; Academic Press: Cambridge, MA, USA, 2010; Volume 107, pp. 163–215. [Google Scholar]
  53. Philpot, W. Spectral Reflectance of Wetted Soils. In Proceedings of the Art, Science and Applications of Reflectance Spectroscopy (ASARS), Boulder, CO, USA, 23–25 February 2010; pp. 1–12. [Google Scholar]
  54. Demattê, J.A.; Campos, R.C.; Alves, M.C.; Fiorio, P.R.; Nanni, M.R. Visible–NIR reflectance: A new approach on soil evaluation. Geoderma 2004, 121, 95–112. [Google Scholar] [CrossRef]
  55. Liu, W.; Baret, F.; Gu, X.; Zhang, B.; Tong, Q.; Zheng, L. Evaluation of methods for soil surface moisture estimation from reflectance data. Int. J. Remote Sens. 2003, 24, 2069–2083. [Google Scholar] [CrossRef]
  56. Bogrekci, I.; Lee, W. Effects of soil moisture content on absorbance spectra of sandy soils in sensing phosphorus concentrations using UV-VIS-NIR spectroscopy. Trans. Am. Soc. Agric. Biol. Eng. 2006, 49, 1175–1180. [Google Scholar] [CrossRef]
  57. Tan, Y.; Jiang, Q.G.; Yu, L.F.; Liu, H.X.; Zhang, B. Reducing the Moisture Effect and Improving the Prediction of Soil Organic Matter With VIS-NIR Spectroscopy in Black Soil Area. IEEE Access 2021, 9, 5895–5905. [Google Scholar] [CrossRef]
  58. Campbell, P.K.E.; Middleton, E.M.; Thome, K.J.; Kokaly, R.F.; Huemmrich, K.F.; Lagomasino, D.; Novick, K.A.; Brunsell, N.A. EO-1 hyperion reflectance time series at calibration and validation sites: Stability and sensitivity to seasonal dynamics. IEEE J. Sel. Top. Appl. Earth Obs. Remote Sens. 2013, 6, 276–290. [Google Scholar] [CrossRef]
  59. Dotto, A.C.; Dalmolin, R.S.D.; ten Caten, A.; Grunwald, S. A systematic study on the application of scatter-corrective and spectral-derivative preprocessing for multivariate prediction of soil organic carbon by Vis-NIR spectra. Geoderma 2018, 314, 262–274. [Google Scholar] [CrossRef]
  60. Demattê, J.A.; da Silva Terra, F. Spectral pedology: A new perspective on evaluation of soils along pedogenetic alterations. Geoderma 2014, 217, 190–200. [Google Scholar] [CrossRef]
  61. Ben-Dor, E.; Banin, A. Near-infrared analysis as a rapid method to simultaneously evaluate several soil properties. Soil Sci. Soc. Am. J. 1995, 59, 364–372. [Google Scholar] [CrossRef]
  62. Soriano-Disla, J.M.; Janik, L.J.; Viscarra Rossel, R.A.; Macdonald, L.M.; McLaughlin, M.J. The Performance of Visible, Near-, and Mid-Infrared Reflectance Spectroscopy for Prediction of Soil Physical, Chemical, and Biological Properties. Appl. Spectrosc. Rev. 2014, 49, 139–186. [Google Scholar] [CrossRef]
  63. Wang, J.; Tiyip, T.; Ding, J.; Zhang, D.; Liu, W.; Wang, F.; Tashpolat, N. Desert soil clay content estimation using reflectance spectroscopy preprocessed by fractional derivative. PLoS ONE 2017, 12, e0184836. [Google Scholar] [CrossRef] [PubMed]
  64. Ding, J.; Yang, A.; Wang, J.; Sagan, V.; Yu, D. Machine-learning-based quantitative estimation of soil organic carbon content by VIS/NIR spectroscopy. PeerJ 2018, 6, e5714. [Google Scholar] [CrossRef] [PubMed]
  65. McGuirk, S.; Cairns, I. Soil Moisture Remote Sensing with Multispectral and Visible NIR Remote Sensing. ISPRS Ann. Photogramm. Remote Sens. Spat. Inf. Sci. 2022, 3, 447–453. [Google Scholar] [CrossRef]
  66. Chen, F.; Lasaponara, R.; Masini, N. An overview of satellite synthetic aperture radar remote sensing in archaeology: From site detection to monitoring. J. Cult. Herit. 2017, 23, 5–11. [Google Scholar] [CrossRef]
  67. Merzouki, A.; McNairn, H.; Powers, J.; Friesen, M. Synthetic aperture radar (SAR) compact polarimetry for soil moisture retrieval. Remote Sens. 2019, 11, 2227. [Google Scholar] [CrossRef]
  68. Munda, M.K.; Parida, B.R. Soil moisture modeling over agricultural fields using C-band synthetic aperture radar and modified Dubois model. Appl. Geomat. 2023, 15, 97–108. [Google Scholar] [CrossRef]
  69. Office of Environment and Heritage. Soil Survey Standard Test Method—Soil Moisture Content; Office of Environment and Heritage: Broken Hill, Australia, 1990. [Google Scholar]
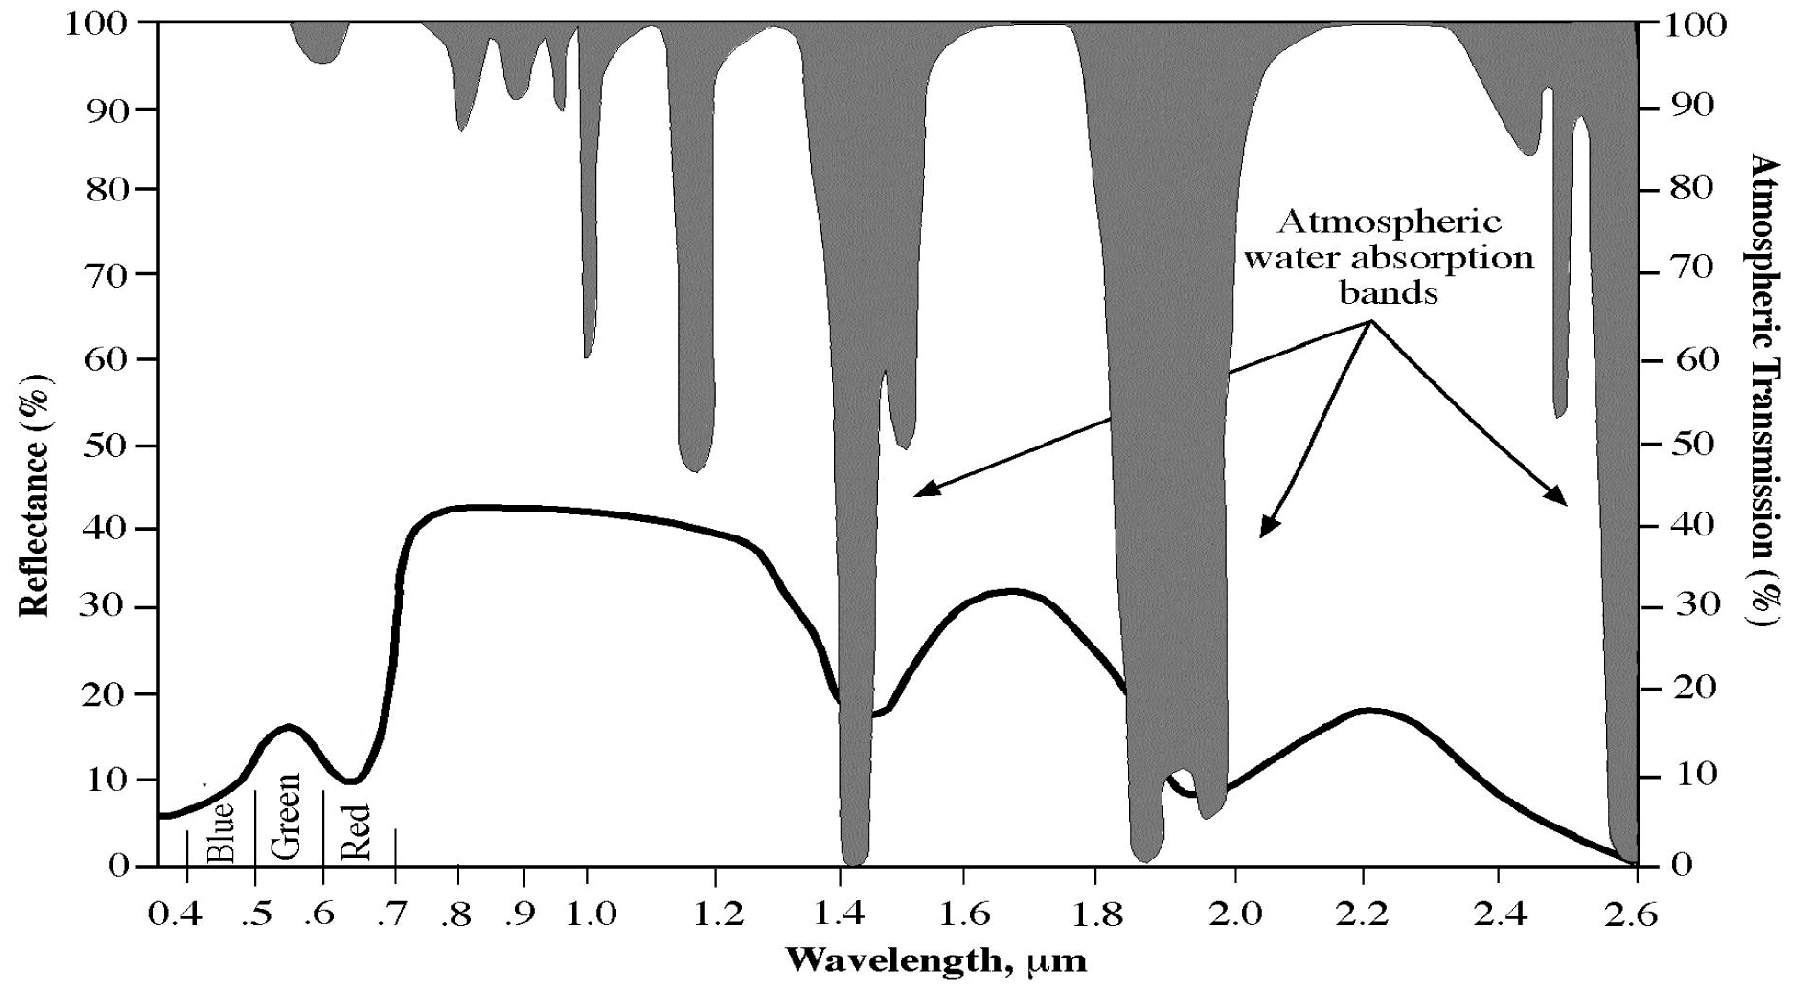
Figure 1. The vibration of O–H bonds in water molecules causes strong absorption features around 1400 and 1900 nm (grey shading) due to atmospheric absorption. These strong bands are often avoided in remote sensing sensors and data products [13]. The black line curve indicates a typical soil spectrum. Figure from Mohamed, Saleh [31].
Geotechnics 04 00005 g001
Figure 2. Increased concentrations of (a) soil moisture and (b) soil organic carbon have similar effects on visible and NIR soil reflectance, making the cause of the change difficult to identify. Reproduced from Jiang, Chen [33].
Geotechnics 04 00005 g002
Figure 3. Moist soil reflectance curves (a) Philpot [53], (b) Fabre, Briottet [32], (c) Jiang, Chen [33], (d) Yu, Hong [23] and (e) Whiting, Li [40] are typically convex in shape, with absorption features apparent around 1400, 1900 and 2100 nm.
Geotechnics 04 00005 g003
Figure 7. The vertices (minima) of absorption features (marked with blue arrows) near 1400 nm and 1900 nm in averaged spectra from all ten soil samples progressively drift to higher wavelengths (x-axis) as soil MC increases. Meanwhile, the vertex of the absorption feature around 2200 nm remains consistently positioned around 2200 nm.
Geotechnics 04 00005 g007
Figure 8. Between 5–25% MC, the difference in reflectance of sample ISS20 (Appendix A), at a given MC versus 0% MC decreases monotonically at all wavelengths as soil MC increases.
Geotechnics 04 00005 g008
Figure 9. (a) The average standard deviation (%) for all soil samples from five soil reflectance measurements as a function of wavelength for different MCs (graded colour). (b) The standard deviation of reflectance measurements as a function of reflectance, colour-coded as a scatterplot.
Geotechnics 04 00005 g009
Figure 10. Standard lab sample preparation procedures change soil reflectance, (a) from Haubrock, Chabrillat [13] and (b) from Yu, Hong [23].
Geotechnics 04 00005 g010
Figure 11. (a) The inverse exponential relationship between soil moisture and soil reflectance at 600, 700, 800, 900 and 1000 nm presented by Bowers and Hanks [34] is approximately replicated with data from Muttama soil samples with fits shown by dashed curves at MCs of 5 to 25% for samples (b) ISS20 and (c) ISS11. However, (d) sample ISS26 demonstrates an exponential relationship with the opposite curvature.
Geotechnics 04 00005 g011
Figure 12. When the domain of the data is reduced to an appropriate range, linear models (a) can be well-fit to the relationship between soil MC and reflectance averaged across all samples at specific wavelengths in the range of 600–1000 nm. Shading indicates the standard deviation of five measurements. (b) The R-squared (R2) and standard error (SE) for each model are also shown.
Geotechnics 04 00005 g012
Figure 13. (a) The average reflectance (400–2500 nm) of all samples (blue dots) and average standard deviation (SD) (blue shading) of five reflectance measurements are shown. (b) The data are limited to the range of 5–25% MC to demonstrate a linear model fit for this domain.
Geotechnics 04 00005 g013
Figure 14. (a) The average visible–NIR soil reflectance of each of the ten Muttama samples generally decreases in a linear fashion as soil MC increases up to ~22–30% MC. (b) For silty loam (ZL) and sandy clay loam (SCL) soils, the linear relationship begins at 5% MC, while the linear relationship begins at 0% MC for loam (L) and clay loam (CL) soils.
Geotechnics 04 00005 g014
Figure 15. When soil reflectance data from the Muttama samples are averaged over the (a,b) Landsat-5, (c,d) Landsat-7 and (e,f) Landsat-9 bands, a strong linear relationship is apparent for the domain of 5–25% MC in all cases [65].
Geotechnics 04 00005 g015
Figure 16. (a) The sample-averaged reflectance as a function of soil MC versus wavelength for 1200–1600 nm, (b) linear fit to averaged soil MC and the normalised difference in reflectance at 1350 and 1444 nm for the domain of 0–55% MC, (c) linear fit for MCs in the range of 0–35%, (d) no fit for the domain of 0–55% MC for visualisation, (e) exponential fit for the domain of 0–35% MC.
Geotechnics 04 00005 g016
Figure 17. The normalised difference between the sample-averaged reflectance at (a) 1413 and 1444 nm is fitted with an exponential function for the domains of (b) 0–55% MC and (c) 0–35% MC.
Geotechnics 04 00005 g017
Figure 18. (a) Sample-averaged reflectance spectra for 1800–2100 nm as a function of MC, soil MC compared to (b) the absolute difference in reflectance between 1920 and 1860 nm, and (c) the normalised difference between the reflectances at 1920 nm and 1860 nm for the domain of 5–25% MC, and (d) same as (c) but for the domain of 0–55% MC.
Geotechnics 04 00005 g018
Figure 19. (a) Sample-averaged reflectances at 2140 nm and 2207 nm as a function of MC, with linear functions fitted to the normalised differences in reflectance at 2140 nm and 2240 nm as the MC varies, for the domains of (b) 0–55% MC and (c) 5–25% MC.
Geotechnics 04 00005 g019
Figure 20. The sum of averaged reflectance at 1413 and 1444 nm (a) is fitted with (b) linear and (c,d) exponential models for the domains of 0–55%, 5–25%, 0–55% and 5–25% MC, respectively.
Geotechnics 04 00005 g020
Figure 21. The sum of sample-averaged reflectances at 1350 and 1444 nm is fitted well with a linear model in the domains (a) 0–55% MC and (b) 10–45%. The latter has an improved performance.
Geotechnics 04 00005 g021
Figure 22. (a) The relationship between soil MC and the sum of sample-averaged reflectances at 1860 nm and 1920 nm (b) is linear for the domain of 0–25% MC when absolute values are utilised, but (c) exponential when the data are normalised.
Geotechnics 04 00005 g022
Figure 23. (a) The vertex of the parabolic absorption feature around 1920 nm drifts to higher wavelengths as soil MC increases, as quantified in (b).
Geotechnics 04 00005 g023
Figure 24. (a) From Hong, Yu [30]. A 2D correlogram shows the R2 between the NSMI indices returned for each wavelength combination and soil MC for 640 samples. (b) A regression analysis (blue line) demonstrates a strong correlation (R2 = 0.9194) between the (NSMI) predicted and actual soil MC at the wavelengths 1360 and 1940 nm.
Geotechnics 04 00005 g024
Figure 25. The NSMI is applied to the new data at (a) 1360 nm and 1940 nm, and (b) 1800 nm and 2119 nm, with the green dashed 1:1 line demonstrating the expected relationship and blue dashed line demonstrating the actual relationship.
Geotechnics 04 00005 g025
Table 1. Landsat-5, -7 and -9 visible and NIR bands utilised for analyses (USGS, 2017).
LandsatBand 1Band 2Band 3Band 4Band 5Band 6Band 7Equation No.
5 (TM)450–520520–600630–690760–9001550–1750NANA(3)
7 (ETM+)450–520520–600630–690770–9001550–1750NANA(4)
9450–520520–600630–690770–9001550–17501570–16502110–2290(5)
Disclaimer/Publisher’s Note: The statements, opinions and data contained in all publications are solely those of the individual author(s) and contributor(s) and not of MDPI and/or the editor(s). MDPI and/or the editor(s) disclaim responsibility for any injury to people or property resulting from any ideas, methods, instructions or products referred to in the content.