Article

Static and Dynamic Cone Penetrometer Tests for Babolsar Sand Parameters via Physical Modeling

by
Abolfazl Eslami
1,
Masoud Nobahar
2,* and
Mohammad Esmailzade
1
1
Department of Civil and Environmental Engineering, Amirkabir University of Technology, Tehran 15916, Iran
2
Louisiana Transportation Research Center, Louisiana State University, Baton Rouge, LA 70808, USA
*
Author to whom correspondence should be addressed.
Geotechnics 2024, 4(3), 966-984; https://doi.org/10.3390/geotechnics4030049
Submission received: 12 August 2024 / Revised: 5 September 2024 / Accepted: 12 September 2024 / Published: 22 September 2024

Abstract

:
Field tests are the most suitable method to determine geotechnical parameters. Owing to some restrictions in field tests, physical modeling has been widely accepted as a proper method to define mathematical correlations among geotechnical parameters. This study investigates correlations between parameters derived from cone penetrometer tests. The tests were performed in a cylindrical chamber with a height and diameter of 1000 mm to minimize the boundary effect. Coastal poorly graded sand sampled from the Babolsar region, adjacent to the Caspian Sea, was used. Some correlations among geotechnical parameters, including cone resistance, dynamic cone resistance, dynamic penetration index, modulus of elasticity, internal friction angle, and relative density, are presented. All correlations were categorized into three main categories: soil stiffness, penetration strength, and geotechnical parameters. The results had reasonable accuracy and precision. The average R2 value of the obtained results was approximately 94. The investigations into the inherent CPT also indicated that the strength parameter had more accuracy than stiffness and other sand parameters. Specifically, the R2 value for the correlation between the results of various penetration tests, considered strength parameters, averaged 97. In contrast, the R2 value for the correlation between the elasticity modulus and cone penetration test results was 86.

Graphical Abstract

1. Introduction

Soil investigations [1] are of great importance in geotechnical analysis and design. Also, the accuracy of soil characteristics has a profound effect on structural design and the prediction of a structure’s lifetime [2,3]. There are a lot of methods for determining soil characteristics, which are generally divided into three main categories. These include laboratory tests, in situ tests, and geophysical tests [4].
In situ tests provide more accurate data in comparison with the other two methods, and this is due to the evaluation of intact soil [5,6]. In other words, soil disturbance and the evaluation of limited amounts of soil samples are crucial problems in laboratory tests, and these problems have a significant effect on investigations regarding sandy soils. One of the best in situ tests is the cone penetrometer test conducted using two types of static and dynamic methods [4,7].
CPT is one of the best methods for evaluating the mechanical parameters of sandy soils [8,9,10,11]. It also has been widely used in offshore and onshore environments to characterize and investigate the behavior of soil [12,13]. There are lots of correlations between CPT results and density [14,15,16,17], elasticity module [18,19,20], friction angle [21,22,23], and other mechanical parameters of soils [24,25]. This apparatus is one of the appropriate pieces of equipment used for the estimation of soil mechanical characteristics and soil classification, using the cone resistance and the sleeve friction resistance [10,26,27]. Moreover, research has shown a direct nonlinear relationship between the normalized cone resistance and the friction angle [16]. However, the cone penetration test (CPT) device has some disadvantages, including limited availability, the need for a large space for operation, and high costs. Consequently, it is not always feasible for small projects or locations with restricted access. In such cases, simpler methods are needed to obtain the necessary parameters. One alternative is the dynamic cone penetration test (DCPT), which, due to its penetrative inherence, can somewhat replicate CPT results, particularly for shallow penetrations, making it more suitable for smaller projects.
The dynamic cone penetrometer (DCP) test is typically used to determine the California bearing ratio test (CBR) for road bases [28,29]. The DCP test can also measure the other mechanical parameters of soils, such as elastic modulus, axial compression capacity of cohesionless soils, and shear resistance [30,31]. The other advantages of this test are its small dimensions, low weight, and convenient movability. Using the results of this test, many soil strength and stiffness parameters can be accurately determined, which significantly reduces both project costs and completion time.
This research focuses on predicting the strength and stiffness parameters of sandy soils (specifically Babolsar sand) using results from cone penetration tests (CPTs), dynamic cone penetration tests (DCPs), and plate load tests. It also estimates the cone resistance from CPTs using dynamic cone penetration results. Overall, in this study, 24 physical modeling tests were conducted at four different relative densities. Laboratory tests were performed in a chamber with a diameter and height of 1000 mm to minimize boundary condition errors. To enhance sample accuracy and result repeatability, the dry deposition method was used. This study provides correlation relationships between the results of the CPT, DCPT, and PLT. Based on these test results, the strength and stiffness parameters of the sand were predicted. Finally, to validate the results, some of the findings from this research were compared with studies conducted by other researchers.

2. Materials

Babolsar sand collected from the coasts of the Caspian Sea in the north of Iran was used. Babolsar, positioned near a significant commercial port, is located at coordinates 36°42′02″ N, 52°39′00″ E, and is approximately 10 m below the free water level [32]. Regarding ASTM D6913 [33], in the unified classification method, it is classified as the SP (poorly graded soil) category. Soil sample gradation is shown in Figure 1a, and a scanning electron microscope image of sand is shown in Figure 1b. Triaxial test shear apparatus with dimensions of 7 mm produced by MTM Co. (Yangon, Myanmar) was used to measure the internal friction angle of sand, in which the friction angles were 29, 32.5, 36.5, and 41.2 degrees for loose ( D r 20 % ), medium-dense ( D r 40 % ), dense ( D r 60 % ), and very dense ( D r 85 % ) soil, respectively. Other soil parameters are also listed in Table 1.

3. Methods

3.1. Soil Preparation and 1 g Chamber

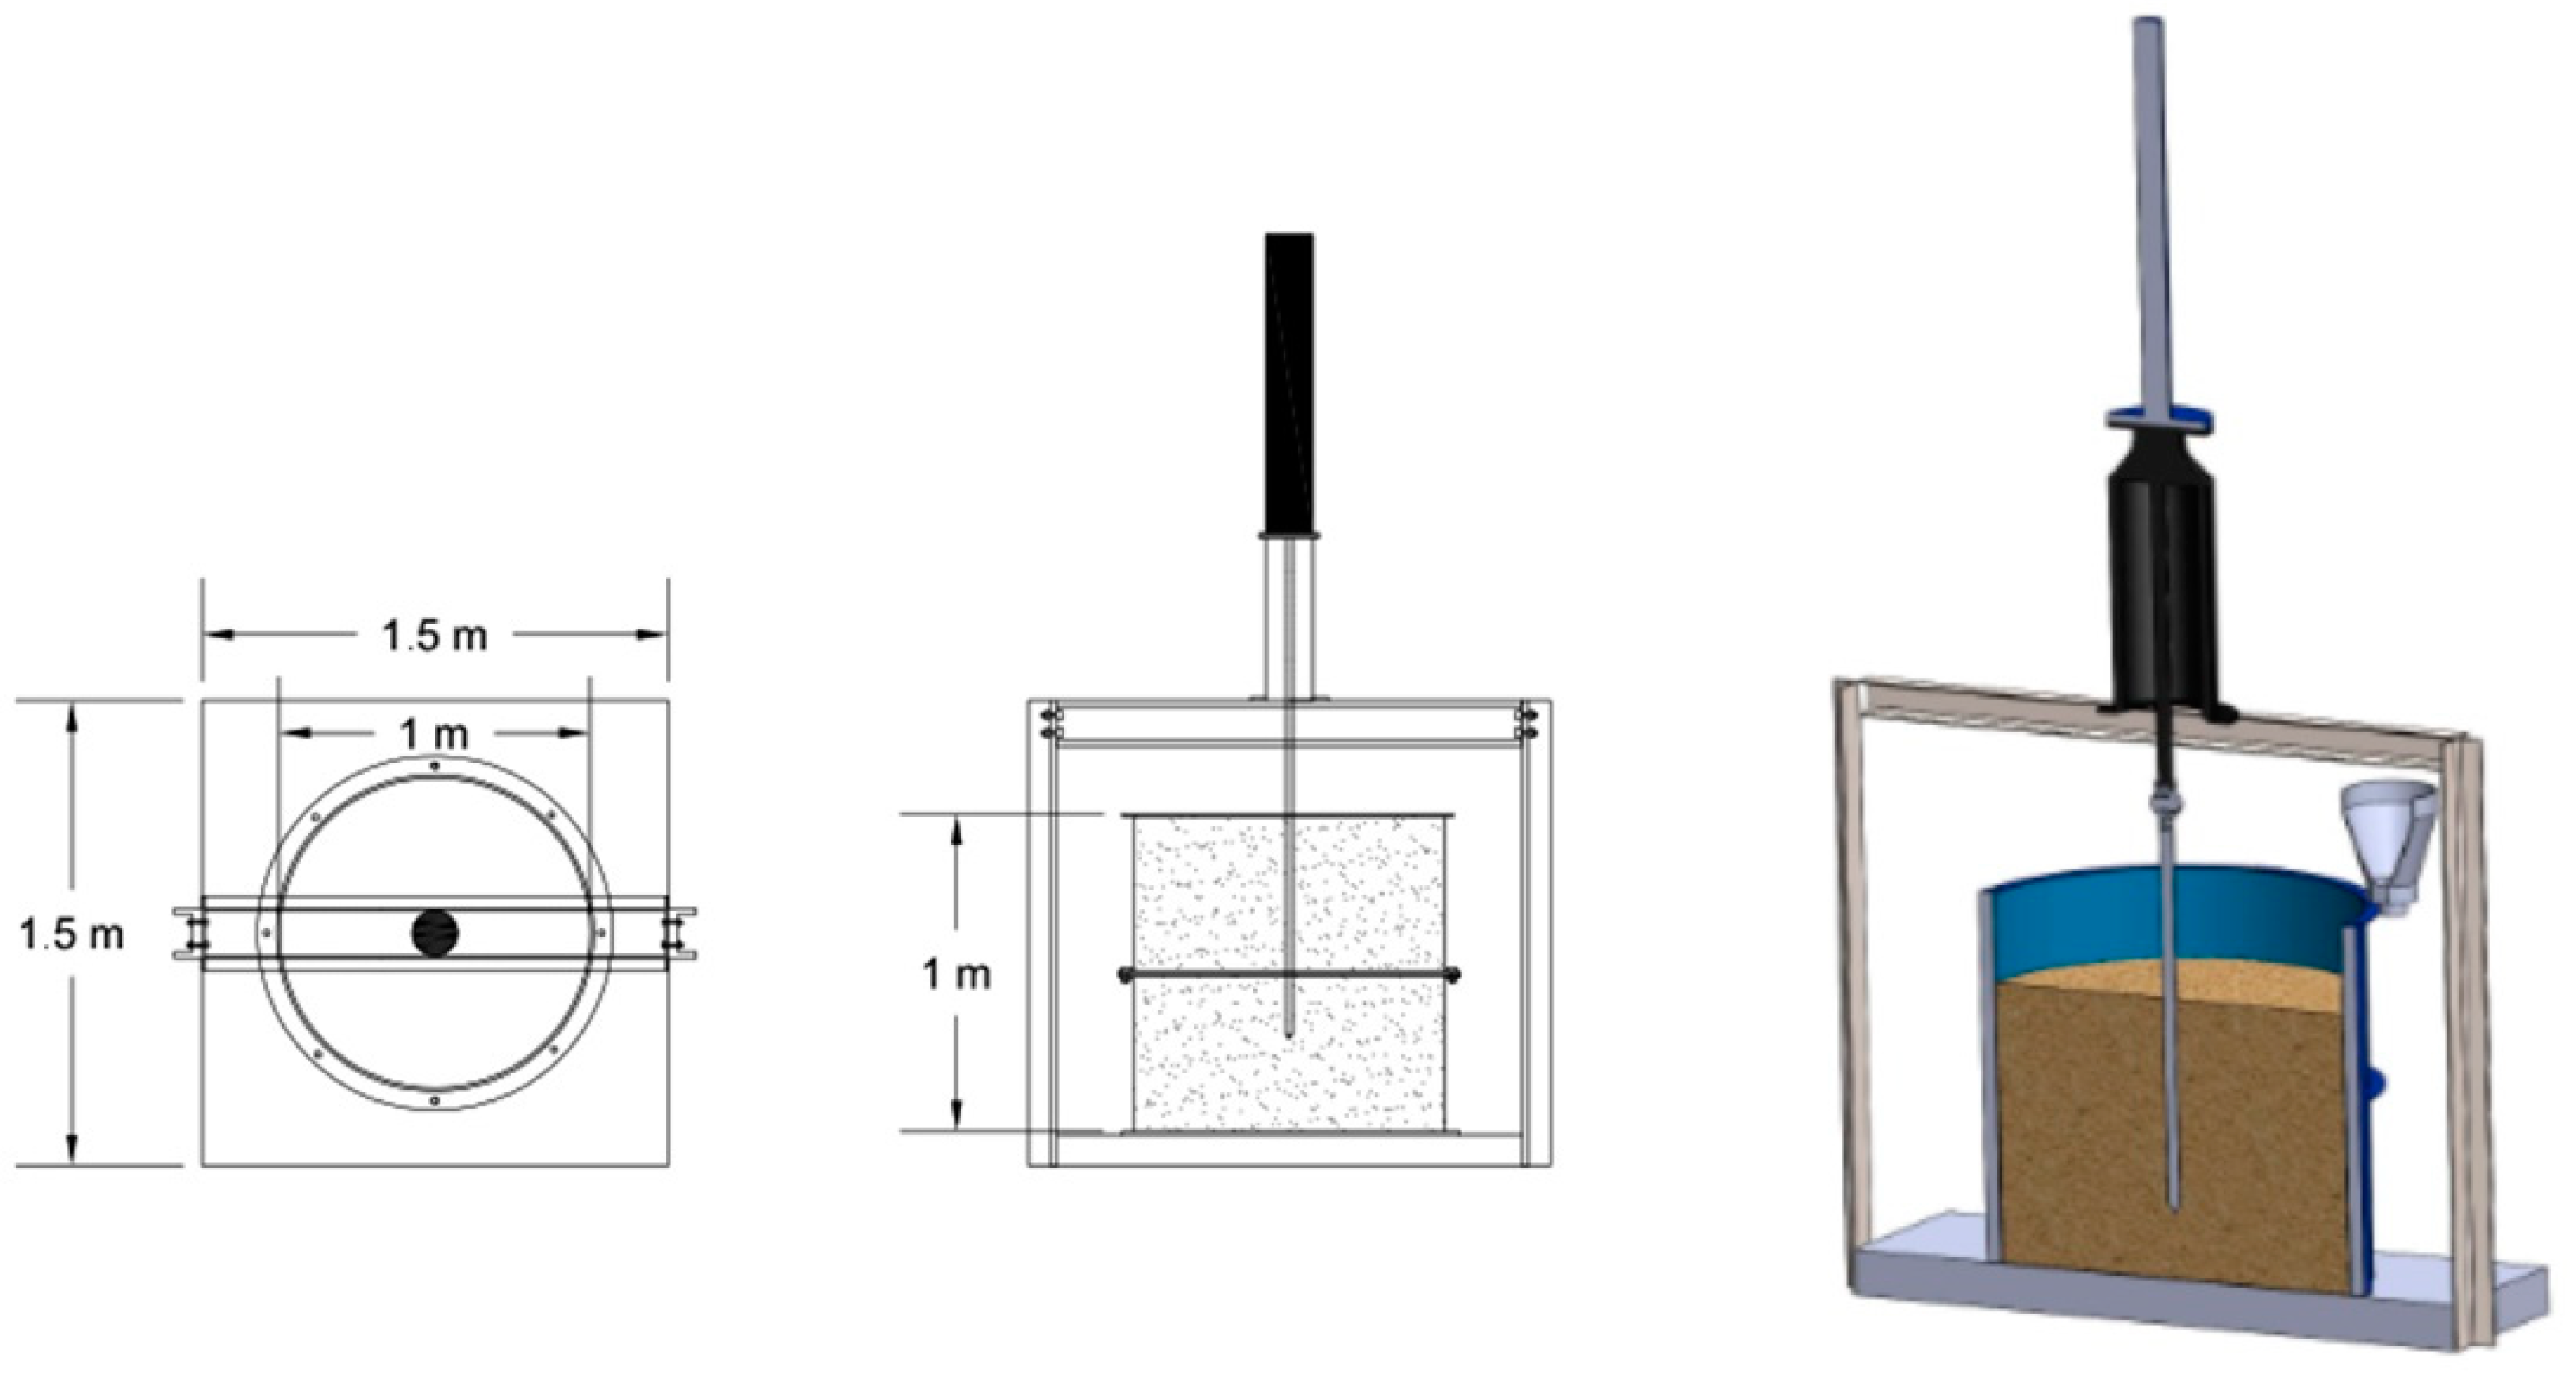
The tests were carried out in a simple chamber (1 g) with a diameter and a height of 1000 mm. It was made of steel with several stiffeners to have a rigid wall (Figure 2). Since the boundary condition is a paramount factor in the finite element and physical modeling, the diameter of the chamber was designed and built large enough to minimize the boundary condition effect [30,38]. Abu-Farsakh et al. determined that a minimum distance of 225 mm between the cone and the edge of the testing chamber is necessary to mitigate the effects of the mold’s side walls [28]. Mohammadi et al. further observed that, as the relative density (Dr) increases, the influence of the side walls becomes more pronounced. However, this effect becomes negligible in molds with a diameter exceeding 500 mm. Additionally, maintaining a 250 mm distance between the cone and the mold edge is sufficient to completely eliminate the boundary condition effect [38].
The samples were constructed using the dry sedimentation method. In this method, the sand sample retains its natural moisture and is assumed to be dry [39,40]. Thus, first, the soil weight for specific density was measured for a height of 5 cm. Next, the soil was weighed and poured into a funnel. The funnel’s tip had a fixed level from the sample surface. Then, the valve located at the funnel’s end was opened, and the soil started pouring into the chamber, as illustrated in Figure 3a. In low densities, fixing the funnel’s height/level from the sample’s surface was enough for constructing the soil sample. However, it was required to compact the soil sample in higher densities after the pouring process. The soil compaction process was performed by placing lumber 15 mm thickness on the soil sample and ramming it until the considered soil density was reached, as shown in Figure 3b. As presented in Figure 3c; to have an accurate density, it is essential to check the soil level during the compaction process. Afterward, all aforementioned steps were repeated to add new layers to the sample. The new layers were added to reach the desired height of the soil sample, which was 1000 mm.

3.2. Laboratory Investigations (CPT, DCP, and PLT)

The laboratory investigations conducted in this study were divided into two main categories, including physical modeling in a 1g chamber and small-scale soil test investigations. The executed physical modeling consisted of static CPT, dynamic CPT, and a plate load test (PLT). The element test investigations consisted of relative soil density determination tests, triaxial tests, and specific gravity of soil solids. All the tests were performed at least two times to verify the process and results.

3.2.1. Static Cone Penetration Test (CPT)

According to ASTM D5778 [41], the static cone penetrometer consisted of a cone with a cross area of 1000 mm2 (35.7 mm diameter) and a frictional part with an area of 15,000 mm2. This device penetrates soil at a constant pace of 20 mm/s, produced by a hydraulic jack with a 1000 mm stroke. Then, the cone resistance and sleeve frictional resistance are measured continuously using existing sensors at constant time intervals.
The cone, which was used in this research, was constructed based on the ASTM D5778 [41] standard and consisted of four main parts, including the friction sleeve, inner part, conical tip, and the guiding bar. The conical tip and the sleeve part are in contact with the soil; thus, they were constructed of 420 stainless steels with high abrasion resistance and high enduring ability from corrosion. The inner part was built from 7075 aluminum for its high elasticity module and low-yielding stress point. This type of aluminum characteristic makes it capable of tolerating considerable strain, and this feature increases the accuracy of sensing and measurements. The cone-bearing capacity and sleeve friction resistance were measured separately using strain gauges at two height levels. Four different strain gauges were mounted at each point to increase the accuracy of the data reading. Two vertical and two horizontal strain gauges had 180 inclinations in relevance to each other, and they were attached to the inner bar. During calibration, the sensors showed completely linear responses, with a reading sensitivity of 2 N. The penetration depth was measured with a depth gauge accurate to 0.1 mm, ensuring minimal measurement error. The strain gauges’ attachment points and the CPT schematic shape are shown in Figure 4.

3.2.2. Dynamic Cone Penetration Test (DCP)

Dynamic CPT is one of the most practical tests for road construction works and the determination of soil parameters in shallow penetration (1–2 m). Regarding the ASTM D6951 [42] standard, it consists of a cone with a 20 mm diameter with a tip angle of 60 degrees with respect to the horizon. This device penetrates the soil using an 8 kg hammer, which falls from a height of 575 mm and has 45 J theoretical driving energy. A bar with a 16 mm diameter was used to convey the whole hammer’s energy to the cone and reduce the soil-bar interaction effect in the penetration process [38].
The diameter of the chamber may cause some errors in the simulation process for a boundary condition effect; thus, a chamber with a diameter of 1000 mm was chosen to minimize the boundary condition effect as it is the best diameter for this type of sandy soil. Some researchers reported that, with an increase in the soil density ratio, there is an increase in the required diameter of the chamber for simulation [28,38]. However, 500 mm is the minimum required diameter for minimizing the boundary condition effect. In this test, the results are indicated with a factor named the dynamic penetration index (DPI), which is equal to the penetration depth per specific blow [43].
DPI = P i + 1 P i B i + 1 B i
where DPI = DCP index ( mm blow ), P = penetration at i or i + 1 hammer drops (mm), and B = blow count. The weighted averaging method, which could be considered one of the best averaging methods, was utilized to calculate the DCP results at each level and determine soil parameters. It is formulated as follows:
DPI ave = 1 H i = 1 i = n DPI i × Z i
where Z is the penetration distance per blow set and H is the overall penetration depth of interest. Furthermore, another functional method for analyzing DCP data is converting it to the dynamic tip resistance (dynamic cone resistance, q d ). The amount of cone penetration energy directly relates to the hammer ramming energy; hence, if this energy is enough, the soil will fail, and the cone will penetrate. The penetration depth for each hammer ramming is a function of soil stiffness. The hammer’s ramming energy could be calculated by knowing that the hammer’s weight and fall height are constant and determined. Therefore, the penetration depth would decrease with soil stiffness and density increment. The tip’s dynamic resistance ( q d ) in the sandy soils was a function of the test condition and apparatus geometry. The Dutch formula is commonly used for the calculation of q d [44]:
q d = 1 A × KE X × M M + P
where A = cross-sectional area of the cone, KE = imparted kinetic energy, X = incremental penetration ( mm blow ), M = mass of the hammer, and P = mass of the penetrometer.

3.2.3. Plate Load Test

The plate load test was utilized to measure the soil’s bearing capacity. The PLT results, which are helpful for shallow foundation design, represent the soil’s bearing capacity and determine its compressibility. They could also be used to evaluate flexible and rigid pavements. The direct result of this test is the load-movement curve, which is drawn from measurements of the load on a rigid plate and its movement at pre-determined levels. The base reaction coefficient and elastic modulus of soil can be derived from the load-movement curve by using the theory of elasticity [18].
One of the most important deformability parameters that is highly useful for designing shallow foundations in structures and road construction projects is the elastic modulus. It is common to derive this parameter using the plate load test results [45,46]. The elastic modulus is defined as the slope of the (initial) linear part of the vertical stress–settlement curve derived from PLT.
According to ASTM D1195 [47], the plate should behave as a rigid body, so standards recommend a minimum plate thickness of 1 inch (25.4 mm). Its diameter should also be in the range of 6 to 30 inches (152–762 mm). In this study, a steel plate with a 250 mm diameter and 24.5 mm thickness was used. The load was applied to the plate using a 150 KN hydraulic jack. The applied load and plate movement were measured with an S-shaped load cell placed under the hydraulic jack and three-micrometer gauges with 0.001 mm accuracy, respectively. The micrometer gauges were placed at a 120-degree angle with respect to one another on the plate load.

4. Results

In this section, the derived results from the abovementioned experiments are compared and evaluated. Finally, the relationship or correlations between different mechanical characteristics of Babolsar sand is presented.

4.1. Repeatability of Tests

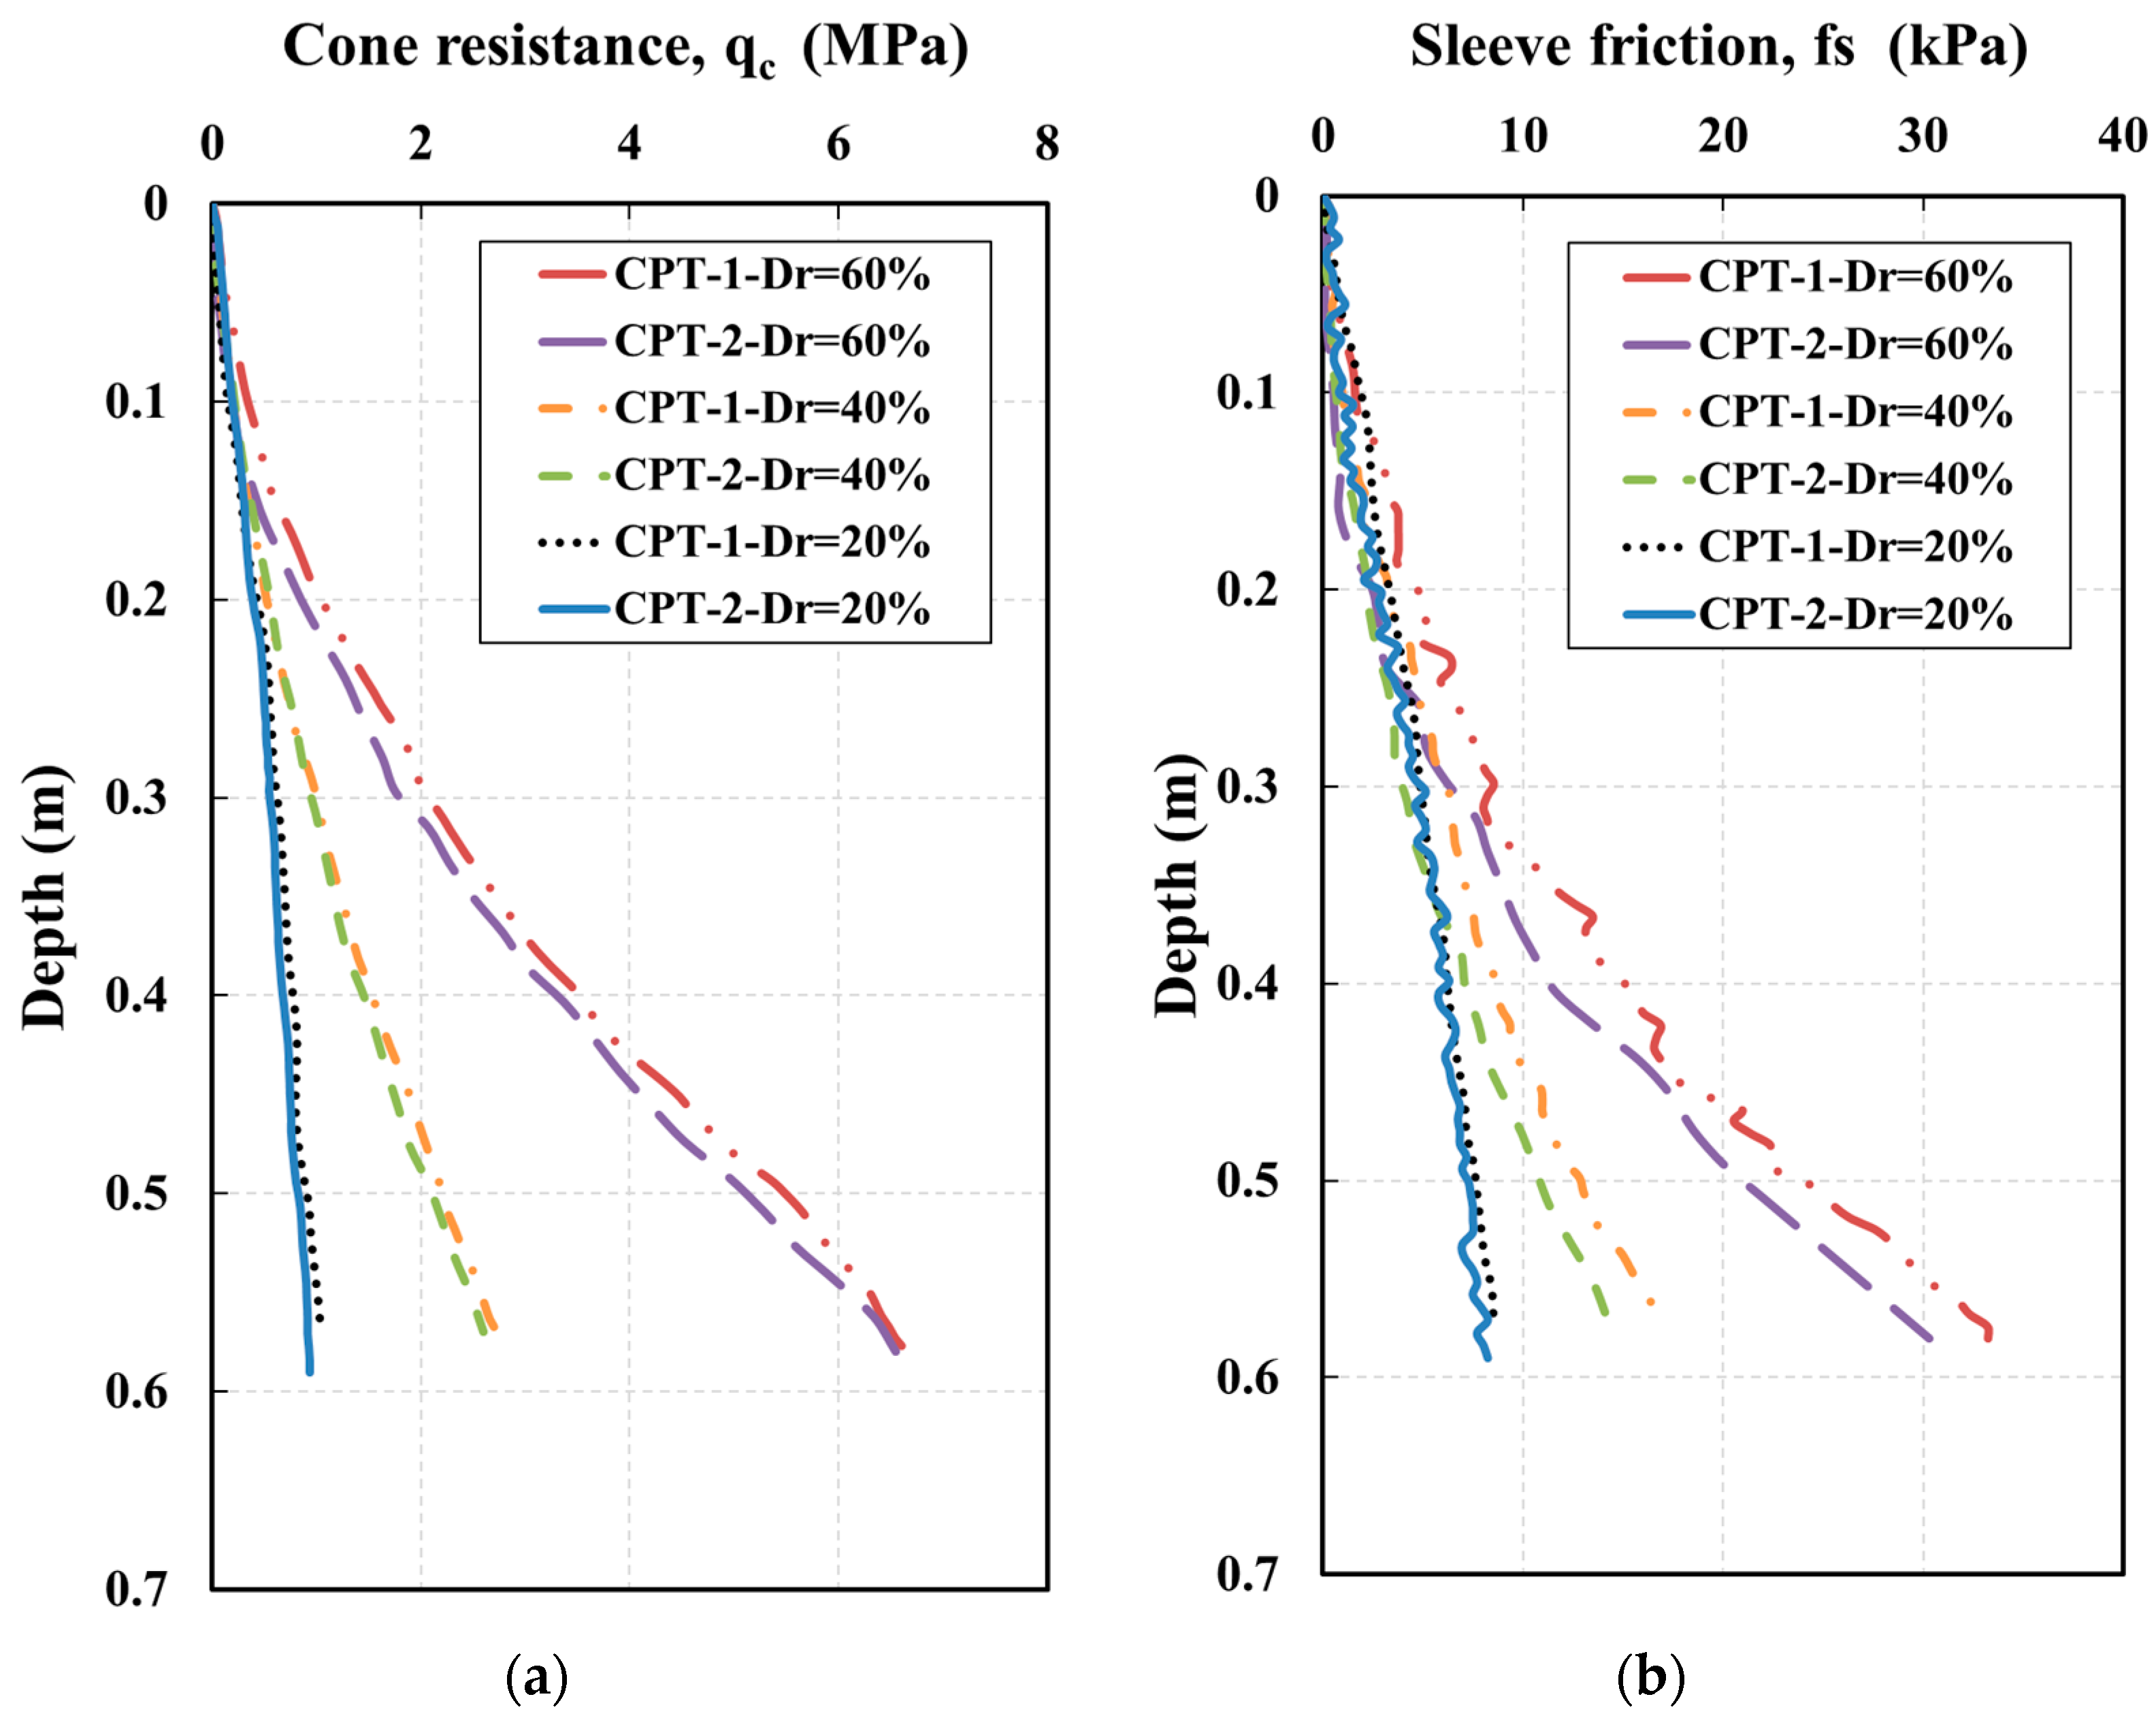
Several tests were performed to ensure the potential for repeatability and accuracy of the results. In this study, the static cone penetrometer test in different densities was performed twice, and the results were acceptable; therefore, it was considered to have high repeatability (Figure 5).

4.2. CPT Cone Resistance ( q c ) vs. DCP Cone Resistance ( q d ) and DCP Penetration Index (DPI)

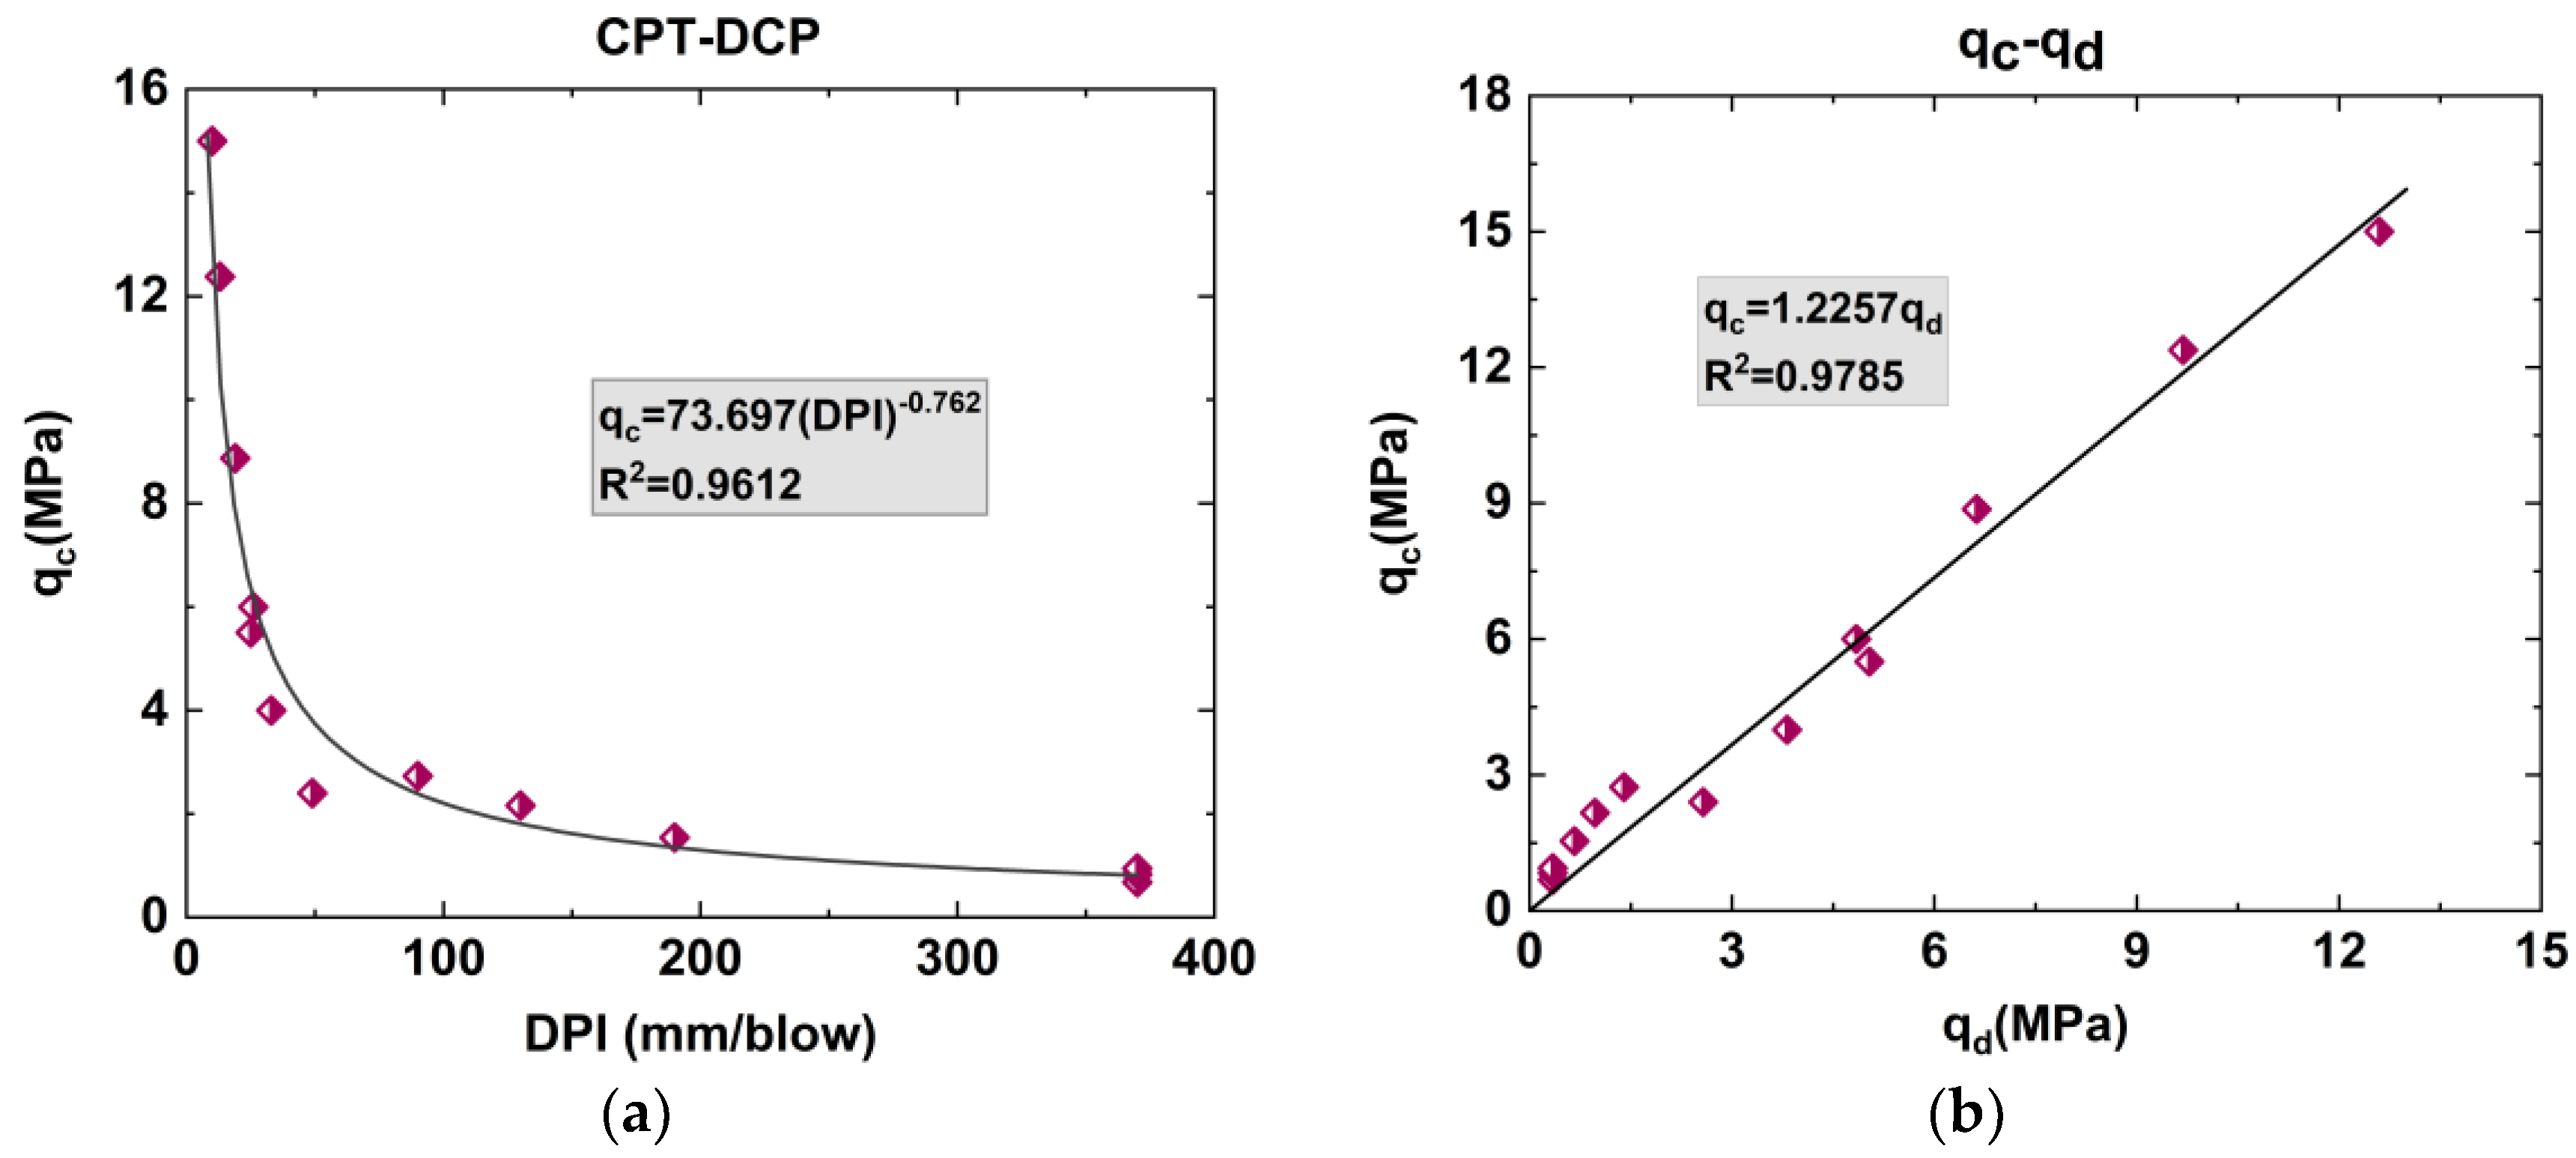
One of the best approaches for determining soil strength parameters and soil layer profiles in sandy soils is the cone penetrometer test. However, DCP is a practical choice since it can be used in less accessible areas and is inexpensive. Due to its applicability and benefits, finding correlations between CPT and DCP results has attracted researchers’ attention. These correlations may help engineers and researchers to find desired geotechnical parameters of sands and help them to better predict their behavior. There was a non-linear relationship between these two parameters, and the value of qc decreases with an increase in DPI. High DPI values in low-density sands are expected because, at low relative densities, the larger voids between particles reduce their interaction, leading to lower sand resistance to penetration. This leads to lower sand resistance against penetration, causing a greater penetration depth with each strike of DCP. On the other hand, in high-density soils, a significant change in soil density is not expected upon the initial strike of DCP. Thus, low DPI values could be justified in dense soils, i.e., the q c -DPI correlation could be defined as a typical reciprocal function (Figure 6a).
Da Fonseca introduced the Ke factor value as a ratio of q c to q d [45]:
K e = q c q d
The K e values proposed by different researchers are listed in Table 2:
Table 2. Summary of correlation between qd and qc in earlier studies.
Reference K e
Da Fonseca [48]1
Dos Santos and Bicalho [49]1.3–2.5
Rios et al. [50]0.87–1.85
Kodicherla and Nandyala [51]1.12
q c = 73.70 × DPI 0.762
q c = 1.225 × q d
As shown in Figure 6, the results of both tests had a strong correlation with a high coefficient of determination (R2). This was due to the fact that both tests were penetration-type tests, and in both of them, the soil shear bands formed completely during the penetration. In other words, both of them had the same nature. Where DPI = DCP index ( mm blow ), q c = cone resistance (MPa), and q d = dynamic cone resistance (MPa). As shown in Figure 6, the results of both tests had a strong correlation with a high coefficient of determination (R2). This was due to the fact that both tests were penetration-type tests, and in both of them, the soil shear bands formed completely during the penetration. In other words, both of them had the same nature.

4.3. Relative Density (Dr (%)) vs. CPT Cone Resistance ( q c ) and DCP Cone Resistance ( q d )

Relative density is one of the most paramount and very applicable strength parameters of sands as it has a direct impact on soil direct shear strength. Moreover, the CPT is a common and applicable method for determining the relative density of sandy soils. Most studies have shown the logarithmic relationship between the two parameters. Schmertmann introduced the correlation between Dr and q c [52]:
Dr % = 100 C 2 ln q c MPa C 0 σ vc C 1
where C 0 ,   C 1 , and   C 2 are empirical fitting parameters, and σ vc = initial effective vertical stress. Many studies have been carried out to determine the values of these factors in calibration chambers. Some of them are listed in Table 3:
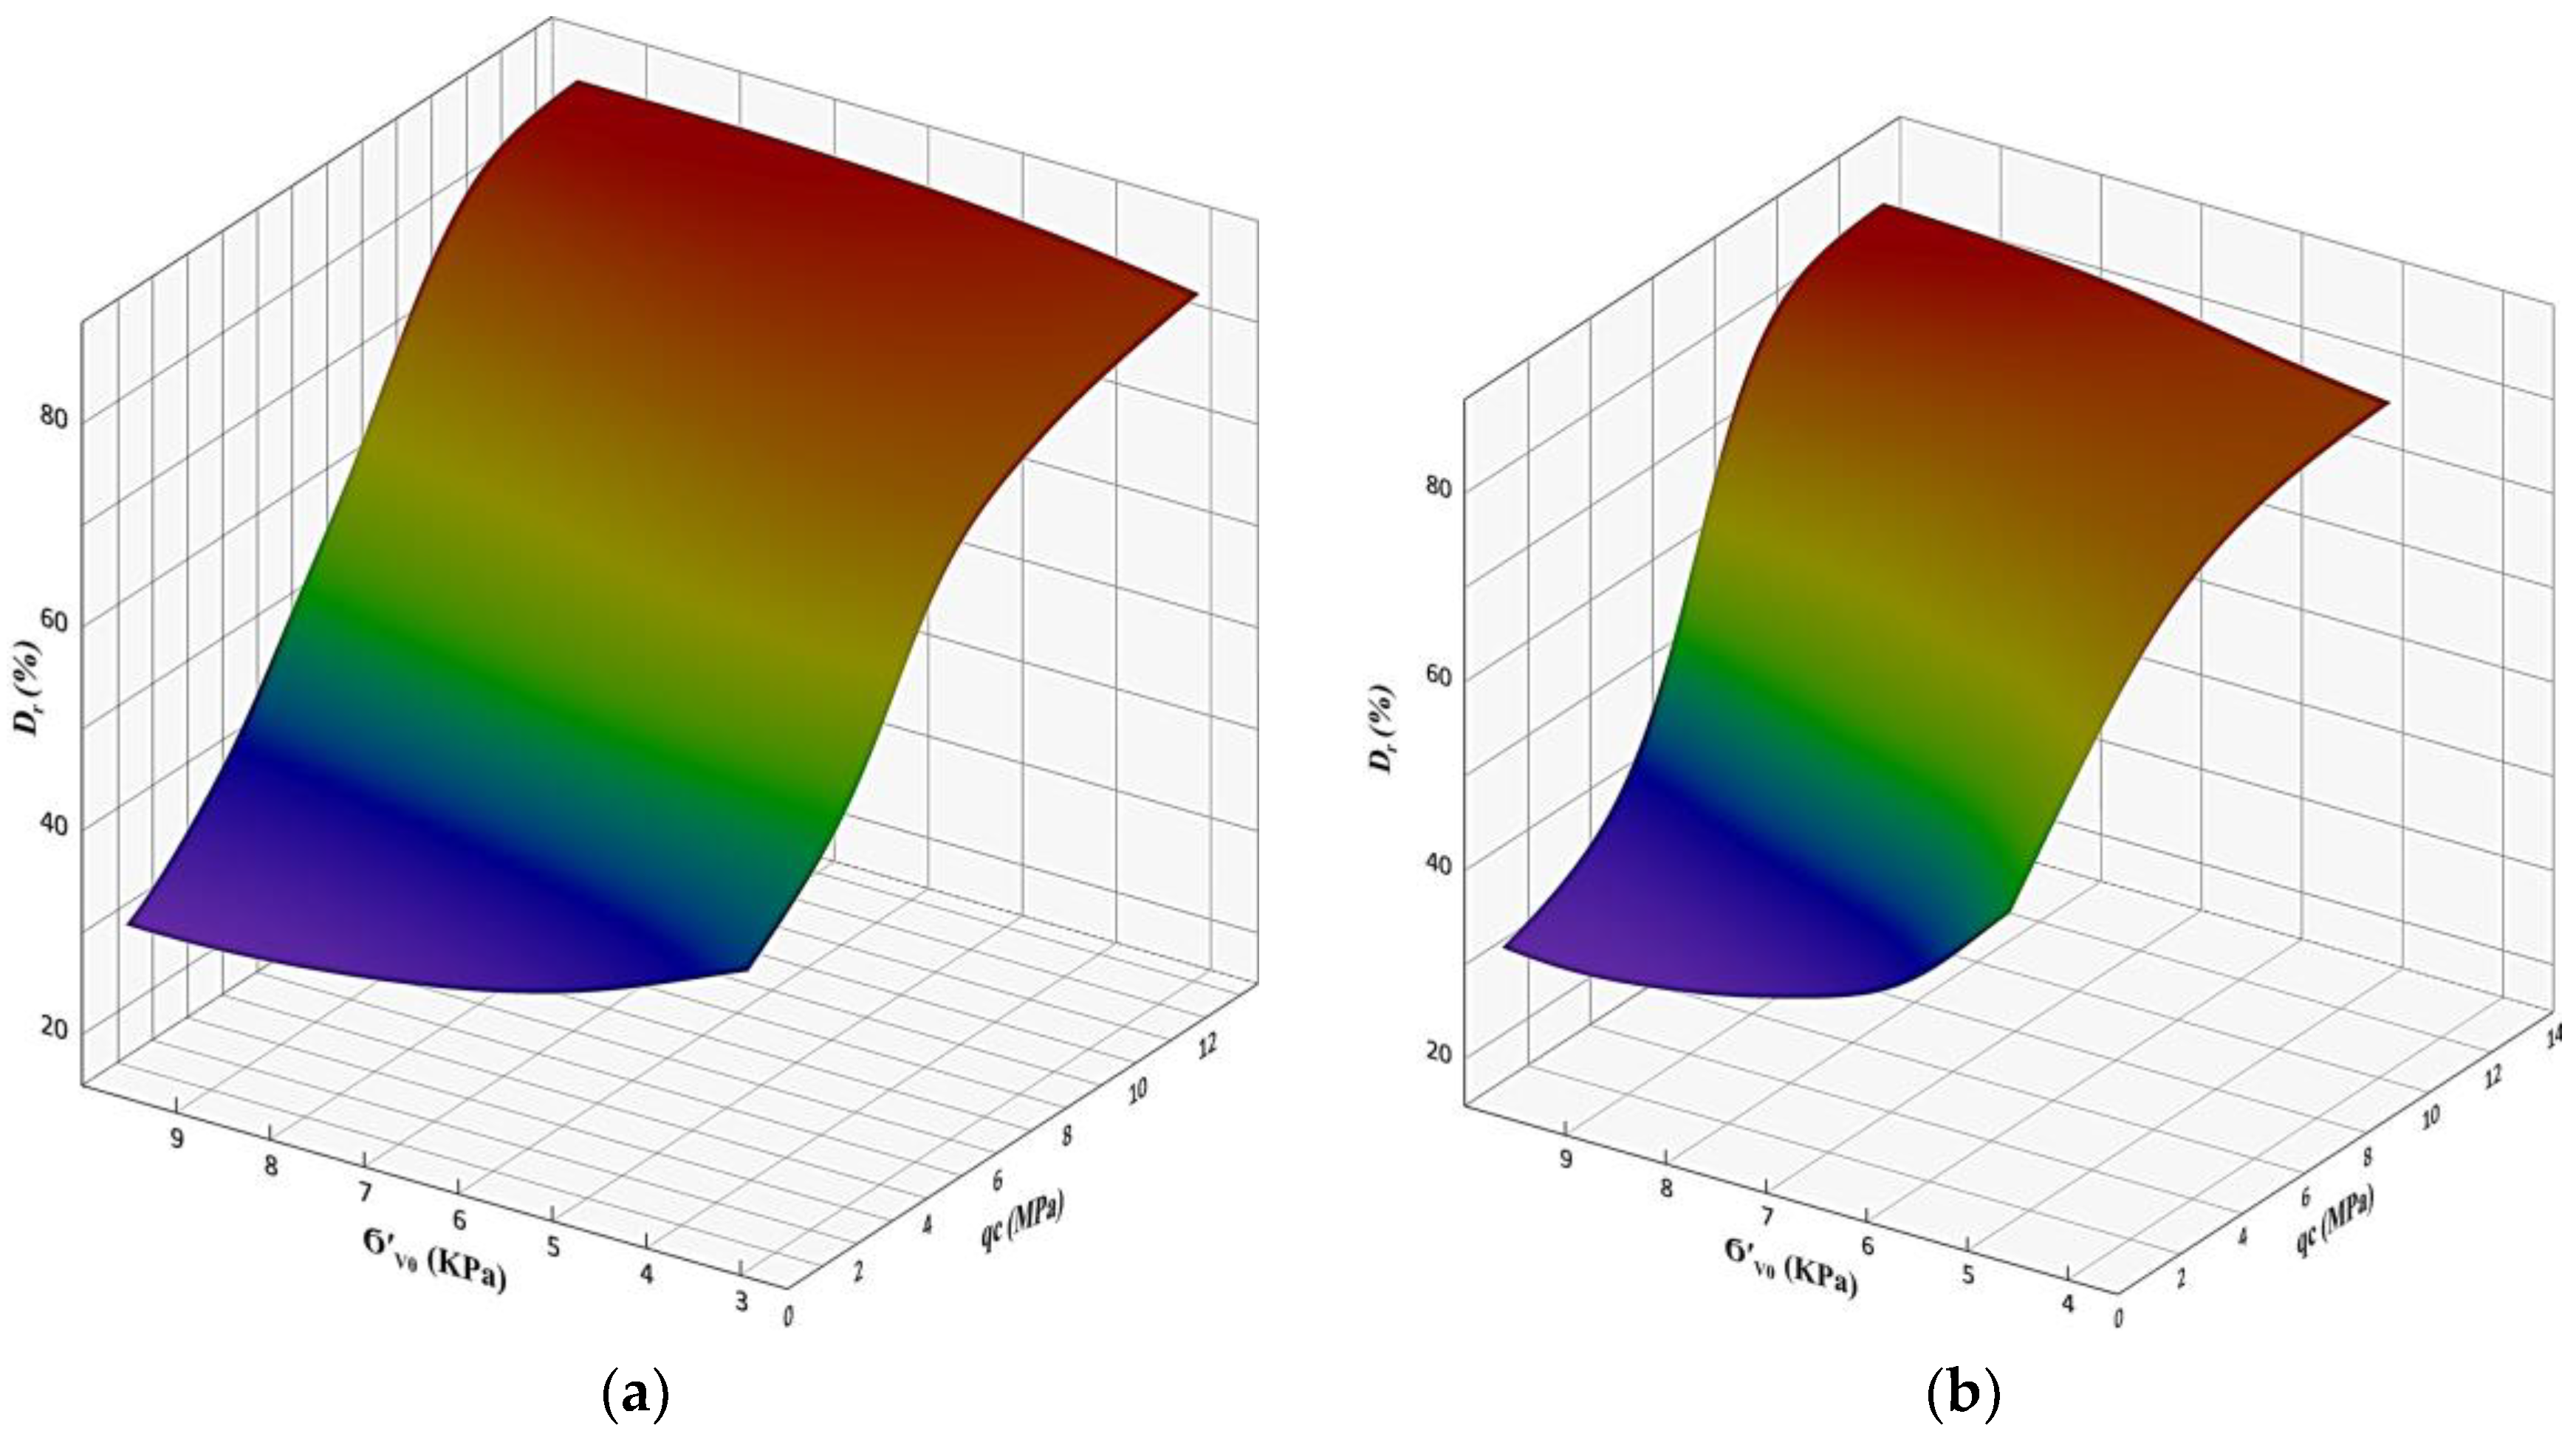
Regarding the results of this research, the C0, C1, and C2 values were 0.025, 1.37, and 3.9, respectively (Figure 7a). The proposed correlation is reasonably accurate; thus, the difference in the values of the factors from previous researchers’ investigations is justifiable because of the difference in soil structure.
Equation (8) calculates the Dr value from q d . This correlation is the same as the Dr– q c correlation, and only constant multiplying factors have different values. The proposed C0, C1, and C2 values in this equation are 0.021, 0.85, and 5.28, respectively (Figure 7b).
Dr % = 100 5.28 ln q d MPa 0.021 σ vc 0.85

4.4. Comparisons and Discussions

In order to verify the accuracy of the results, static and dynamic cone penetration tests were performed, and the results of these two tests were compared with the values of the modulus of elasticity obtained from the plate load test. The comparison of the results is presented in the following three separate sections.

4.5. Comparisons, DCP Penetration Index (DPI) versus Relative Density (Dr %)

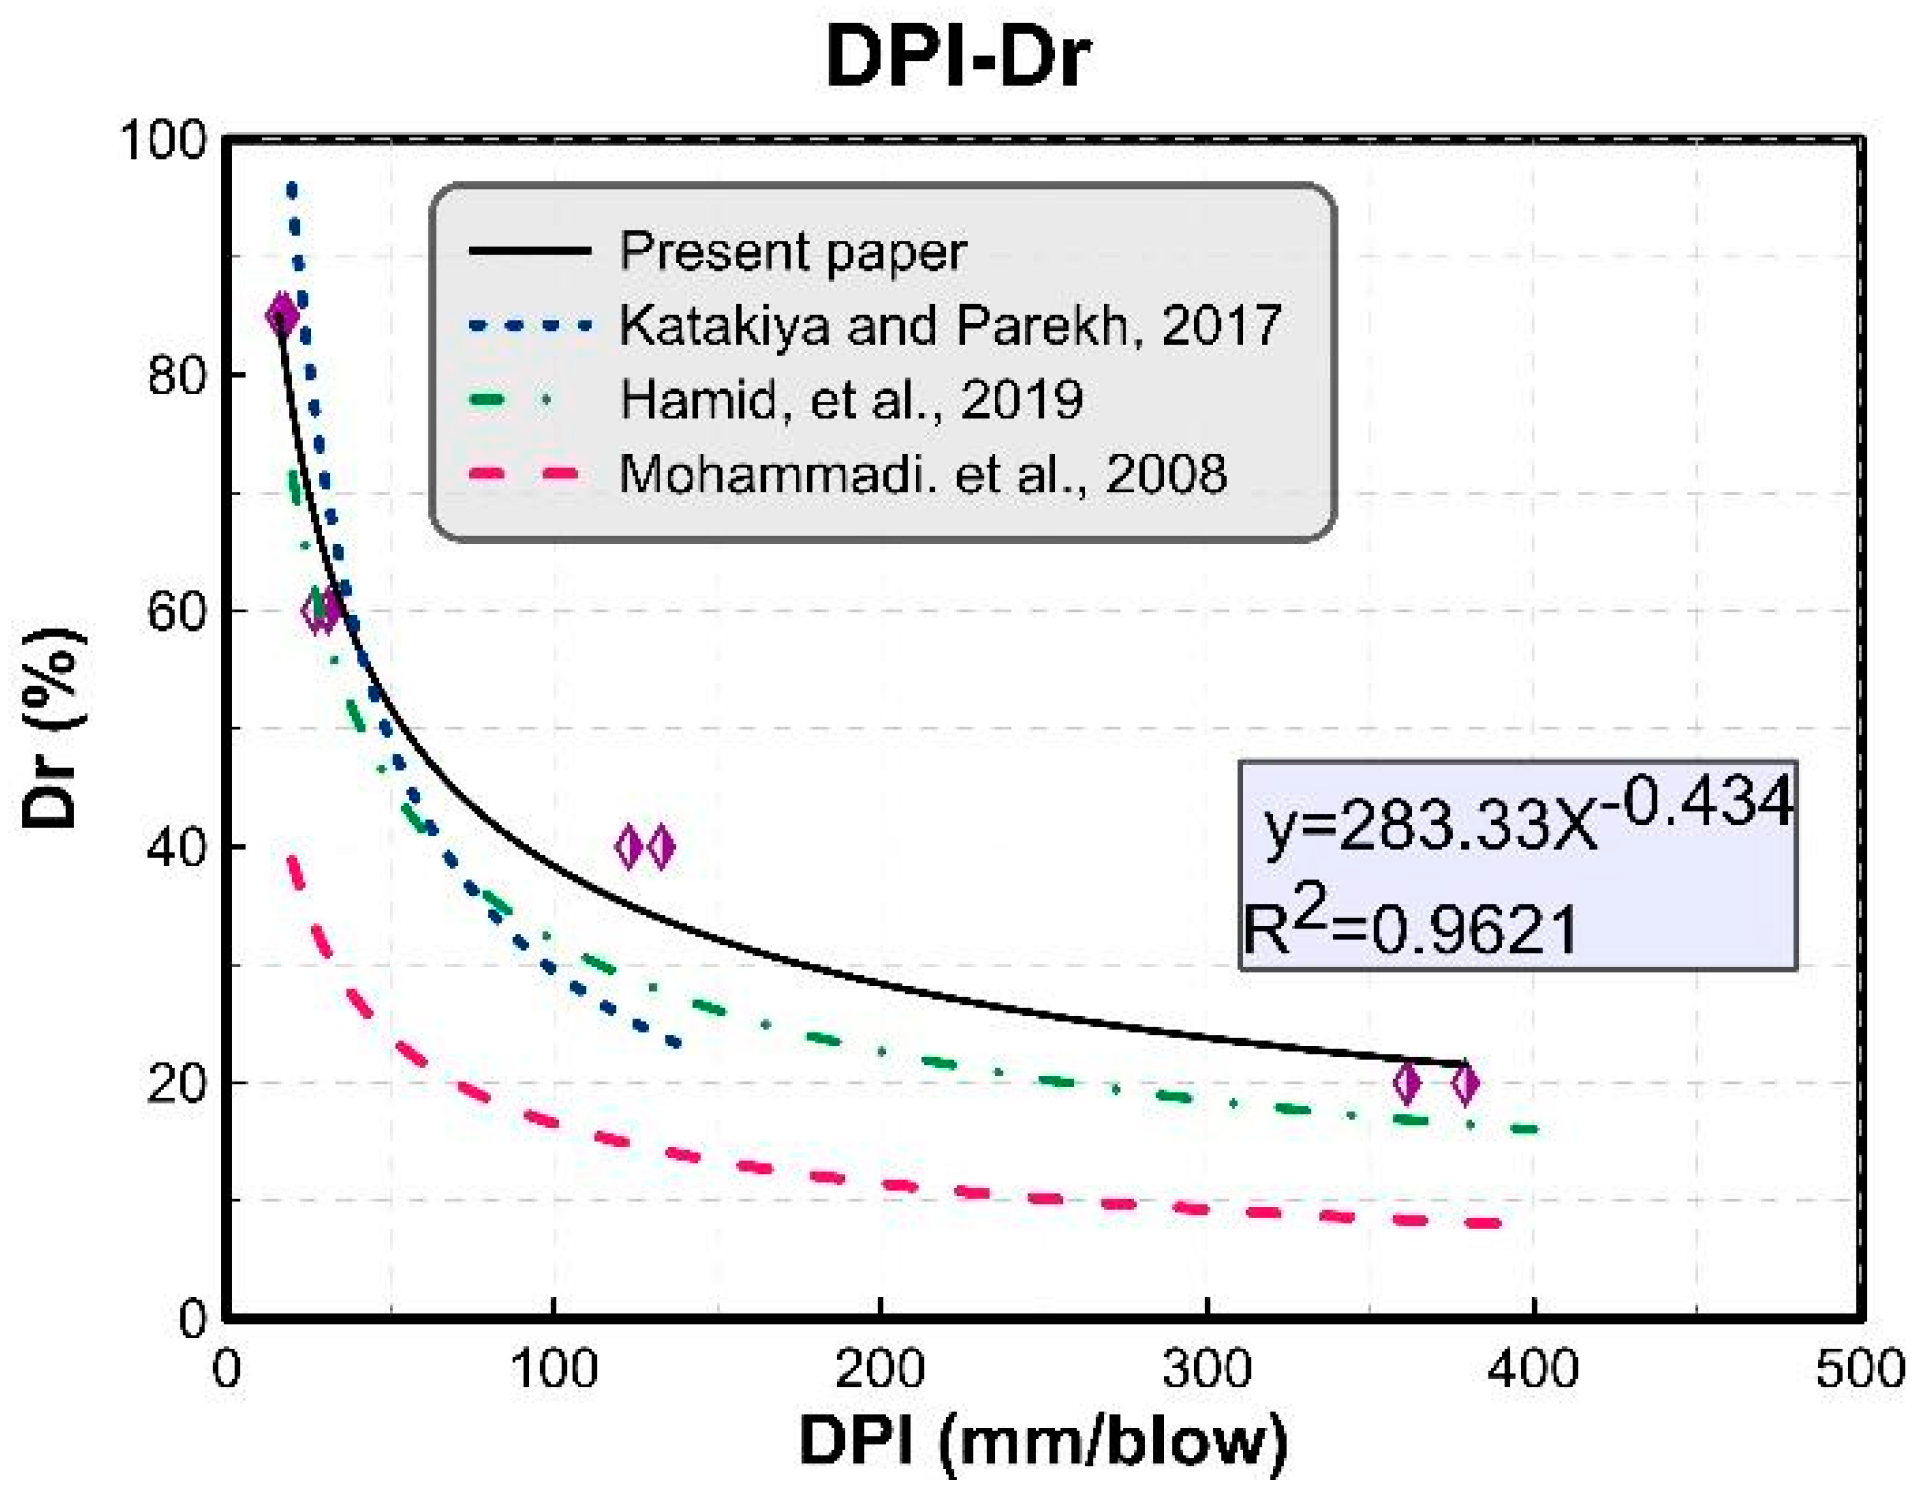
As mentioned above, the relative density has a direct relation with the direct shear test result in sands. The cone penetration value per hit is also a function of the shear strength of sands. Thus, the cone penetration value per hit (DPI factor) is dependent on Dr, and these two parameters have an inverse relationship [38,55,56]. Figure 8 shows the correlation curve derived from this research (Equation (9)).
Dr % = 283.33 × DPI 0.0434

4.6. Friction Angle ( φ ) versus CPT Cone Resistance ( q c ) and DCP Cone Resistance ( q d )

Several investigations have been conducted by previous researchers to determine the soil internal friction angle of clean sands, and the basis of all these methods is the bearing capacity theory, cavity expansion theory, and empirical methods, which are based on calibration chamber tests. Most of these correlations are empirical and derived from laboratory tests on the calibration chamber [9]. Many correlations have been introduced to find internal friction angles from q c so far [22].
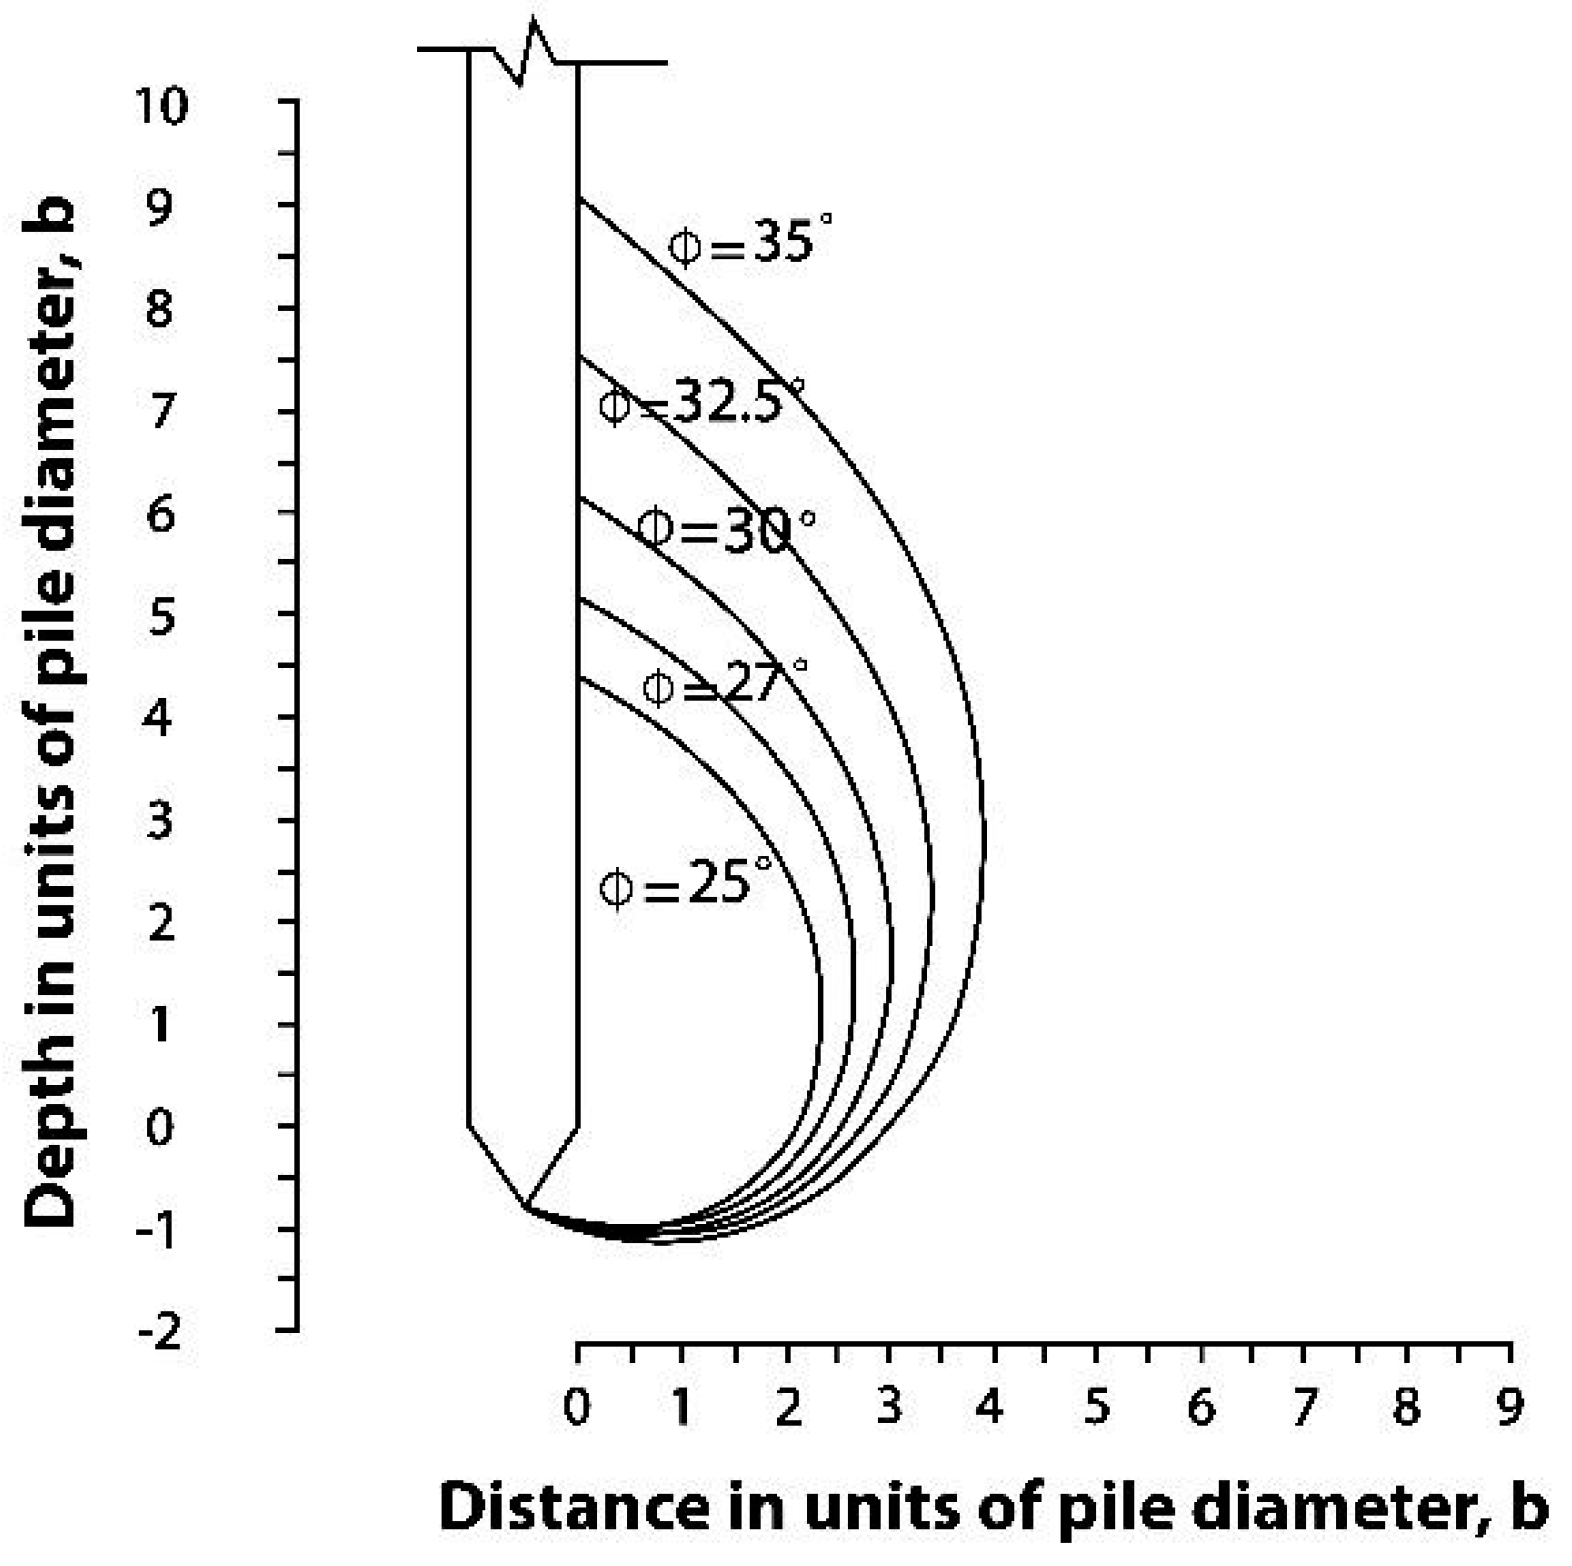
The general failure in soil could be formulated by assuming logarithmic spiral failure zones and is represented by the following expression (Equation (10)) [10]:
r = r 0 e θ tng φ
where r 0 is the radius of the logarithmic spiral for θ = 0 (assumed equal to the penetrometer diameter), θ is the angle between a radius and r 0 , and φ is the angle between the radius and the normal at that point on the spiral (assumed equal to the friction angle of the soil).
Figure 9 depicts the rupture surface with different soil’s internal friction angles, φ . A higher φ would require higher shear force and would have a higher rupture surface. Therefore, the internal friction angle of soil has an effect and correlation with the tip cone resistance.
Some correlations between φ and q c are presented in Table 4. These correlations were derived from finite element simulations and laboratory and field test data, and most were based on physical modeling tests.
The suggested equation is plotted and presented in Figure 10a. The suggested curves by previous researchers were used to verify the presented results [57,58].
Also, Figure 10b shows the internal friction angle of soil versus the normalized cone resistance of DCP ( q d 1 ). As can be seen, there is a logarithmic correlation between these two parameters. The normalized cone resistance of the dynamic cone penetrometer (DCP) was determined in the same way as the normalized cone resistance of CPT (Equations (11) and (12)).
φ = 14.069 ° + 4.977 ln q t 1
φ = 19.756 ° + 3.603 ln q d 1
q d 1 = q t P atm σ v 0 P atm 0.5 : Stress-normalized dynamic cone resistance.
During cone penetration tests, data is continuously collected, and tip resistance is affected by the effective vertical stress, which changes with depth. For this reason, the cone resistance in the equation is normalized relative to the vertical stress. Therefore, the friction angle was determined using cone penetration test data from depths where stress measurement sensors were positioned. This approach was selected because the vertical and horizontal stress measurements at these depths were more accurate, while interpolation was required for other locations. As a result, the data points on the graph were fewer in number and spaced out.

4.7. Friction Angle versus DCP Penetration Index (DPI)

The shear strength of the soil is dependent on the internal friction angle, and there is a direct relation between these two [62,63,64]. The value of cone resistance in DCP will increase with an increment in soil shear strength. Therefore, there is a reverse correlation between DPI and φ [38,55]. The best-proposed correlation between these parameters, which was derived from this research, is presented in Figure 11 (Equation (13)):
φ = 53.841 × DPI 0.105

4.8. Friction Angle versus Relative Density (Dr (%))

The internal friction angle of sands is highly dependent on the interaction between soil particles [65,66]. The friction angle of granular soil is not a material constant, but depends on the relative density and pressure level [67,68]. Moroto defined the peak φ (at failure) of soil as a function of “granular material characteristics” and “particle characteristics” [69]. Granular material characteristics are generally related to relative density (Dr). Particle characteristics mainly represent the intrinsic characteristics of soil particles, such as roundness R and the uniformity of the particles.
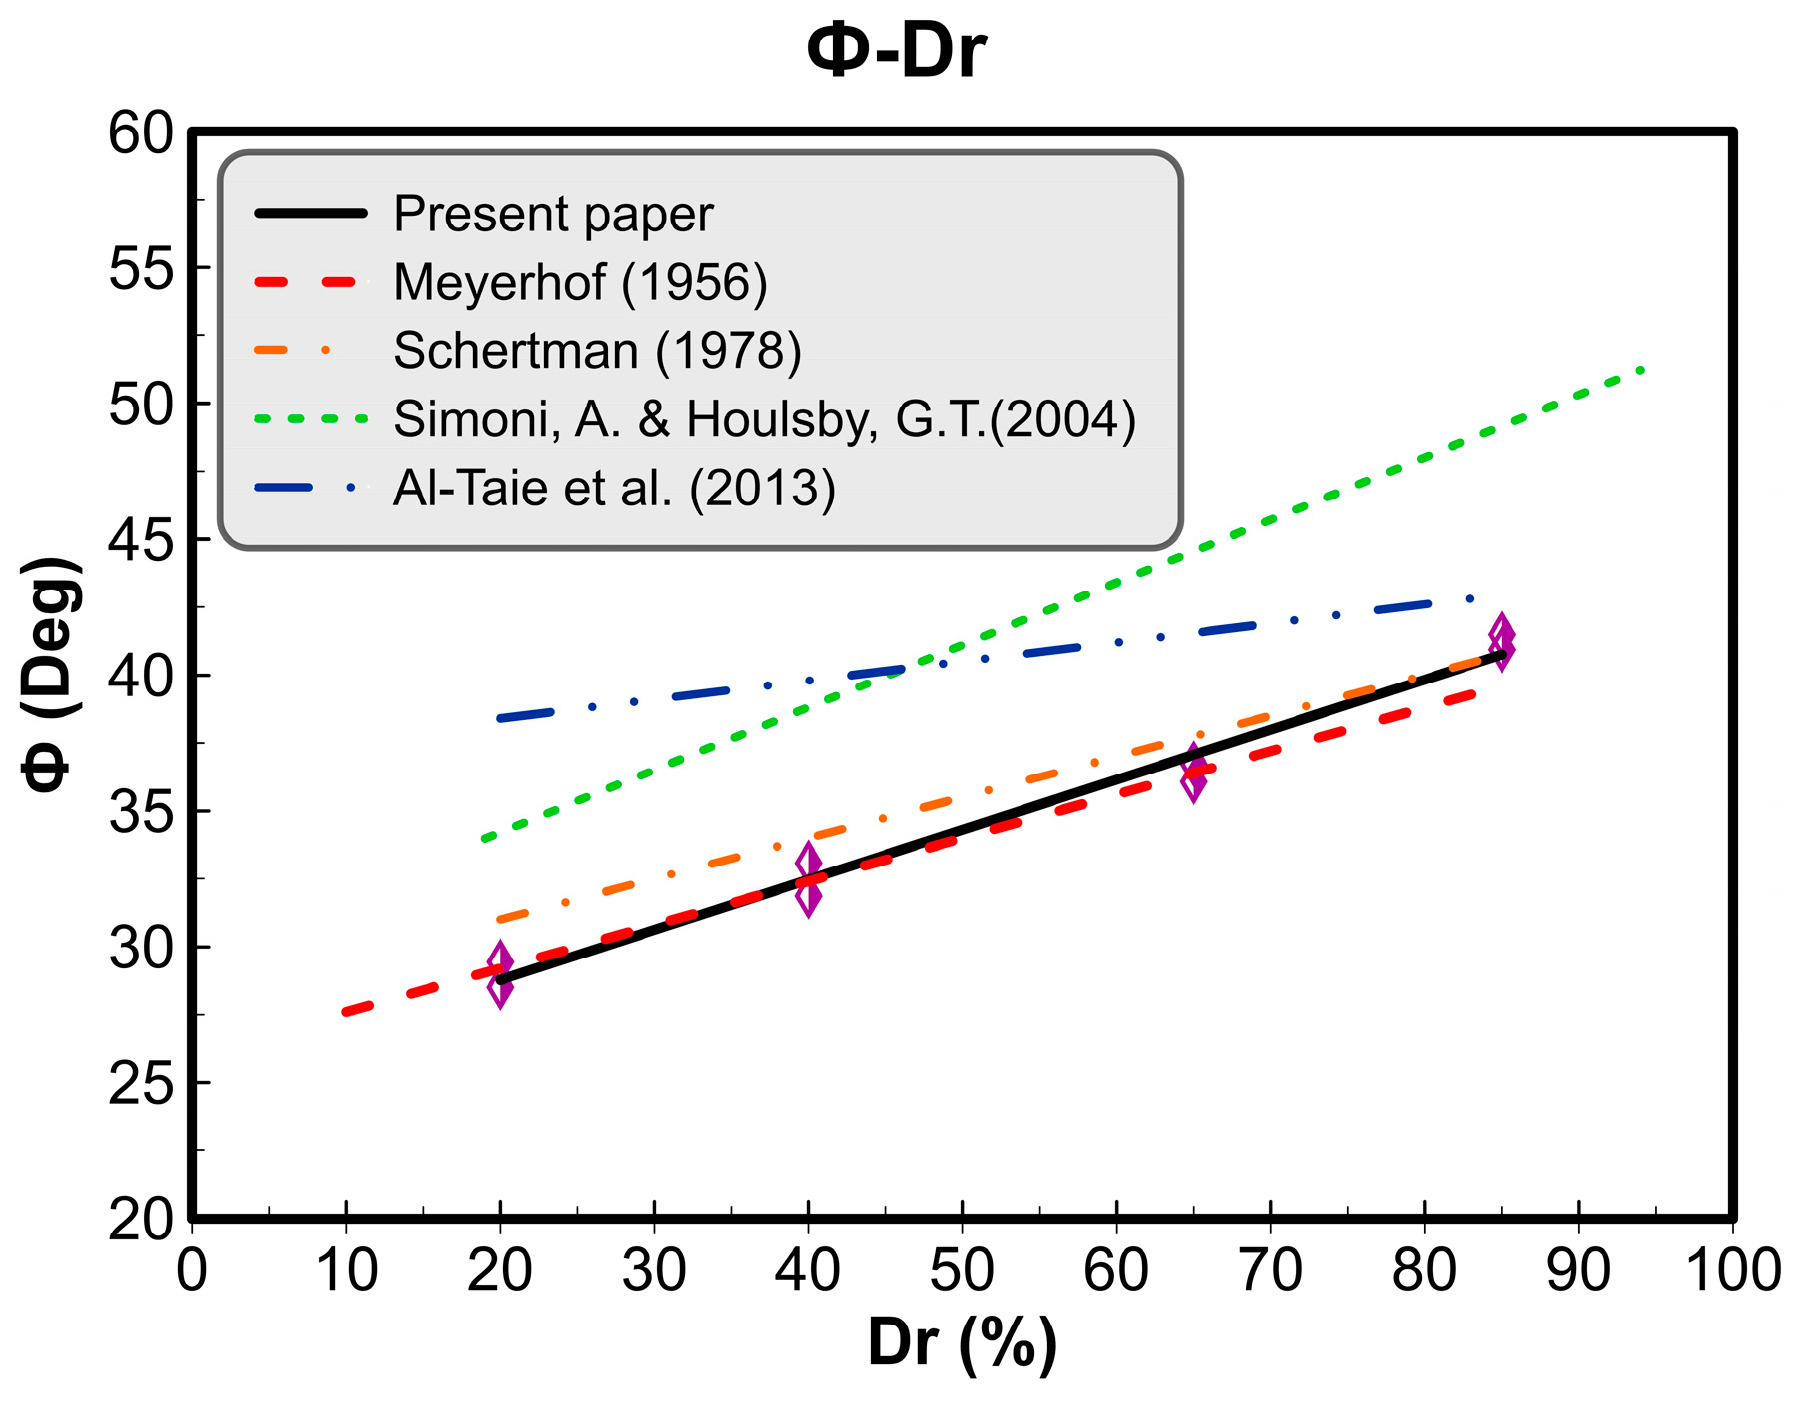
Hence, there is a direct relationship between φ and Dr %. The proposed correlation by previous investigations, which were based on empirical data, has a linear relationship of φ = a + bDr proposed by Schmertmann [52], Simoni and Houlsby [70], Meyerhof [71], Al-Taie et al. [72], and Mohammadi et al. [38].
The suggested correlation based on the test results in this study was also linear. Figure 12 shows different correlations and their values (Equation (14)).
φ = 0.184 × Dr + 25.09

4.9. Modulus of Elasticity (E) versus Dynamic and Static Cone Penetration Test Parameters

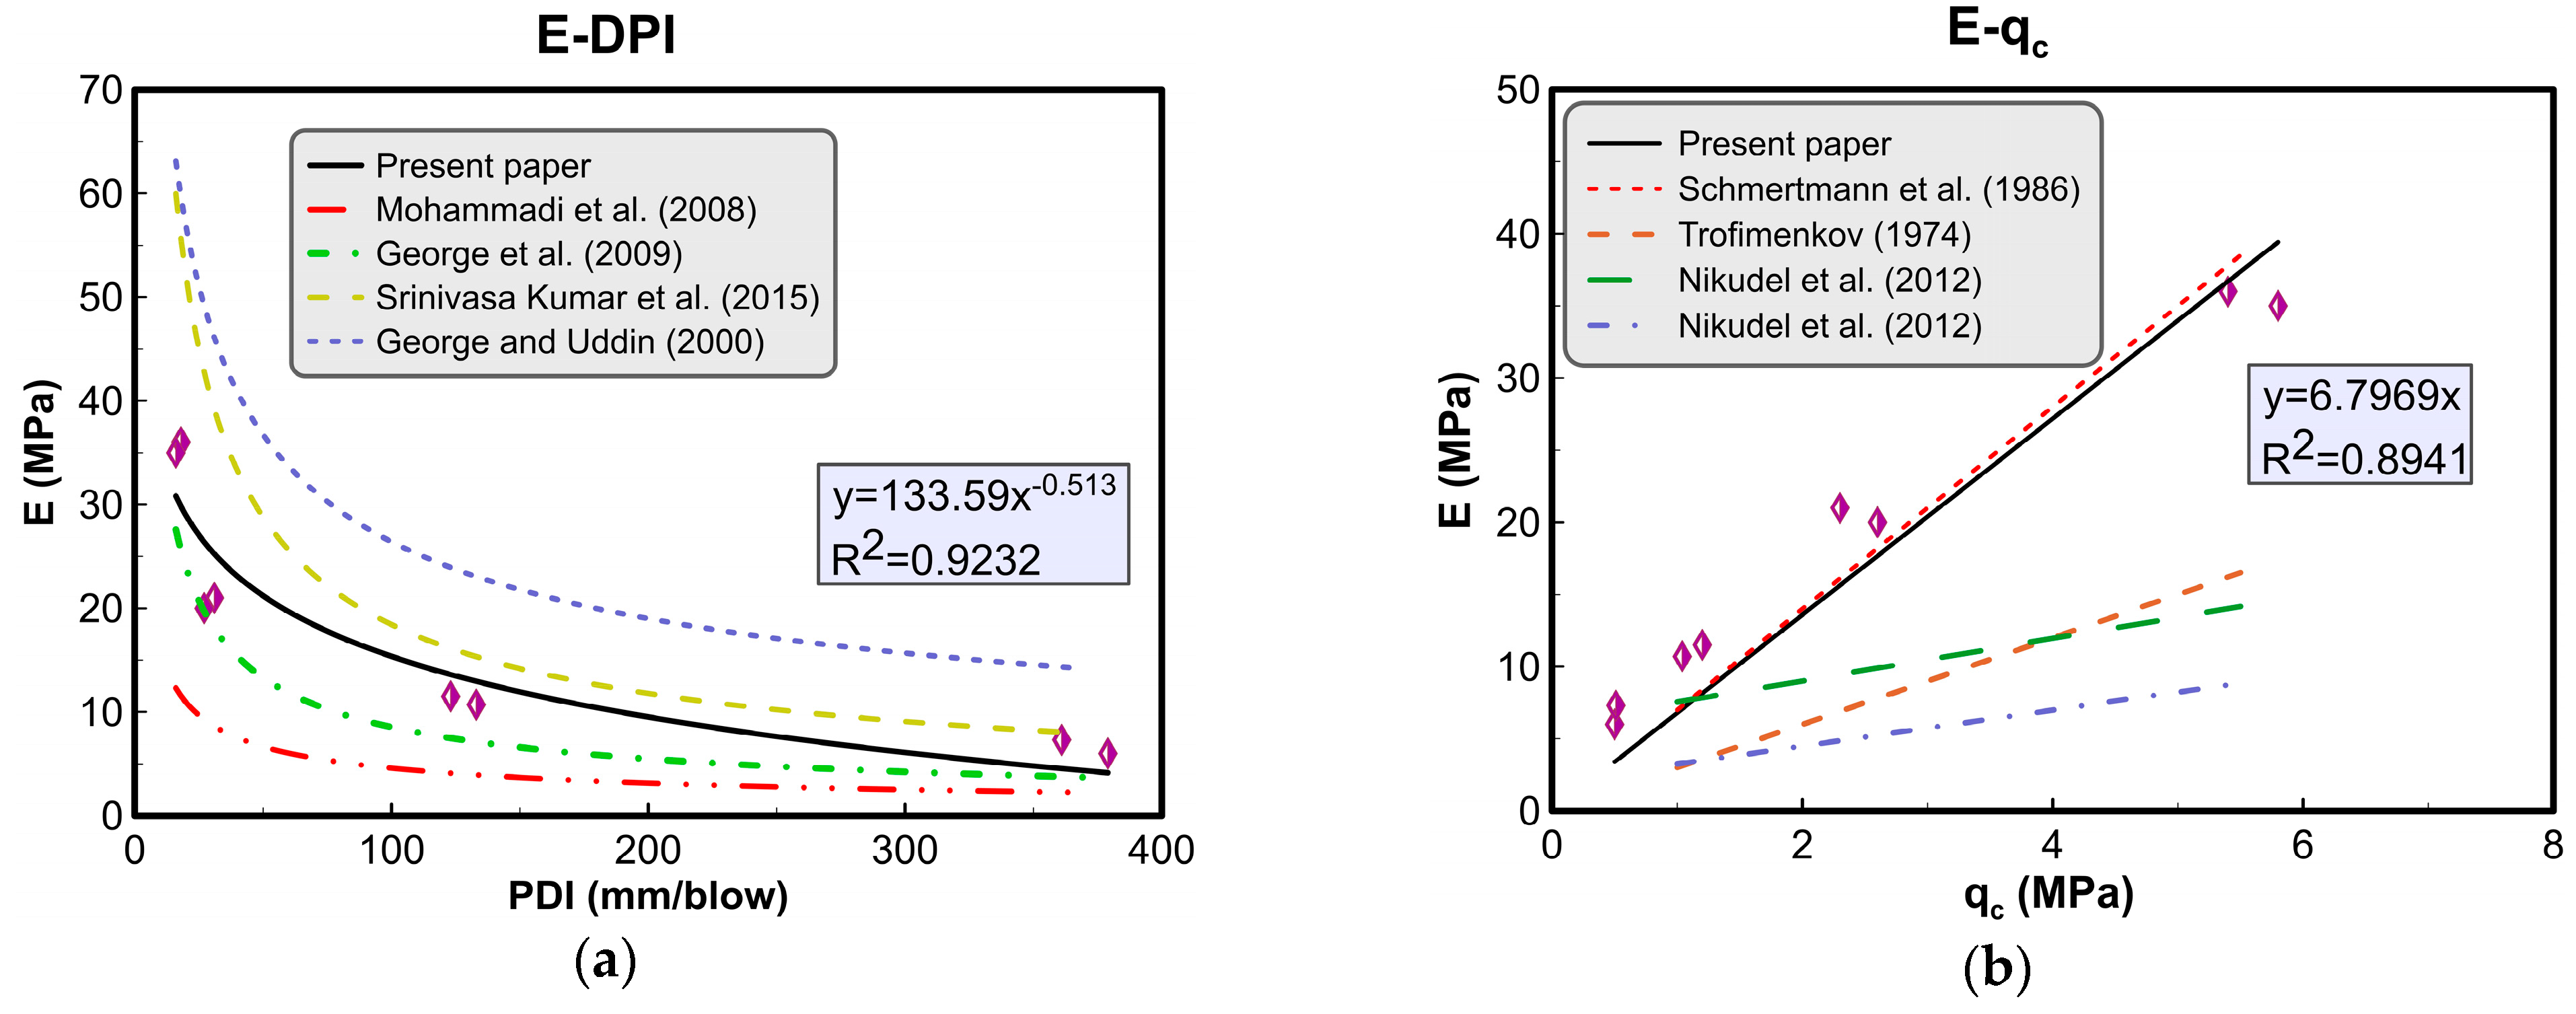
The modulus of elasticity is a suitable parameter for expressing soil strength in civil works on roads and is also applicable in soil behavior analytical models. This parameter can be derived from different in situ tests. One of the popular in situ tests for elasticity modulus determination is the plate load test (PLT), but there is some difficulty in measuring the reaction load and determining the elasticity modulus in less accessible sites. Thus, finding a correlation between DPI and PLT might be suitable for this purpose [73,74,75]. The best correlation between DPI and E (derived from PLT) is presented in Figure 13a.
The PLT is not feasible or an economical choice for deep soil characterization projects. Therefore, there is a need for a correlation between other in situ tests and the elasticity modulus or PLT results. Many studies have been performed by different researchers to find the best correlation between E and qc [23,76,77,78]. The best correlations between E (derived from PLT) and q c (derived from CPT), as well as qd (derived from DCP), are presented in Equations (15), (16) and (17), respectively (Figure 13b)
E = 133.59 × DPI 0.513
E = 6.797 q c
E = 4.839 q d
Ultimately, all of the correlations that were evaluated and obtained in this paper are listed in Table 5. As can be seen, the R2 factor (coefficient of determination) had a reasonable value in all of the correlations.

4.10. Practical Implications

A critical aspect of engineering research involves assessing a study’s practical, economic, and environmental implications and loading impacts [79]. This research primarily aims to predict the strength and stiffness parameters of sandy soils through three tests: CPT, DCP, and PLT. By enhancing the accuracy of these predictions, this study seeks to optimize design processes, reducing costs and execution time while minimizing material usage in engineering projects, ultimately leading to a lower environmental impact.
Furthermore, this research explores the potential of using the dynamic cone penetration test to estimate the parameters typically obtained from CPT and PLT. This approach is particularly advantageous in engineering projects, as the dynamic cone penetration test is more compact, easier to perform in confined or restricted-access areas, and significantly lowers geotechnical investigation costs. Unlike the CPT and PLT, the dynamic cone penetration test is widely available and easily accessible.

5. Conclusions

In this study, existing correlations between the strength and geotechnical parameters of Babolsar sand were evaluated by performing DCP, CPT, and PLT tests. In total, 24 physical modeling tests were performed, including 8 CPT tests, 8 DCP tests, 8 PLT tests, and 24 triaxial tests for the determination of the soil internal friction angle. In this research, Babolsar sand was used, and all of the samples were constructed using the dry sedimentation method in a chamber with a 700 mm diameter and 1000 mm height. The outcome of this study, which is the correlation between different geotechnical and mechanical parameters of Babolsar sand, is presented in Table 5.
The main conclusions are listed below:
  • An increase in the relative density value increases the interaction between soil particles; due to this phenomenon, the internal friction angle value is also increased. The results showed that there is a linear relationship between these two parameters;
  • The cone resistance is increased in both CPT and DCP tests by an increase in the internal friction angle and relative density, and there is a logarithmic correlation between these two;
  • An increase in the soil’s relative density increases the cone resistance in both CPT and DCP tests, and there is a linear correlation between these two parameters. In addition, under the same condition, the DPI factor value had an inverse correlation with cone resistance;
  • The elasticity modulus is a suitable geotechnical parameter for determining soil stiffness in sandy soils. The cone resistance value in both CPT and DCP tests is increased linearly by an increase in the elasticity modulus of sands. There was also a nonlinear correlation between the DPI factor and these two parameters;
  • The dynamic and static penetration tests had the same nature, and the soil shear bands formed completely during the penetration. The correlations between the parameters of both tests had a high coefficient of determination (R2) and accuracy. On the other hand, the plate load test measured stiffness and no shear band formed. Therefore, the correlation between PLT and CPT parameters had lower R2 values.

Author Contributions

Conceptualization, A.E.; methodology, A.E. and M.E.; software, M.E.; validation, M.E.; formal analysis, M.E. and M.N.; investigation, A.E. and M.E.; resources, A.E.; data curation, M.N.; writing—original draft preparation, M.E. and M.N.; writing—review and editing, M.N.; visualization, M.E. and M.N.; supervision, A.E. and M.N.; project administration, A.E.; funding acquisition, A.E. All authors have read and agreed to the published version of the manuscript.

Funding

This research received no external funding.

Institutional Review Board Statement

Not applicable.

Informed Consent Statement

Not applicable.

Data Availability Statement

All data and materials are available on request from the corresponding authors.

Conflicts of Interest

The authors declare no conflicts of interest.

List of Notations

CPTCone penetration test
DCPDynamic cone penetration
q c Cone resistance for CPT
q d Cone resistance for DCP
q t 1 Stress-normalized cone resistance
N q Bearing capacity factor
f s Sleeve friction for CPT
DPIDCP index
φ Friction angle
PPenetration of DCP
BBlow count
ACross-sectional area of the cone
KEImparted kinetic energy
XIncremental penetration
MMass of the hammer
PMass of the penetrometer
DrRelative density
EElastic modulus
σ v The vertical stress
σ v 0 Effective vertical stress
σ h Horizontal stress
σ h 0 Effective horizontal stress
P 0 Effective surcharge stress
SPPoorly graded sand
D 50 Diameter for 50% finer by weight
e m a x Maximum void ratio
e m i n Minimum void ratio
γ d , m a x Maximum dry density
γ d , m i n Minimum dry density
G s The specific gravity
c u Coefficient of uniformity
c c Coefficient of curvature
ω o p t Optimum water content

References

  1. Nobahar, M.; Khan, M.S.; Ivoke, J. Combined effect of rainfall and shear strength on the stability of highway embankments made of Yazoo clay in Mississippi. Geotech. Geol. Eng. 2020, 38, 2787–2802. [Google Scholar] [CrossRef]
  2. Juang, C.H.; Ching, J.; Wang, L.; Khoshnevisan, S.; Ku, C.-S. Simplified procedure for estimation of liquefaction-induced settlement and site-specific probabilistic settlement exceedance curve using cone penetration test (CPT). Can. Geotech. J. 2013, 50, 1055–1066. [Google Scholar] [CrossRef]
  3. Lehane, B. CPT-based design of foundations. Aust. Geomech. J. 2019, 54, 23–48. [Google Scholar]
  4. Esmailzade, M.; Eslami, A.; Nabizadeh, A.; Aflaki, E. Effect of cone diameter on determination of penetration resistance using a FCV. Int. J. Civ. Eng. 2022, 20, 223–236. [Google Scholar] [CrossRef]
  5. Eslami, A.; Ebrahimipour, A. Load-displacement appraisal and analysis for driven piles; a data-centric approach. Comput. Geotech. 2024, 171, 106377. [Google Scholar] [CrossRef]
  6. Ebrahimipour, A.; Eslami, A. Analytical study of piles behavior for marine challenging substructures. Ocean Eng. 2024, 292, 116514. [Google Scholar] [CrossRef]
  7. Lee, J.-S.; Kim, S.Y.; Hong, W.-T.; Byun, Y.-H. Assessing subgrade strength using an instrumented dynamic cone penetrometer. Soils Found. 2019, 59, 930–941. [Google Scholar] [CrossRef]
  8. Miller, G.A.; Tan, N.K.; Collins, R.W.; Muraleetharan, K.K. Cone penetration testing in unsaturated soils. Transp. Geotech. 2018, 17, 85–99. [Google Scholar] [CrossRef]
  9. Robertson, P.K.; Campanella, R. Interpretation of cone penetration tests. Part I: Sand. Can. Geotech. J. 1983, 20, 718–733. [Google Scholar] [CrossRef]
  10. Eslami, A.; Fellenius, B.H. Pile capacity by direct CPT and CPTu methods applied to 102 case histories. Can. Geotech. J. 1997, 34, 886–904. [Google Scholar] [CrossRef]
  11. Shirani, S.S.; Eslami, A.; Ebrahimipour, A.; Karakouzian, M. Dominant factors in MiniCone, CPT and pile correlations: A data-based approach. Deep Undergr. Sci. Eng. 2023, 2, 346–358. [Google Scholar] [CrossRef]
  12. Guo, L.; Liu, X.; Yang, Z.; Jia, C.; Shi, W.; Ling, X. CPT-based analysis of structured soil characteristics and liquefaction failure of the Yellow River Subaquatic Delta. Mar. Georesour. Geotechnol. 2022, 40, 308–320. [Google Scholar] [CrossRef]
  13. Bienen, B.; Qiu, G.; Pucker, T. CPT correlation developed from numerical analysis to predict jack-up foundation penetration into sand overlying clay. Ocean Eng. 2015, 108, 216–226. [Google Scholar] [CrossRef]
  14. Souza, J.; Danziger, B.; Danziger, F. The influence of the relative density of sands in SPT and CPT correlations. Soils Rocks 2012, 35, 99–113. [Google Scholar]
  15. Chang, M.-F.; Yu, G.; Na, Y.-M.; Choa, V. Evaluation of relative density profiles of sand fill at a reclaimed site. Can. Geotech. J. 2006, 43, 903–914. [Google Scholar] [CrossRef]
  16. Mayne, P. In-situ test calibrations for evaluating soil parameters. Charact. Eng. Prop. Nat. Soils 2007, 3, 1601–1652. [Google Scholar]
  17. Robertson, P.K. Cone penetration test (CPT)-based soil behaviour type (SBT) classification system—An update. Can. Geotech. J. 2016, 53, 1910–1927. [Google Scholar] [CrossRef]
  18. Ghafghazi, M.; Shuttle, D. Interpretation of sand state from cone penetration resistance. Géotechnique 2008, 58, 623–634. [Google Scholar] [CrossRef]
  19. Giretti, D.; Been, K.; Fioravante, V.; Dickenson, S. CPT calibration and analysis for a carbonate sand. Géotechnique 2018, 68, 345–357. [Google Scholar] [CrossRef]
  20. Lee, J.; Kyung, D.; Kim, B.; Prezzi, M. Estimation of the small-strain stiffness of clean and silty sands using stress-strain curves and CPT cone resistance. Soils Found. 2009, 49, 545–556. [Google Scholar] [CrossRef]
  21. Motaghedi, H.; Eslami, A. Analytical approach for determination of soil shear strength parameters from CPT and CPTu data. Arab. J. Sci. Eng. 2014, 39, 4363–4376. [Google Scholar] [CrossRef]
  22. Ouyang, Z.; Mayne, P.W. Effective friction angle of clays and silts from piezocone penetration tests. Can. Geotech. J. 2018, 55, 1230–1247. [Google Scholar] [CrossRef]
  23. Robertson, P.K. Interpretation of cone penetration tests—A unified approach. Can. Geotech. J. 2009, 46, 1337–1355. [Google Scholar] [CrossRef]
  24. Lim, Y.X.; Tan, S.A.; Phoon, K.-K. Friction angle and overconsolidation ratio of soft clays from cone penetration test. Eng. Geol. 2020, 274, 105730. [Google Scholar] [CrossRef]
  25. Arshad, M.; Tehrani, F.; Prezzi, M.; Salgado, R. Experimental study of cone penetration in silica sand using digital image correlation. Géotechnique 2014, 64, 551–569. [Google Scholar] [CrossRef]
  26. Robertson, P. Soil classification using the cone penetration test: Reply. Can. Geotech. J. 1991, 28, 176–178. [Google Scholar] [CrossRef]
  27. Fakharian, K.; Shafiei, M.; Hafezan, S. Investigation of soil setup effects on pile response in clay considering overconsolidation ratio and installation method through physical modeling. Can. Geotech. J. 2022, 60, 488–503. [Google Scholar] [CrossRef]
  28. Abu-Farsakh, M.Y.; Titi, H.H. Assessment of direct cone penetration test methods for predicting the ultimate capacity of friction driven piles. J. Geotech. Geoenviron. Eng. 2004, 130, 935–944. [Google Scholar] [CrossRef]
  29. Rahim, A.; George, K. Models to estimate subgrade resilient modulus for pavement design. Int. J. Pavement Eng. 2005, 6, 89–96. [Google Scholar] [CrossRef]
  30. Ampadu, S.I.K.; Ackah, P.; Nimo, F.O.; Boadu, F. A laboratory study of horizontal confinement effect on the dynamic cone penetration index of a lateritic soil. Transp. Geotech. 2017, 10, 47–61. [Google Scholar] [CrossRef]
  31. Hamid, A.M. The dynamic cone penetration test: A review of its correlations and applications. In Proceedings of the International Conference on Advances in Civil and Environmental Engineering, Pulau Pinang, Malaysia, 28–30 July 2015. [Google Scholar]
  32. Esmailzade, M.; Eslami, A.; McCartney, J.S. Comparison of frustum confining vessel (FCV) and full-scale testing for helical and expanded piles geotechnical performance. Mar. Georesour. Geotechnol. 2024, 1–21. [Google Scholar] [CrossRef]
  33. ASTM D2487; Standard Test Methods for Particle-Size Distribution (Gradation) of Soils Using Sieve Analysis. ASTM International: West Conshohocken, PA, USA, 2017.
  34. ASTM D4253; Standard Test Methods for Maximum Index Density and Unit Weight of Soils Using a Vibratory Table. ASTM International: West Conshohocken, PA, USA, 2016.
  35. ASTM D4254; Standard Test Methods for Minimum Index Density and Unit Weight of Soils and Calculation of Relative Density. ASTM International: West Conshohocken, PA, USA, 2016.
  36. ASTM D854; Standard Test Methods for Specific Gravity of Soil Solids by the Water Displacement Method. ASTM International: West Conshohocken, PA, USA, 2023.
  37. ASTM D698; Standard Test Methods for Laboratory Compaction Characteristics of Soil Using Standard Effort (12,400 ft-lbf/ft3 (600 kN-m/m3)). ASTM International: West Conshohocken, PA, USA, 2012.
  38. Mohammadi, S.; Nikoudel, M.; Rahimi, H.; Khamehchiyan, M. Application of the Dynamic Cone Penetrometer (DCP) for determination of the engineering parameters of sandy soils. Eng. Geol. 2008, 101, 195–203. [Google Scholar] [CrossRef]
  39. Moghadasi, H.; Eslami, A.; Akbarimehr, D.; Asgari, S. Assessment of adjacent foundations consequences and solutions for remediation via physical modeling. Soil Dyn. Earthq. Eng. 2024, 180, 108613. [Google Scholar] [CrossRef]
  40. Eslami, A.; Afshar, D.; Moghadasi, H.; Akbarimehr, D. Numerical and Experimental Investigations of Interference Effect of Adjacent Buildings on Sand and Fill Deposits. Int. J. Civ. Eng. 2024, 22, 723–738. [Google Scholar] [CrossRef]
  41. ASTM D5778; Standard Test Method for Electronic Friction Cone and Piezocone Penetration Testing of Soils. ASTM International: West Conshohocken, PA, USA, 2020.
  42. ASTM D6951; Standard Test Method for Use of the Dynamic Cone Penetrometer in Shallow Pavement Applications. ASTM International: West Conshohocken, PA, USA, 2018.
  43. Embacher, R.A. Duration of spring thaw recovery for aggregate-surfaced roads. Transp. Res. Rec. 2006, 1967, 27–35. [Google Scholar] [CrossRef]
  44. Gamache, R.W.; Kianirad, E.; Alshawabkeh, A.N. An automatic portable near surface soil characterization system. In Proceedings of the Recent Advancement in Soil Behavior, in Situ Test Methods, Pile Foundations, and Tunneling: Selected Papers from the 2009 GeoHunan International Conference, Changsha, China, 3–6 August 2009; pp. 89–94. [Google Scholar]
  45. Fonseca, A.V.d. Load tests on residual soil and settlement prediction on shallow foundation. J. Geotech. Geoenviron. Eng. 2001, 127, 869–883. [Google Scholar] [CrossRef]
  46. Consoli, N.C.; Schnaid, F.; Milititsky, J. Interpretation of plate load tests on residual soil site. J. Geotech. Geoenviron. Eng. 1998, 124, 857–867. [Google Scholar] [CrossRef]
  47. ASTM D1195; Standard Test Method for Repetitive Static Plate Load Tests of Soils and Flexible Pavement Components, for Use in Evaluation and Design of Airport and Highway Pavements. ASTM International: West Conshohocken, PA, USA, 2009.
  48. da Fonseca, A.J.P.V. Geomecânica dos Solos Residuais do Granito do Porto: Critérios para Dimensionamento de Fundações Directas; Universidade do Porto: Porto, Portugal, 1996. [Google Scholar]
  49. dos Santos, M.D.; Bicalho, K.V. Proposals of SPT-CPT and DPL-CPT correlations for sandy soils in Brazil. J. Rock Mech. Geotech. Eng. 2017, 9, 1152–1158. [Google Scholar] [CrossRef]
  50. Rios, S.; da Fonseca, A.V.; Pinheiro, C.; Molina-Gómez, F.; Miranda, T. Correlations between Dynamic Penetrometer Light and Cone Penetration Tests in Intermediate Soils: A Statistical Comparison. In Proceedings of the XIX Congresso Brasileiro de Mecânica dos Solos e Engenharia Geotécnica Geotecnia e Desenvolvimento Urbano, Salvador, Brazil, 28 August–1 September 2018. [Google Scholar]
  51. Kodicherla, S.P.K.; Nandyala, D.K. Use of CPT and DCP based correlations in characterization of subgrade of a highway in Southern Ethiopia Region. Int. J. Geo-Eng. 2016, 7, 11. [Google Scholar] [CrossRef]
  52. Schmertmann, J.H. Guidelines for Cone Penetration Test: Performance and Design; United States. Federal Highway Administration: Washington, DC, USA, 1978. [Google Scholar]
  53. Jamiolkowski, M.; Lo Presti, D.; Manassero, M. Evaluation of relative density and shear strength of sands from CPT and DMT. In Soil Behavior and Soft Ground Construction; American Society of Civil Engineers (ASCE): Reston, VA, USA, 2003; pp. 201–238. [Google Scholar]
  54. Sadrekarimi, A. Evaluation of CPT-based characterization methods for loose to medium-dense sands. Soils Found. 2016, 56, 460–472. [Google Scholar] [CrossRef]
  55. Hamid, A.M.; Al-Amoudi, O.S.B.; Aiban, S.A. Assessing the effect of density and water level on the degree of compaction of sand using dynamic cone penetration test. Arab. J. Sci. Eng. 2019, 44, 4921–4930. [Google Scholar] [CrossRef]
  56. Katakiya, M.; Parekh, A. Effect of gradation and particle size on correlations between DCP Index (ASTM D6951-03) and relative density for sand. In Proceedings of the International Conference on Research and Innovations in Science, Engineering and Technology, Anand, India, 19–21 February 2017; pp. 185–191. [Google Scholar]
  57. Kulhawy, F.H.; Mayne, P.W. Manual on Estimating Soil Properties for Foundation Design; Electric Power Research Institute: Palo Alto, CA, USA; Cornell University: Ithaca, NY, USA, 1990. [Google Scholar]
  58. Uzielli, M.; Mayne, P.W.; Cassidy, M.J. Probabilistic assignment of design strength for sands from in-situ testing data. In Modern Geotechnical Design Codes of Practice; IOS Press: Amsterdam, The Netherlands, 2013; pp. 214–227. [Google Scholar]
  59. Houlsby, G.; Hitchman, R. Calibration chamber tests of a cone penetrometer in sand. Geotechnique 1988, 38, 39–44. [Google Scholar] [CrossRef]
  60. Jeong, S.; Lee, J.; Lee, C.J. Slip effect at the pile–soil interface on dragload. Comput. Geotech. 2004, 31, 115–126. [Google Scholar] [CrossRef]
  61. Senneset, K.; Sandven, R.; Lunne, T.; Amundsen, T. Piezocone tests in silty soils. In Proceedings of the International Symposium on Penetration Testing; ISOPT-1. 1, Orlando, FL, USA, 20–24 March 1988; pp. 955–966. [Google Scholar]
  62. Fakharian, K.; Kaviani-Hamedani, F.; Imam, S.R. Influences of initial anisotropy and principal stress rotation on the undrained monotonic behavior of a loose silica sand. Can. Geotech. J. 2022, 59, 847–862. [Google Scholar] [CrossRef]
  63. Kaviani-Hamedani, F.; Esmailzade, M.; Adineh, K.; Shafiei, M.; Shirkavand, D. Quantifying three-dimensional sphericity indices of irregular fine particles from 2D images through sequential sieving tests. Granul. Matter 2024, 26, 13. [Google Scholar] [CrossRef]
  64. Kaviani-Hamedani, F.; Fakharian, K.; Lashkari, A. Bidirectional shear wave velocity measurements to track fabric anisotropy evolution of a crushed silica sand during shearing. J. Geotech. Geoenviron. Eng. 2021, 147, 04021104. [Google Scholar] [CrossRef]
  65. Kaviani-Hamedani, F.; Fakharian, K.; Shirkavand, D.; Khoshghalb, A.; Shabani, F.; Sooraki, A.; Rezaie, A. Exploring the Effects of Initial Fabric Anisotropy due to Preshearing Stress History in Different Directions on the Undrained Behavior of Loose Sands. Int. J. Geomech. 2024, 24, 04024201. [Google Scholar] [CrossRef]
  66. Shabani, F.; Kaviani-Hamedani, F. Cyclic response of sandy subsoil layer under traffic-induced principal stress rotations: Application of bidirectional simple shear apparatus. Soil Dyn. Earthq. Eng. 2023, 164, 107573. [Google Scholar] [CrossRef]
  67. Bareither, C.A.; Edil, T.B.; Benson, C.H.; Mickelson, D.M. Geological and physical factors affecting the friction angle of compacted sands. J. Geotech. Geoenviron. Eng. 2008, 134, 1476–1489. [Google Scholar] [CrossRef]
  68. Fakharian, K.; Kaviani-Hamedani, F.; Sooraki, A.; Amindehghan, M.; Lashkari, A. Continuous bidirectional shear moduli monitoring and micro X-ray CT to evaluate fabric evolution under different stress paths. Granul. Matter 2023, 25, 52. [Google Scholar] [CrossRef]
  69. Moroto, N. A new parameter to measure degree of shear deformation of granular material in triaxial compression tests. Soils Found. 1976, 16, 1–9. [Google Scholar] [CrossRef] [PubMed]
  70. Simoni, A.; Houlsby, G.T. The direct shear strength and dilatancy of sand–gravel mixtures. Geotech. Geol. Eng. 2006, 24, 523–549. [Google Scholar] [CrossRef]
  71. Meyerhof, G. Penetration tests and bearing capacity of cohesionless soils. J. Soil Mech. Found. Div. 1956, 82, 866-1–866-19. [Google Scholar] [CrossRef]
  72. Al-Taie, A.J.; Al-Shakarchi, Y.J.; Mohammed, A.A. Investigation of geotechnical specifications of sand dune soil: A case study around Baiji in Iraq. IIUM Eng. J. 2013, 14. [Google Scholar] [CrossRef]
  73. George, K.; Uddin, W. Subgrade Characterization for Highway Pavement Design; Department of Transportation, University of Mississippi: Oxford, MS, USA, 2000. [Google Scholar]
  74. George, V.; Rao, N.C.; Shivashankar, R. PFWD, DCP and CBR correlations for evaluation of lateritic subgrades. Int. J. Pavement Eng. 2009, 10, 189–199. [Google Scholar] [CrossRef]
  75. Kumar, R.S.; Ajmi, A.S.; Valkati, B. Comparative study of sub grade soil strength estimation models developed based on CBR, DCP and FWD test results. Int. Adv. Res. J. Sci. Eng. Technol. 2015, 2, 92–102. [Google Scholar] [CrossRef]
  76. Schmertmann, J.; Baker, W.; Gupta, R.; Kessler, K. CPT/DMT QC of ground modification at a power plant. In Proceedings of the Use of In Situ Tests in Geotechnical Engineering, Blacksburg, VA, USA, 23–25 June 1986; pp. 985–1001. [Google Scholar]
  77. Nikudel, M.R.; Mousavi, S.E.; Khamehchiyan, M.; Jamshidi, A. Using Miniature Cone Penetration Test (Mini-CPT) to determine engineering properties of sandy soils. Geopersia 2012, 2, 65–76. [Google Scholar]
  78. Trofimenkov, J. Penetration Test in URSS-State-of the Art Report. In Proceedings of the European Symposium on Penetration Testing, Stockholm, Sweden, 5–7 June 1974; pp. 147–154. [Google Scholar]
  79. Nobahar, M.; Khan, M.S.; Ivoke, J.; Amini, F. Impact of rainfall variation on slope made of expansive Yazoo clay soil in Mississippi. Transp. Infrastruct. Geotechnol. 2019, 6, 318–336. [Google Scholar] [CrossRef]
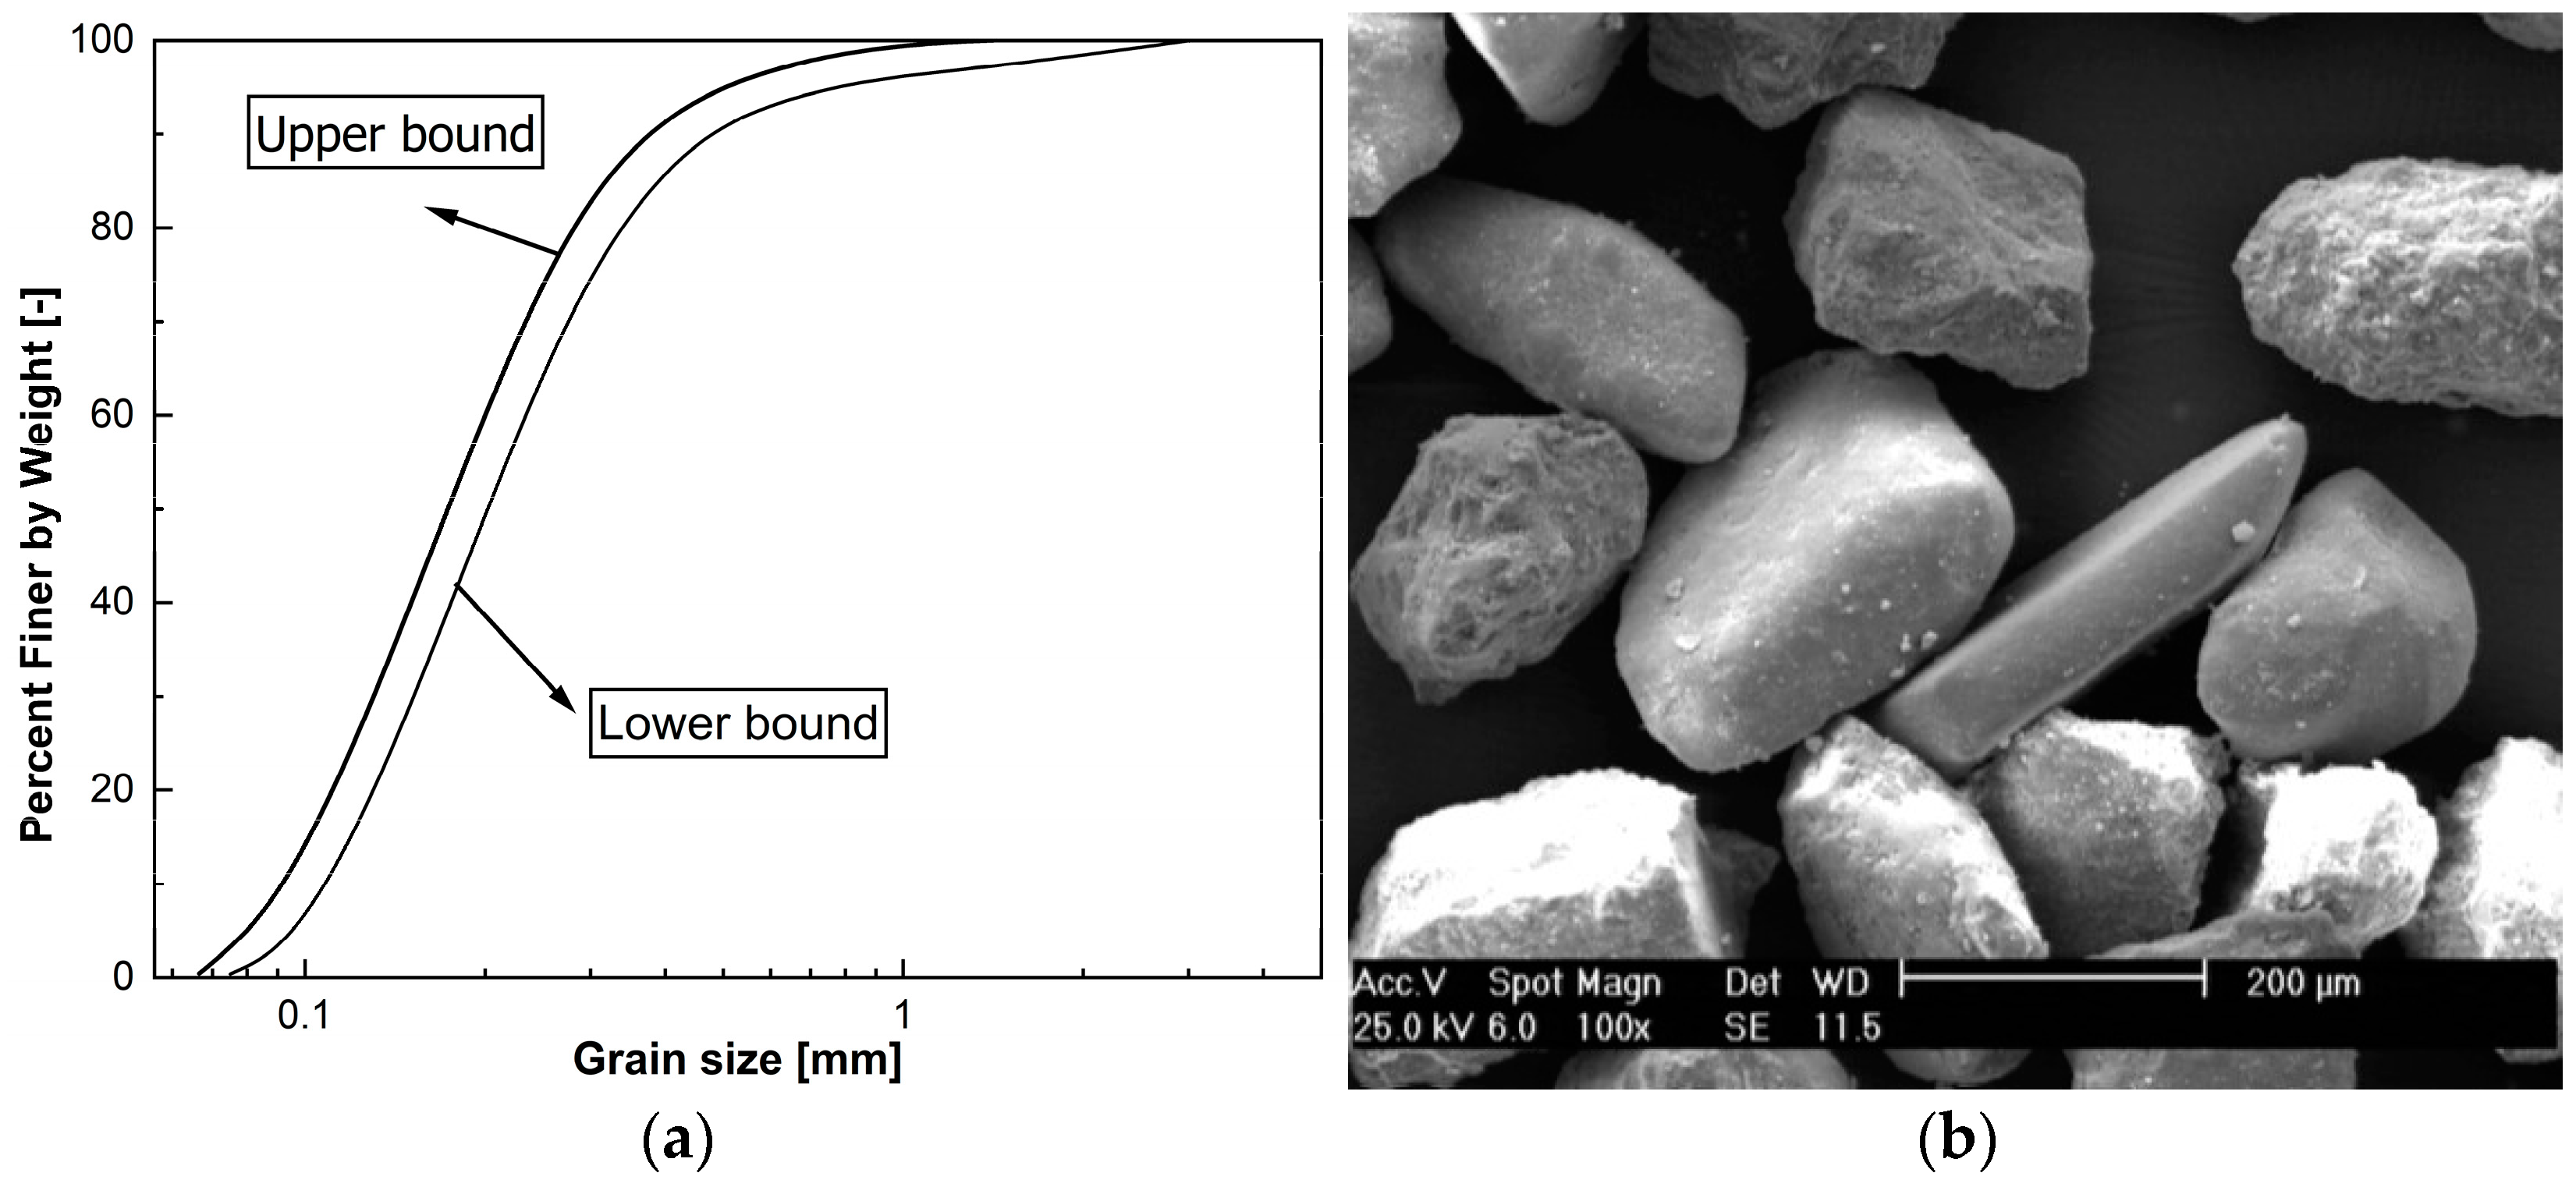
Figure 1. Babolsar sand illustrations; (a) gradation curves, (b) scanning electron microscope (SEM) images of sand particles.
Geotechnics 04 00049 g001
Figure 2. A schematic and 3D diagram of the testing chamber.
Geotechnics 04 00049 g002
Figure 3. Soil preparation steps in 1 g physical modeling plate; (a) soil sedimentation; (b) densification; (c) elevation soil measurement.
Geotechnics 04 00049 g003
Figure 4. The various parts of the constructed cone penetration test (CPT) device along with their dimensions; (a) schematic; (b) picture.
Geotechnics 04 00049 g004
Figure 5. Result of repeatability test: (a) cone resistance; (b) sleeve friction.
Geotechnics 04 00049 g005
Figure 6. Correlation between (a) DPI and q c , and (b) q d and q c .
Geotechnics 04 00049 g006
Figure 7. Correlation among (a) Dr (%), σ vc , and q c , and (b) Dr (%), σ vc , and q c .
Geotechnics 04 00049 g007
Figure 8. Correlation between Dr (%) and DP [38,55,56].
Geotechnics 04 00049 g008
Figure 9. Rupture surface for different friction angles [10].
Geotechnics 04 00049 g009
Figure 10. (a) Correlation between φ and q t 1 ; (b) correlation between φ and q d 1 . [57,58].
Geotechnics 04 00049 g010
Figure 11. Correlation between φ versus DPI [38,55].
Geotechnics 04 00049 g011
Figure 12. Correlation between φ versus Dr (%) [52,70,71,72].
Geotechnics 04 00049 g012
Figure 13. Correlation between (a) E and DPI, and (b) E and q c [38,73,74,75,76,77,78].
Geotechnics 04 00049 g013
Table 1. The index properties of Babolsar sand.
ParameterValue Standard Reference
D 50   mm  10.18ASTM D6913 [33]
e max    20.876ASTM D4253 [34]
e min  30.637ASTM D4254 [35]
γ d , max   kN m 3  417.0ASTM D4254 [35]
γ d , min   kN m 3  514.82ASTM D4253 [34]
G s    62.78ASTM D854 [36]
C u    71.22ASTM D6913 [33]
C c    81.67ASTM D6913 [33]
ω opt   %  911ASTM D698 [37]
1 Diameter for 50% finer by weight, 2 maximum void ratio, 3 minimum void ratio, 4 maximum dry density, 5 minimum dry density, 6 specific gravity, 7 coefficient of uniformity, 8 coefficient of curvature, 9 optimum water content.
Table 3. Summary of correlation parameters suggested by earlier studies for fitting Equation (7).
Sand C 0 C 1 C 2 Reference
Several NC sands2.910.7000.050[52]
Ticino2.410.5500.157
Hokksund3.290.5300.086
Ticino2.900.5500.140[53]
Ticino, Toyoura, Hokksund3.100.5000.175
Ottawa sand2.550.6120.119[54]
Table 4. Summary of correlation between φ and q c by earlier studies.
ReferenceEquation
[9]
tan φ = 1 2.62 log q c σ v 0 + 0.29
[57]
φ = 17.6 + 11 log q t 1
[58]
φ = 25 ° × q t 1 0.1
[59]
φ = 9 ° + 6.25 ln q t σ h 0
[60]
φ = 15.6 ° × q t σ h 0 0.171
[61]
q c = N q 1 σ v 0 + C tan φ + σ v 0
[20]
C + 0.000780 1 sin φ σ vc tan 2 3 φ q c σ v 0 2 σ h 0 3 σ v 0 2 σ h 0 3 = f s tan 2 π 4 + φ 2 e π an φ 1 C × cot φ + q ¯ × tan 2 π 4 + φ 2 e π an φ + γ B tan 2 π 4 + φ 2 e π an φ + 1 tan φ = q E + N u Δ U
N q = q c σ v 0 σ v 0 + 1 : bearing capacity factor, q t 1 = q t P atm σ v 0 P atm 0.5 : Stress-normalized cone resistance, σ v 0 : effective vertical stress, σ v 0 : total vertical stress, σ h 0 : total horizontal stress, σ h 0 : effective horizontal stress, P 0 : effective surcharge stress, q c : measurement cone resistance, q t : total cone tip resistance, and q c MCPT : measurement cone resistance for a cone with 2   cm 2 area.
Table 5. Summary of correlations presented in current research.
No.ParametersEquationsDetermination Coefficient ( R 2 )
1 q c D P I q c = 73.70 × D P I 0.762 0.96
2 q c q d q c = 1.225 × q d 0.98
3 D r q c D r % = 100 5.28 l n q d M P a 0.021 σ v c 0.85 0.96
4 D r q d D r % = 100 3.9 l n q c M P a 0.025 σ v c 1.37 0.95
5 D r D P I D r % = 283.33 × D P I 0.0434 0.96
6 φ q c φ = 14.069 ° + 4.977 ln q t 1 0.96
7 φ q d φ = 19.756 ° + 3.603 ln q d 1 0.95
8 φ D P I φ = 53.841 × D P I 0.105 0.97
9 φ D r φ = 0.184 × D r + 25.09 0.97
10 E D P I E = 133.59 × D P I 0.513 0.92
11 E q c E = 6.797 q c 0.89
12 E q d E = 4.839 q d 0.84
Disclaimer/Publisher’s Note: The statements, opinions and data contained in all publications are solely those of the individual author(s) and contributor(s) and not of MDPI and/or the editor(s). MDPI and/or the editor(s) disclaim responsibility for any injury to people or property resulting from any ideas, methods, instructions or products referred to in the content.