
Determination of the Critical State Line in Partially Frozen Sand


Abstract
1. Introduction
2. Materials and Methods
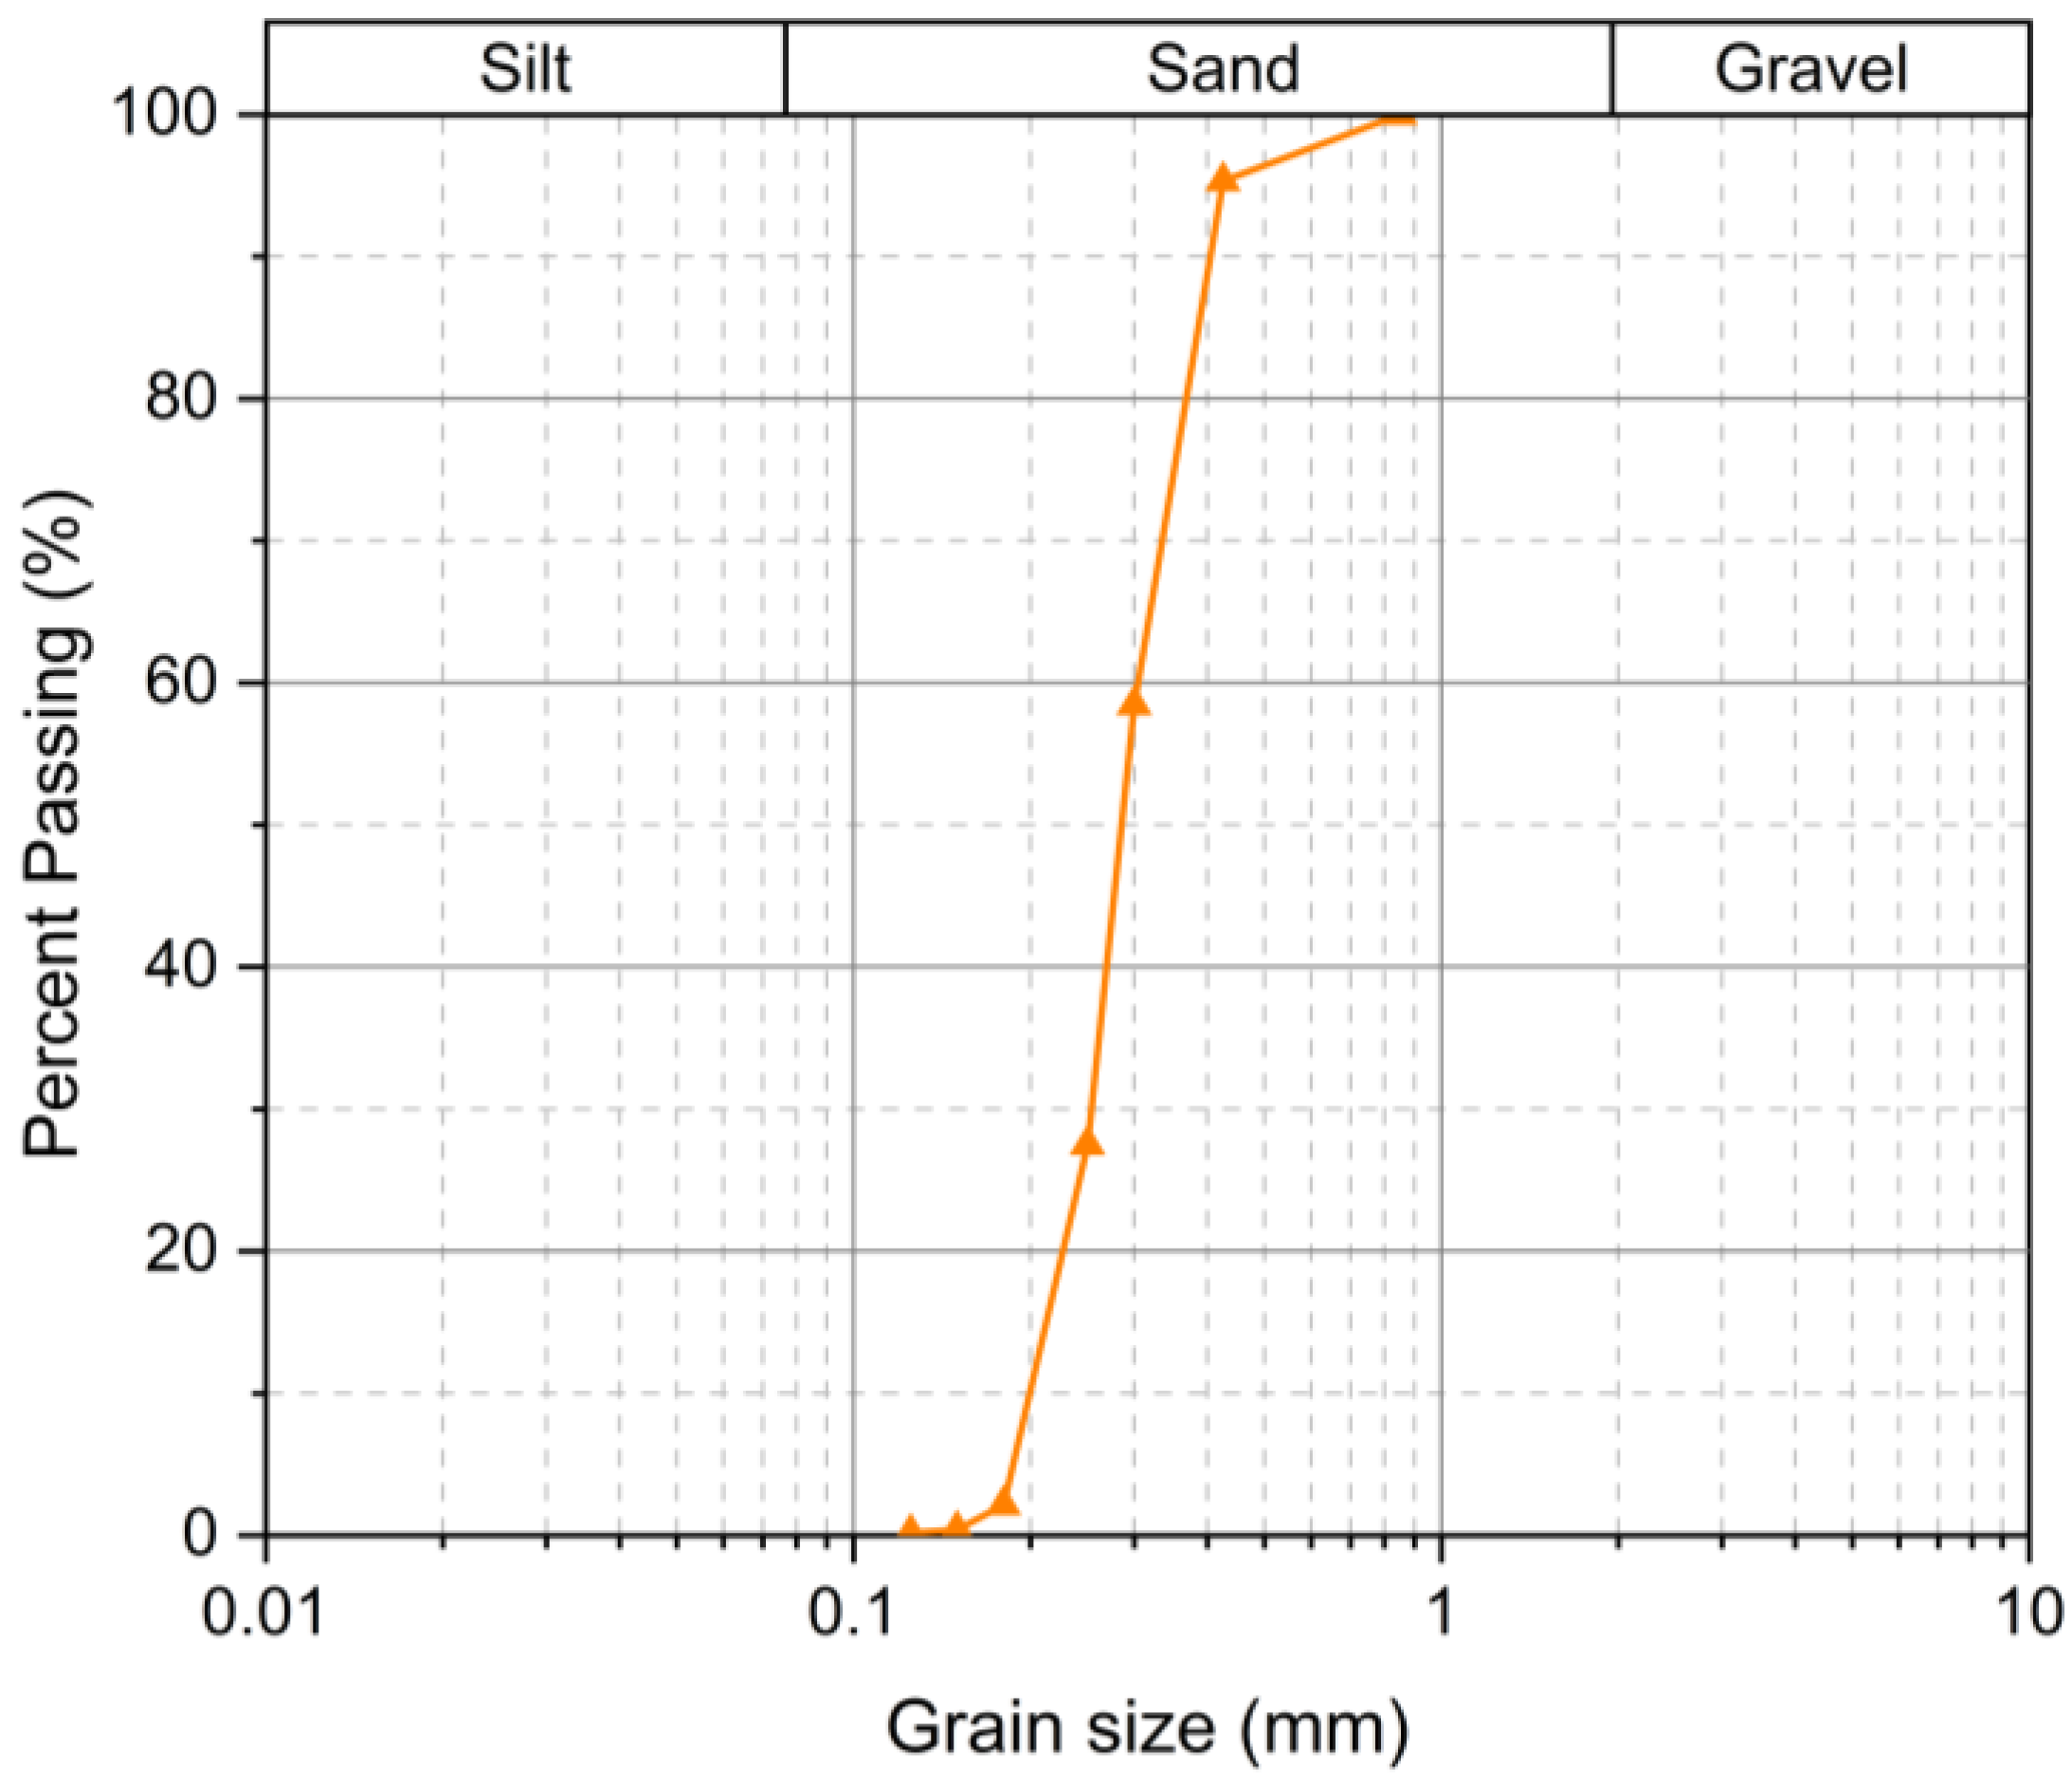
2.1. Material
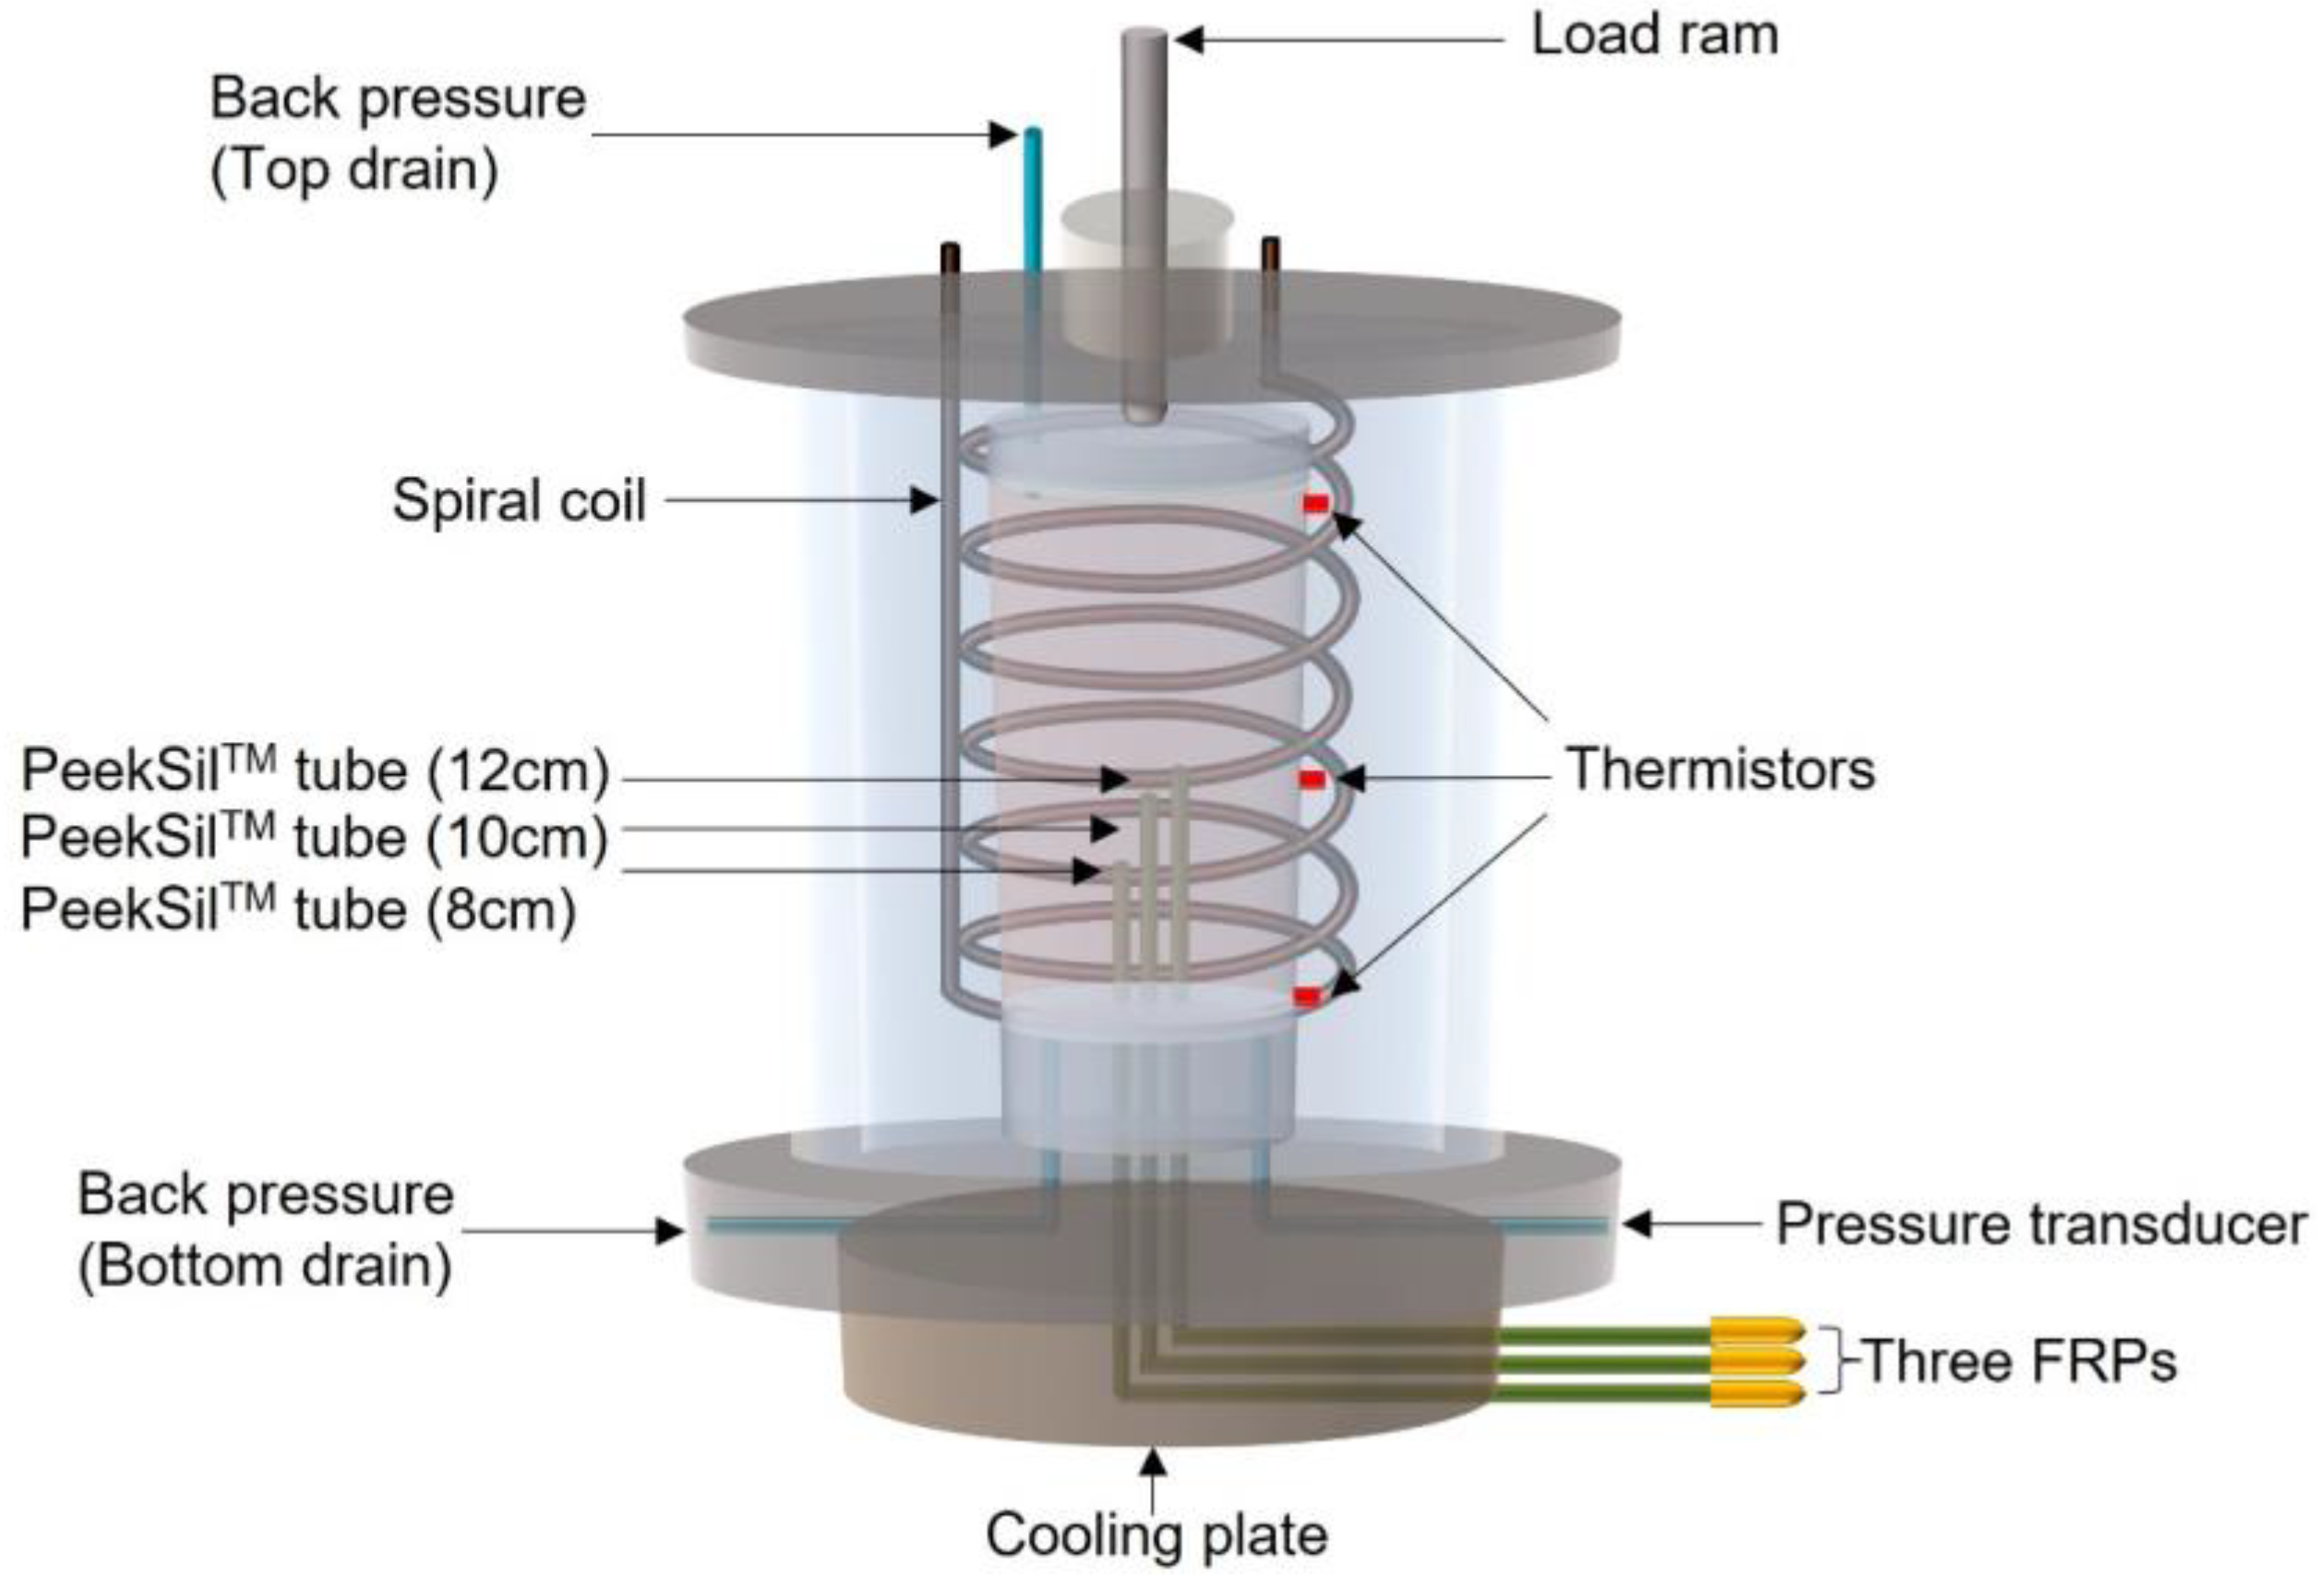
2.2. Test Apparatus
2.3. Test Procedures
- Sample preparation, saturation, and consolidation (room temperature): Loose and dense cylindrical samples with a diameter of 100 mm and a height of 196 mm were prepared by moist tamping and slurry deposition, respectively. The samples were then saturated with a back pressure of 400 kPa in the triaxial cell until the Skempton’s B value (, where and are changes in PWP and confining pressure) reached 0.97 or greater. Thereafter, each sample was isotropically consolidated at the target effective confining pressure ().
- Rapid freezing: The sample with the triaxial apparatus was moved into a cold room set to approximately 2 °C. The triaxial cell was insulated with fiberglass wrapped around the surface and enclosed in a foam box. The sample was then unidirectionally frozen by circulating liquid nitrogen through the base cooling plate, followed by maintaining a uniform temperature of around −11 °C using a spiral copper coil connected to a cold bath and another cold bath attached to the base cooling plate.
- Subsequent warming: The specimen was then uniformly warmed to the target temperature by raising the temperature of the two cold baths over approximately 36 to 42 h. The back pressure (400 kPa) and cell pressure remained constant during steps 2 and 3.
- Confirmation of continuity of the water phase: Continuity in the water phase was checked by increasing the back pressure independently of the applied cell pressure and measuring the corresponding increase in PWP of all sensors [31].
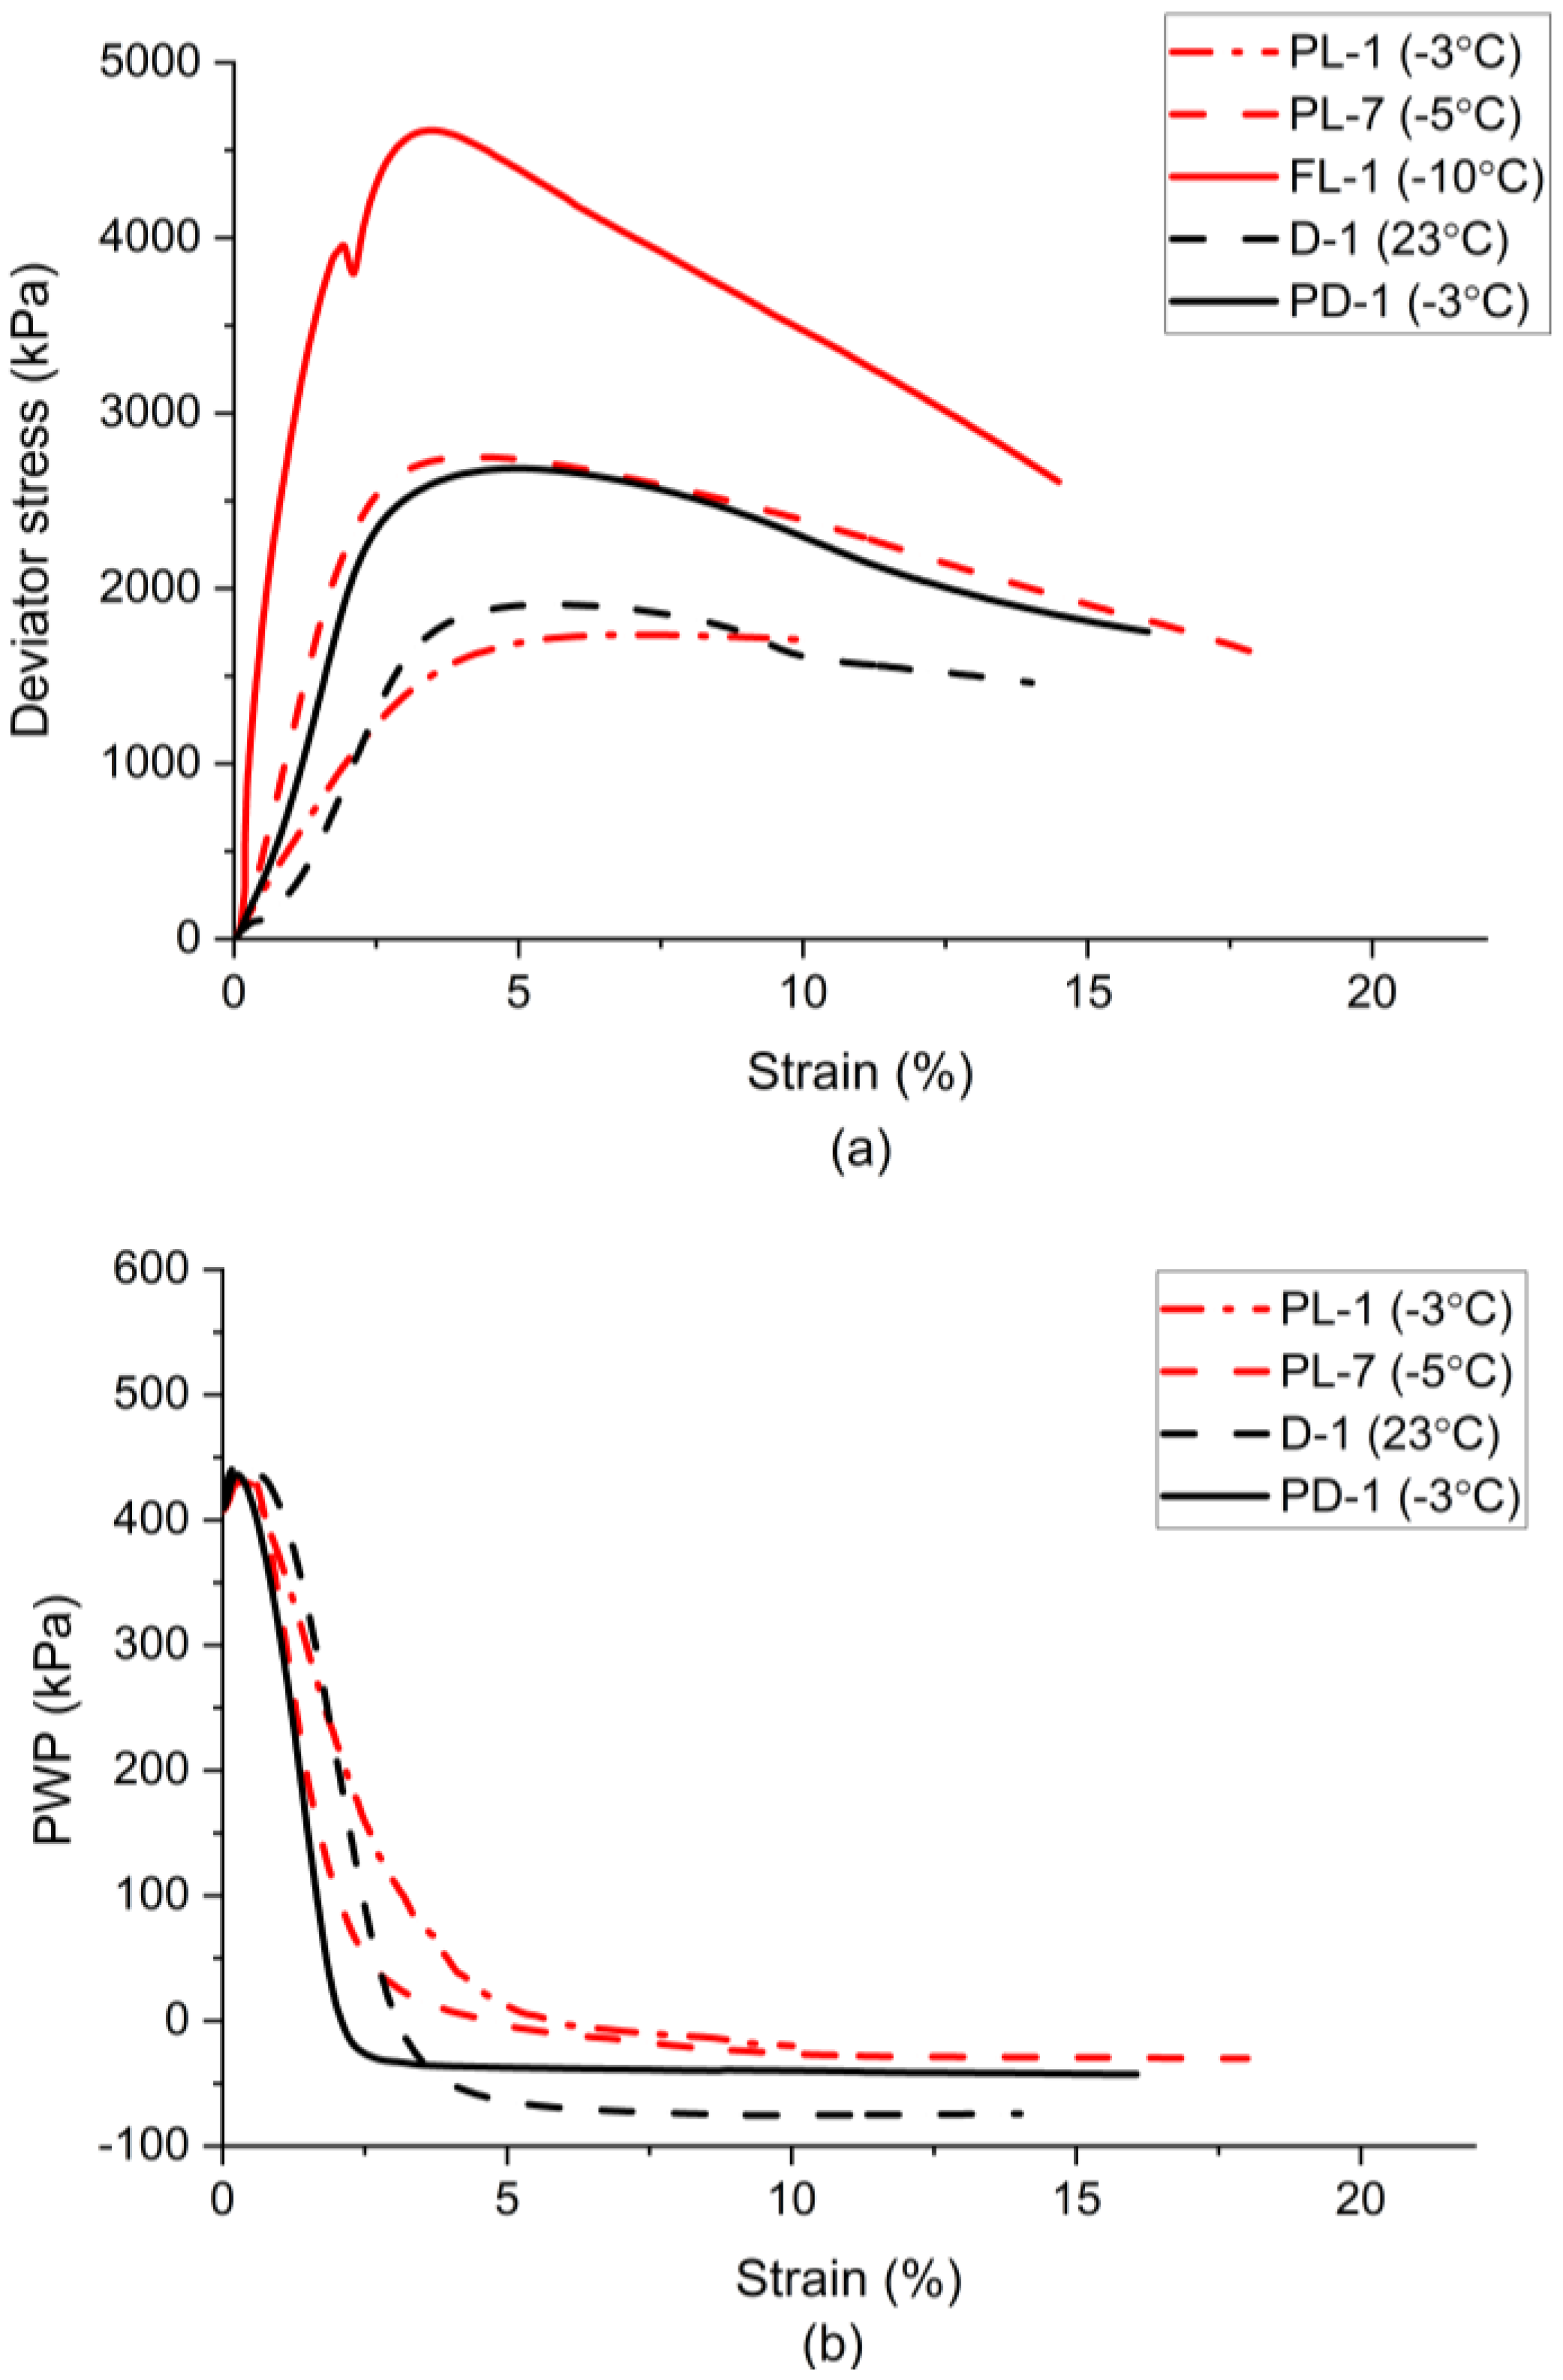
- Loading: Once the continuity of the water phase was confirmed, the sample was sheared at a constant strain rate under undrained or drained conditions. During the shear stage, the axial stress (), confining pressure (), displacement, PWP (), and temperature were recorded. These data were further used to obtain the deviator stress (), mean stress (), and strain.
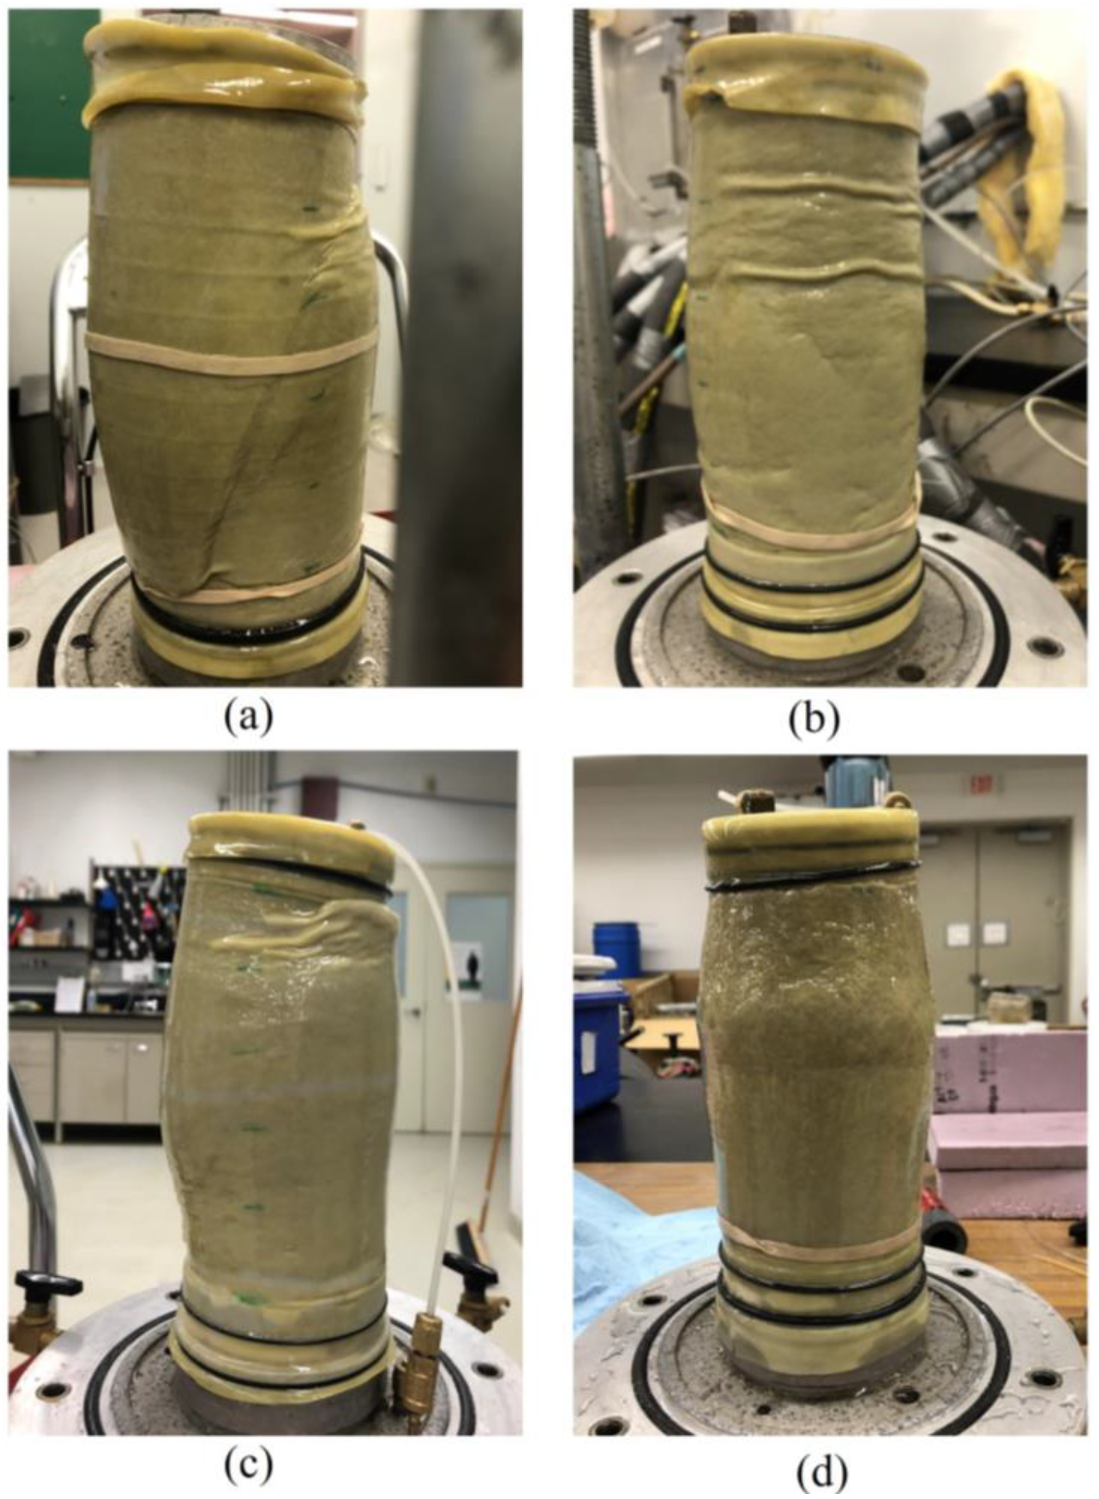
- For series (i), the unfrozen sample was sheared under undrained or drained conditions at room temperature after step 1. In series (iii), the drainage (back pressure) line was frozen for the sample at −10 °C, and the continuity in the water phase could not be confirmed by the base transducer and the internal FRPs. Therefore, the specimen FL-1 was considered frozen without a continuous water phase. Consequently, this sample followed similar steps as above, except for the absence of step 4 and the PWP measurement during step 5.
2.4. Void Ratio Calculation
3. Results
3.1. Behavior of Unfrozen Sand
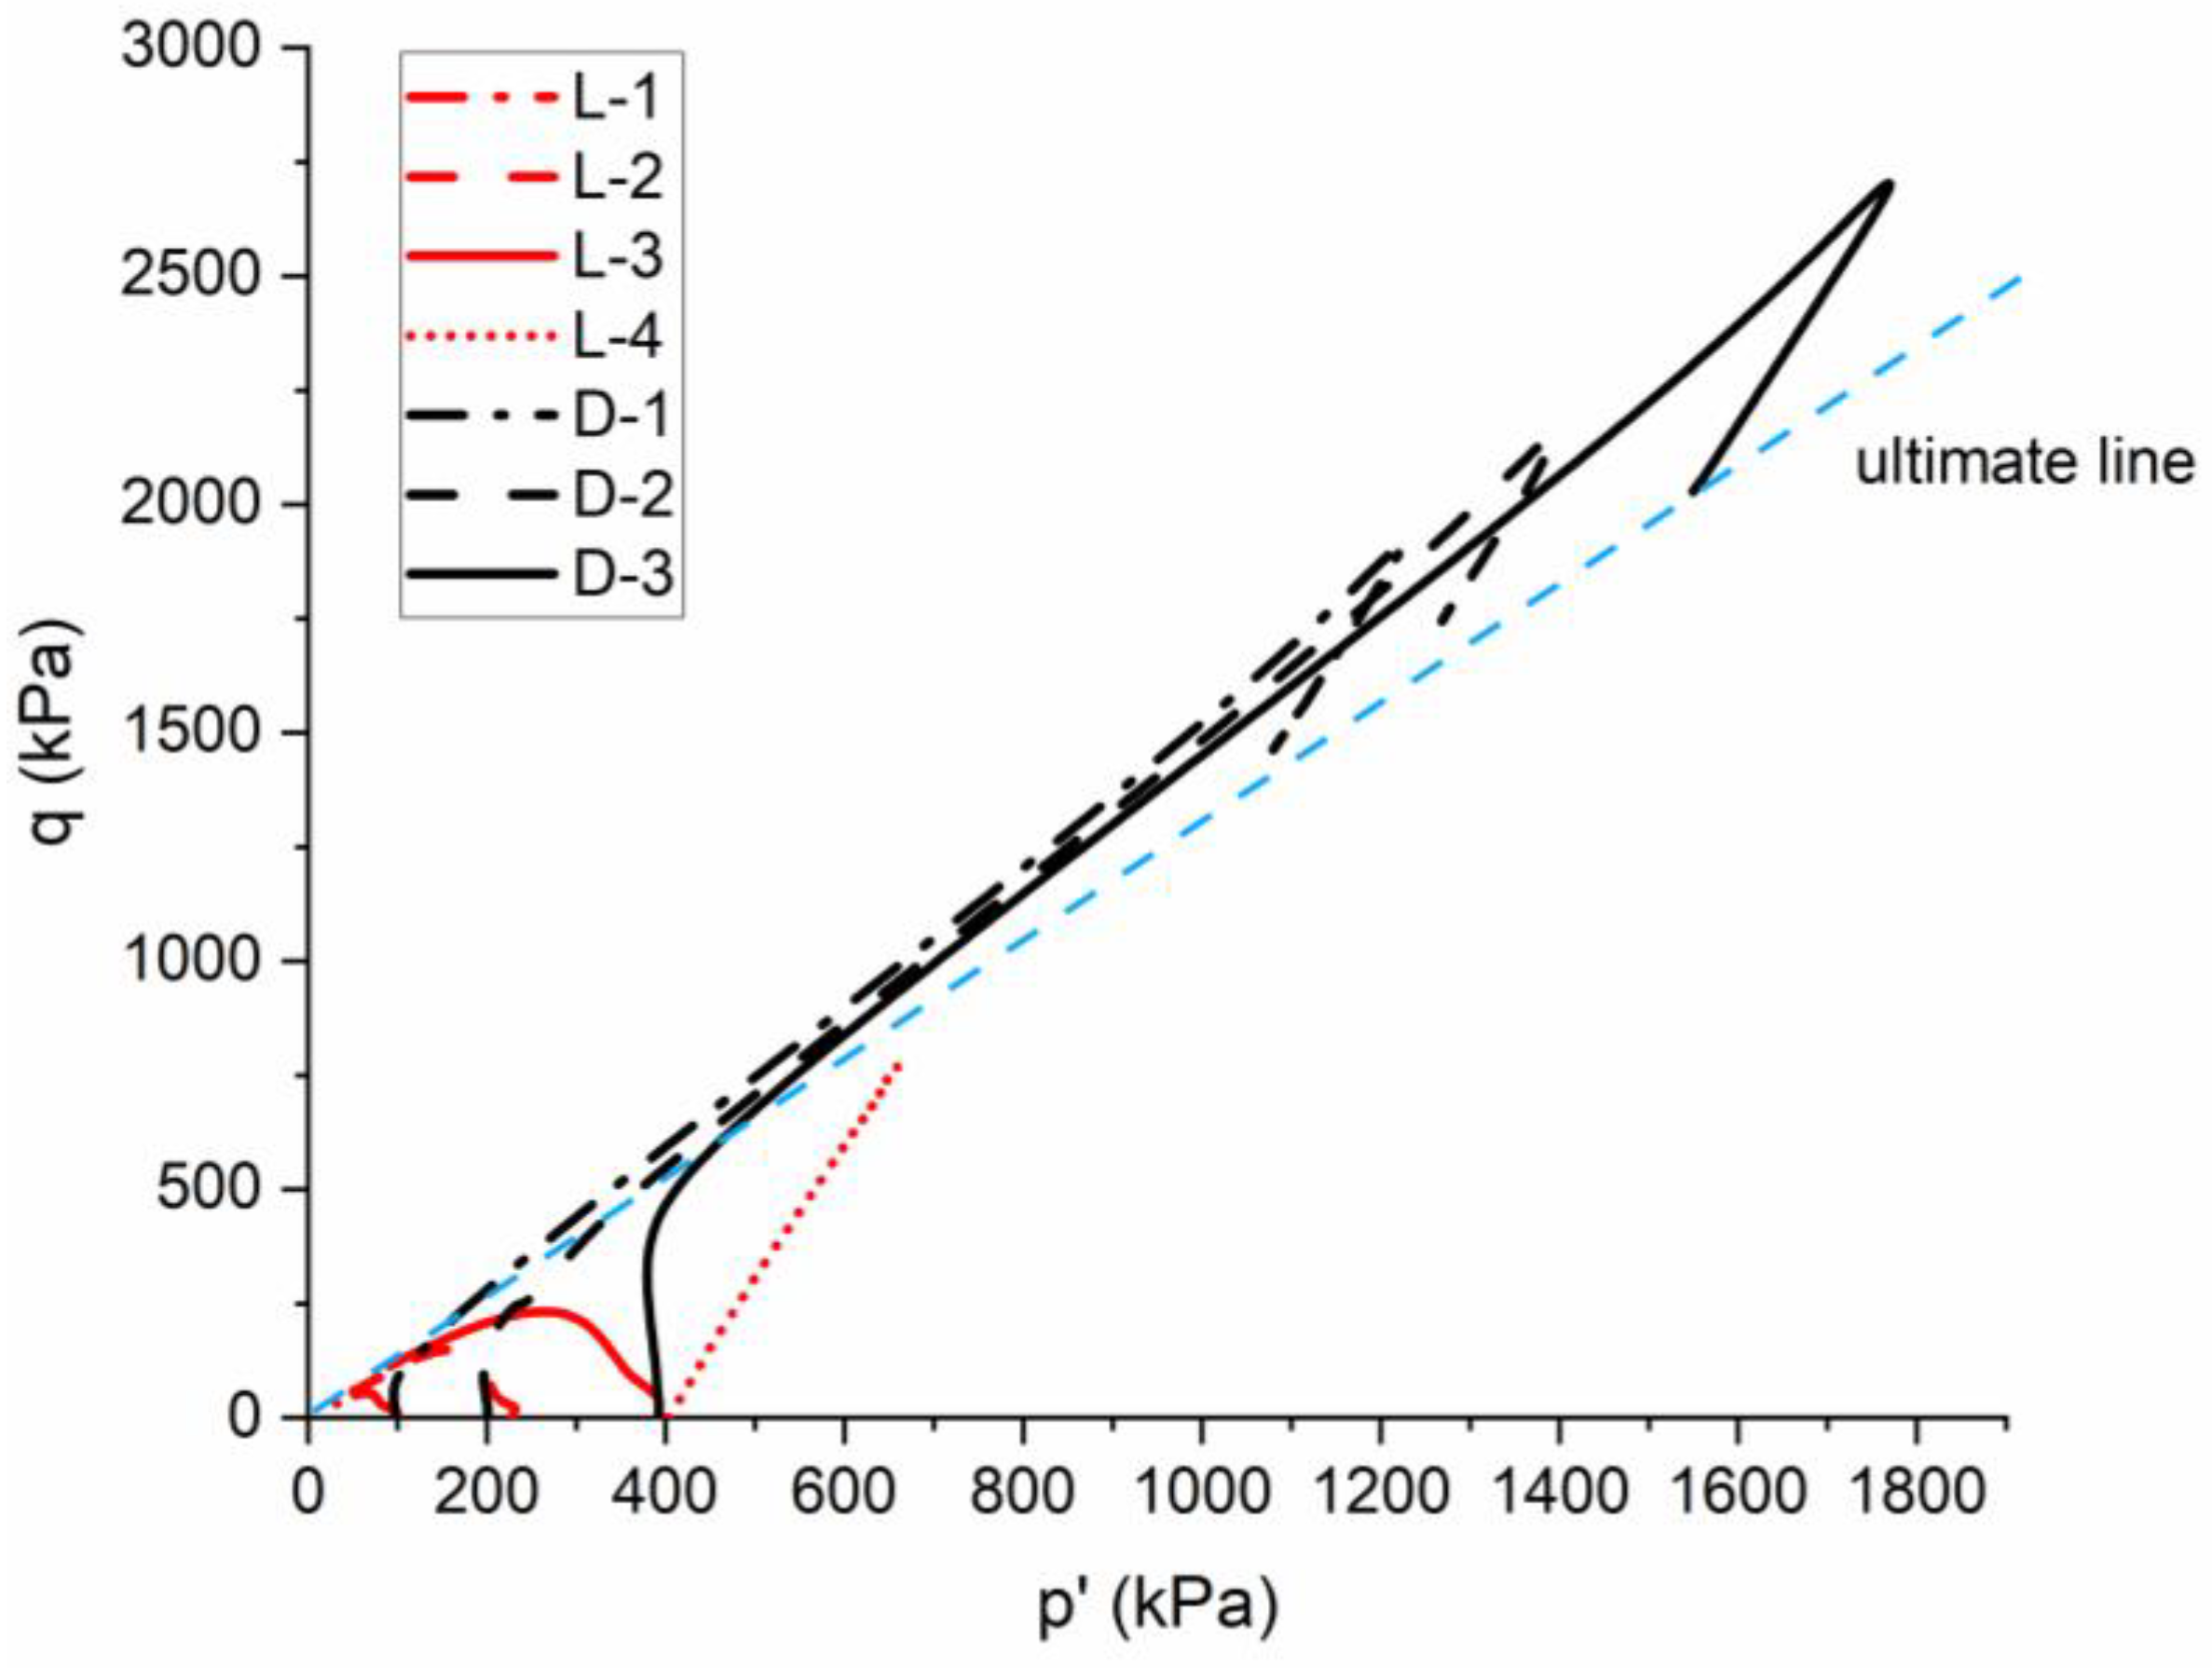
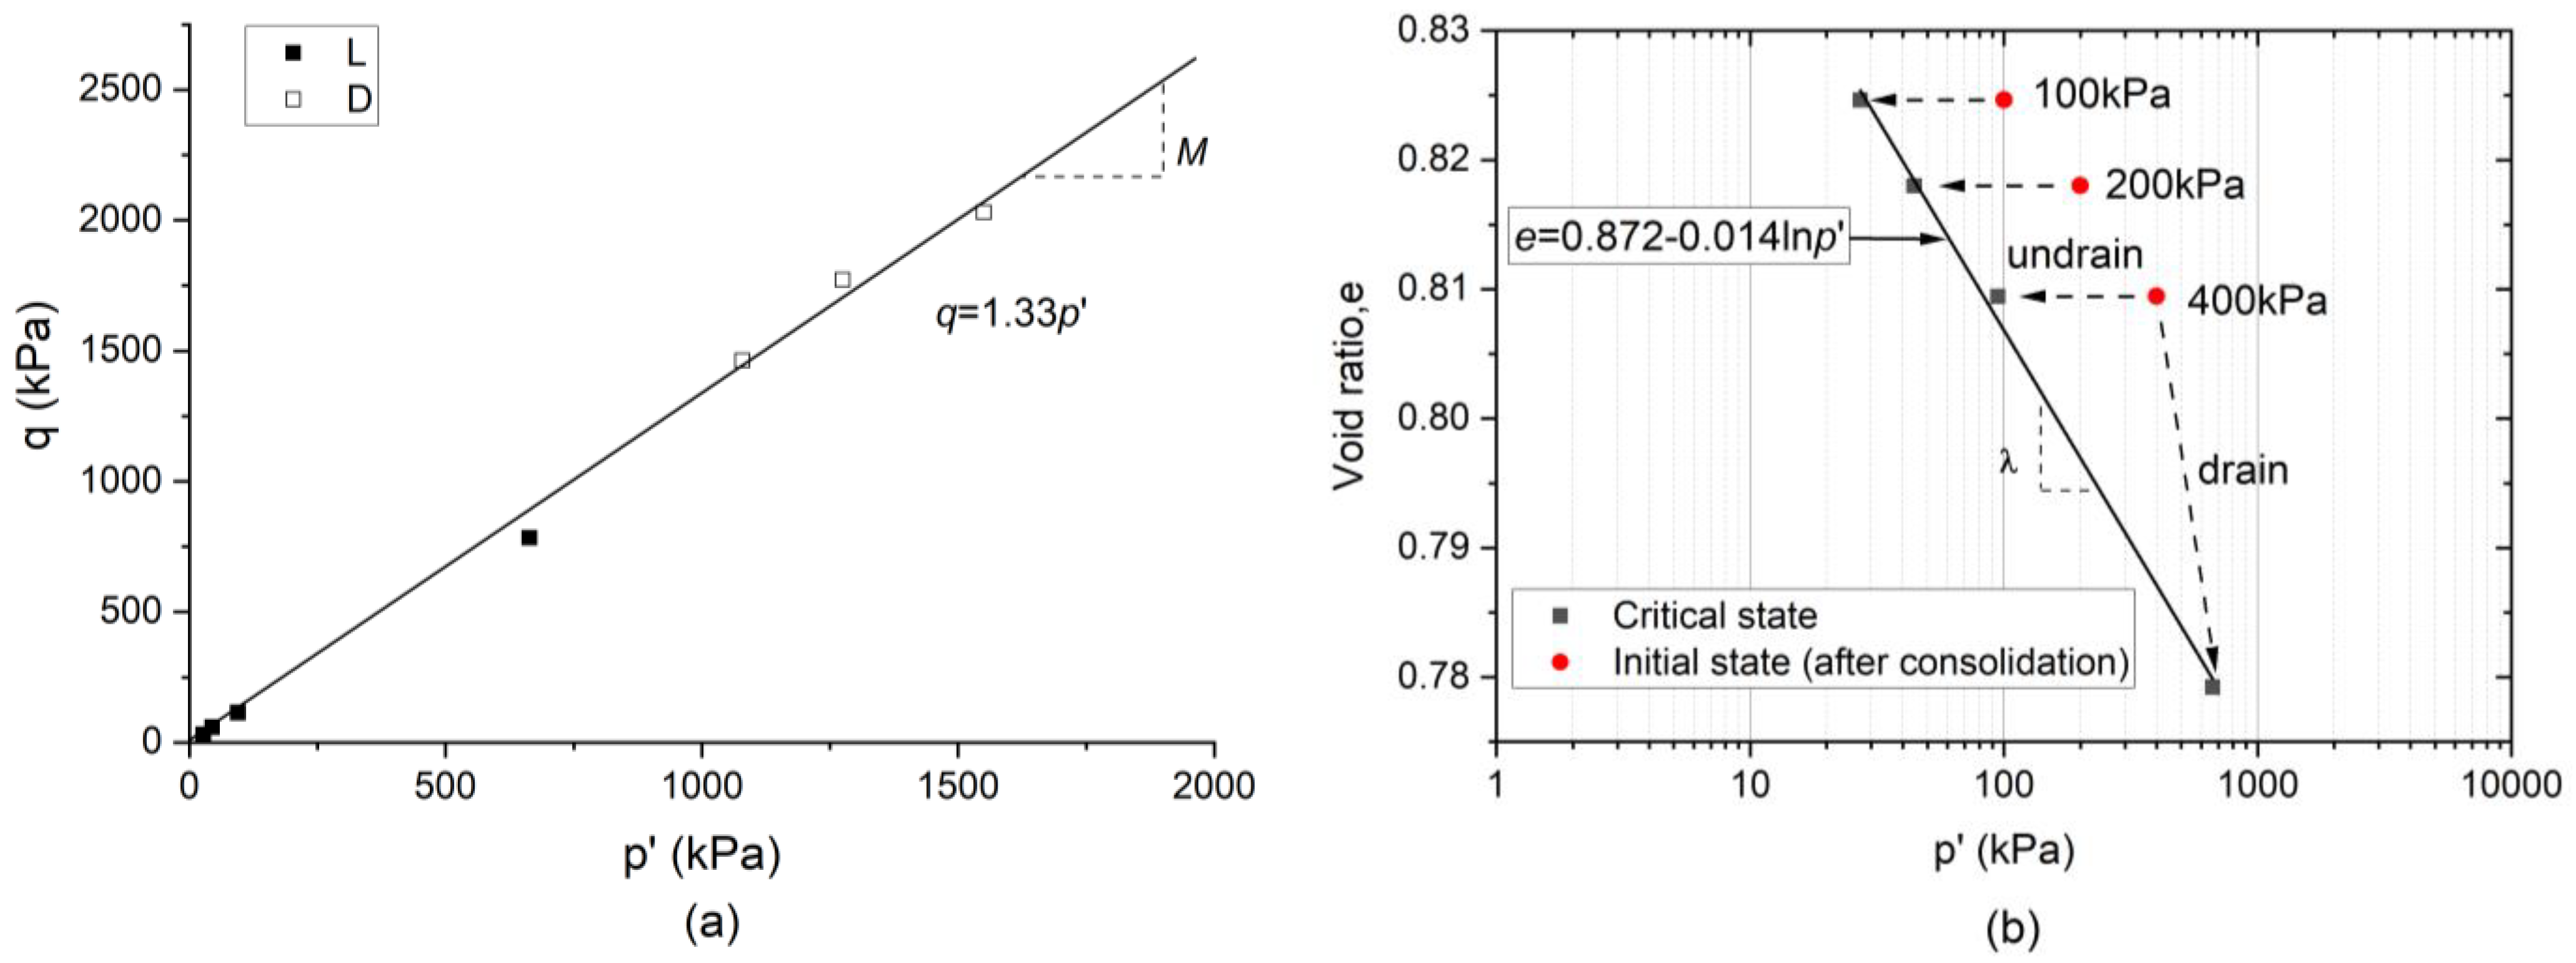
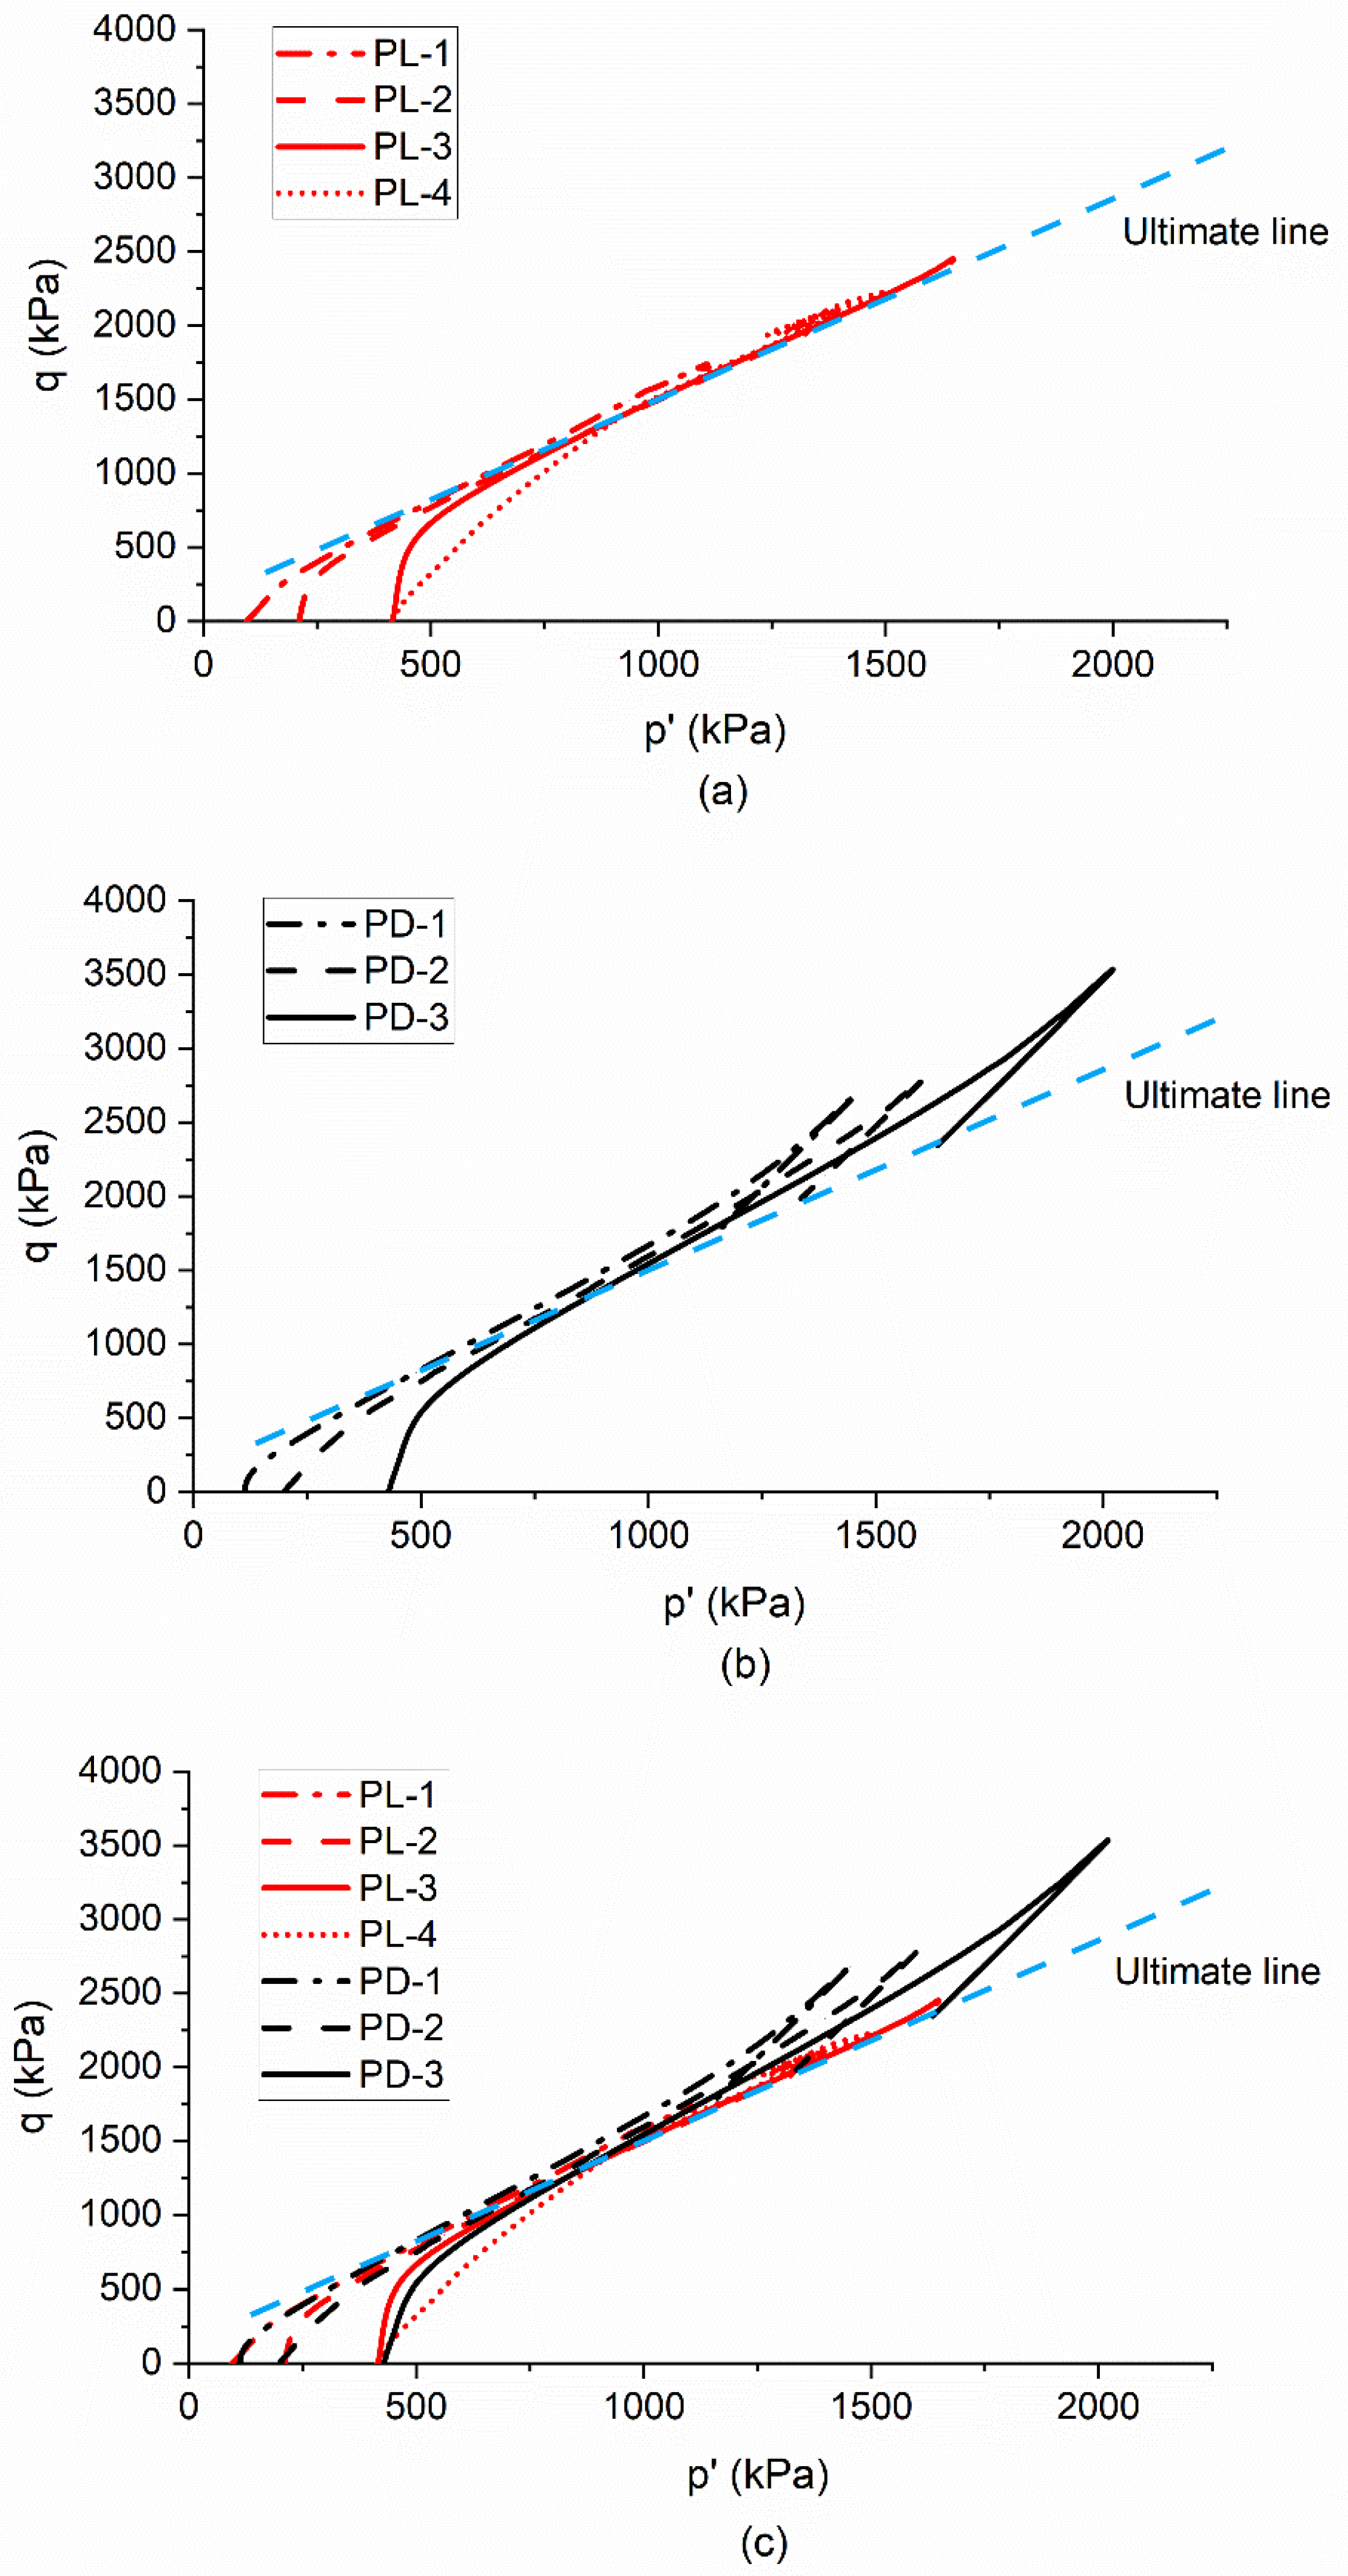
3.2. Effective Stress Path and CSL of Unfrozen Sand
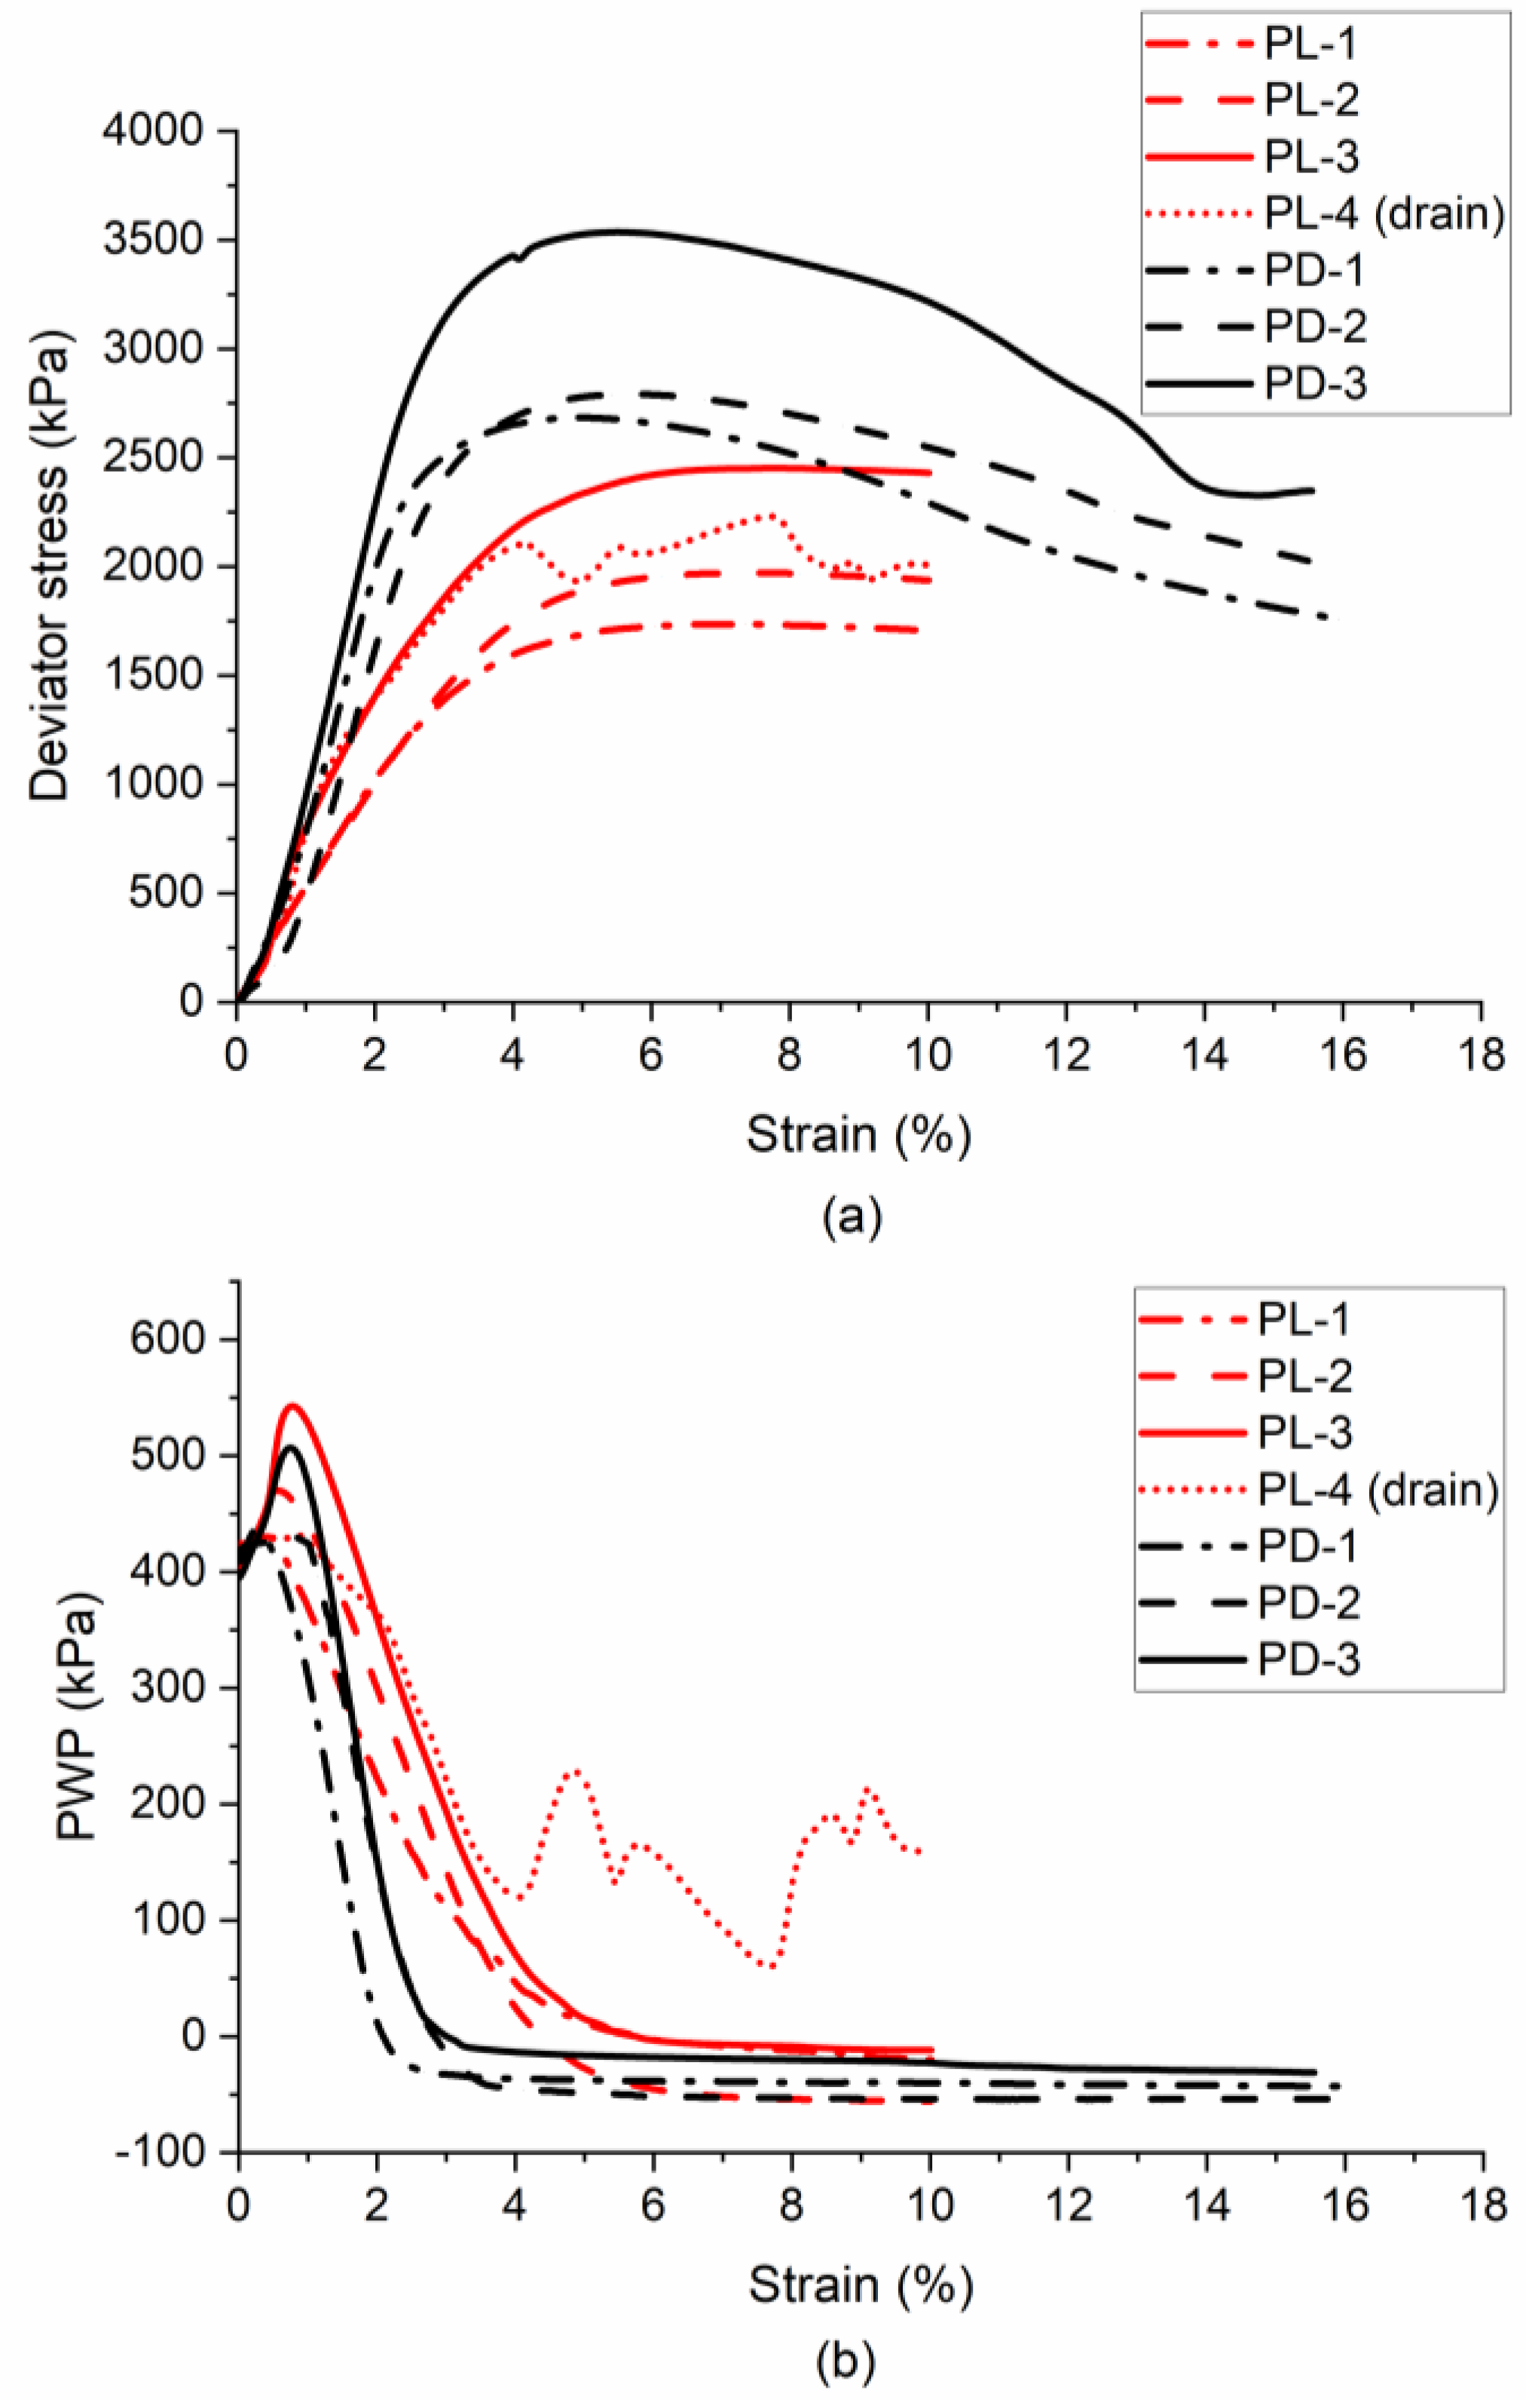
3.3. Behavior of Partially Frozen Sand (−3 °C)
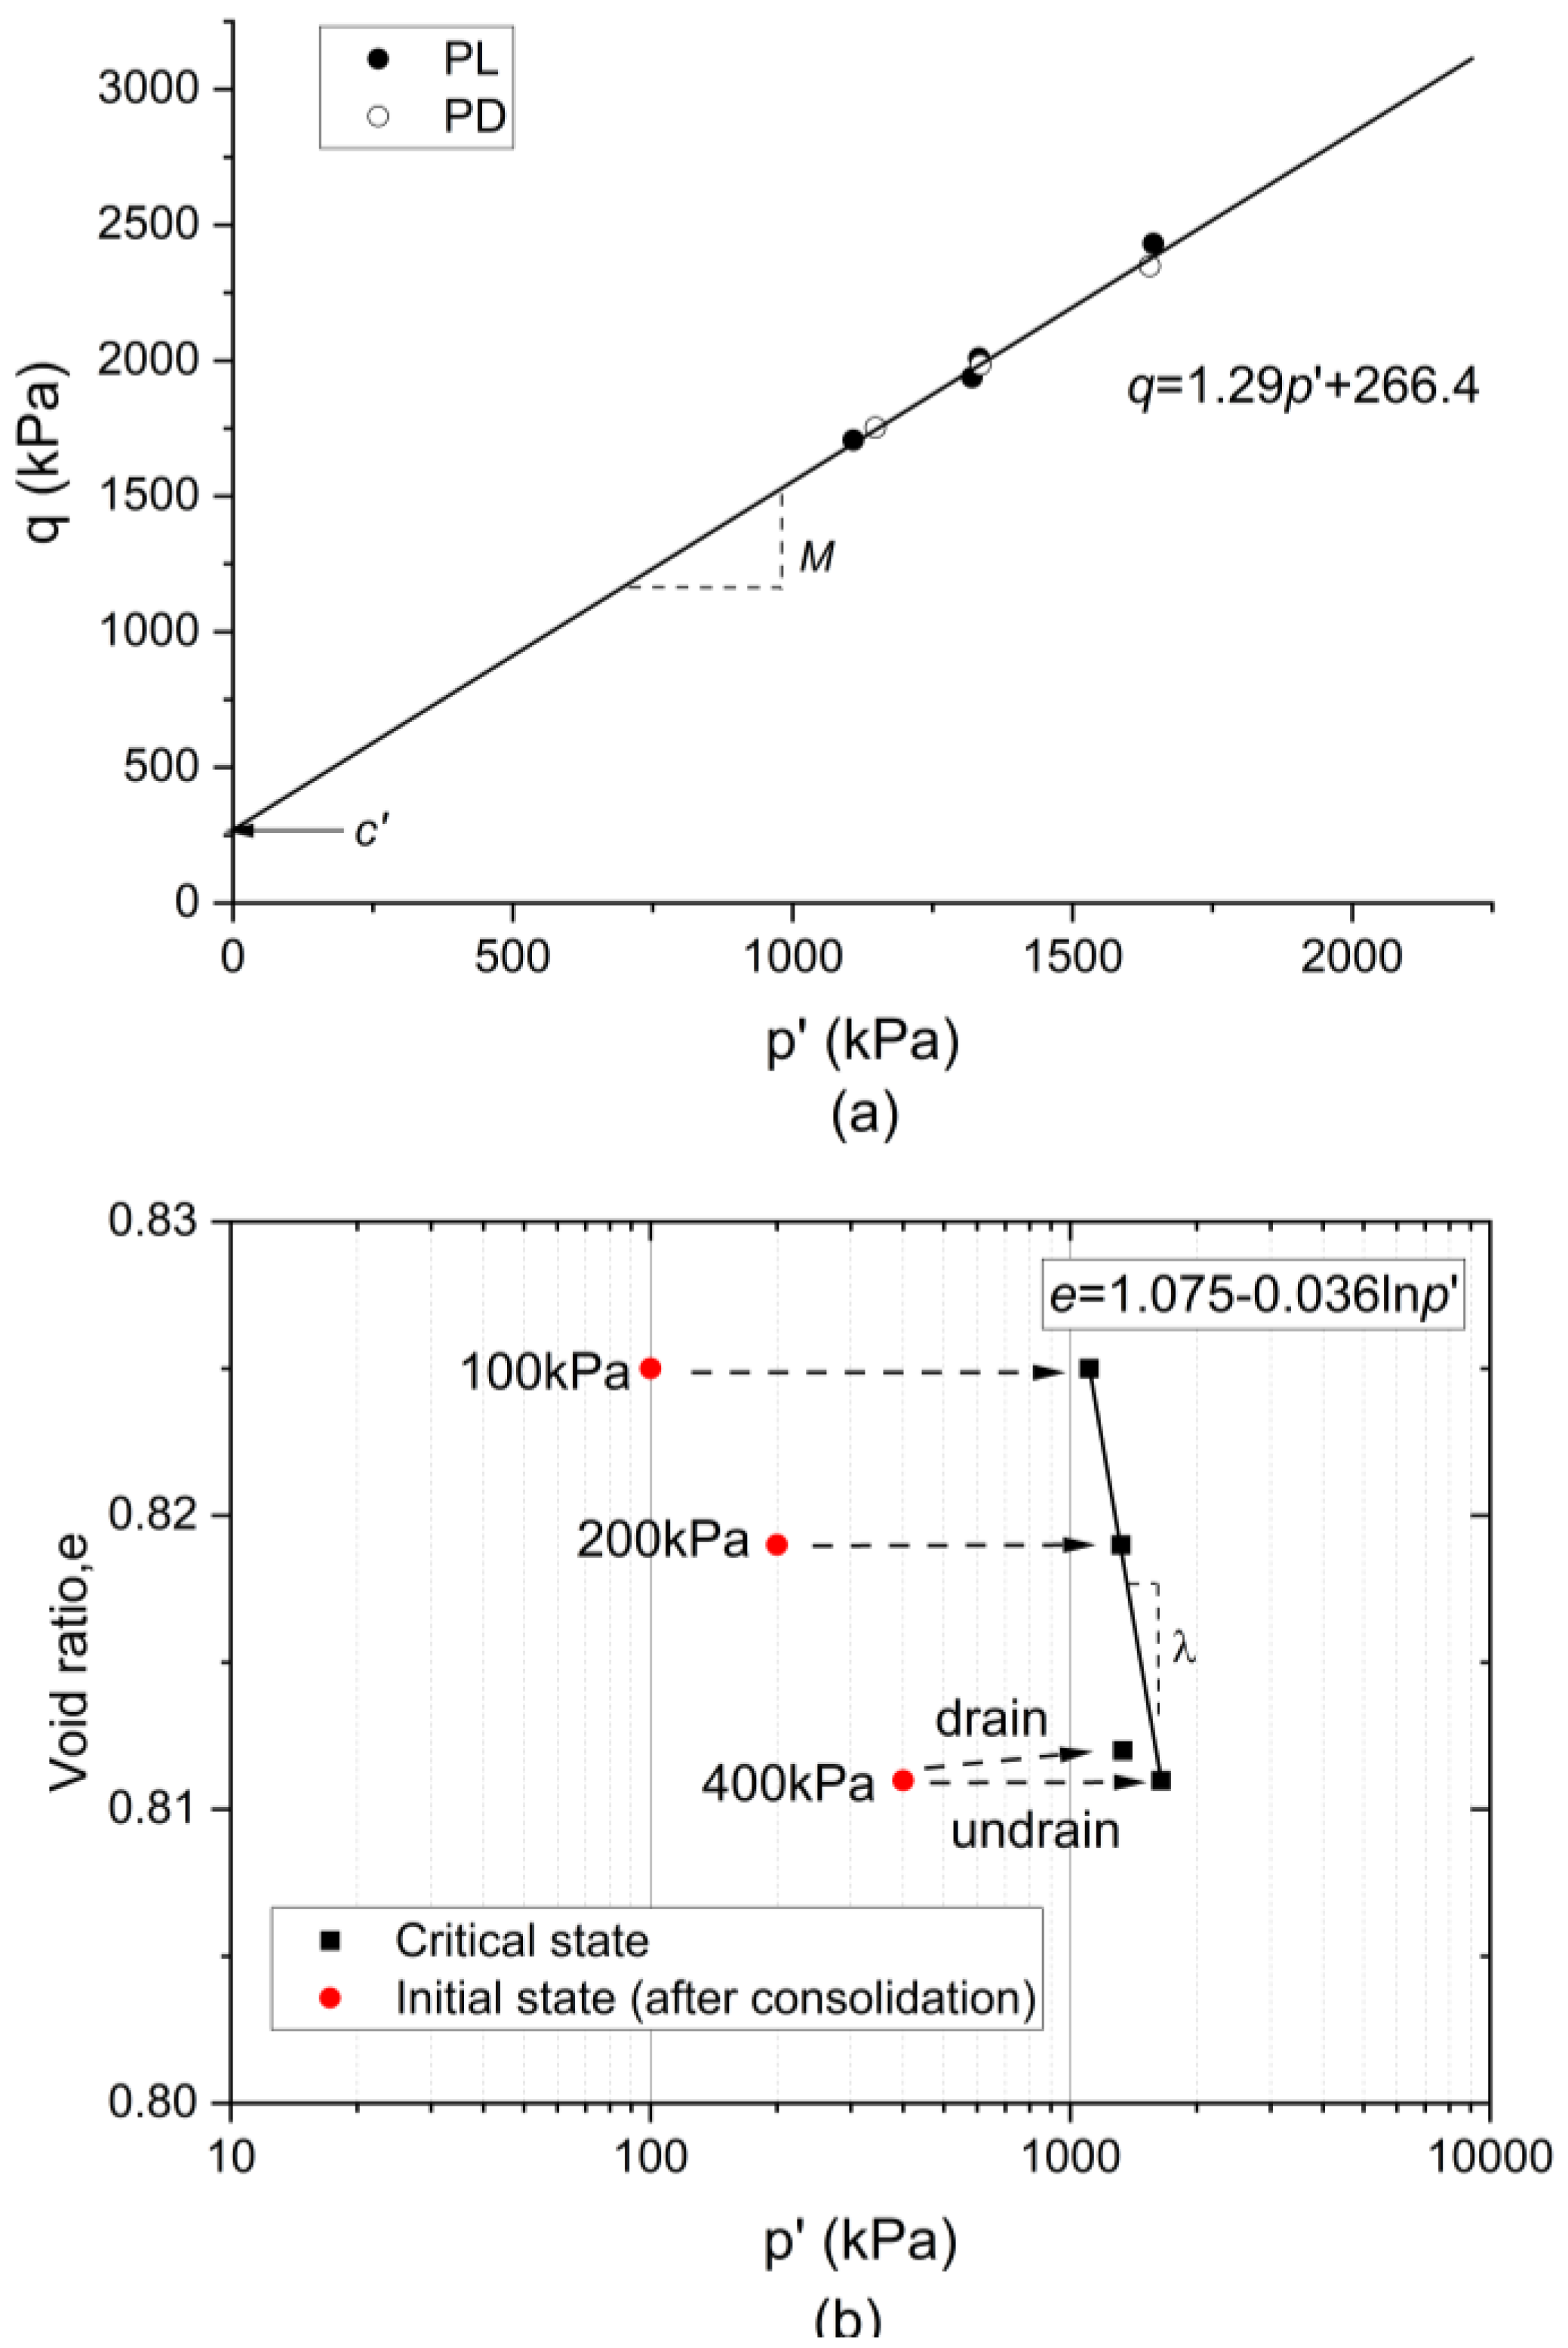
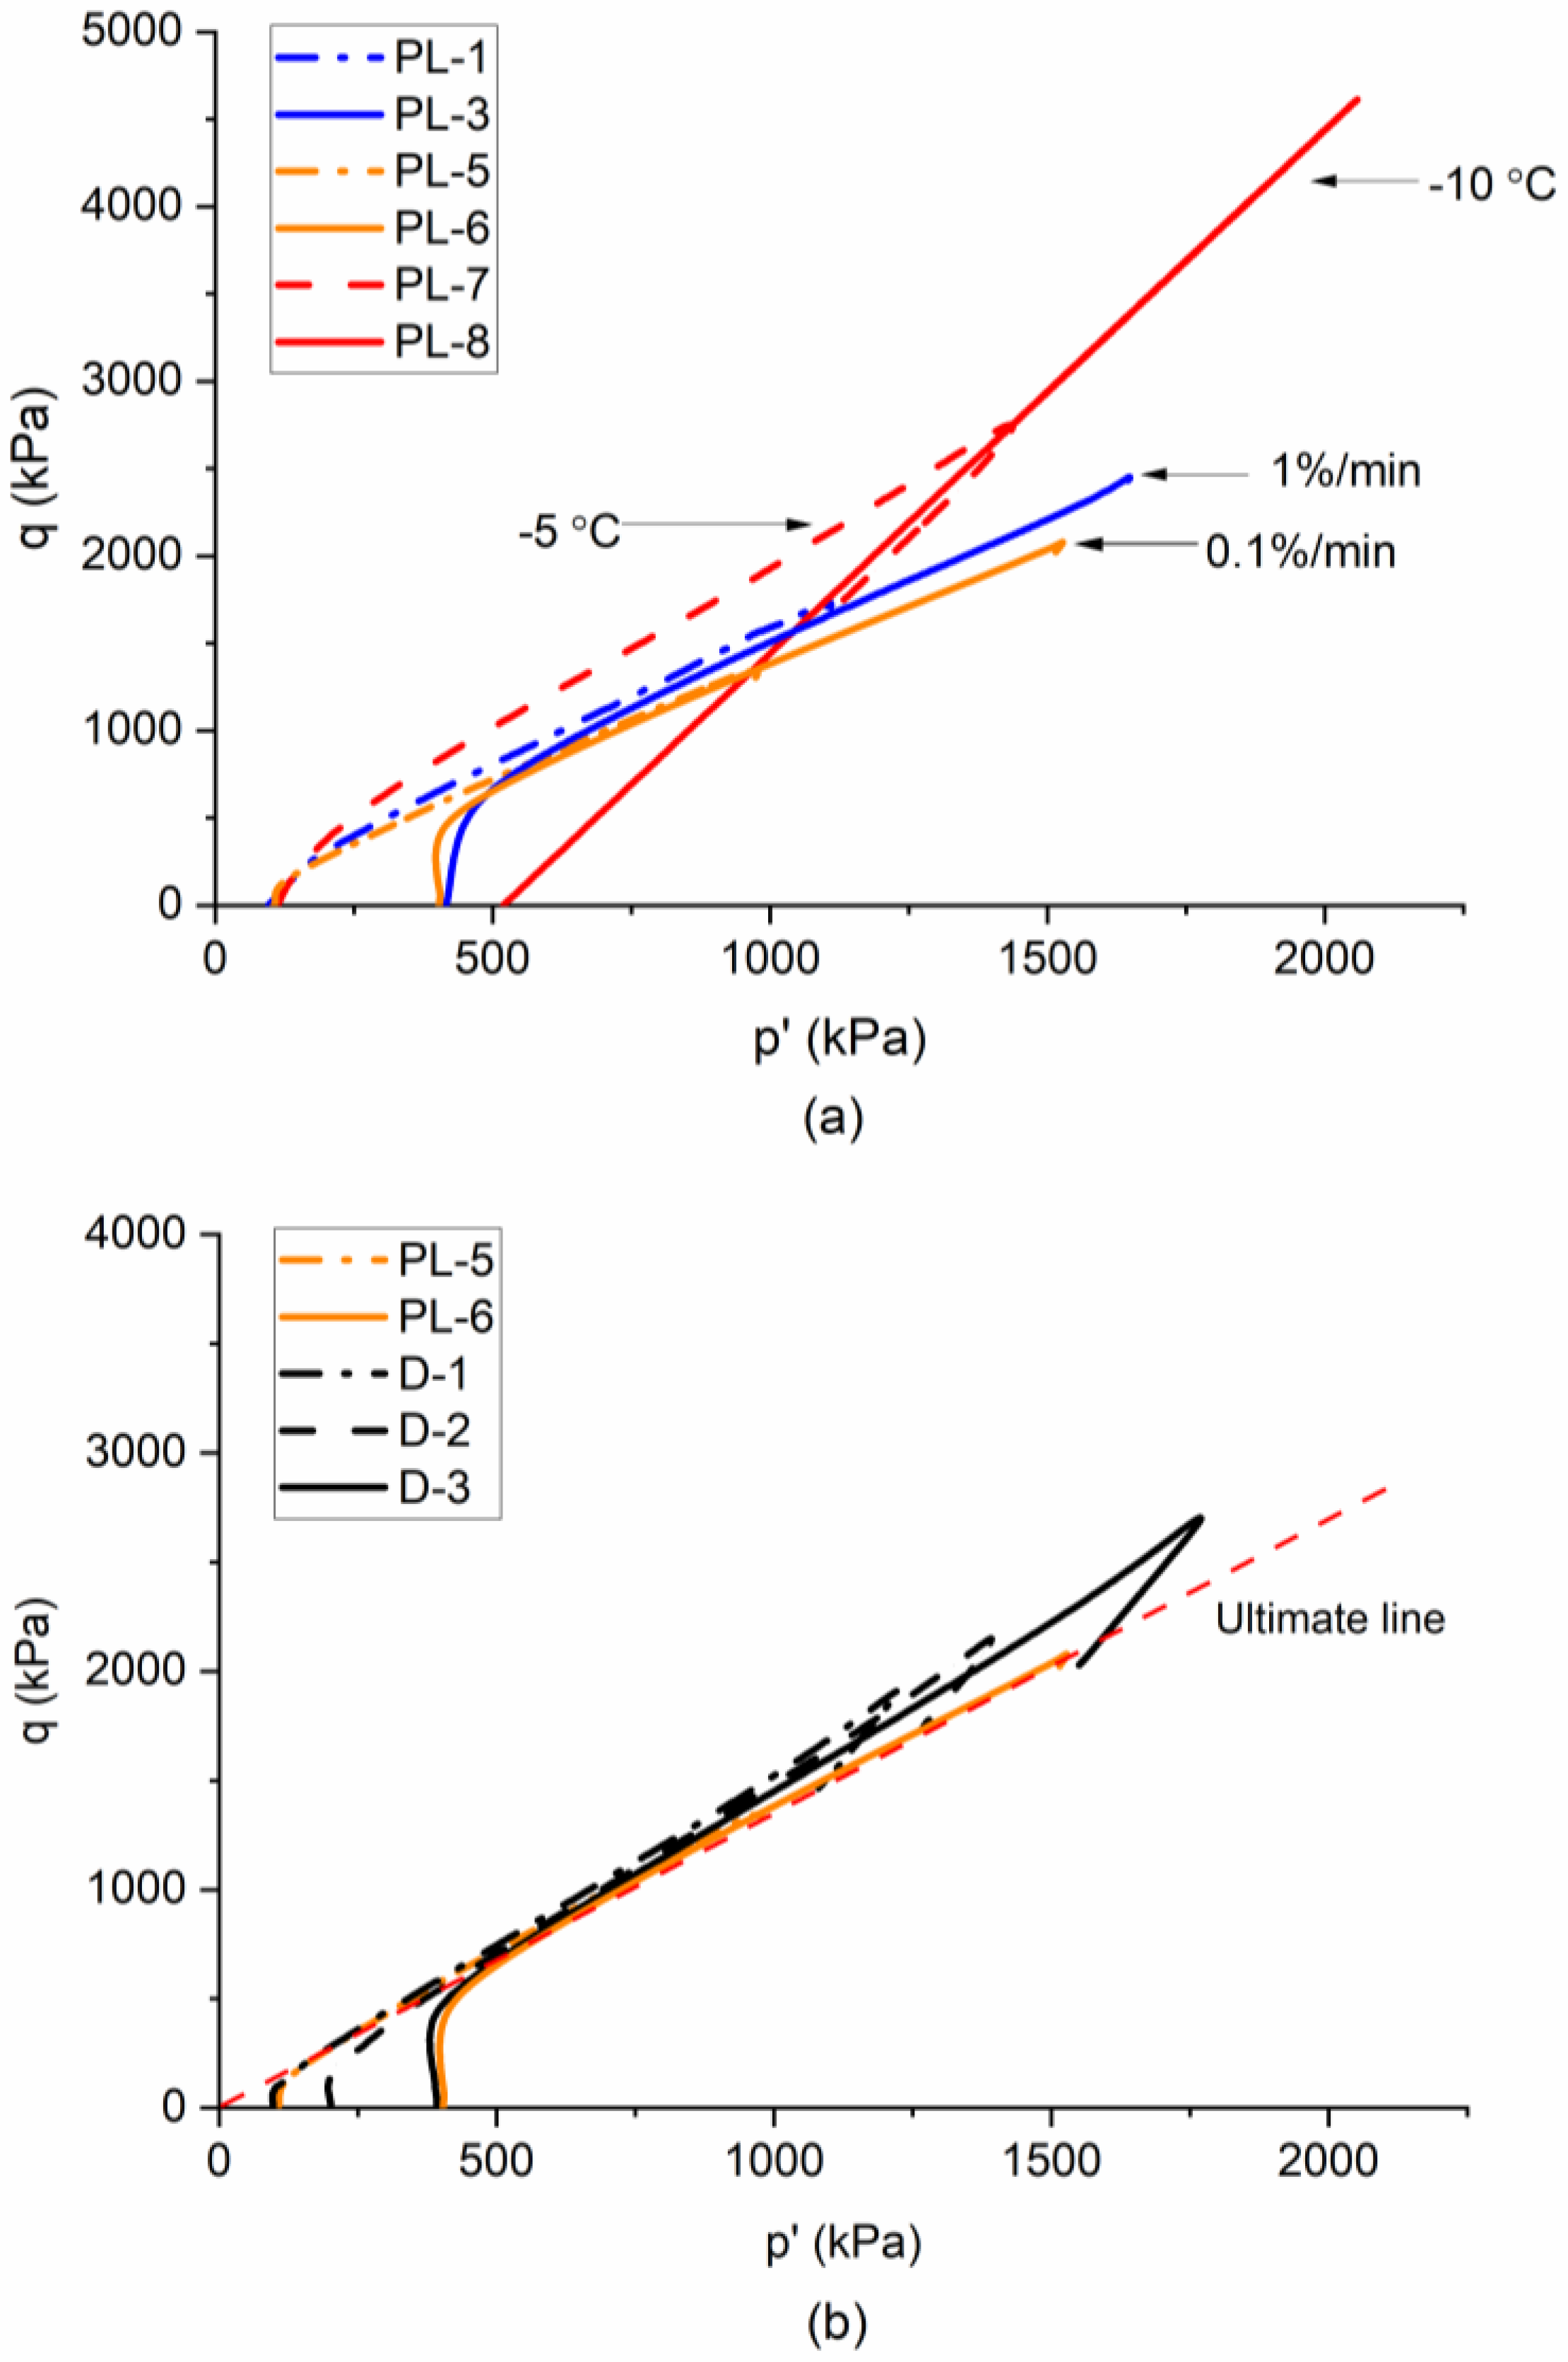
3.4. Effective Stress Path and CSL of Partially Frozen Sand (−3 °C)
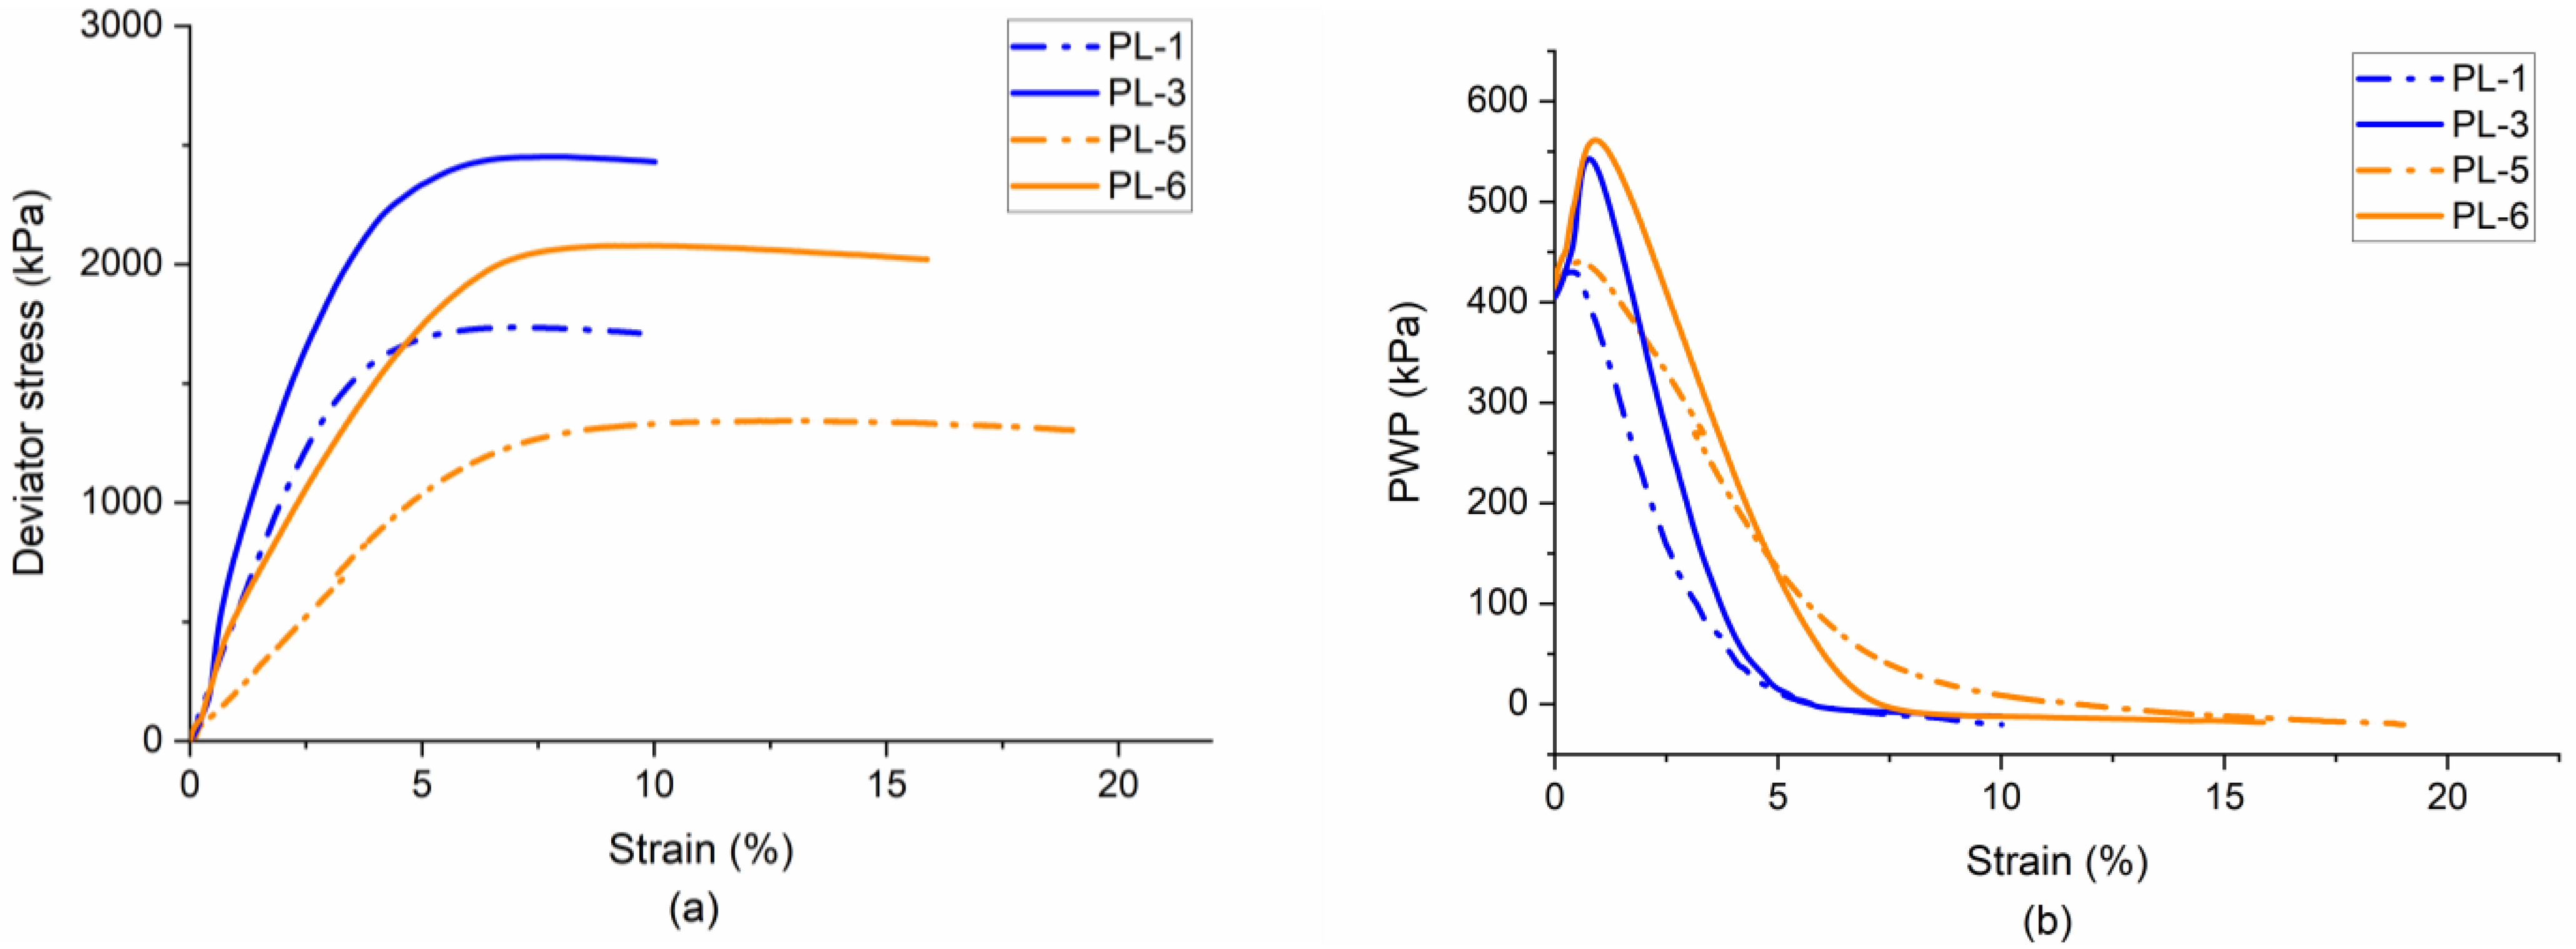
3.5. Effect of Temperature and Strain Rate on Behavior of Partially Frozen Sand
3.6. Effect of Temperature and Strain Rate on Effective Stress Path and CSL of Partially Frozen Sand
4. Discussion
5. Implication and Limitations
6. Conclusions
- A unique CSL exists in the stress (-) and void ratio - space for partially frozen sand at a temperature of −3 °C, as well as for the unfrozen sand.
- In - space, the temperature (above −5 °C) only affects the critical state cohesion () not the critical state friction angle (). The critical state friction angle is mainly controlled by the intrinsic properties of sand grains, while the critical state cohesion is mainly associated with the pore ice and is governed by temperature, strain rate, failure mode, stress level.
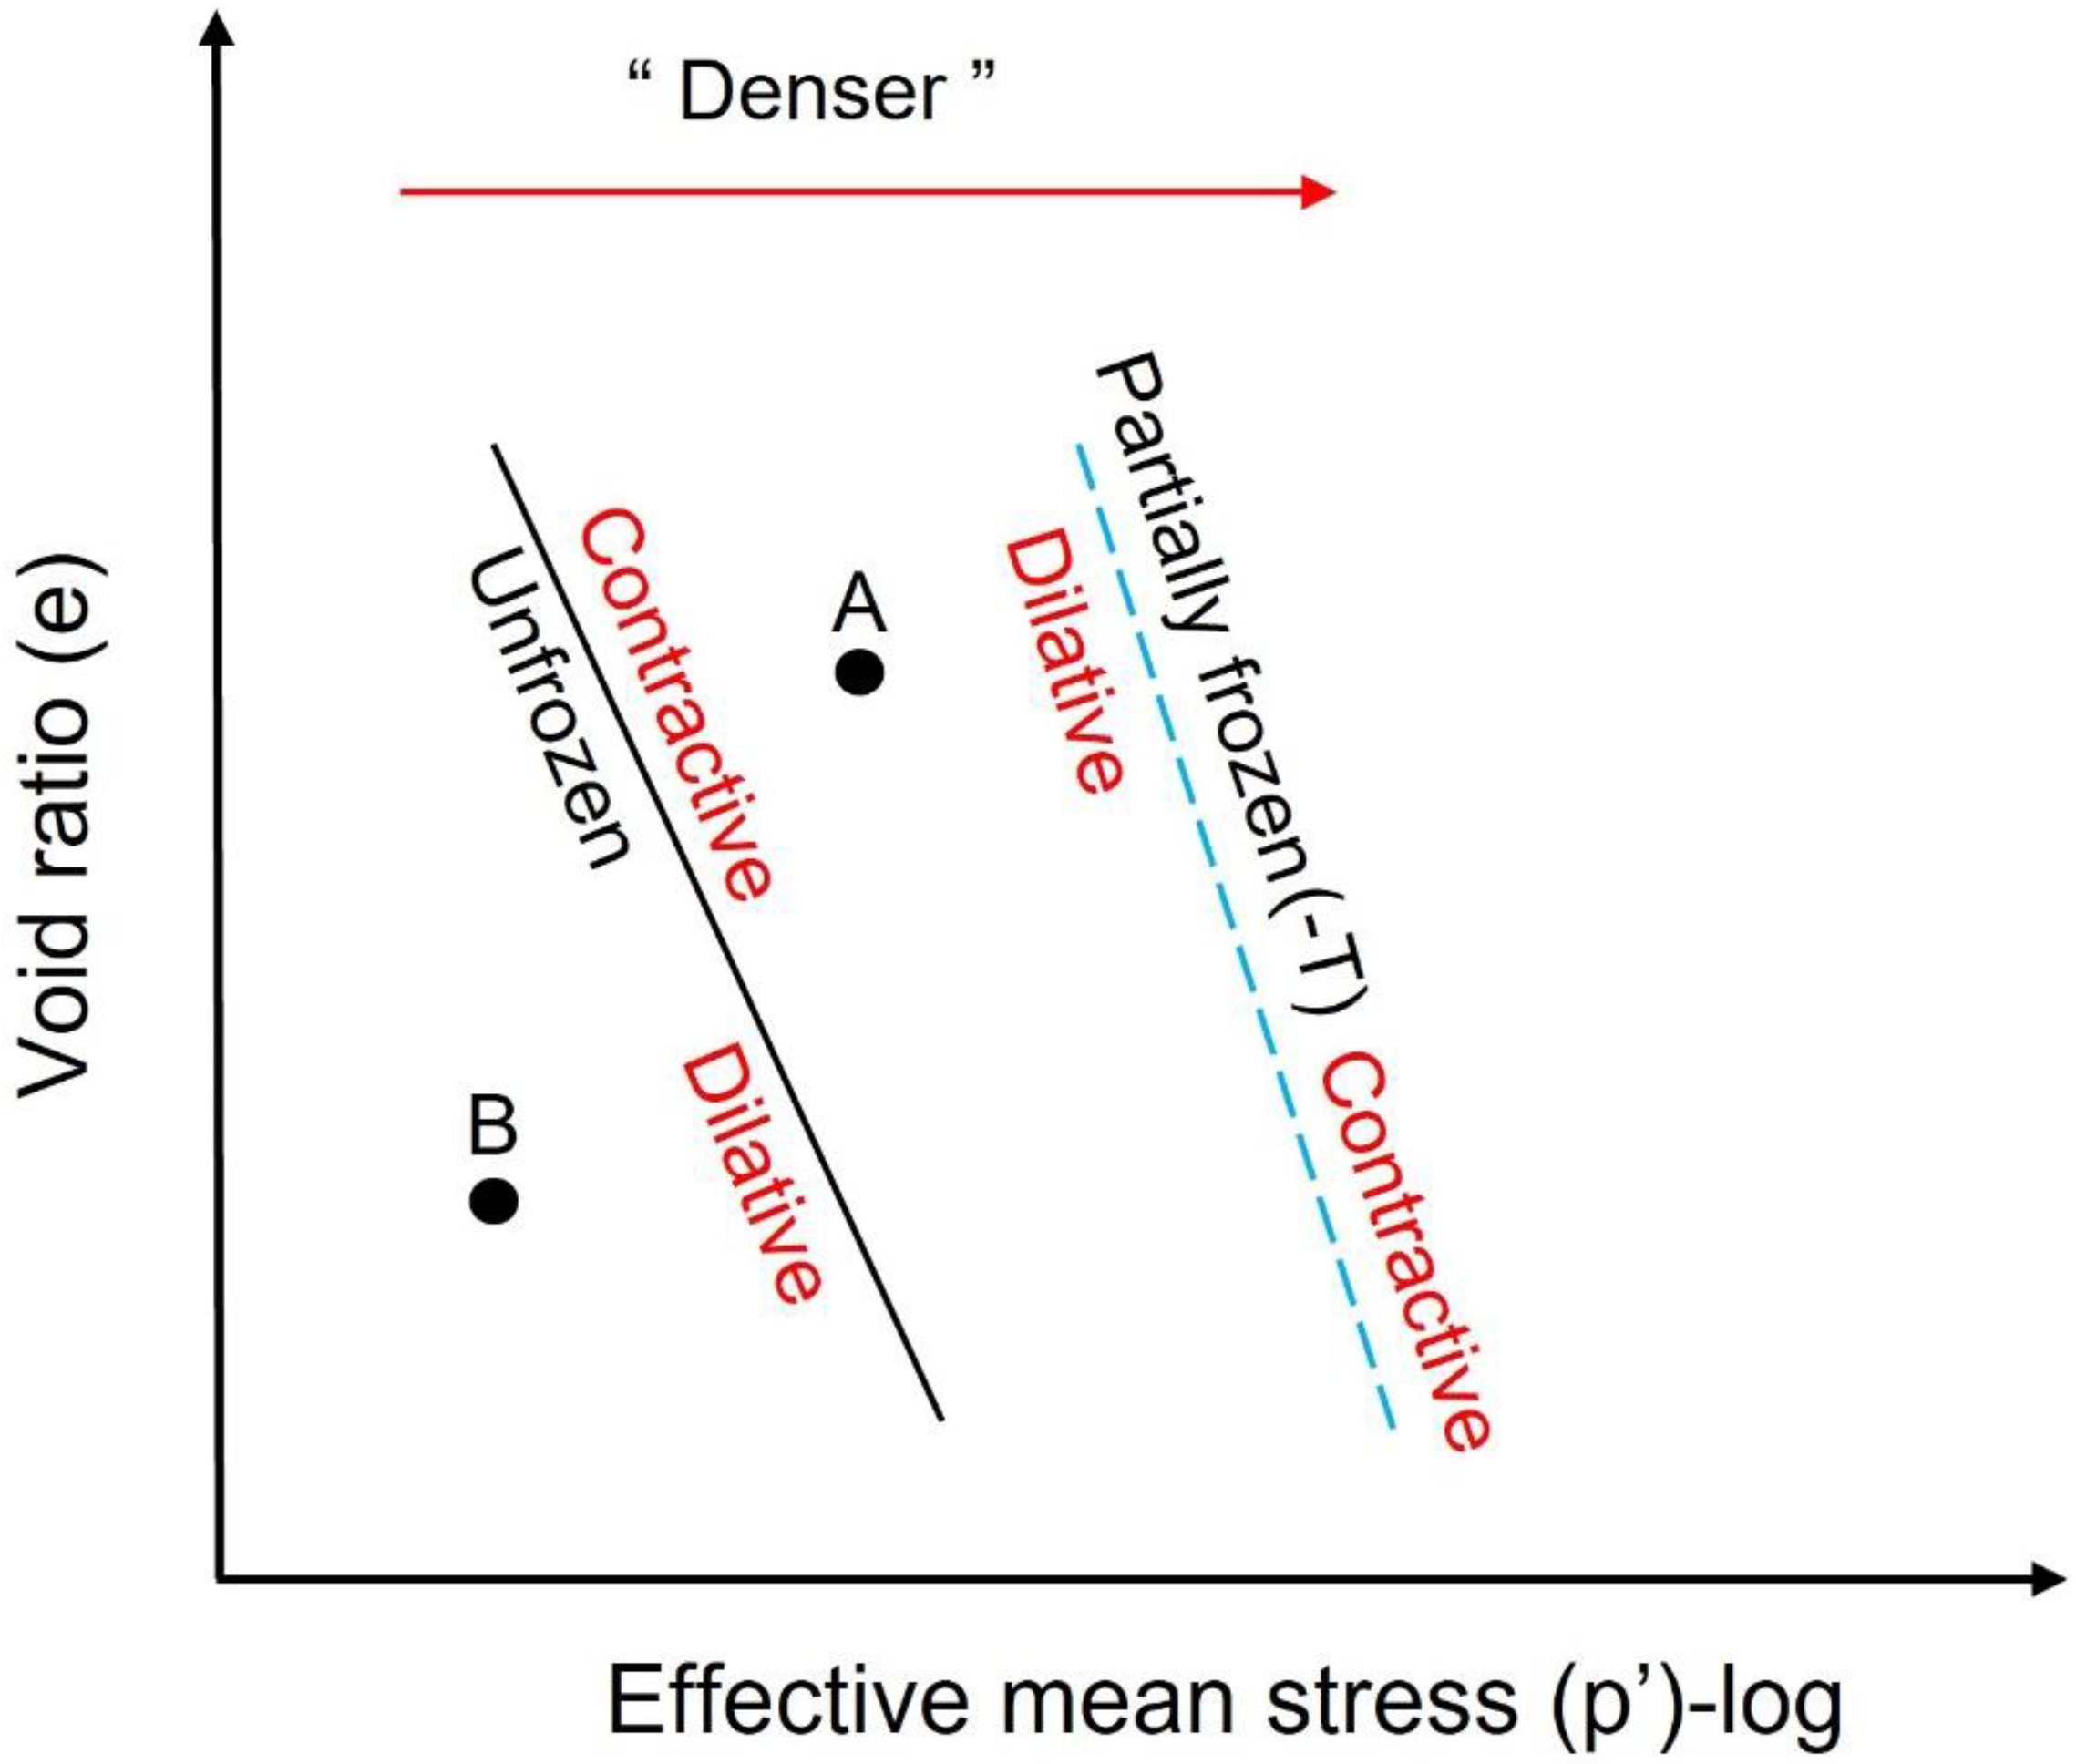
- In - space, the slope of CSL could be associated with the dilatancy of partially frozen sand. As the temperature decreases, additional ice encounters sand grains, leading to a denser state and a steeper CSL slope. However, lowering the strain rate will reduce the ice bonding and generate more sand grains contacts due to creep, resulting in a lower and .
Author Contributions
Funding
Data Availability Statement
Acknowledgments
Conflicts of Interest
References
- Jefferies, M.; Been, K. Soil Liquefaction: A Critical State Approach; CRC Press: Boca Raton, FL, USA, 2015. [Google Scholar]
- Poulos, S.J.; Castro, G.; France, J.W. Liquefaction evaluation procedure. J. Geotech. Eng. 1985, 111, 772–792. [Google Scholar] [CrossRef]
- Roscoe, K.H.; Schofield, A.; Wroth, A.P. On the yielding of soils. Géotechnique 1958, 8, 22–53. [Google Scholar] [CrossRef]
- Schofield, A.N.; Wroth, P. Critical State Soil Mechanics; McGraw-Hill: London, UK, 1968. [Google Scholar]
- Wood, D.M. Soil Behaviour and Critical State Soil Mechanics; Cambridge University Press: Cambridge, UK, 1990. [Google Scholar]
- Been, K.; Jefferies, M.G.; Hachey, J. The critical state of sands. Géotechnique 1991, 41, 365–381. [Google Scholar] [CrossRef]
- Ghoreishian Amiri, S.; Grimstad, G.; Kadivar, M.; Nordal, S. Constitutive model for rate-independent behavior of saturated frozen soils. Can. Geotech. J. 2016, 53, 1646–1657. [Google Scholar] [CrossRef]
- Nishimura, S.; Wang, J. A simple framework for describing strength of saturated frozen oils as multi-phase coupled system. Géotechnique 2019, 69, 659–671. [Google Scholar] [CrossRef]
- Nishimura, S.; Gens, A.; Olivella, S.; Jardine, R. THM-coupled finite element analysis of frozen soil: Formulation and application. Géotechnique 2009, 59, 159–171. [Google Scholar] [CrossRef]
- Yu, F.; Guo, P.; Na, S. A framework for constructing elasto-plastic constitutive model for frozen and unfrozen soils. Int. J. Numer. Anal. Methods Geomech. 2022, 46, 436–466. [Google Scholar] [CrossRef]
- Zhang, Y.; Michalowski, R.L. Thermal-hydro-mechanical analysis of frost heave and thaw settlement. J. Geotech. Geoenviron. Eng. 2015, 141, 04015027. [Google Scholar] [CrossRef]
- Allard, M.; Lemay, M.; Barrette, C.; L’Hérault, E.; Sarrazin, D.; Bell, T.; Doré, G. Permafrost and climate change in Nunavik and Nunatsiavut: Importance for municipal and transportation infrastructures. In Nunavik and Nunatsiavut: From Science to Policy. An Integrated Regional Impact Study (IRIS) of Climate Change and Modernization; ArcticNet Inc: Québec City, QC, Canada, 2012; pp. 171–197. [Google Scholar]
- Holubec Consulting Inc. Flat loop thermosyphon foundations in warm permafrost. In Government of the Northwest Territories Asset Management Division of Public Works and Services and the Climate Change Vulnerability Assessment of the Canadian Council of Professional Engineers; Government of Northwest Territories: Yellowknife, NT, Canada, 2008. [Google Scholar]
- Swanson, D.; Murphy, D.; Temmer, J.; Scaletta, T. Advancing the Climate Resilience of Canadian Infrastructure: A Review of Literature to Inform the Way Forward; International Institute for Sustainable Development: Winnipeg, MB, Canada, 2021. [Google Scholar]
- Desrues, J.; Chambon, R.; Mokni, M.; Mazerolle, F. Void ratio evolution inside shear bands in triaxial sand specimens studied by computed tomography. Géotechnique 1996, 46, 529–546. [Google Scholar] [CrossRef]
- Arenson, L.U.; Springman, S.M. Mathematical descriptions for the behaviour of ice-Rich frozen soils at temperatures close to 0 °C. Can. Geotech. J. 2005, 42, 431–442. [Google Scholar] [CrossRef]
- Arenson, L.U.; Springman, S.M. Triaxial constant stress and constant strain rate tests on ice-rich permafrost samples. Can. Geotech. J. 2005, 42, 412–430. [Google Scholar] [CrossRef]
- Lai, Y.; Li, S.; Qi, J.; Gao, Z.; Chang, X. Strength distributions of warm frozen clay and its stochastic damage constitutive model. Cold Reg. Sci. Technol. 2008, 53, 200–215. [Google Scholar] [CrossRef]
- Zhu, Z.; Ning, J.; Ma, W. A constitutive model of frozen soil with damage and numerical simulation for the coupled problem. Sci. China Phys. Mech. Astron. 2010, 53, 699–711. [Google Scholar] [CrossRef]
- Li, N.; Chen, F.; Su, B.; Cheng, G. Theoretical frame of the saturated freezing soil. Cold Reg. Sci. Technol. 2002, 35, 73–80. [Google Scholar] [CrossRef]
- Li, N.; Chen, F.; Xu, B.; Swoboda, G. Theoretical modeling framework for an unsaturated freezing soil. Cold Reg. Sci. Technol. 2008, 54, 19–35. [Google Scholar] [CrossRef]
- Henry, K.S. A Review of the Thermodynamics of Frost Heave; Report ERDC/CRREL TR-00-16; Cold Regions Research and Engineering Laboratory, US Army Corps of Engineers: Washington, DC, USA, 2000. [Google Scholar]
- Koopmans, R.W.R. Soil freezing and soil water characteristic curves. Soil Sci. Soc. Am. J. 1966, 30, 680–685. [Google Scholar] [CrossRef]
- Thomas, H.R.; Cleall, P.; Li, Y.C.; Harris, C.; Kern-Luetschg, M. Modelling of cryogenic processes in permafrost and seasonally frozen soils. Géotechnique 2009, 59, 173–184. [Google Scholar] [CrossRef]
- Li, N.; Cheng, G.D.; Xu, X.Z. The advance and review on frozen soil mechanics. Adv. Mech. 2001, 31, 95–102. [Google Scholar] [CrossRef]
- Ting, J.M.; Torrence Martin, R.; Ladd, C.C. Mechanisms of strength for frozen sand. J. Geotech. Eng. 1983, 109, 1286–1302. [Google Scholar] [CrossRef]
- Ladanyi, B.; Morel, J.F. Effect of internal confinement on compression strength of frozen sand. Can. Geotech. J. 1990, 27, 8–18. [Google Scholar] [CrossRef]
- Wang, J.; Nishimura, S.; Tokoro, T. Laboratory study and interpretation of mechanical behavior of frozen clay through state concept. Soils Found. 2017, 57, 194–210. [Google Scholar] [CrossRef]
- Blanchard, D.; Fremond, M. Soils frost heaving and thaw settlement. In Proceedings of the 4th International Symposium on Ground Freezing, Boca Raton, FL, USA, 5–7 August 1985; pp. 209–216. [Google Scholar]
- Lyu, C.; Nishimura, S.; Amiri, S.A.G.; Zhu, F.; Eiksund, G.R.; Grimstad, G. Pore-water pressure development in a frozen saline clay under isotropic loading and undrained shearing. Acta Geotech. 2021, 16, 3831–3847. [Google Scholar] [CrossRef]
- Kia, M. Measuring Pore-Water Pressure in Partially Frozen Soils. Ph.D. Thesis, Faculty of Graduate Studies and Research, University of Alberta, Edmonton, AB, Canada, 2012. [Google Scholar] [CrossRef]
- Liang, Y.; Beier, N.; Sego, D.C. Strength of Partially Frozen Sand Under Triaxial Compression. Can. Geotech. J. 2023, 60, 1277–1288. [Google Scholar] [CrossRef]
- Xu, X.; Wang, Y.; Bai, R.; Fan, C.; Hua, S. Comparative studies on mechanical behavior of frozen natural saline silty sand and frozen desalted silty sand. Cold Reg. Sci. Technol. 2016, 132, 81–88. [Google Scholar] [CrossRef]
- Xu, J.; Liu, H.; Zhao, X. Study on the strength and deformation property of frozen silty sand with NaCl under triaxial compression condition. Cold Reg. Sci. Technol. 2017, 137, 7–16. [Google Scholar] [CrossRef]
- Bragg, R.A.; Andersland, O. Strain rate, temperature, and sample size effects on compression and tensile properties of frozen sand. Eng. Geol. 1980, 18, 35–46. [Google Scholar] [CrossRef]
- Li, H.; Zhu, Y.; Zhang, J.; Lin, C. Effects of temperature, strain rate and dry density on compressive strength of saturated frozen clay. Cold Reg. Sci. Technol. 2004, 39, 39–45. [Google Scholar] [CrossRef]
- Parameswaran, V.R. Deformation behaviour and strength of frozen sand. Can. Geotech. J. 1980, 17, 74–88. [Google Scholar] [CrossRef]
- Yamamoto, Y.; Springman, S.M. Axial compression stress path tests on artificial frozen soil samples in a triaxial device at temperatures just below 0 °C. Can. Geotech. J. 2014, 51, 1178–1195. [Google Scholar] [CrossRef]
- Hivon, E.; Sego, D. Distribution of saline permafrost in the Northwest Territories, Canada. Can. Geotech. J. 1993, 30, 506–514. [Google Scholar] [CrossRef]
- Hivon, E.; Sego, D. Strength of frozen saline soils. Can. Geotech. J. 1995, 32, 336–354. [Google Scholar] [CrossRef]
- Liang, Y.; Beier, N.; Sego, D.C. New Method for Internal Pore-Water Pressure Measurements. Geotech. Test. J. 2022, 45, 490–502. [Google Scholar] [CrossRef]
- Sasitharan, S.; Robertson, P.; Sego, D.; Morgenstern, N. Collapse behavior of sand. Can. Geotech. J. 1993, 30, 569–577. [Google Scholar] [CrossRef]
- Vaid, Y.; Sivathayalan, S. Errors in estimates of void ratio of laboratory sand specimens. Can. Geotech. J. 1997, 33, 1017–1020. [Google Scholar] [CrossRef]
- Andersen, G.R.; Swan, C.W.; Ladd, C.C.; Germaine, J.T. Small-strain behavior of frozen sand in triaxial compression. Can. Geotech. J. 1995, 32, 428–451. [Google Scholar] [CrossRef]
- Sayles, F.H. Triaxial Constant Strain Rate Tests and Triaxial Creep Tests on Frozen Ottawa Sand; Technical Report 253; Corps of Engineers, US Army Cold Regions Research and Engineering Laboratory: Washington, DC, USA, 1974. [Google Scholar]
- Jia, J.; Zheng, J.; Sun, X. The critical state parameters of sands from their image-based intrinsic properties. Acta Geotech. 2021, 16, 4081–4092. [Google Scholar] [CrossRef]
- Arenson, L.U.; Sego, D.C. The effect of salinity on the freezing of coarse-grained sands. Can. Geotech. J. 2006, 43, 325–337. [Google Scholar] [CrossRef]


| Test ID | Initial Void Ratio | Initial Water Content (%) | Stain Rate (%/min) | Confining Pressure (kPa) | Drainage Condition | Temperature (°C) | |
|---|---|---|---|---|---|---|---|
| i | L-1 | 0.834 | 32 | 1 | 100 | undrain | 23 |
| L-2 | 0.834 | 32 | 1 | 200 | undrain | 23 | |
| L-3 | 0.832 | 31 | 1 | 400 | undrain | 23 | |
| L-4 | 0.833 | 32 | 1 | 400 | drain | 23 | |
| D-1 | 0.599 | 23 | 1 | 100 | undrain | 23 | |
| D-2 | 0.599 | 23 | 1 | 200 | undrain | 23 | |
| D-3 | 0.597 | 23 | 1 | 400 | undrain | 23 | |
| ii | PL-1 | 0.835 | 32 | 1 | 100 | undrain | −3 |
| PL-2 | 0.834 | 32 | 1 | 200 | undrain | −3 | |
| PL-3 | 0.835 | 32 | 1 | 400 | undrain | −3 | |
| PL-4 | 0.834 | 32 | 1 | 400 | drain | −3 | |
| PD-1 | 0.596 | 23 | 1 | 100 | undrain | −3 | |
| PD-2 | 0.599 | 23 | 1 | 200 | undrain | −3 | |
| PD-3 | 0.594 | 22 | 1 | 400 | undrain | −3 | |
| iii | PL-5 | 0.834 | 32 | 0.1 | 100 | undrain | −3 |
| PL-6 | 0.835 | 32 | 0.1 | 400 | undrain | −3 | |
| PL-7 | 0.834 | 32 | 1 | 100 | undrain | −5 | |
| FL-1 | 0.834 | 32 | 1 | 100 | undrain | −10 | |
| Temperature (°C) | Strain Rate (%/min) | (°) | (kPa) | |||
|---|---|---|---|---|---|---|
| 23 | 1 | 53 | 1.33 | 0 | 0.872 | −0.014 |
| −3 | 1 | 52 | 1.29 | 266.4 | 1.075 | −0.036 |
| −3 | 0.1 | 53 | 1.33 | 0 | 1.011 | −0.027 |
| −10 | 1 | 52 | 1.29 | 815.6 | - | - |
Disclaimer/Publisher’s Note: The statements, opinions and data contained in all publications are solely those of the individual author(s) and contributor(s) and not of MDPI and/or the editor(s). MDPI and/or the editor(s) disclaim responsibility for any injury to people or property resulting from any ideas, methods, instructions or products referred to in the content. |
© 2025 by the authors. Licensee MDPI, Basel, Switzerland. This article is an open access article distributed under the terms and conditions of the Creative Commons Attribution (CC BY) license (https://creativecommons.org/licenses/by/4.0/).
Share and Cite
Liang, Y.; Beier, N.; Sego, D.C. Determination of the Critical State Line in Partially Frozen Sand. Geotechnics 2025, 5, 10. https://doi.org/10.3390/geotechnics5010010
Liang Y, Beier N, Sego DC. Determination of the Critical State Line in Partially Frozen Sand. Geotechnics. 2025; 5(1):10. https://doi.org/10.3390/geotechnics5010010
Chicago/Turabian StyleLiang, Yawu, Nicholas Beier, and Dave C. Sego. 2025. "Determination of the Critical State Line in Partially Frozen Sand" Geotechnics 5, no. 1: 10. https://doi.org/10.3390/geotechnics5010010
APA StyleLiang, Y., Beier, N., & Sego, D. C. (2025). Determination of the Critical State Line in Partially Frozen Sand. Geotechnics, 5(1), 10. https://doi.org/10.3390/geotechnics5010010