Abstract
Since the 1960s, cyclic triaxial tests have been utilized to assess the liquefaction susceptibility of cohesionless soils. While standardized procedures exist for conducting cyclic triaxial tests, there remains no universally accepted criterion for defining liquefaction in a laboratory test. The selection of a liquefaction criterion significantly impacts the interpretation of the test results and subsequent analyses. To quantify these effects, more than 250 cyclic triaxial tests were evaluated using both stress-based and strain-based liquefaction criteria. The analyses performed focused on two aspects of the liquefaction behavior: the number of cycles of loading required to initiate liquefaction and the amount of normalized dissipated energy per unit volume that must be absorbed into the specimen in order for it to liquefy. The findings indicate that for soils susceptible to flow liquefaction failures, the number of loading cycles required to induce liquefaction decreases. They also show that the amount of energy dissipation required to trigger liquefaction remains largely consistent across different failure criteria. However, for soils prone to cyclic mobility failures, both the number of loading cycles and the amount of dissipated energy required to cause liquefaction were found to vary significantly depending on the failure criterion applied.
1. Introduction
Cyclic triaxial testing has been a widely accepted method for evaluating the liquefaction susceptibility of cohesionless soils since the pioneering work of researchers such as H. Bolton Seed and Ken Lee [1,2] and Arthur Casagrande and Gonzalo Castro [3]. Since that time, several other field- and laboratory-based methods of assessing liquefaction susceptibility have been developed [4,5,6].
The laboratory-based analyses involve subjecting soil specimens to cyclic loading at varying cyclic stress ratios and recording the number of cycles required to induce liquefaction. The test results are then compared with the expected cyclic stress ratio and the number of cycles of loading anticipated during seismic events to determine whether liquefaction is likely to occur in the field.
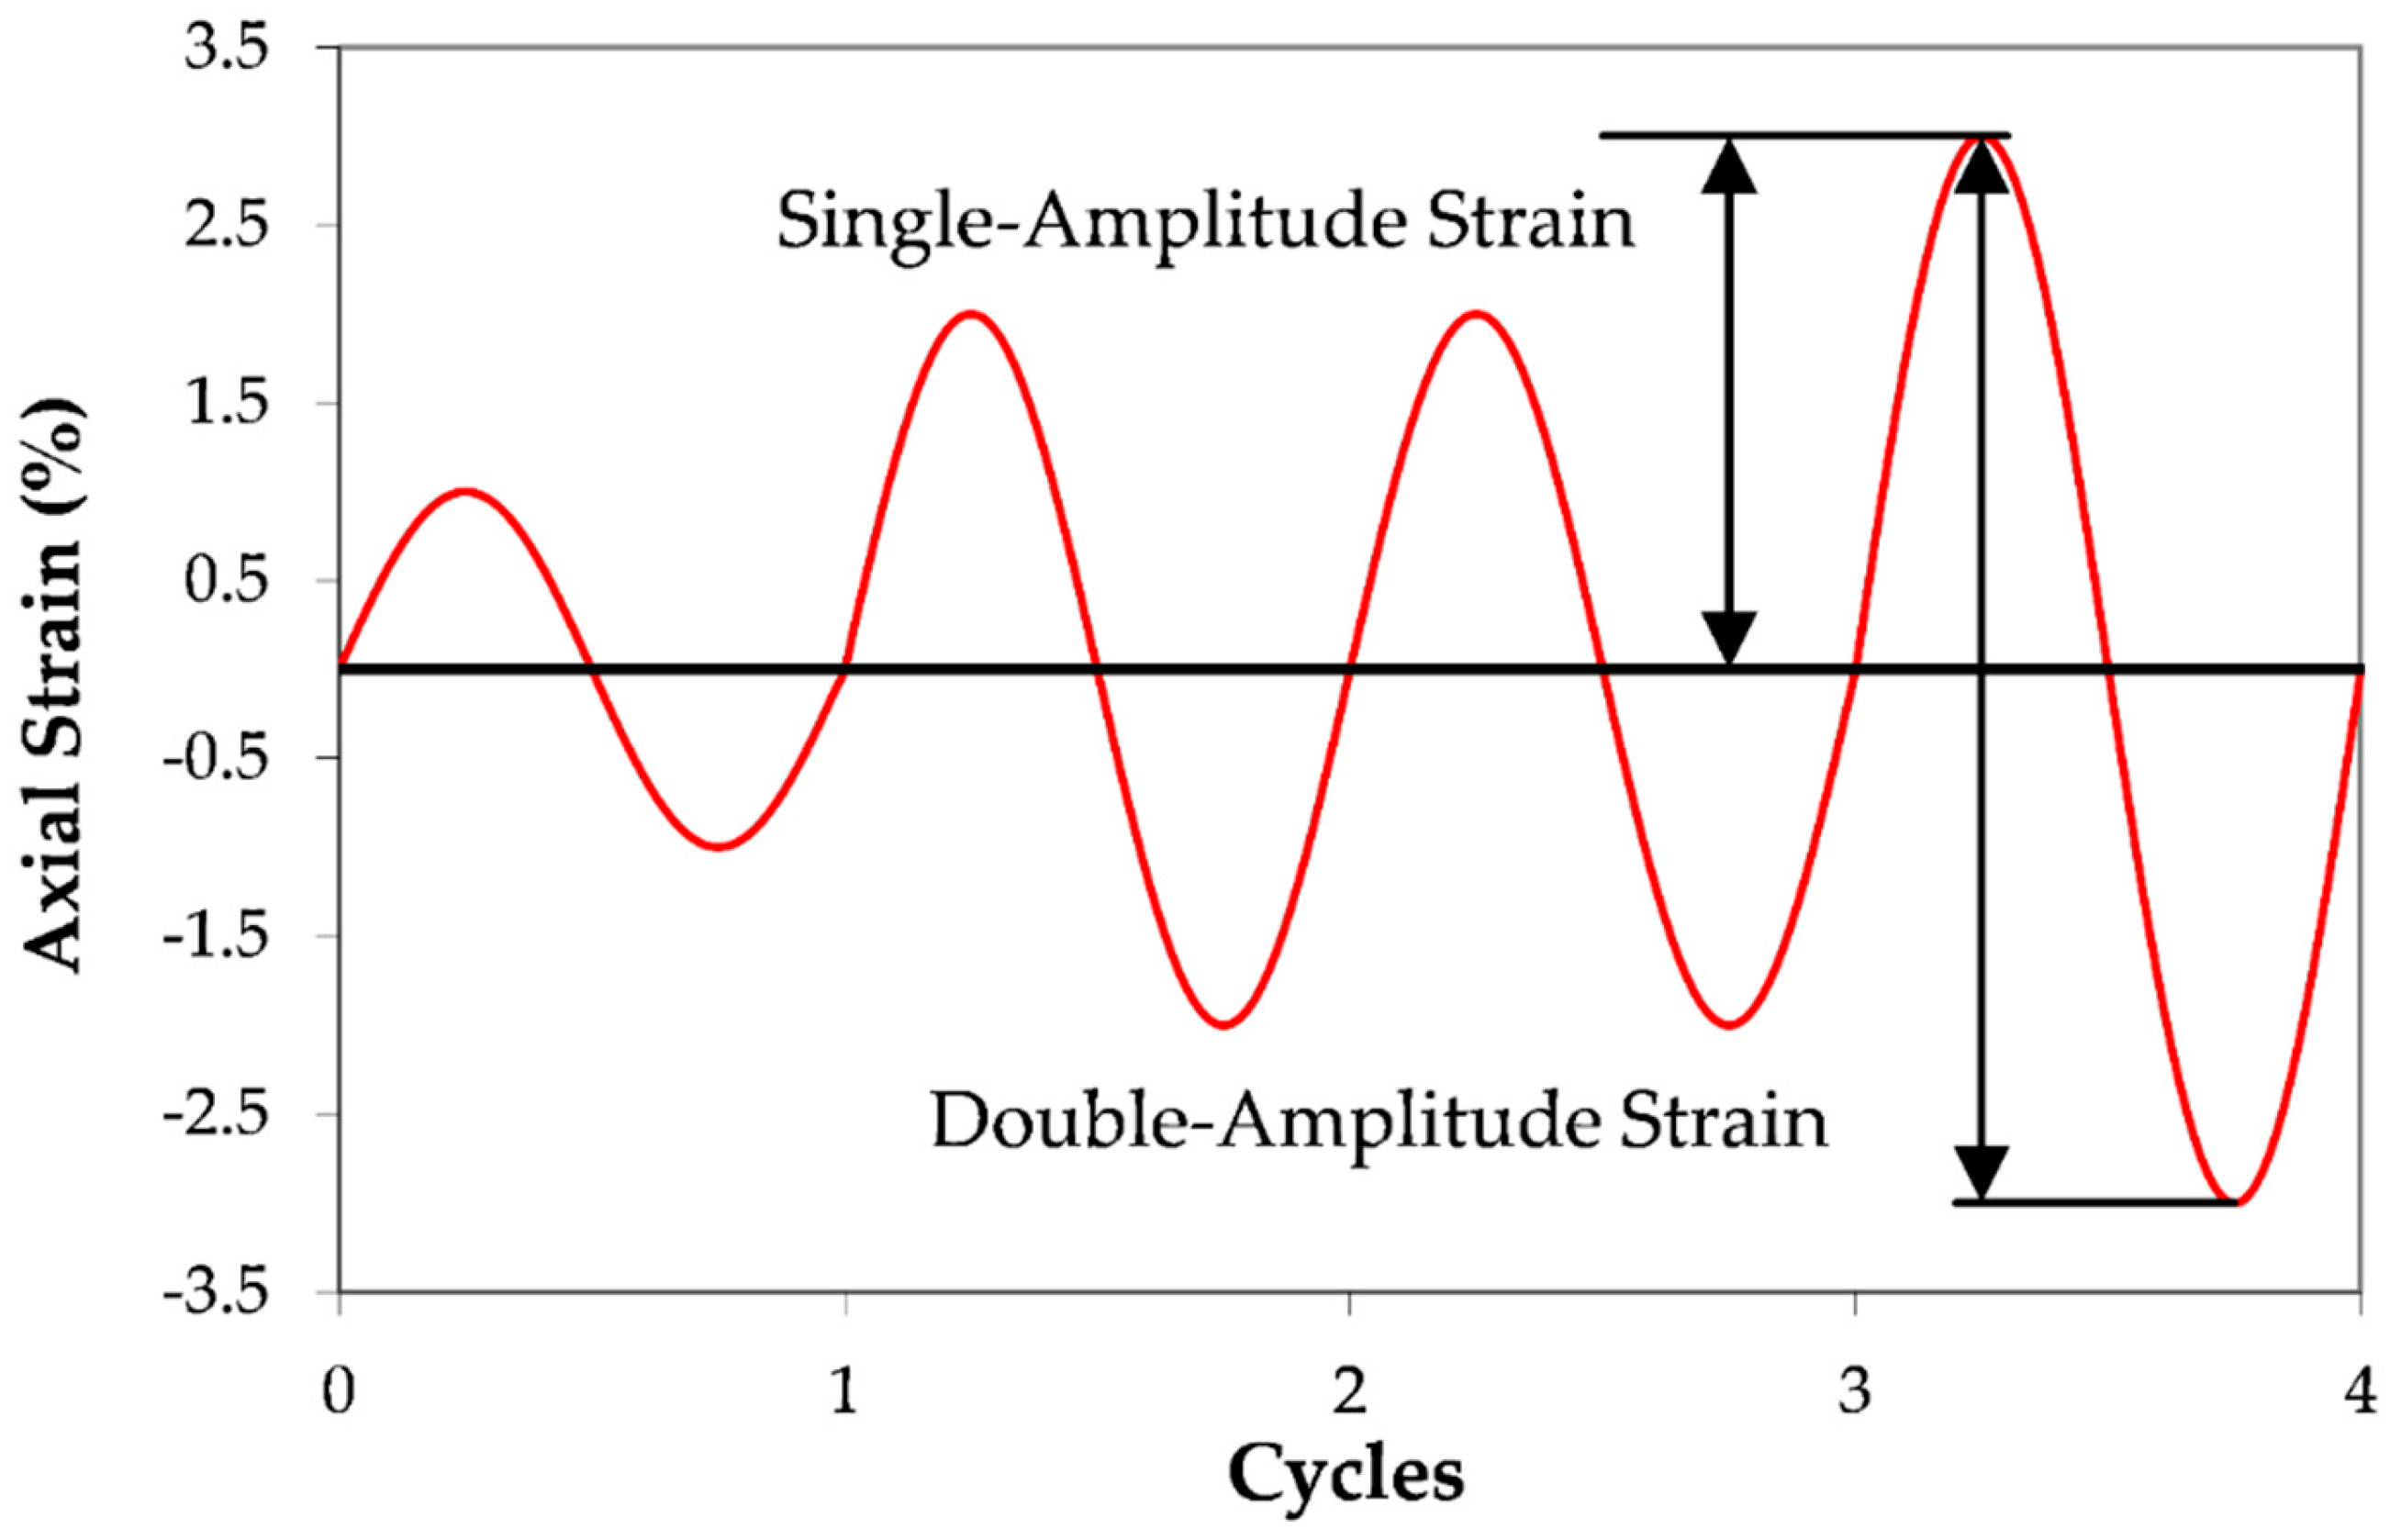
Despite general agreement on the test procedures [7], the definition of liquefaction in a cyclic triaxial test remains a topic of discussion. The most commonly used criterion is “initial liquefaction”, defined as the point at which the effective stress in the triaxial specimen first reaches zero. However, numerous alternative stress-based and strain-based failure criteria have been proposed. The choice of liquefaction criterion significantly influences the interpretation of cyclic triaxial test results and the subsequent engineering analyses. Liquefaction definitions reported in the literature include initial liquefaction (i.e., when the effective stress acting on the specimen first equals zero) [8,9,10,11,12] and various levels of single-amplitude and double-amplitude axial strain [13,14,15,16]. Figure 1 provides an example of single-amplitude strain and double-amplitude strain.
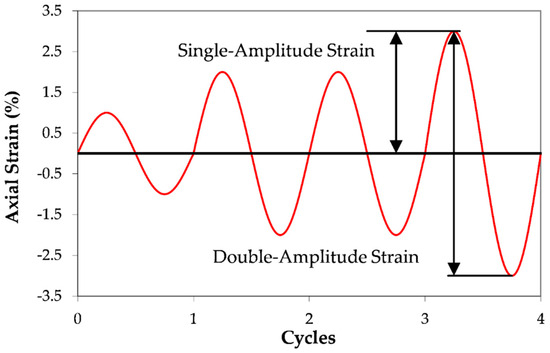
Figure 1.
Definition of single- and double-amplitude shear axial strains.
To assess the impact of different liquefaction criteria, data from over 250 cyclic triaxial tests were analyzed using multiple stress-based and strain-based definitions of liquefaction.
2. Background
This section provides a review of the background knowledge needed to understand the work performed during the study. Following an explanation of the two main modes of liquefaction failure, flow liquefaction and cyclic mobility, a review of energy dissipation and its relation to liquefaction is provided.
2.1. Modes of Liquefaction Failure
Soil liquefaction generally manifests in two primary failure modes [17]. In soils with low relative density, flow liquefaction occurs, characterized by contractive behavior leading to sudden large strains upon shearing. Conversely, soils with higher relative densities exhibit dilative behavior resulting in cyclic mobility, which is associated with transitory deformations.
Flow liquefaction arises in soils when their void ratio is larger than their critical void ratio. Such a condition is represented by Point A in Figure 2. When subjected to undrained shear, these soils develop positive pore water pressures, reducing the effective stress acting on the specimen. As a result, there is a corresponding decrease in the shear strength of the specimen. As loading continues, this lowered strength leads to increased levels of straining in the specimen. These increased levels of strain cause the pore pressures to increase, which again results in a further reduction in shear strength. This cyclic decrease in effective stress moves Point A horizontally to the left on the diagram until it reaches the steady-state line. Once Point A reaches the steady-state line, a steady-state condition is reached and flow liquefaction occurs. Very large permanent displacements typically accompany flow liquefaction.
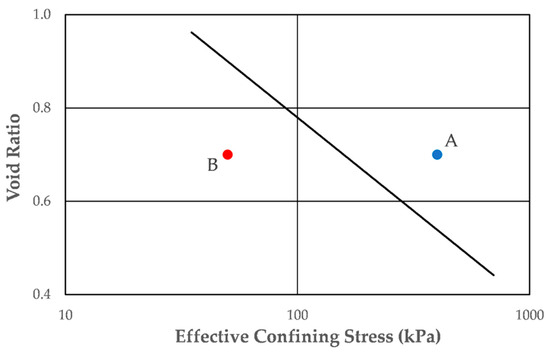
Figure 2.
Typical steady-state line (after Polito 1999 [8]). The specimen at point A is susceptible to flow liquefaction. The specimen at Point B is susceptible to flow liquefaction.
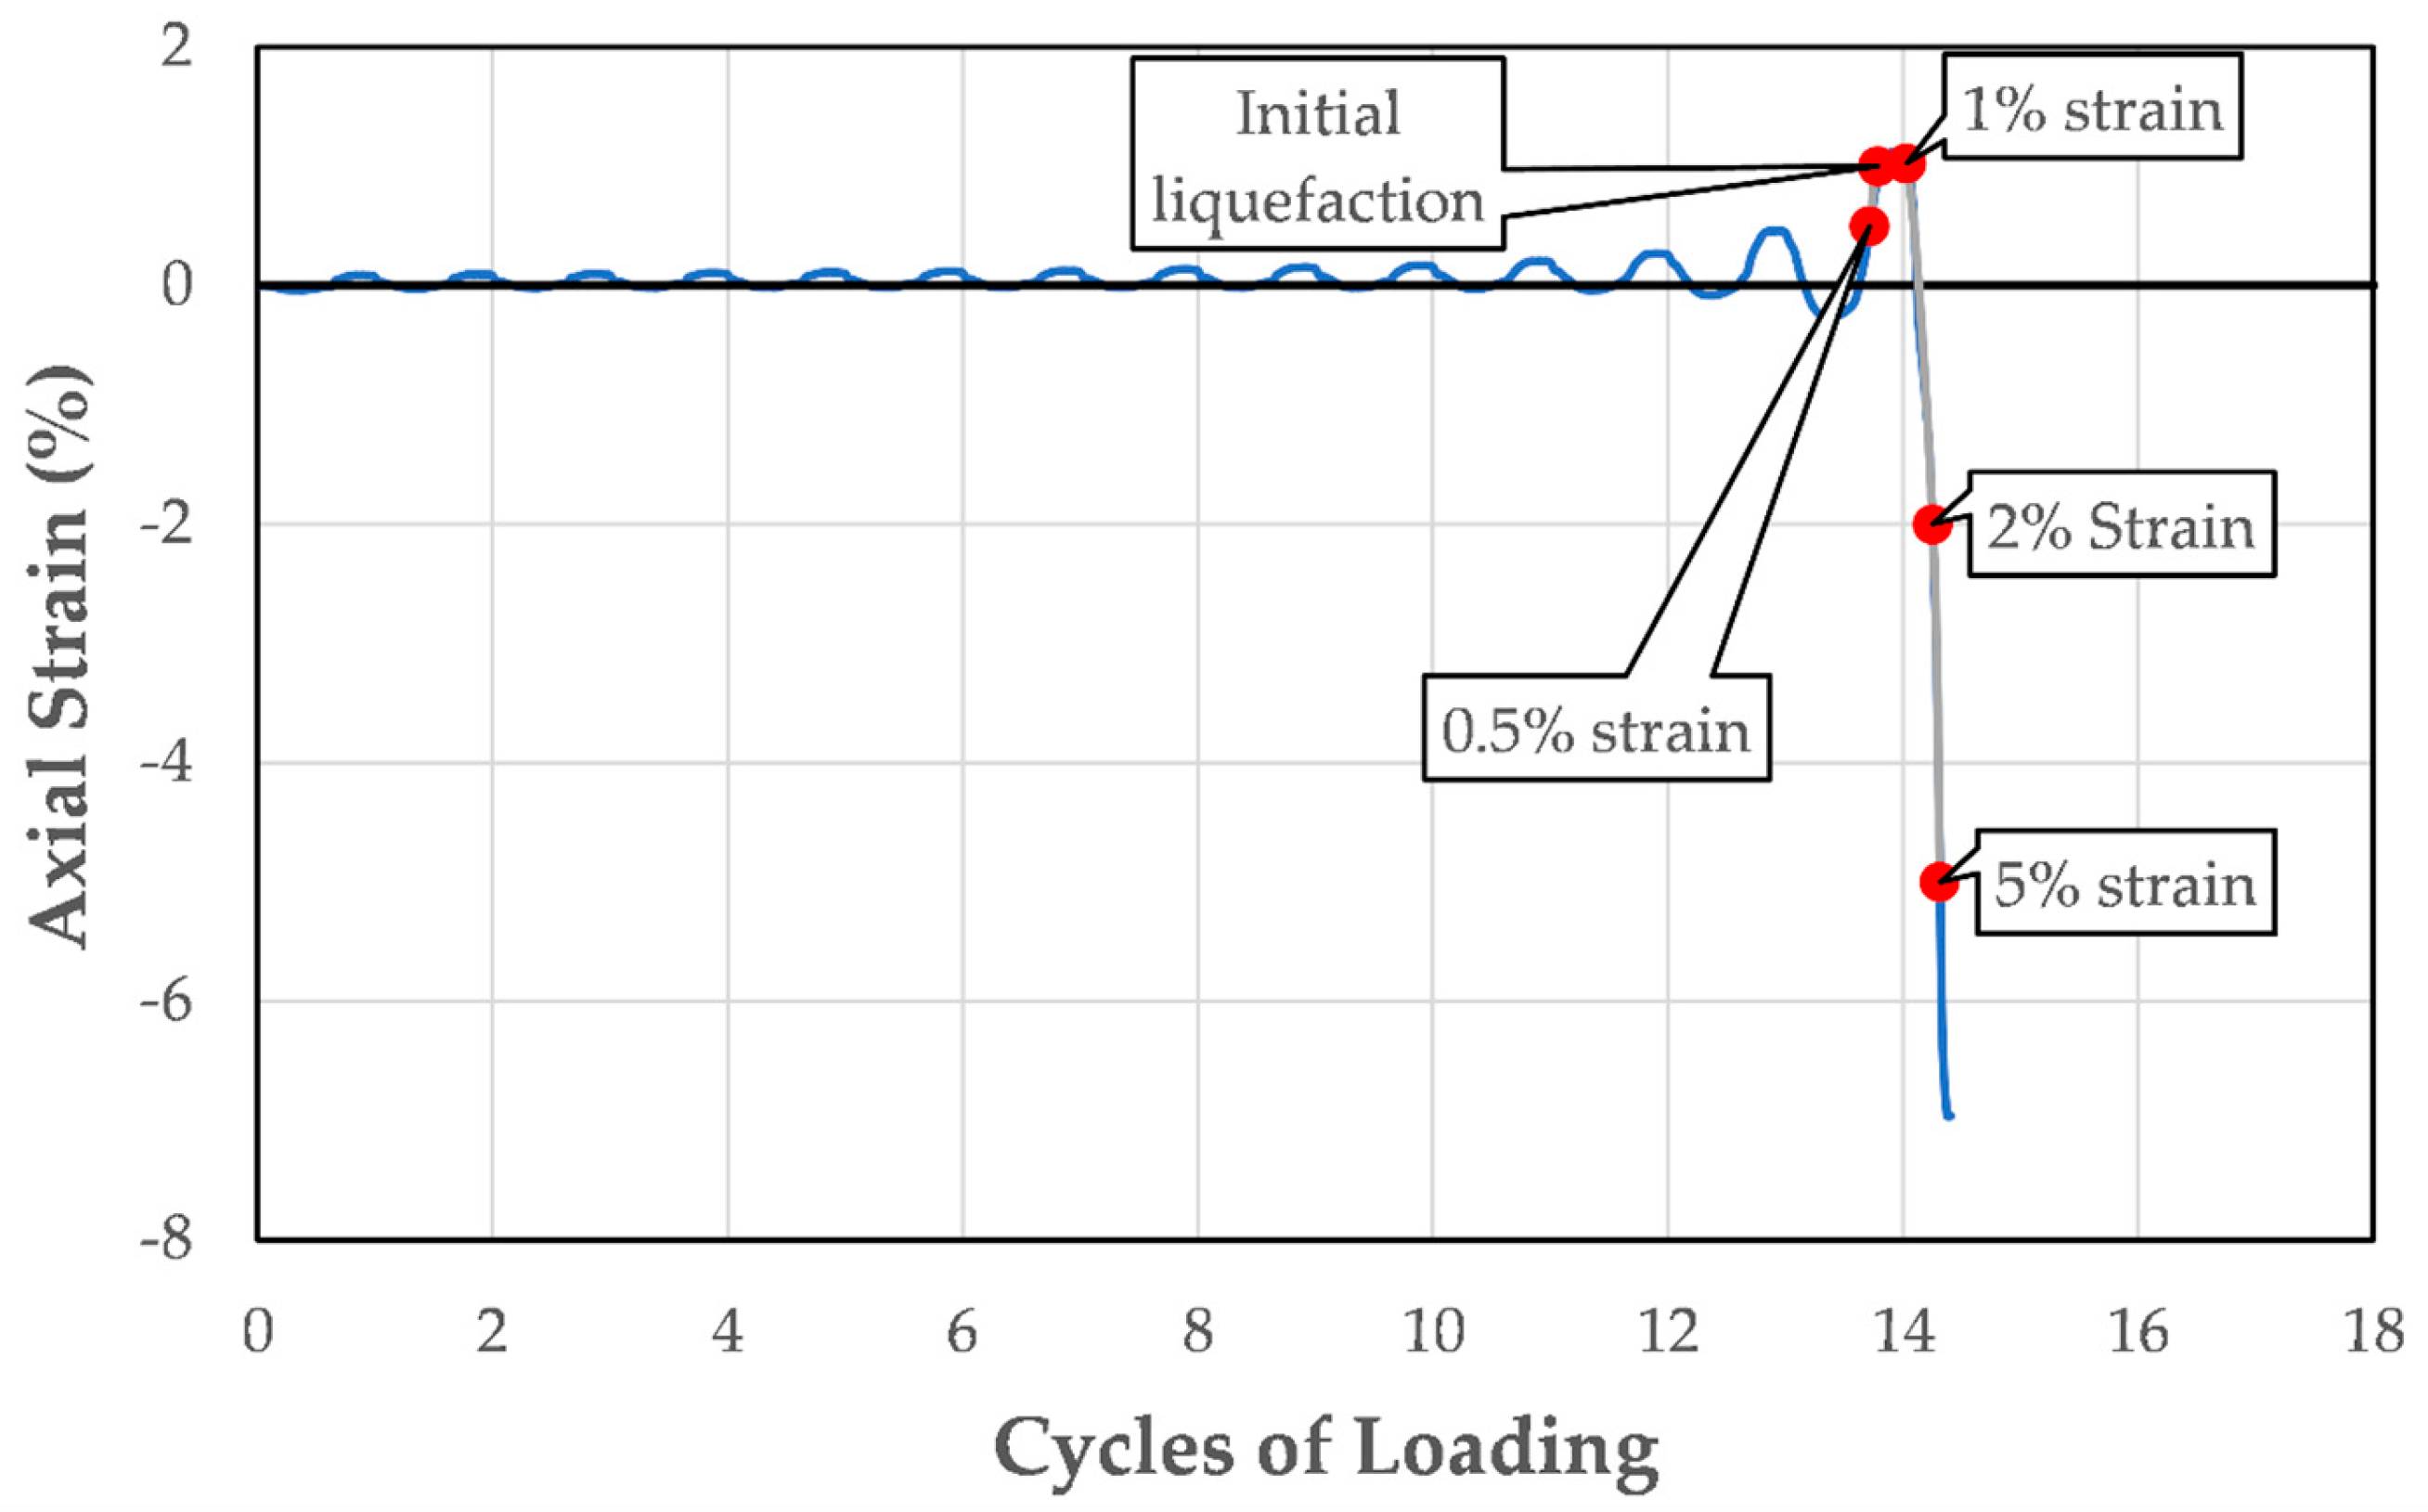
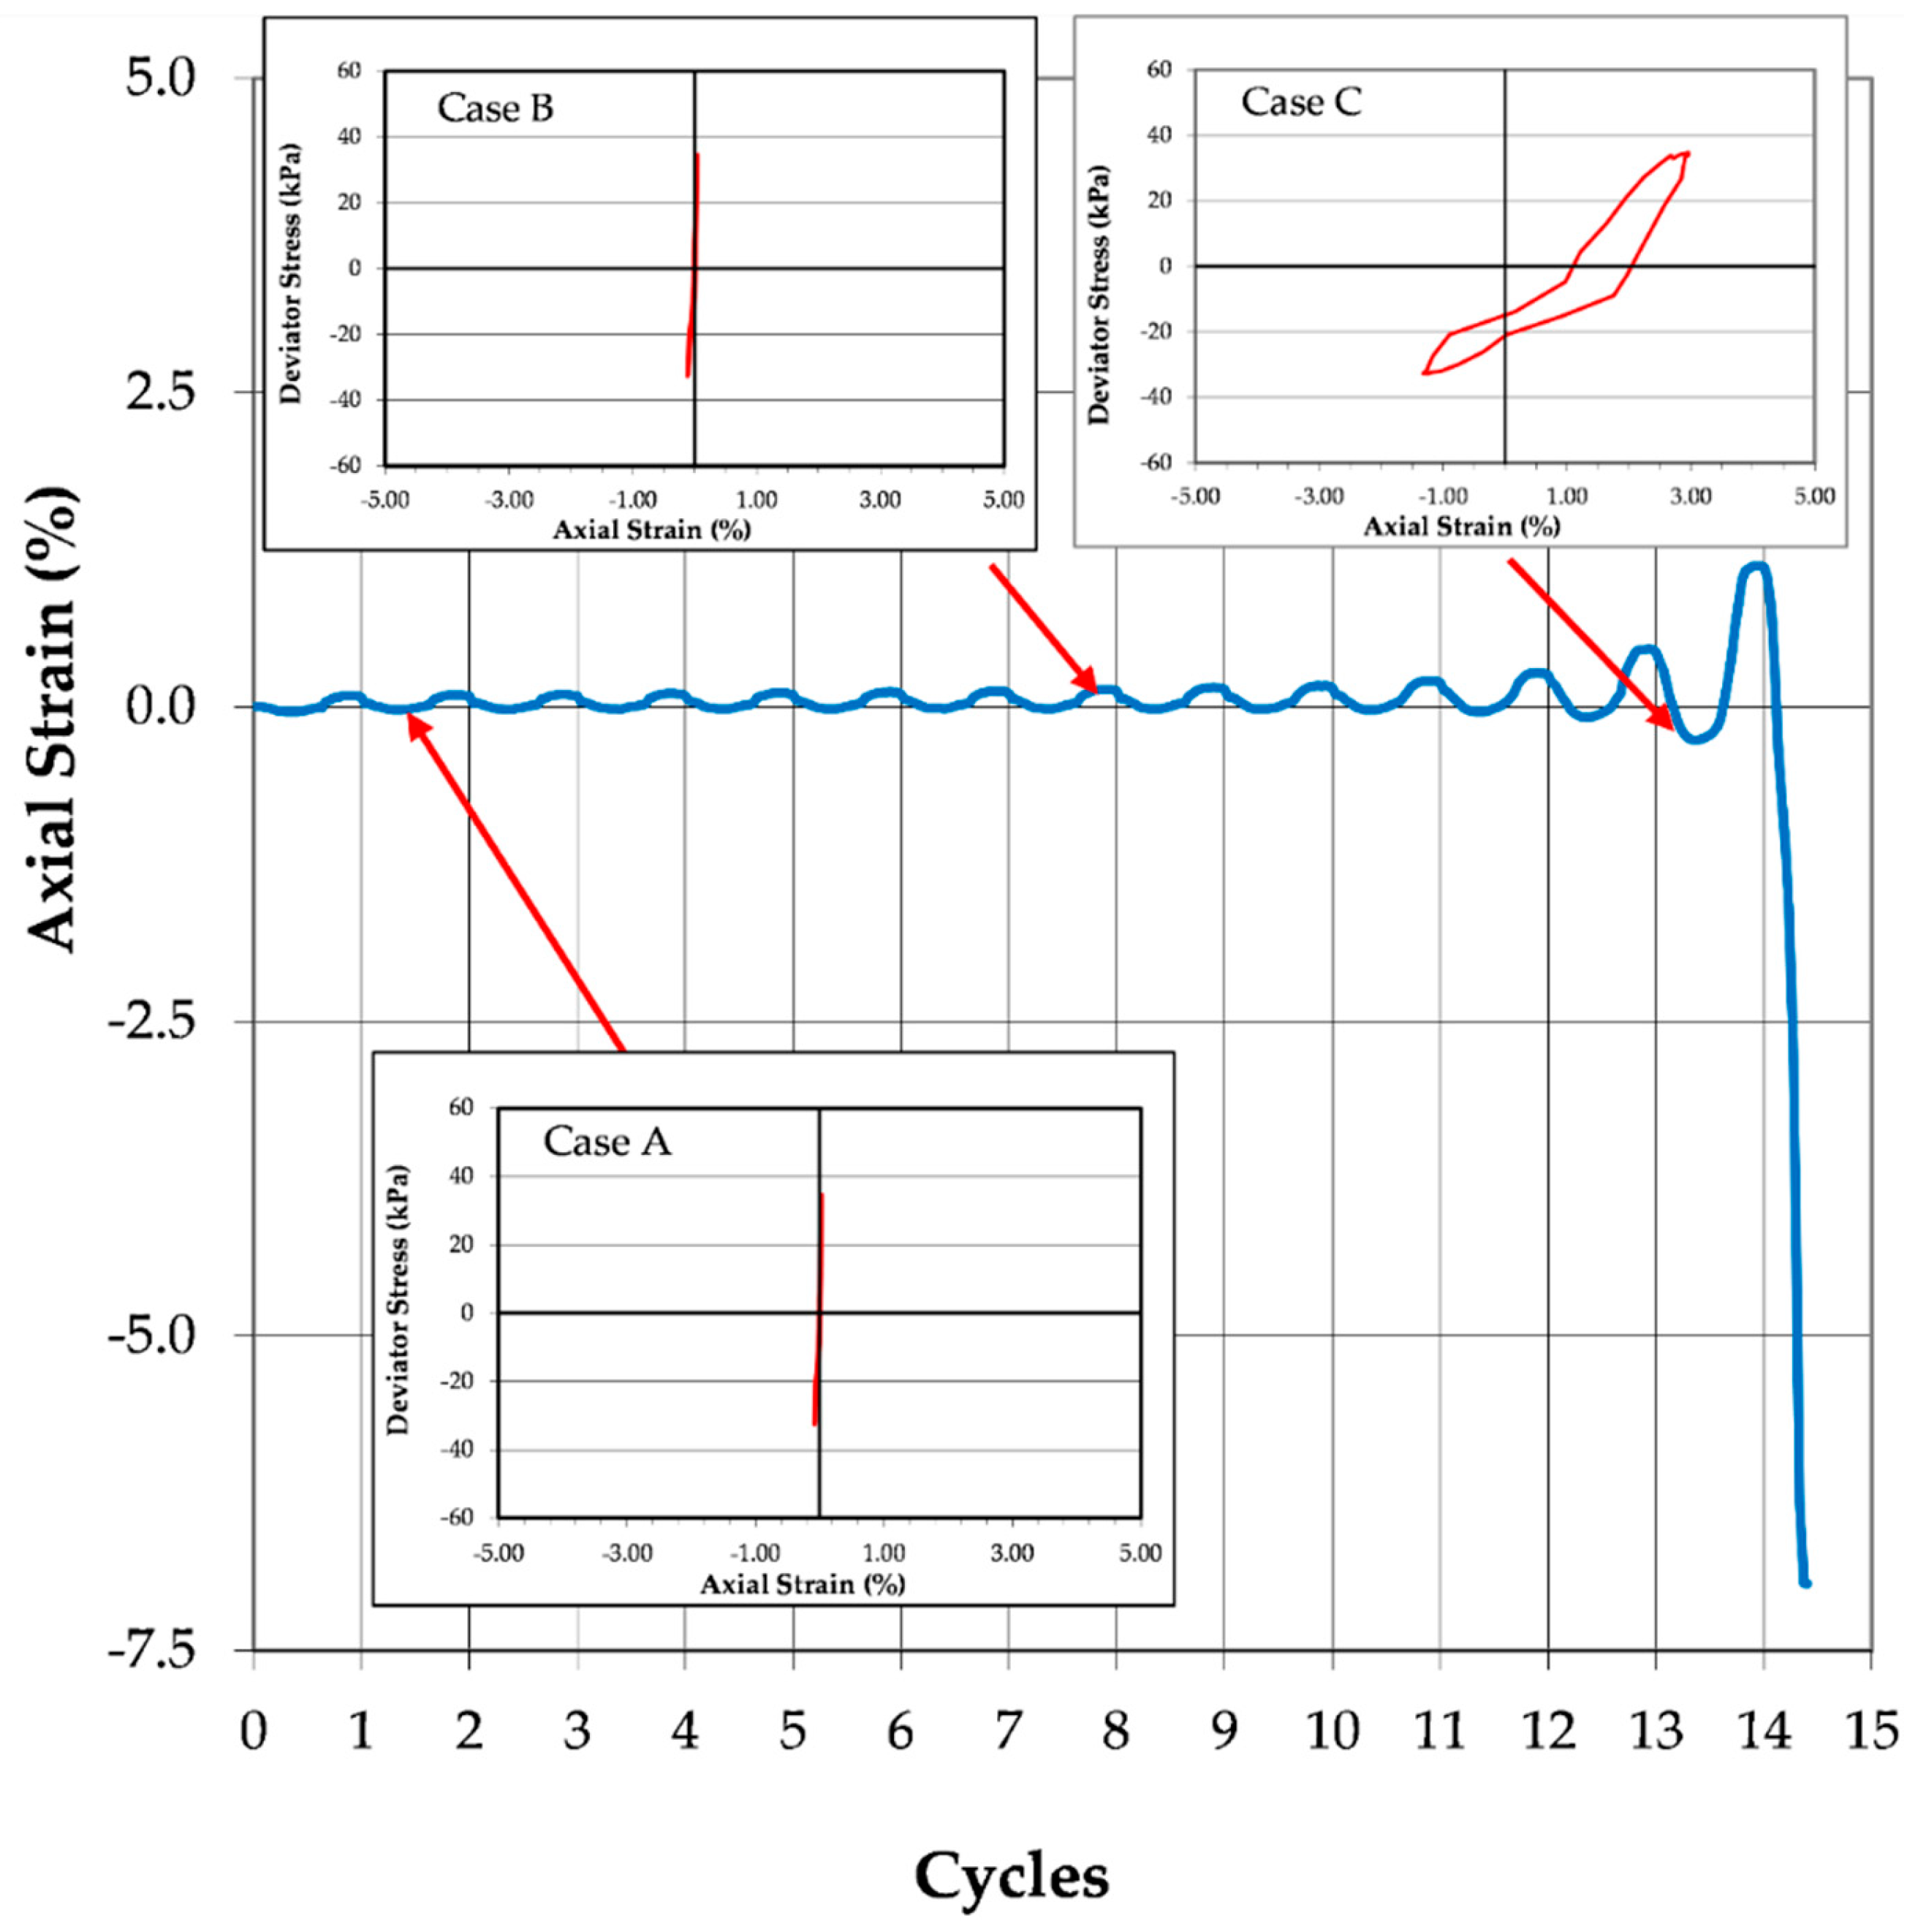
Figure 3 presents a typical axial strain-versus-cycles of loading curve performed on a specimen exhibiting flow liquefaction. These cyclic triaxial test data are marked where each of the liquefaction criteria used in this study occurred during the test. This specimen’s strain behavior begins with very small axial strains. Almost immediately after initial liquefaction, a large, sudden axial strain occurs, typical of flow liquefaction.
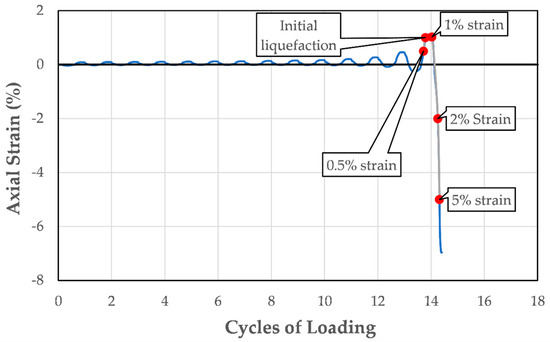
Figure 3.
Strain-versus-cycles of loading curve for a specimen exhibiting flow liquefaction.
Conversely, cyclic mobility occurs in soils with void ratios smaller than the critical void ratio. Point B in Figure 2 represents such a condition. These soils initially tend to contract, generating positive pore pressures and reducing effective stress. Subsequently, they tend to dilate, leading to a decrease in pore pressure, an increase in effective stress, and a recovery of strength. This behavior prevents large-scale deformation, even if the soil reaches the steady-state line.
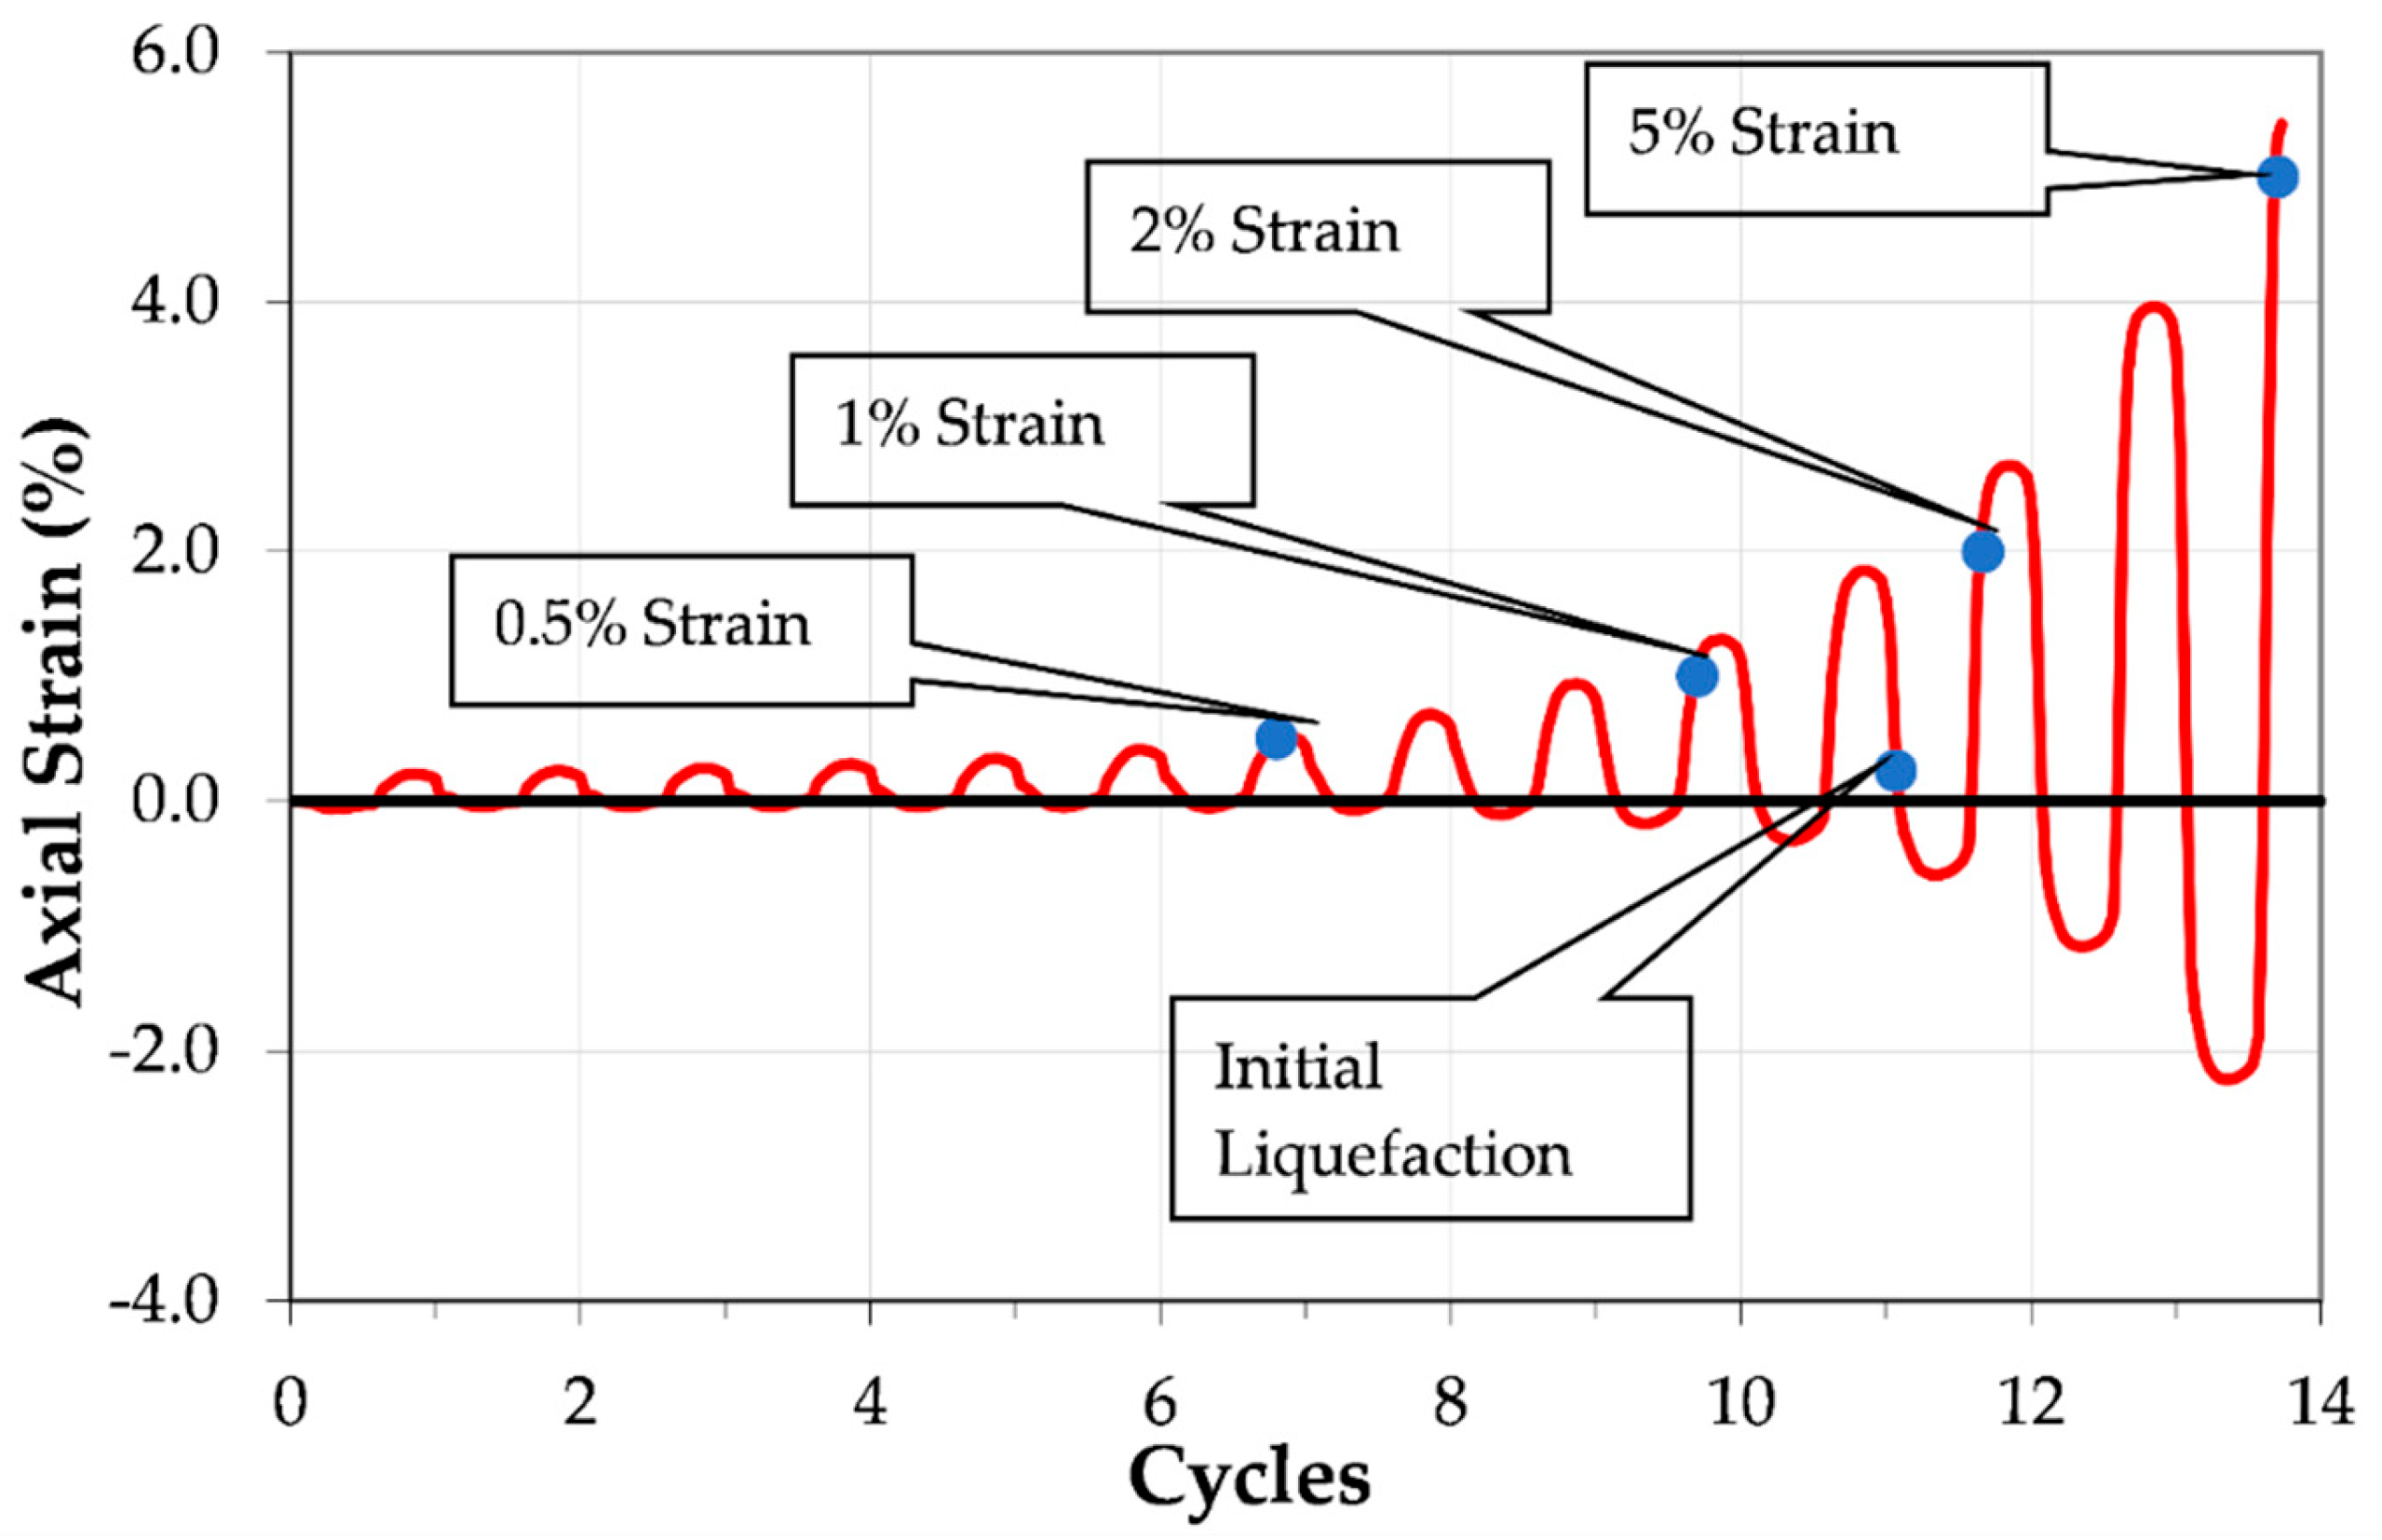
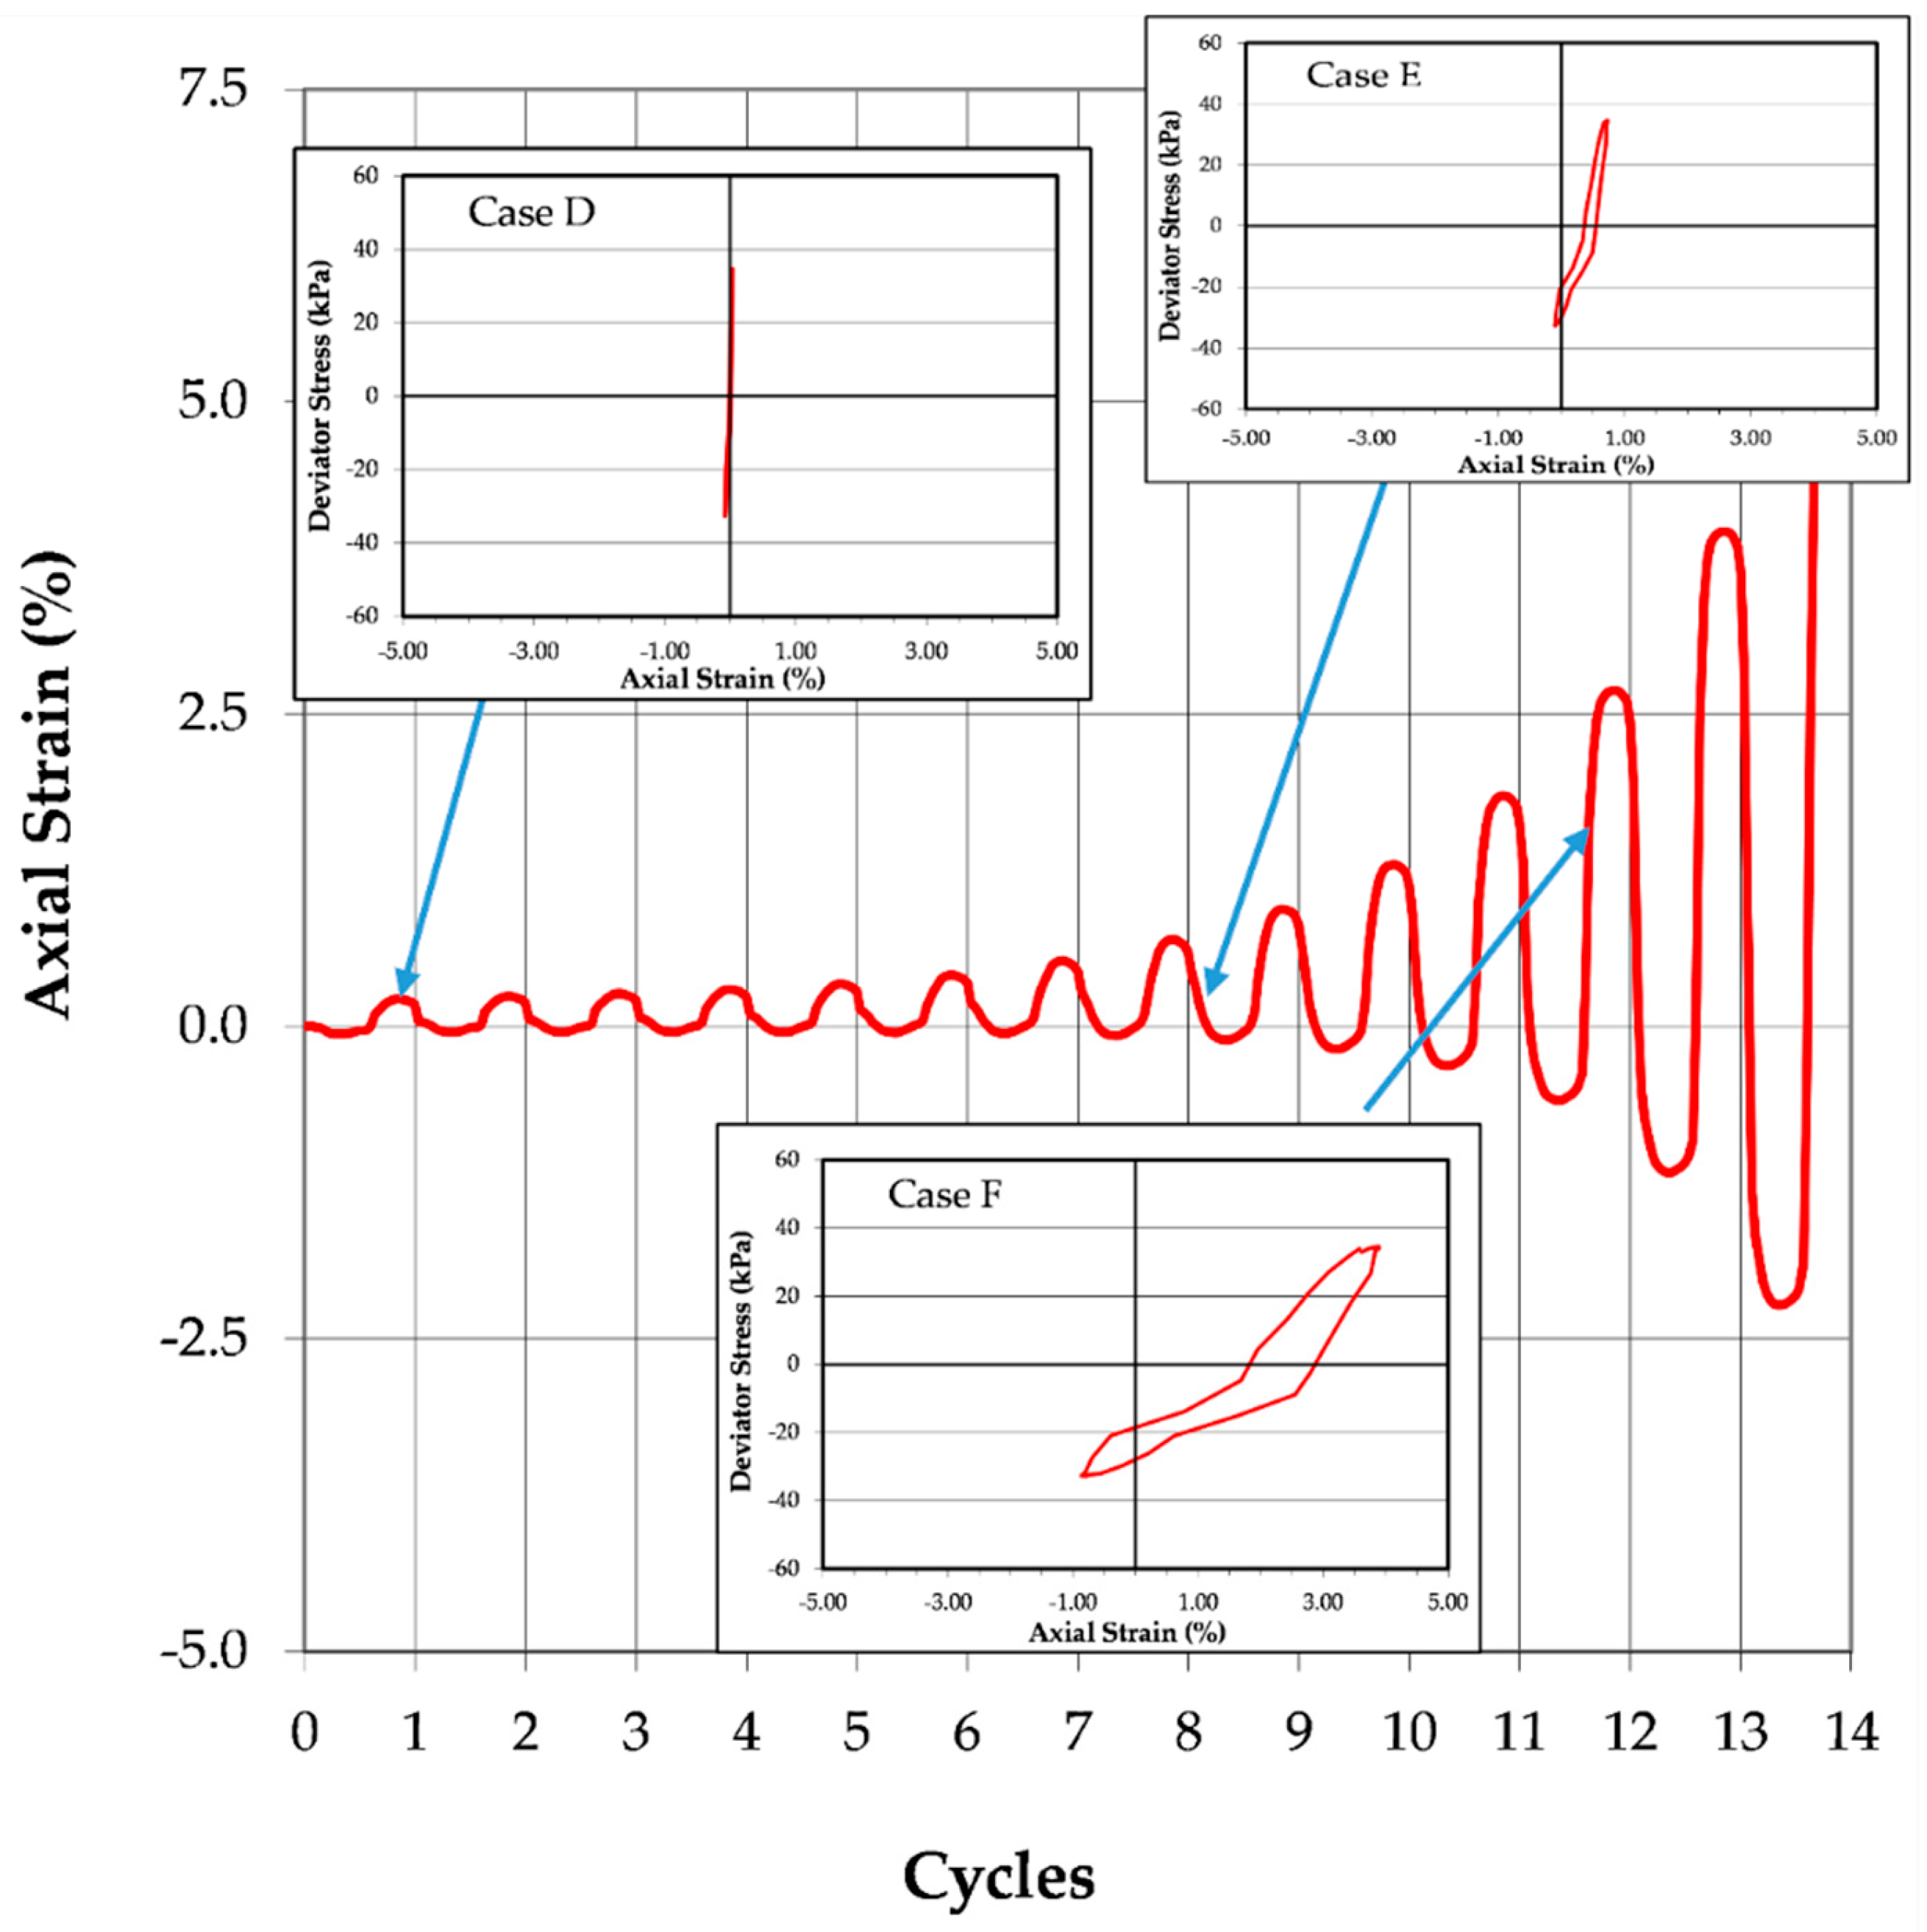
Figure 4 presents a typical axial strain-versus-cycles of loading curve performed on a specimen exhibiting cyclic mobility. These cyclic triaxial test data are marked where each of the liquefaction criteria used in this study occurred during the test. The specimen’s behavior is characterized by the nearly uniform development of biaxial strains throughout the course of loading and a return to essentially zero strain at the end of each cycle of loading.

Figure 4.
Strain-versus-cycles of loading curve for a specimen exhibiting cyclic mobility.
2.2. Normalized Dissipated Energy per Unit Volume
The normalized dissipated energy per unit volume (NDEPUV) lost in the soil during cyclic loading depends on the stresses and strains experienced by the specimen. It is most commonly used as an input for energy-based pore pressure generation models [18]. Before the advent of these energy-based models, the assessment of liquefaction susceptibility and the generation of residual excess pore pressure relied on stress-based approaches [19,20,21,22,23,24].
The effectiveness of these energy-based models lies in the intrinsic link between energy dissipation and pore pressure evolution in soils subjected to cyclic loading. Both energy dissipation and excess pore pressure generation arise from the irreversible rearrangement of soil particles.
The energy dissipated per unit volume of soil is typically normalized by the initial effective confining pressure applied to the specimen, resulting in a parameter called the normalized dissipated energy per unit volume, Ws. During a cyclic triaxial test, Ws can be calculated using Equation (1) [25]:
where i and i+1 denote any two consecutive loading increments, n represents the total number of load increments, σ is the axial stress acting on the specimen, ε is the corresponding axial strain, and σo′ is the initial mean effective confining stress acting on the specimen.
Figure 5 illustrates the application of Equation (1). In the figure, the dissipated energy per unit volume corresponds to the area enclosed by the stress–strain hysteresis loops. It is based on the average applied deviator stress and the change in strain that occur due to the loading. This is then normalized by the initial effective stress, σo’ to produce the normalized dissipated energy for that loading increment, dWs. It is then summed over the loading increments up to the point of liquefaction to produce Ws.
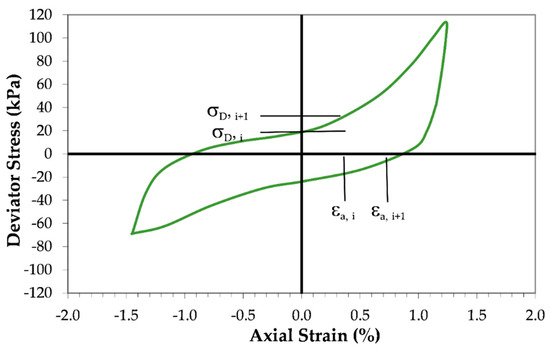
Figure 5.
Parameters used in Equation (1).
During the initial loading, the soil specimen is very stiff and little, if any, permanent deformation or strain occurs in the specimen. As a result, all or nearly all of the energy input into the specimen during that cycle of loading is returned and the hysteresis loop plots essentially as a single line. This is the case for both a specimen that will undergo flow liquefaction and one that will undergo cyclic mobility. These cases are presented as Case A in Figure 6 and Case D in Figure 7.
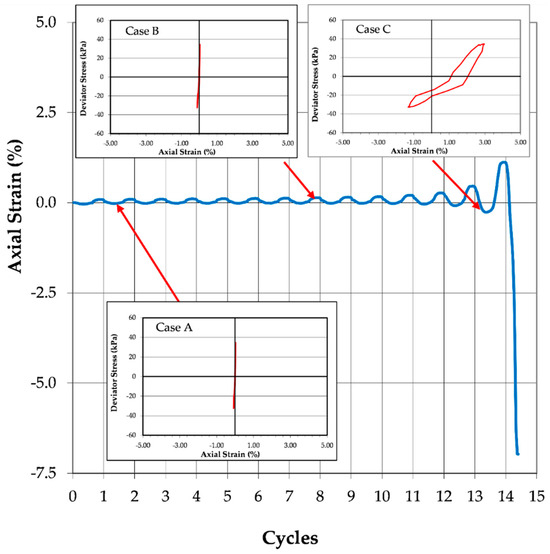
Figure 6.
Accumulation of energy dissipation with cycle of loading for flow liquefaction. Case A: stress–strain loop after one cycle of loading; Case B: stress–strain loop approximately one half of the way to liquefaction; Case C: stress–strain loop just prior to initial liquefaction.

Figure 7.
Accumulation of energy dissipation with cycle of loading for cyclic mobility. Case D: stress–strain loop after one cycle of loading; Case E: stress–strain loop approximately one half of the way to liquefaction; Case F: stress–strain loop just prior to initial liquefaction.
As loading continues, the behavior of the two specimens begins to differ. For the soil that will undergo flow liquefaction, after several cycles of loading, there is still almost no permanent strain and almost no energy dissipation. This case is represented as Case B in Figure 6. Due to the limited straining that has occurred in the test up to this point, the hysteresis loop still greatly resembles the hysteresis loop for Case A.
Conversely, in the specimen that will eventually undergo cyclic mobility, after several cycles of loading, straining and energy dissipation have begun to occur in the specimen. This is represented as Case E in Figure 7. Because of the straining that the specimen has undergone, the hysteresis loop has begun to grow, moving away from the straight-line shape of the hysteresis loop seen in Case D. The area inside the hysteresis loop in Case E represents the energy that has been dissipated in the specimen.
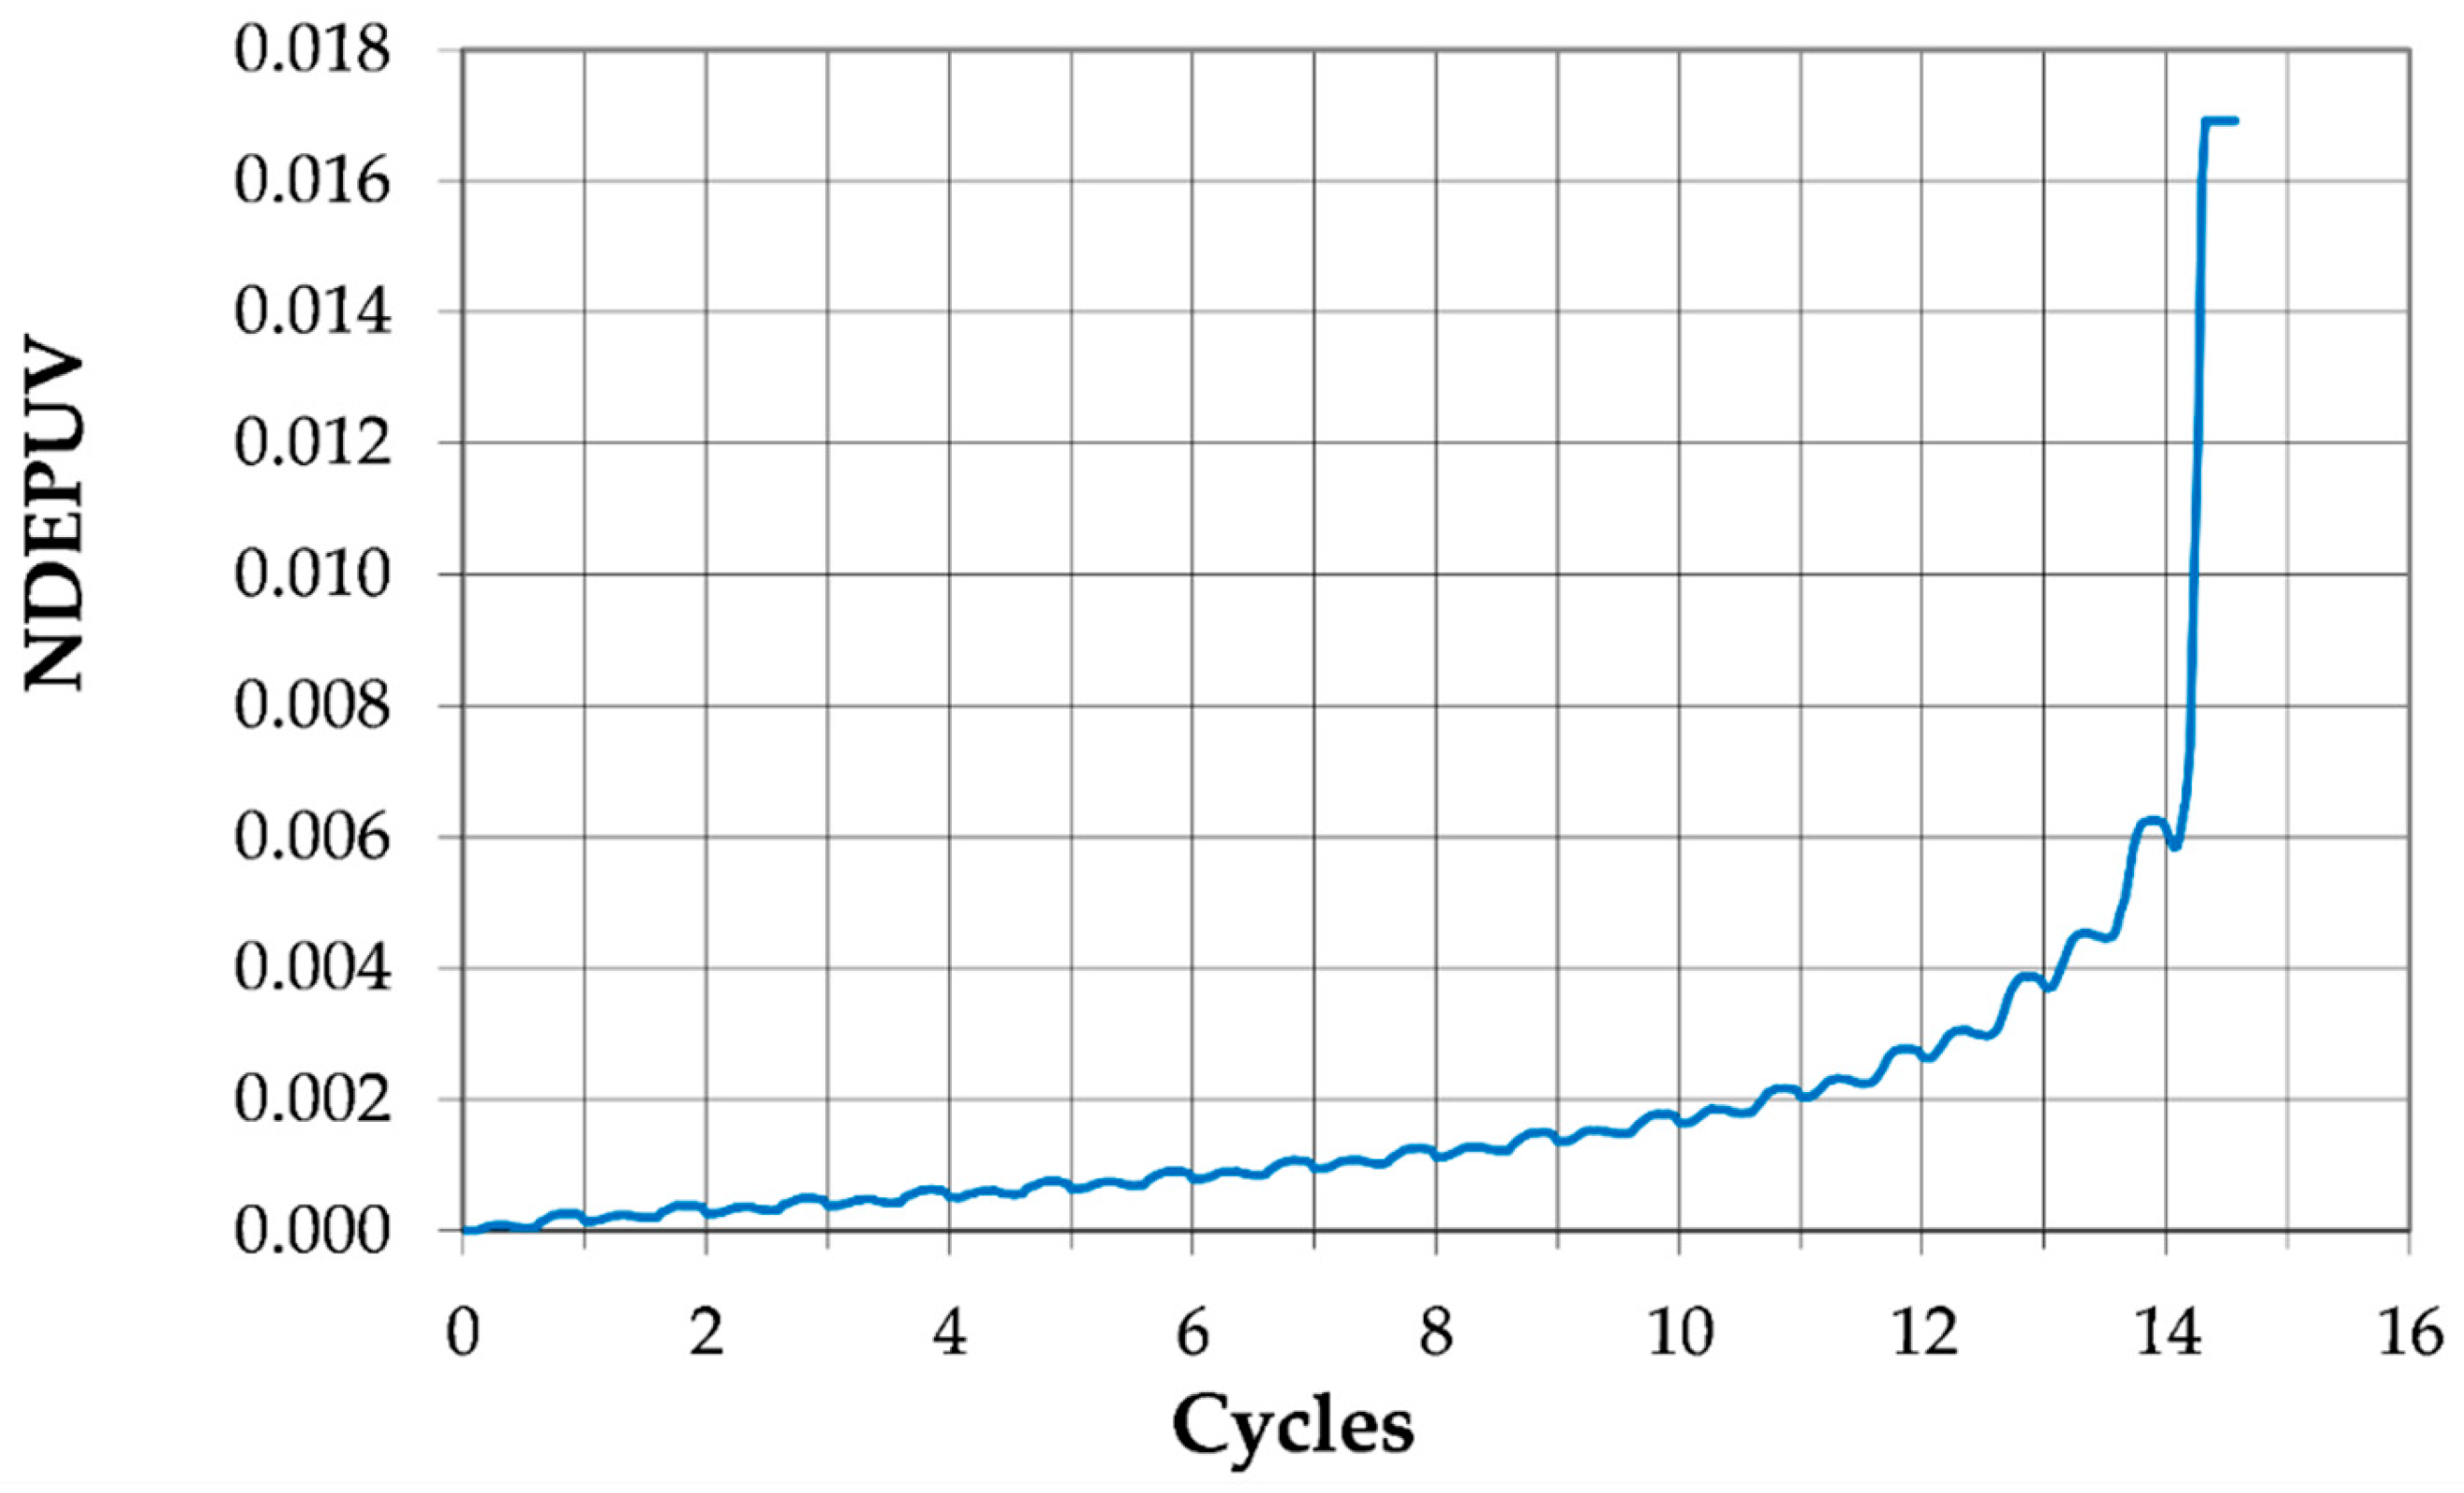
As the specimen in Figure 6 approaches initial liquefaction, it begins to undergo axial straining. At this point, its hysteresis loop, shown as Case C, has grown markedly to reflect the energy that is being dissipated in the specimen. This sudden increase in energy dissipation as the soil reaches liquefaction is common for soils that undergo flow liquefaction failures. This pattern can be seen in Figure 8, which plots energy dissipation versus cycle of loading for the cyclic triaxial test shown in Figure 6.
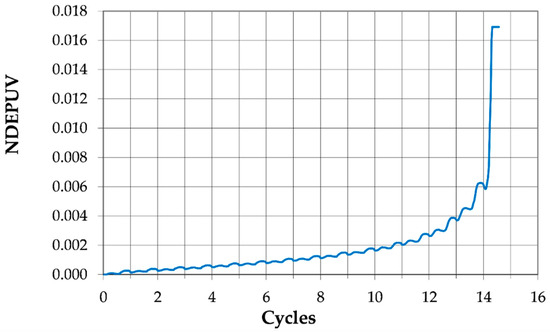
Figure 8.
Accumulation of NDEPUV with cycle of loading for the case of flow liquefaction presented in Figure 6.
In Figure 8, it is apparent that more than half of the energy lost in the specimen is dissipated in the last half a cycle of loading. This is due to the collapse of the specimen and the rapid straining that occurs during flow liquefaction.
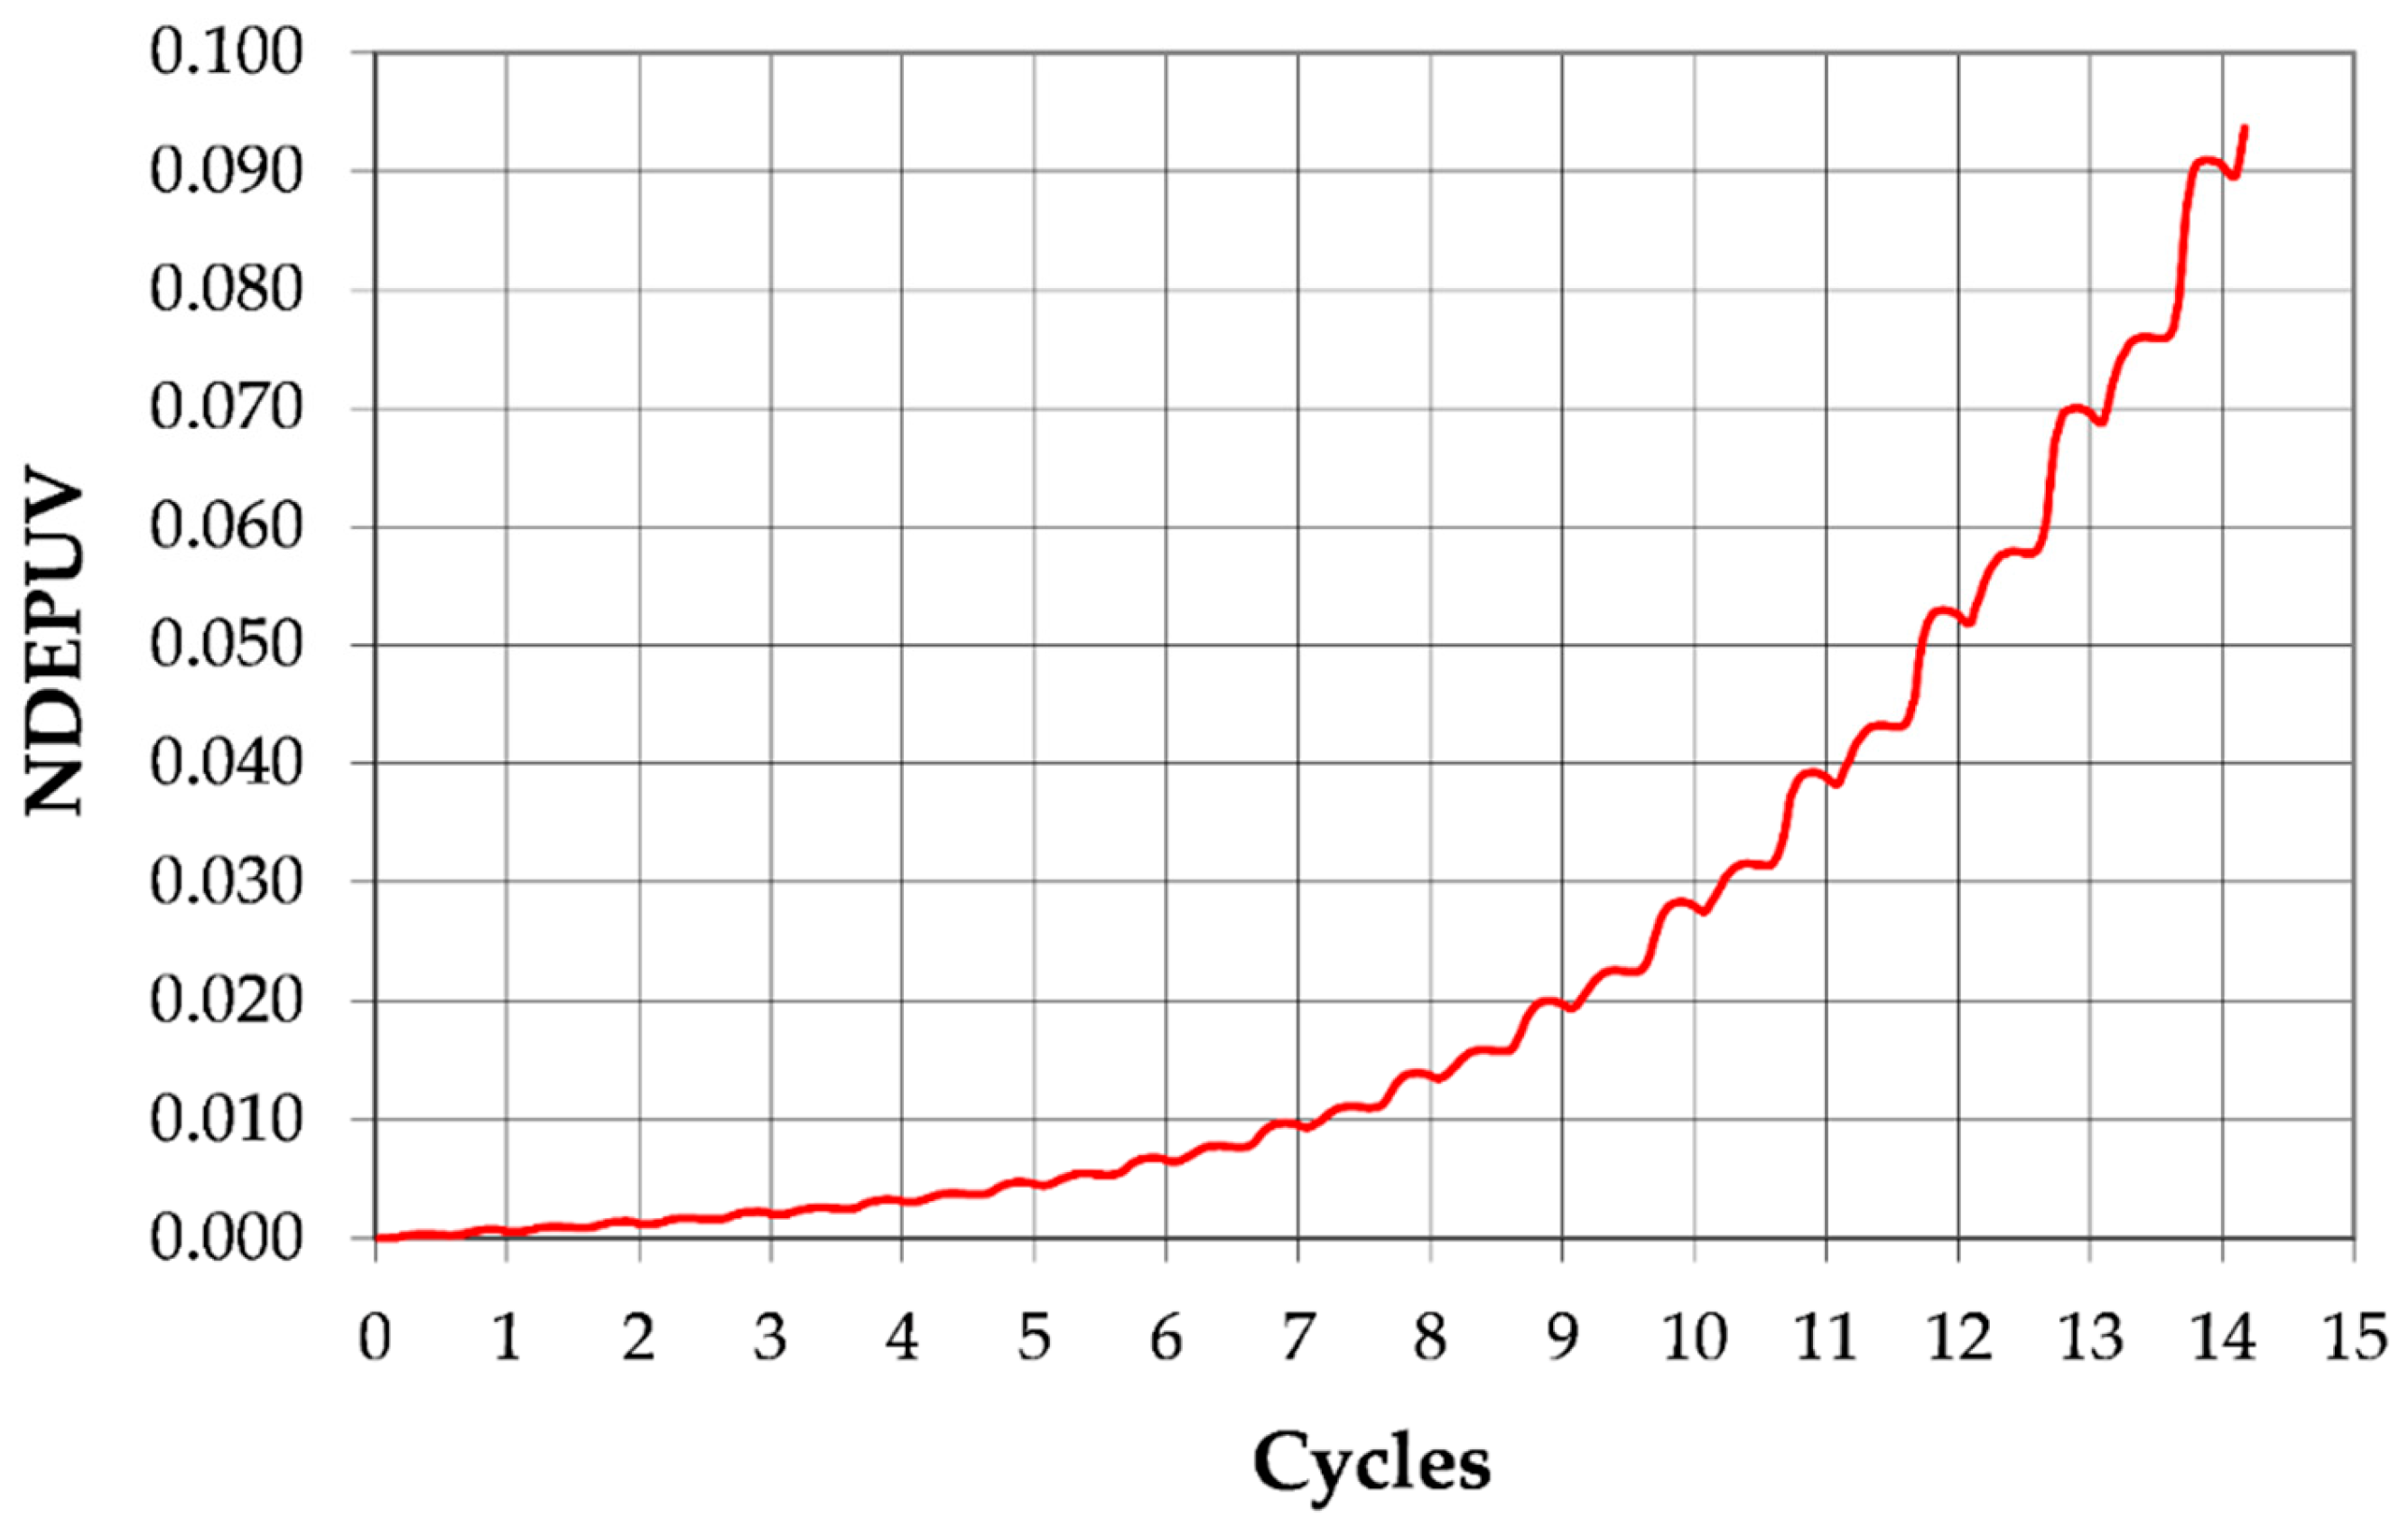
As the specimen in Figure 7 approaches initial liquefaction, it continues to undergo axial straining. The level of axial strain continues to increase with each cycle of loading. At this point, its hysteresis loop, shown as Case F, has grown markedly to reflect the energy that is being dissipated in the specimen. Unlike the flow liquefaction specimen shown in Figure 6, this increase in energy dissipation as the soil reaches liquefaction has been a gradual rather than a sudden increase. This steady accumulation of strain and energy dissipation is common for soils that undergo cyclic mobility failures. This pattern can be seen in Figure 9, which plots energy dissipation versus cycle of loading for the cyclic triaxial test shown in Figure 7.

Figure 9.
Accumulation of NDEPUV with cycle of loading for the case of cyclic mobility presented in Figure 7.
In Figure 9, about half the energy dissipated in the specimen is dissipated steadily over the last 20% of the loading. There is no sudden increase in energy dissipation as seen in Figure 8. The energy dissipation is occurring at a fairly steady rate There is no runaway straining that typifies flow liquefaction, simply the accumulation of strain that typifies cyclic mobility.
3. Laboratory Testing Program
The dataset analyzed comprised 256 stress-controlled cyclic triaxial tests previously conducted by the author [5]. The soils tested consisted of sands and non-plastic silts with silt content ranging from 0% to 100%. For this study, the number of cycles to liquefaction and the normalized dissipated energy per unit volume were determined for each cyclic triaxial test based upon several different liquefaction criteria. Details of the soils tested and the testing methodology are provided in this section.
3.1. Soils Tested
The soils used in this study consisted of two sands and one non-plastic silt. The coarse-grained materials used in the study were Yatesville sand and Monterey 0/30 sand. The fine-grained portion of the specimens consisted of various quantities of Yatesville silt.
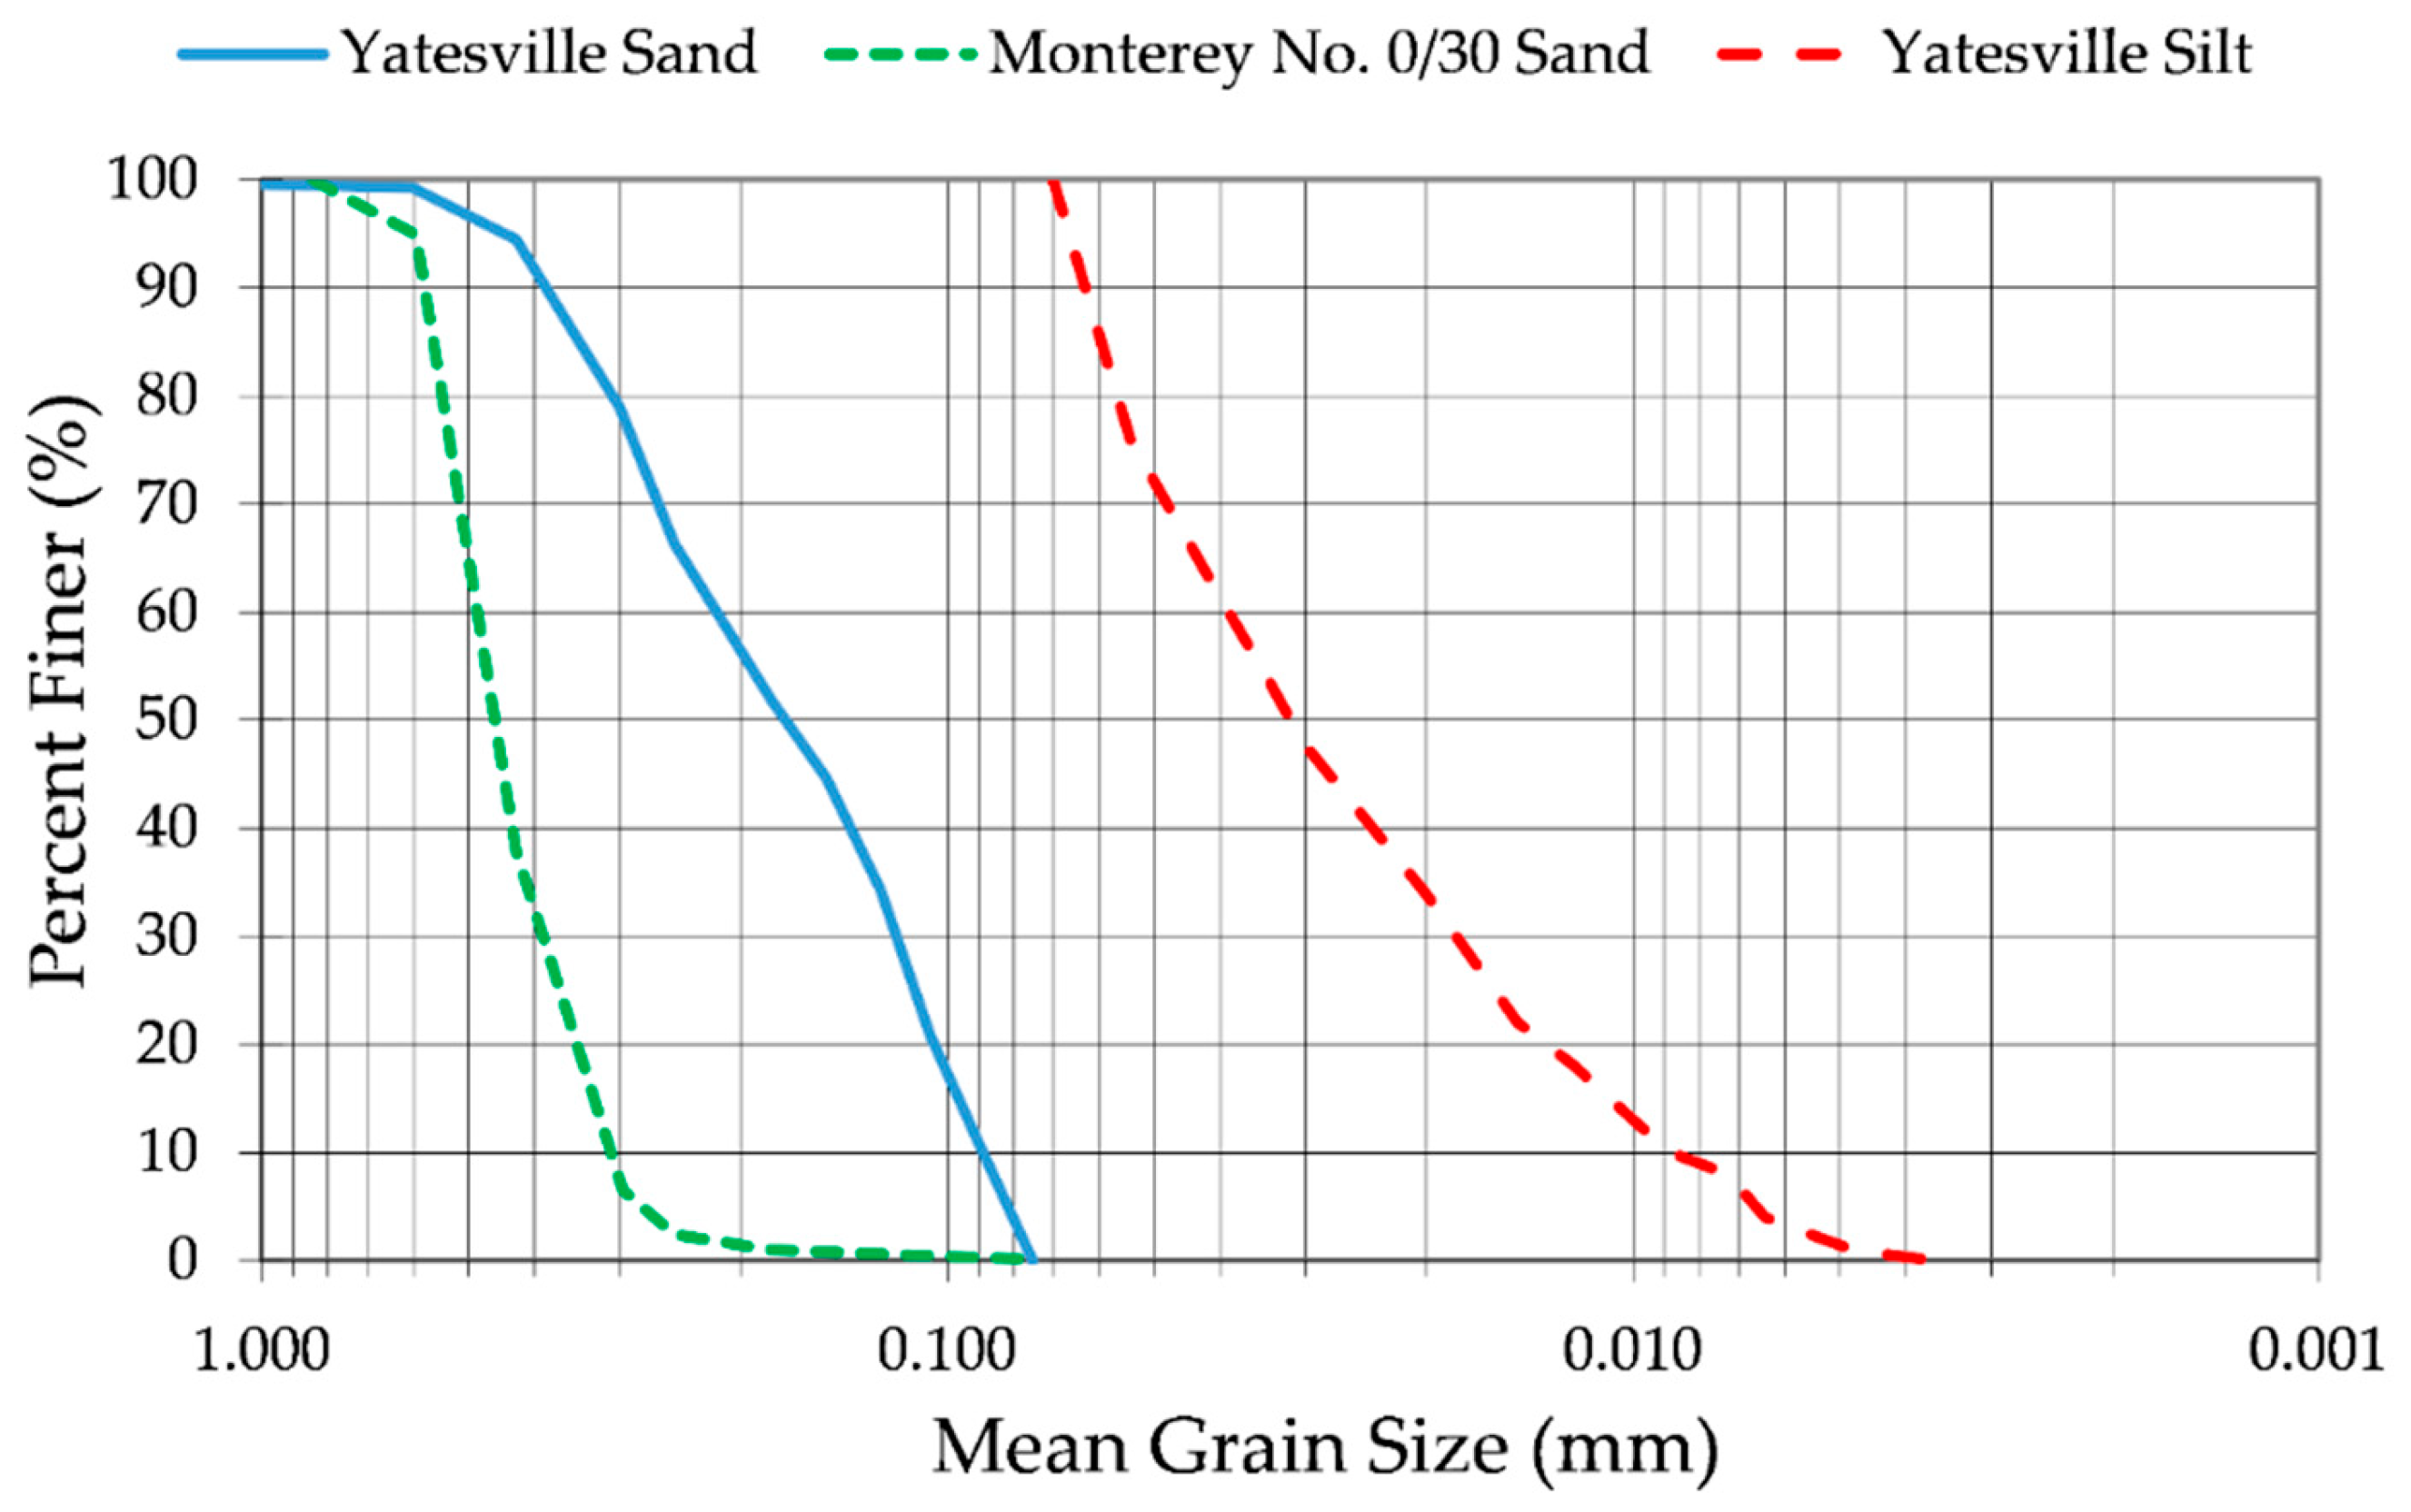
Yatesville sand was obtained from a dam site in Lawrence County, Kentucky. It consists of the coarse-grained fraction of Yatesville silty sand. It is a poorly graded sand consisting of sub-angular to sub-rounded medium to fine sand particles. Its index properties are provided in Table 1 and its grain size-distribution curve is presented in Figure 10.

Table 1.
Index properties of the soils used in the study.
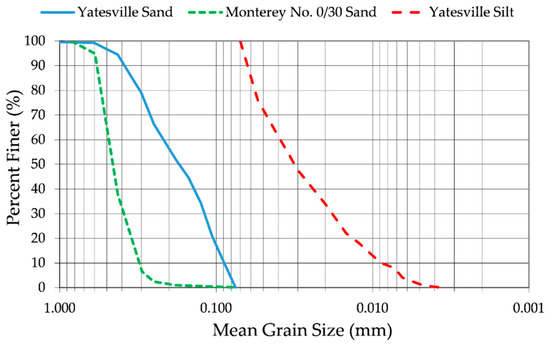
Figure 10.
Grain size distribution curves for the soils used in the study.
3.2. Soil Mixtures
The impacts of non-plastic fine content on the liquefaction resistance of sands was studied using 18 combinations of sand, silt, and sand and silt. Tests were performed using each of the sands and the pure silt. The silt content of the soil mixtures varied from 4% to 75% by weight. A complete listing of the soil mixtures tested and information on their index properties are presented in Table 2 for the soil mixtures that used Yatesville sand as the base sand and Table 3 for the soil mixtures that used Monterey 0/30 sand as the base sand.
Table 2.
Index properties for mixtures of Yatesville sand and Yatesville silt.
Table 3.
Index properties for mixtures of Monterey 0/30 sand and Yatesville silt.
3.3. Cyclic Triaxial Testing
The cyclic resistance of the tested soils was evaluated through stress-controlled cyclic triaxial tests conducted in accordance with ASTM D5311—Standard Test Method for Load-Controlled Cyclic Triaxial Strength of Soil [4] The cyclic triaxial testing of soil mixtures was performed using an electropneumatic cyclic triaxial apparatus, following the methodology established by Silver [26].
All triaxial specimens had a diameter of 71 mm and a height of 154 mm, prepared using the moist tamping method. The specimens were prepared at water content that corresponded to 50% saturation. To achieve a uniform density throughout the specimen, the undercompaction technique was employed [27]. Following specimen preparation and placement within the triaxial cell, saturation was facilitated by flushing CO2 through the specimen for a minimum of 15 min to expel air from the soil voids. Subsequently, at least three pore volumes of de-aired water was introduced to remove the CO2. Complete saturation was ensured by applying sufficient back pressure, after which the specimen was isotropically consolidated under a confining stress of 100 kPa.
Once consolidated, the specimens were subjected to a sinusoidally varying deviator stress at the designated cyclic stress ratio until liquefaction occurred.
For each combination of fines type and fines content, the cyclic resistance ratio was determined based on a minimum of three cyclic triaxial tests performed on identically prepared specimens.
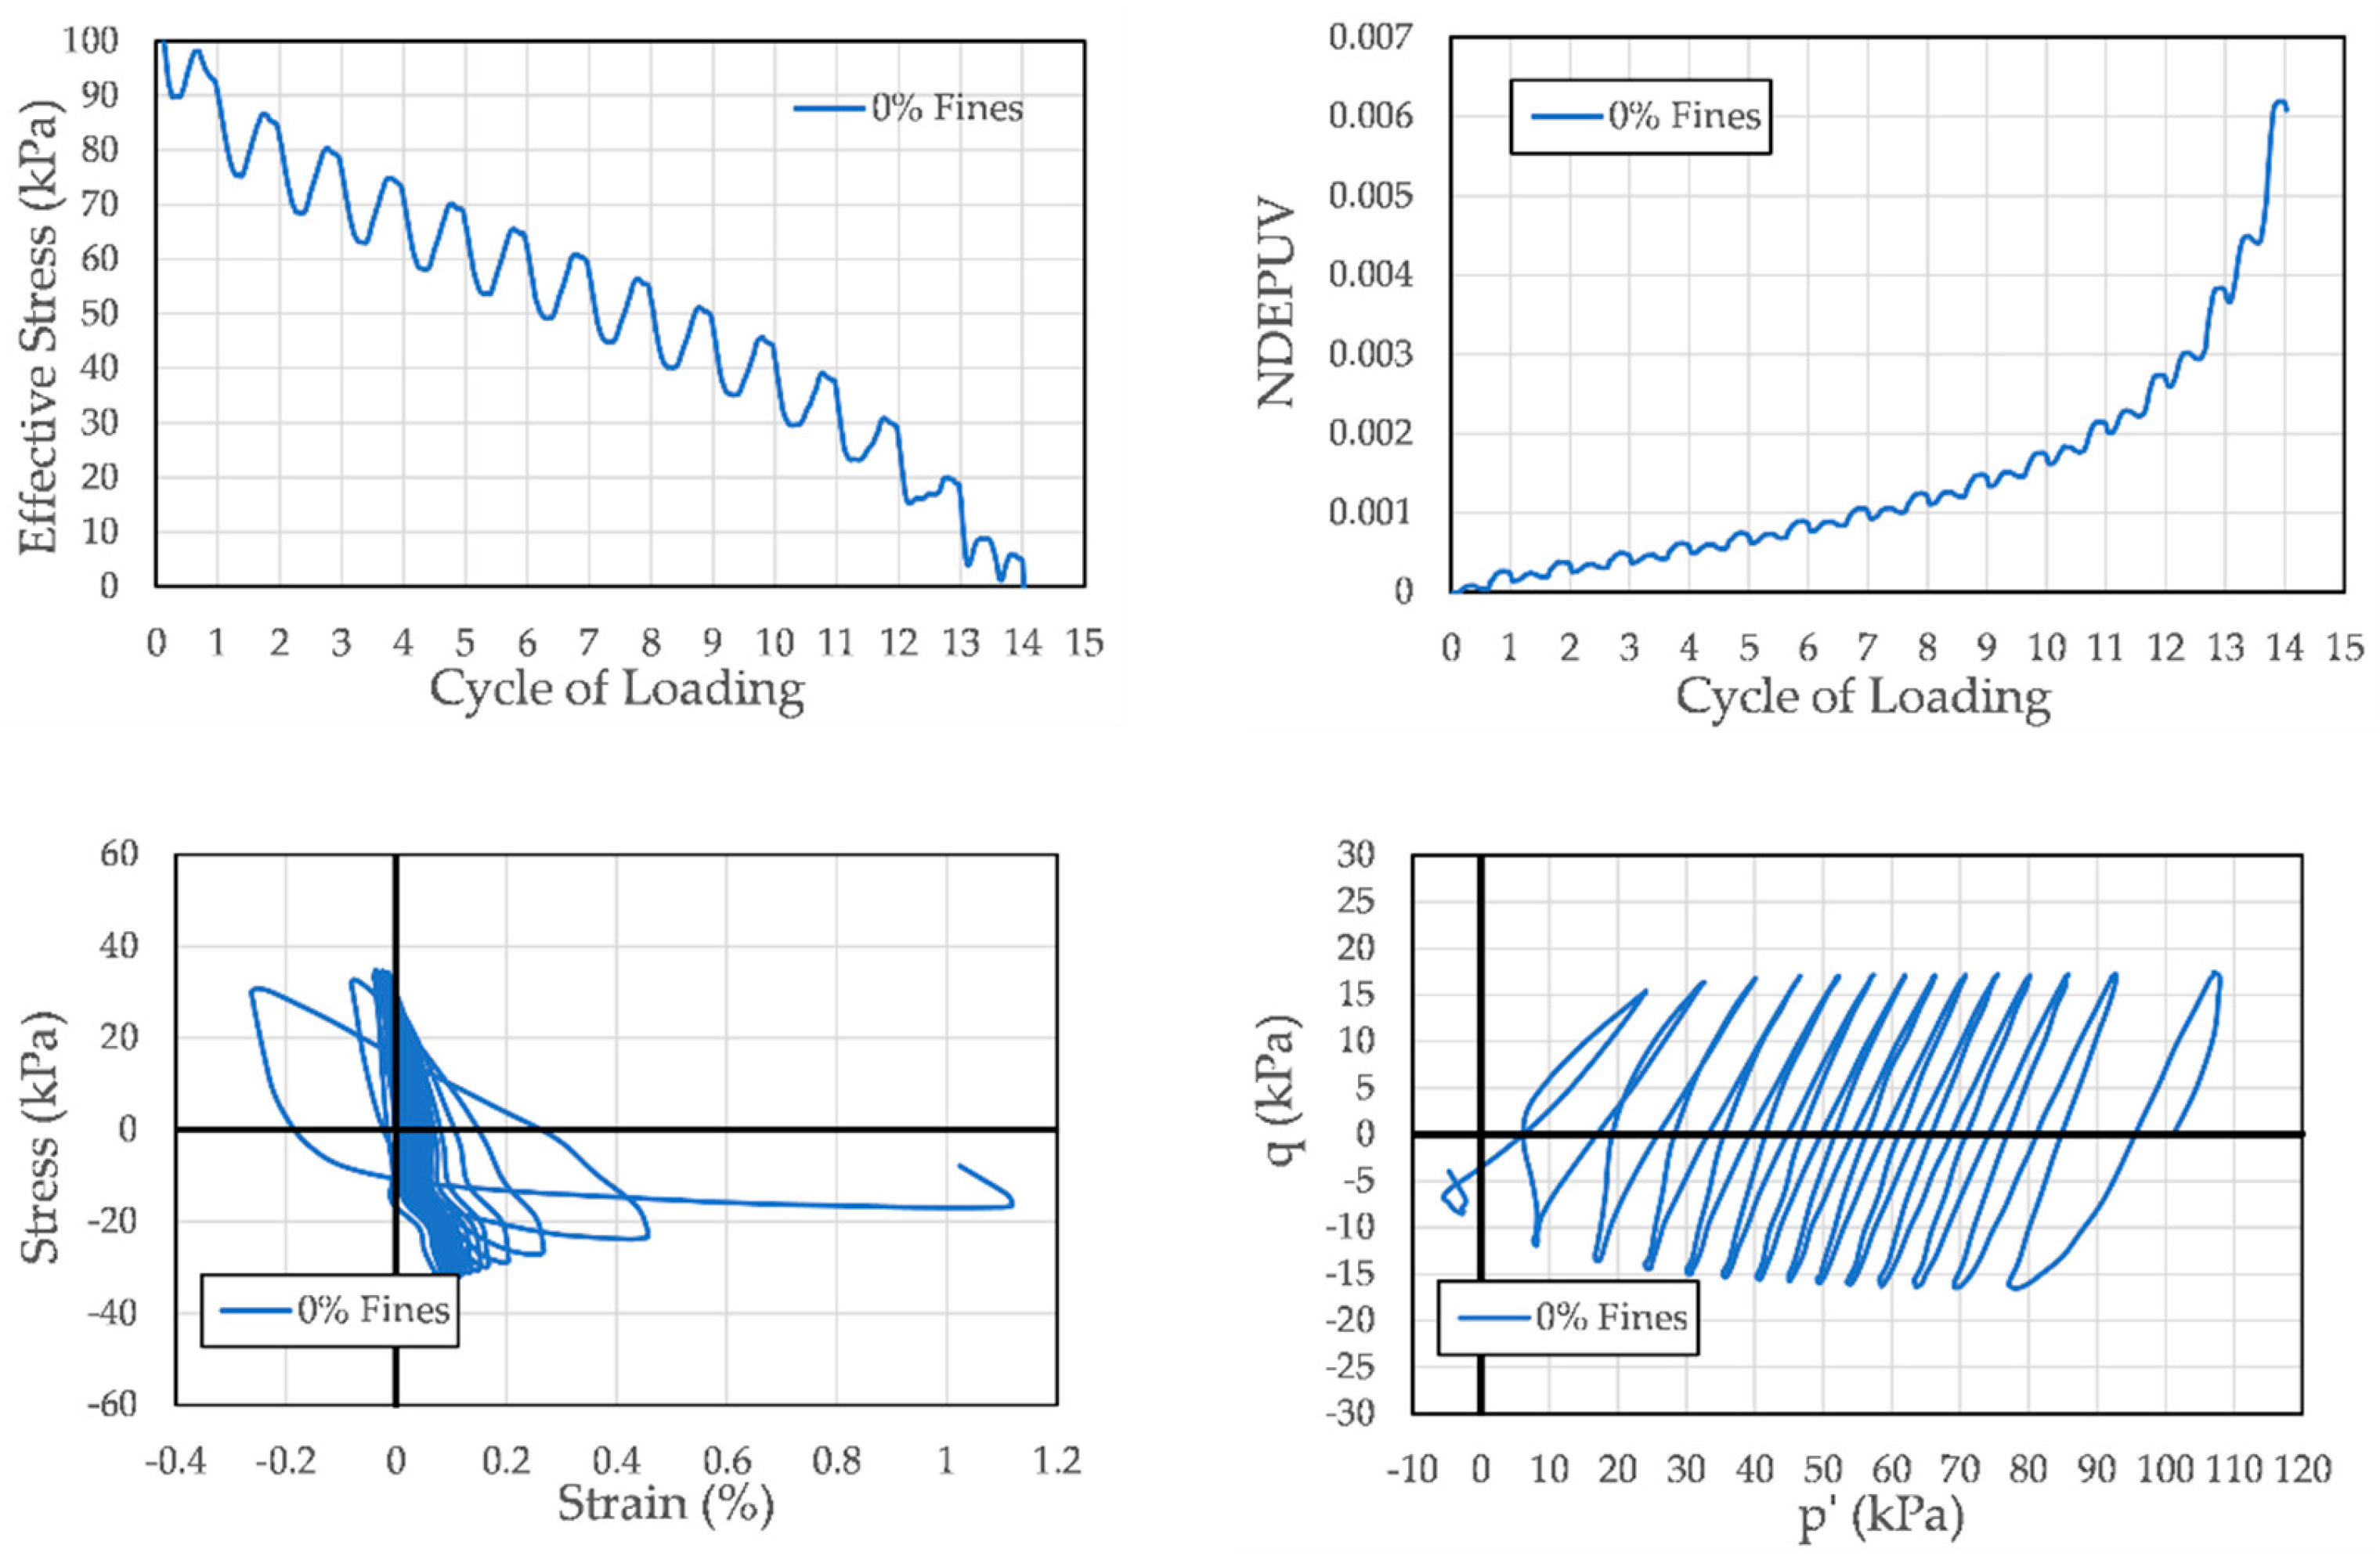
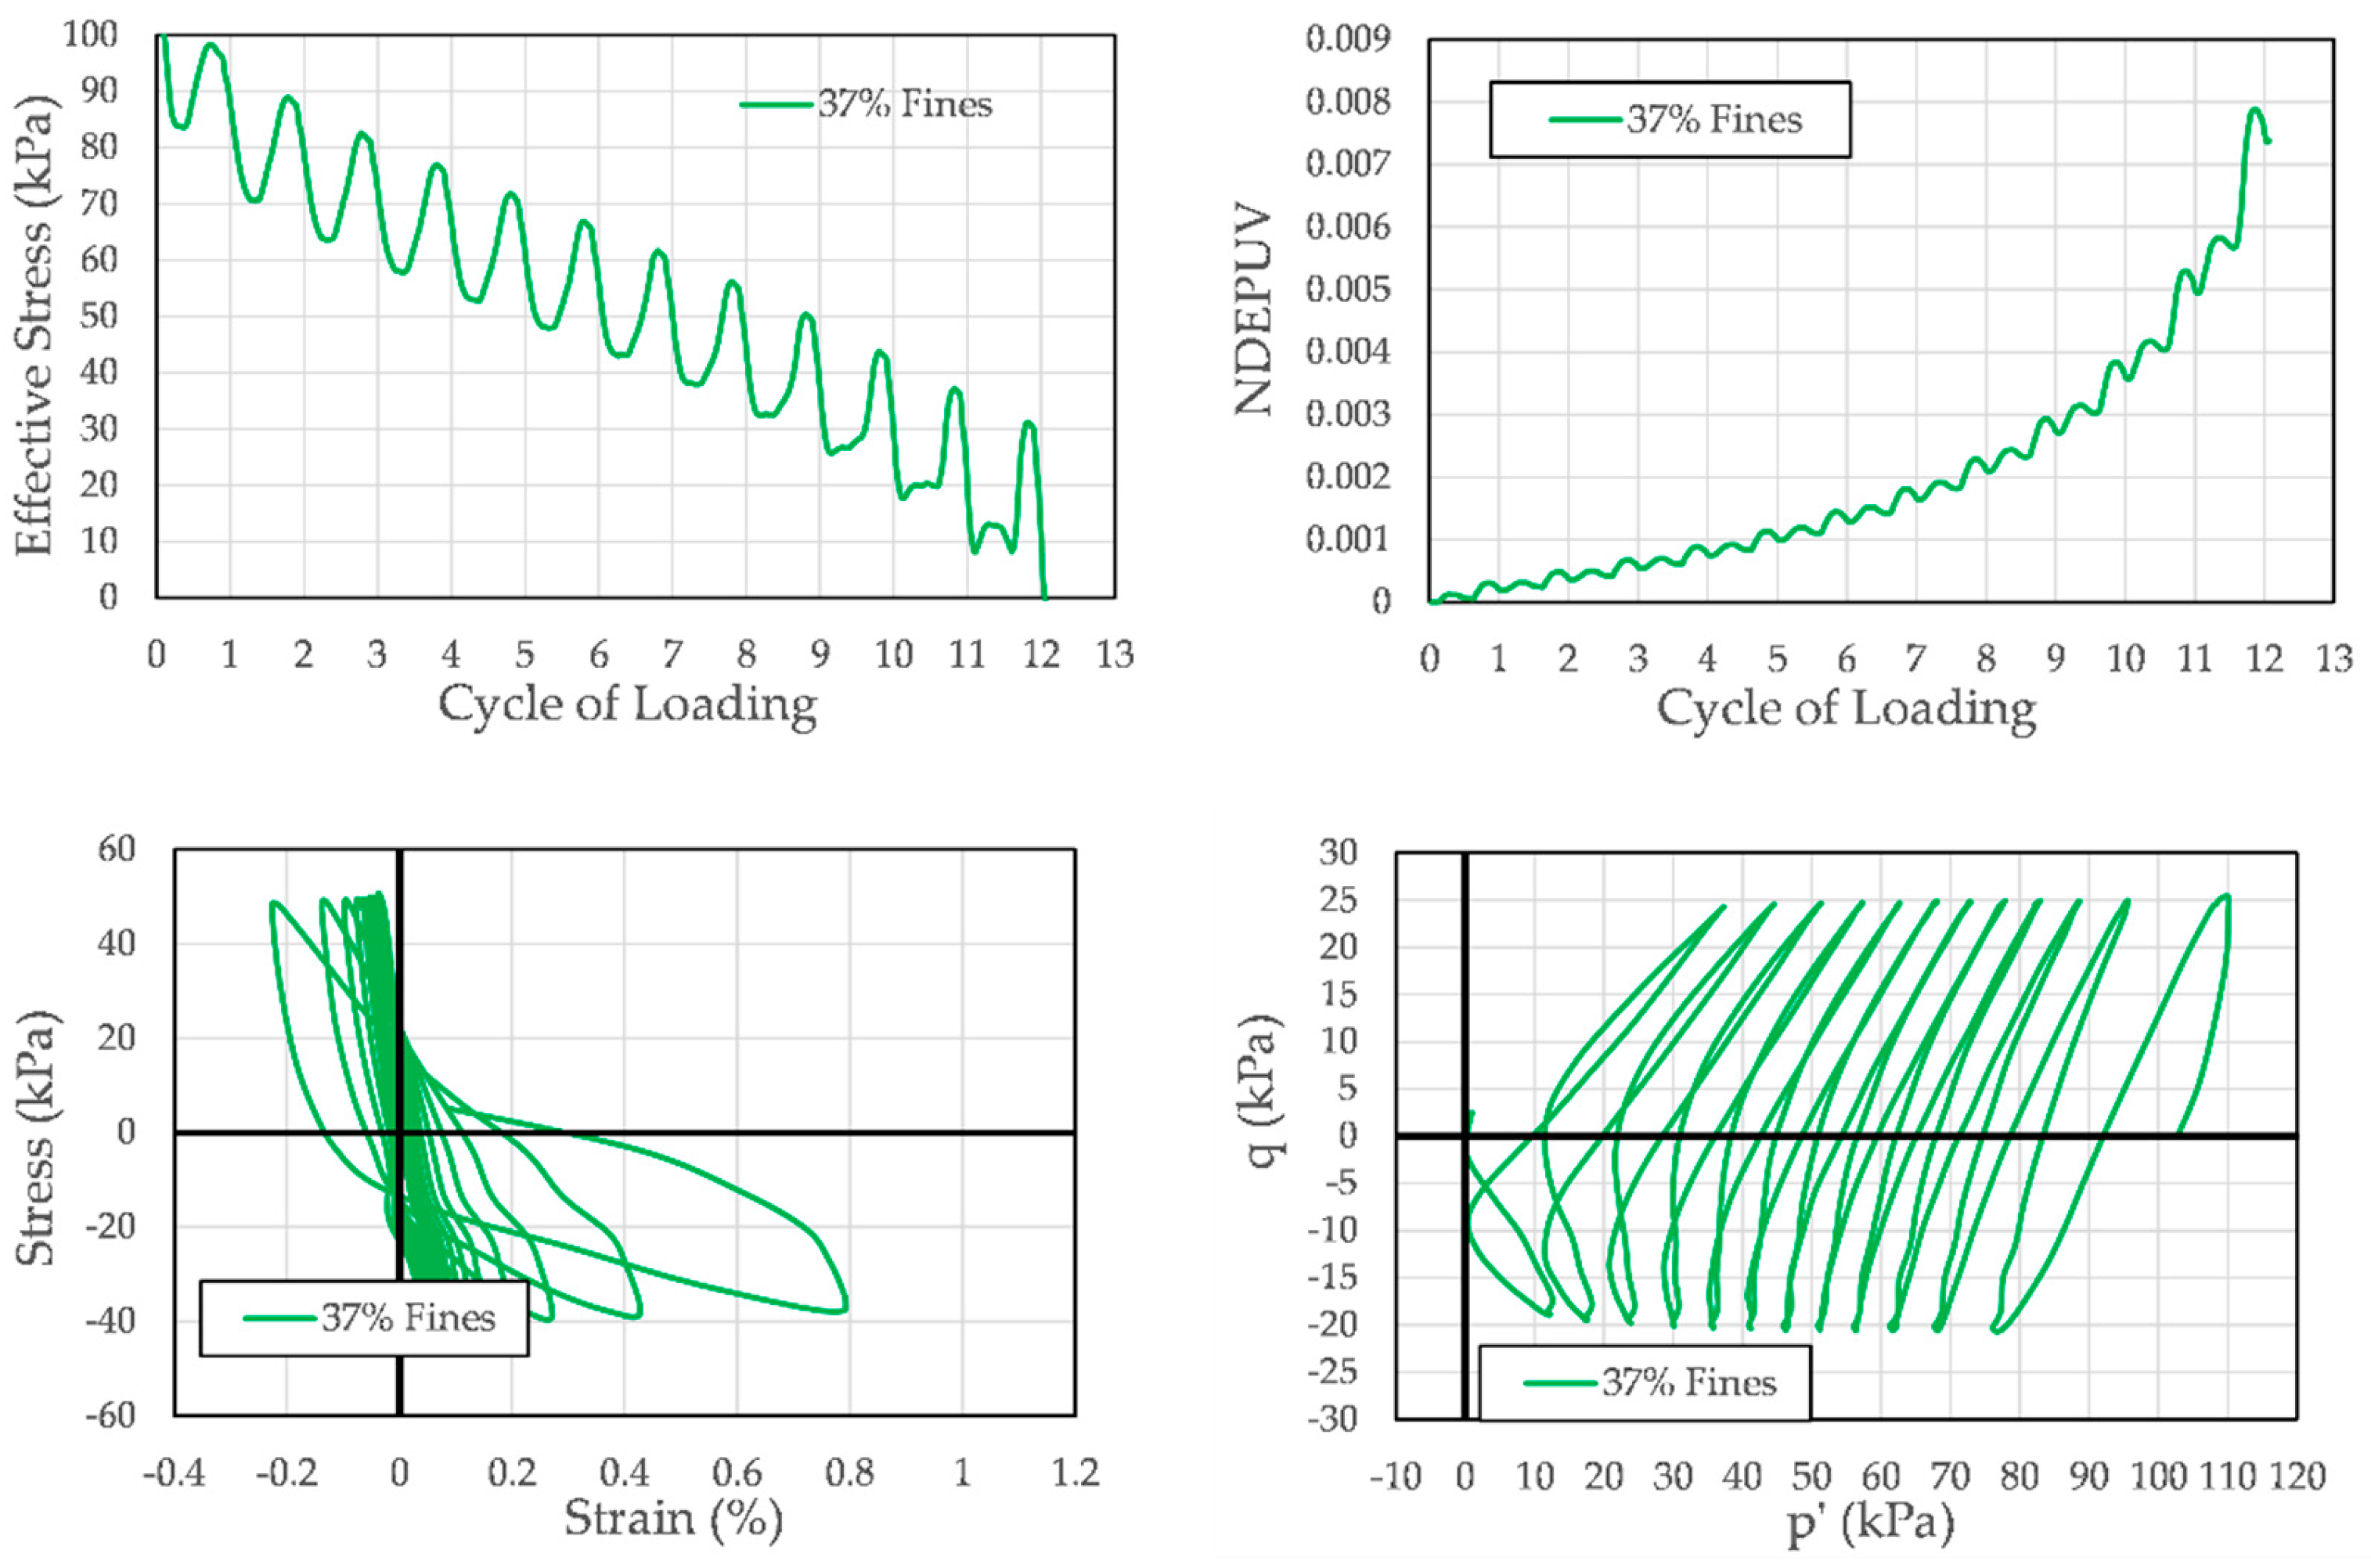
Typical results for cyclic triaxial tests performed on mixtures of Yatesville sand and Yatesville silt are presented in Figure 11, Figure 12 and Figure 13. These figures are from tests performed on specimens with 0%, 37% and 100% fines content, respectively. These represent a soil that is well below the threshold fines content (0% silt), one that is well above the threshold fines content (100% silt), and one that is near the threshold fines content (37% silt).
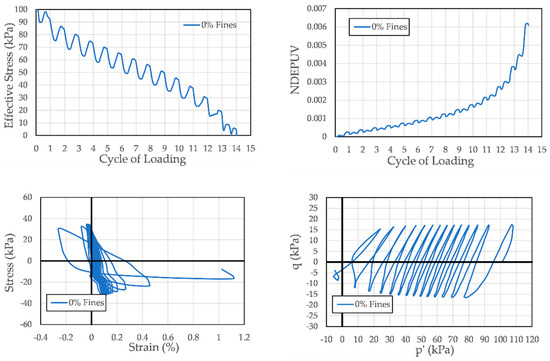
Figure 11.
Test results for a specimen of Yatesville sand loaded to a cyclic stress ratio of 0.22 and failing in 14 cycles.
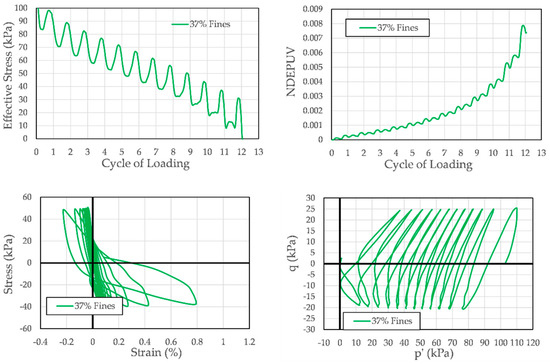
Figure 12.
Test results for a specimen of Yatesville sand with 37% silt loaded to a cyclic stress ratio of 0.25 and failing in 12 cycles.
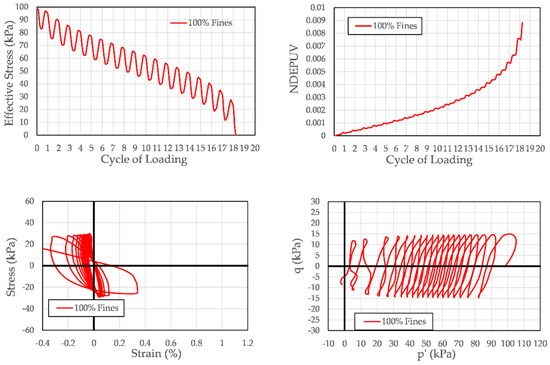
Figure 13.
Test results for a specimen of Yatesville silt loaded to a cyclic stress ratio of 0.18 and failing in 18 cycles.
The number of loading cycles required to induce liquefaction was determined using the following criteria.
- Stress-based criterion: The stress-based liquefaction criterion used was initial liquefaction. Initial liquefaction was defined as occurring when the effective stress acting on the specimen reached 0 kPa. This corresponds to a pore pressure ratio, ru, of 1.0, where ru is the ratio of the excess pore pressure that has been generated in the specimen during cyclic loading to the initial effective confining stress.
- Strain-based criteria: Liquefaction was also defined at four strain thresholds—0.5%, 1%, 2%, and 5% single-amplitude axial strain—in either extension or compression.
The liquefaction behavior of the specimens was categorized into two failure modes:
- Flow liquefaction failure: Specimens reaching initial liquefaction within 5% of the number of cycles of loading required to obtain 0.5% axial strain. For example, if a specimen reached 0.5% axial strain in 10.0 cycles of loading, it would be deemed to have experienced flow liquefaction if it achieved initial liquefaction (i.e., zero effective stress) between 9.5 and 10.5 cycles of loading.
- Cyclic mobility failure: Specimens requiring more than 5% of the number of cycles of loading required to obtain 0.5% axial strain to reach initial liquefaction after attaining 0.5% axial strain.
The effects of relative density and non-plastic fines content on failure mode susceptibility were subsequently analyzed, followed by an examination of how the choice of failure criterion influenced the number of cycles required to induce liquefaction.
4. Discussion
The results of the laboratory testing were first examined to evaluate the interaction of the different failure criteria and two parameters: the relative density of the soil and the number of cycles required to trigger liquefaction. Then, the cyclic resistance curves for the different failure criteria were reviewed for both soils that underwent flow liquefaction and soils that underwent cyclic mobility. Lastly, the differences in the amount of normally dissipated energy per unit volume required to initiate liquefaction was examined for both soils that underwent flow liquefaction and soils that underwent cyclic mobility.
4.1. Effect on Relative Density
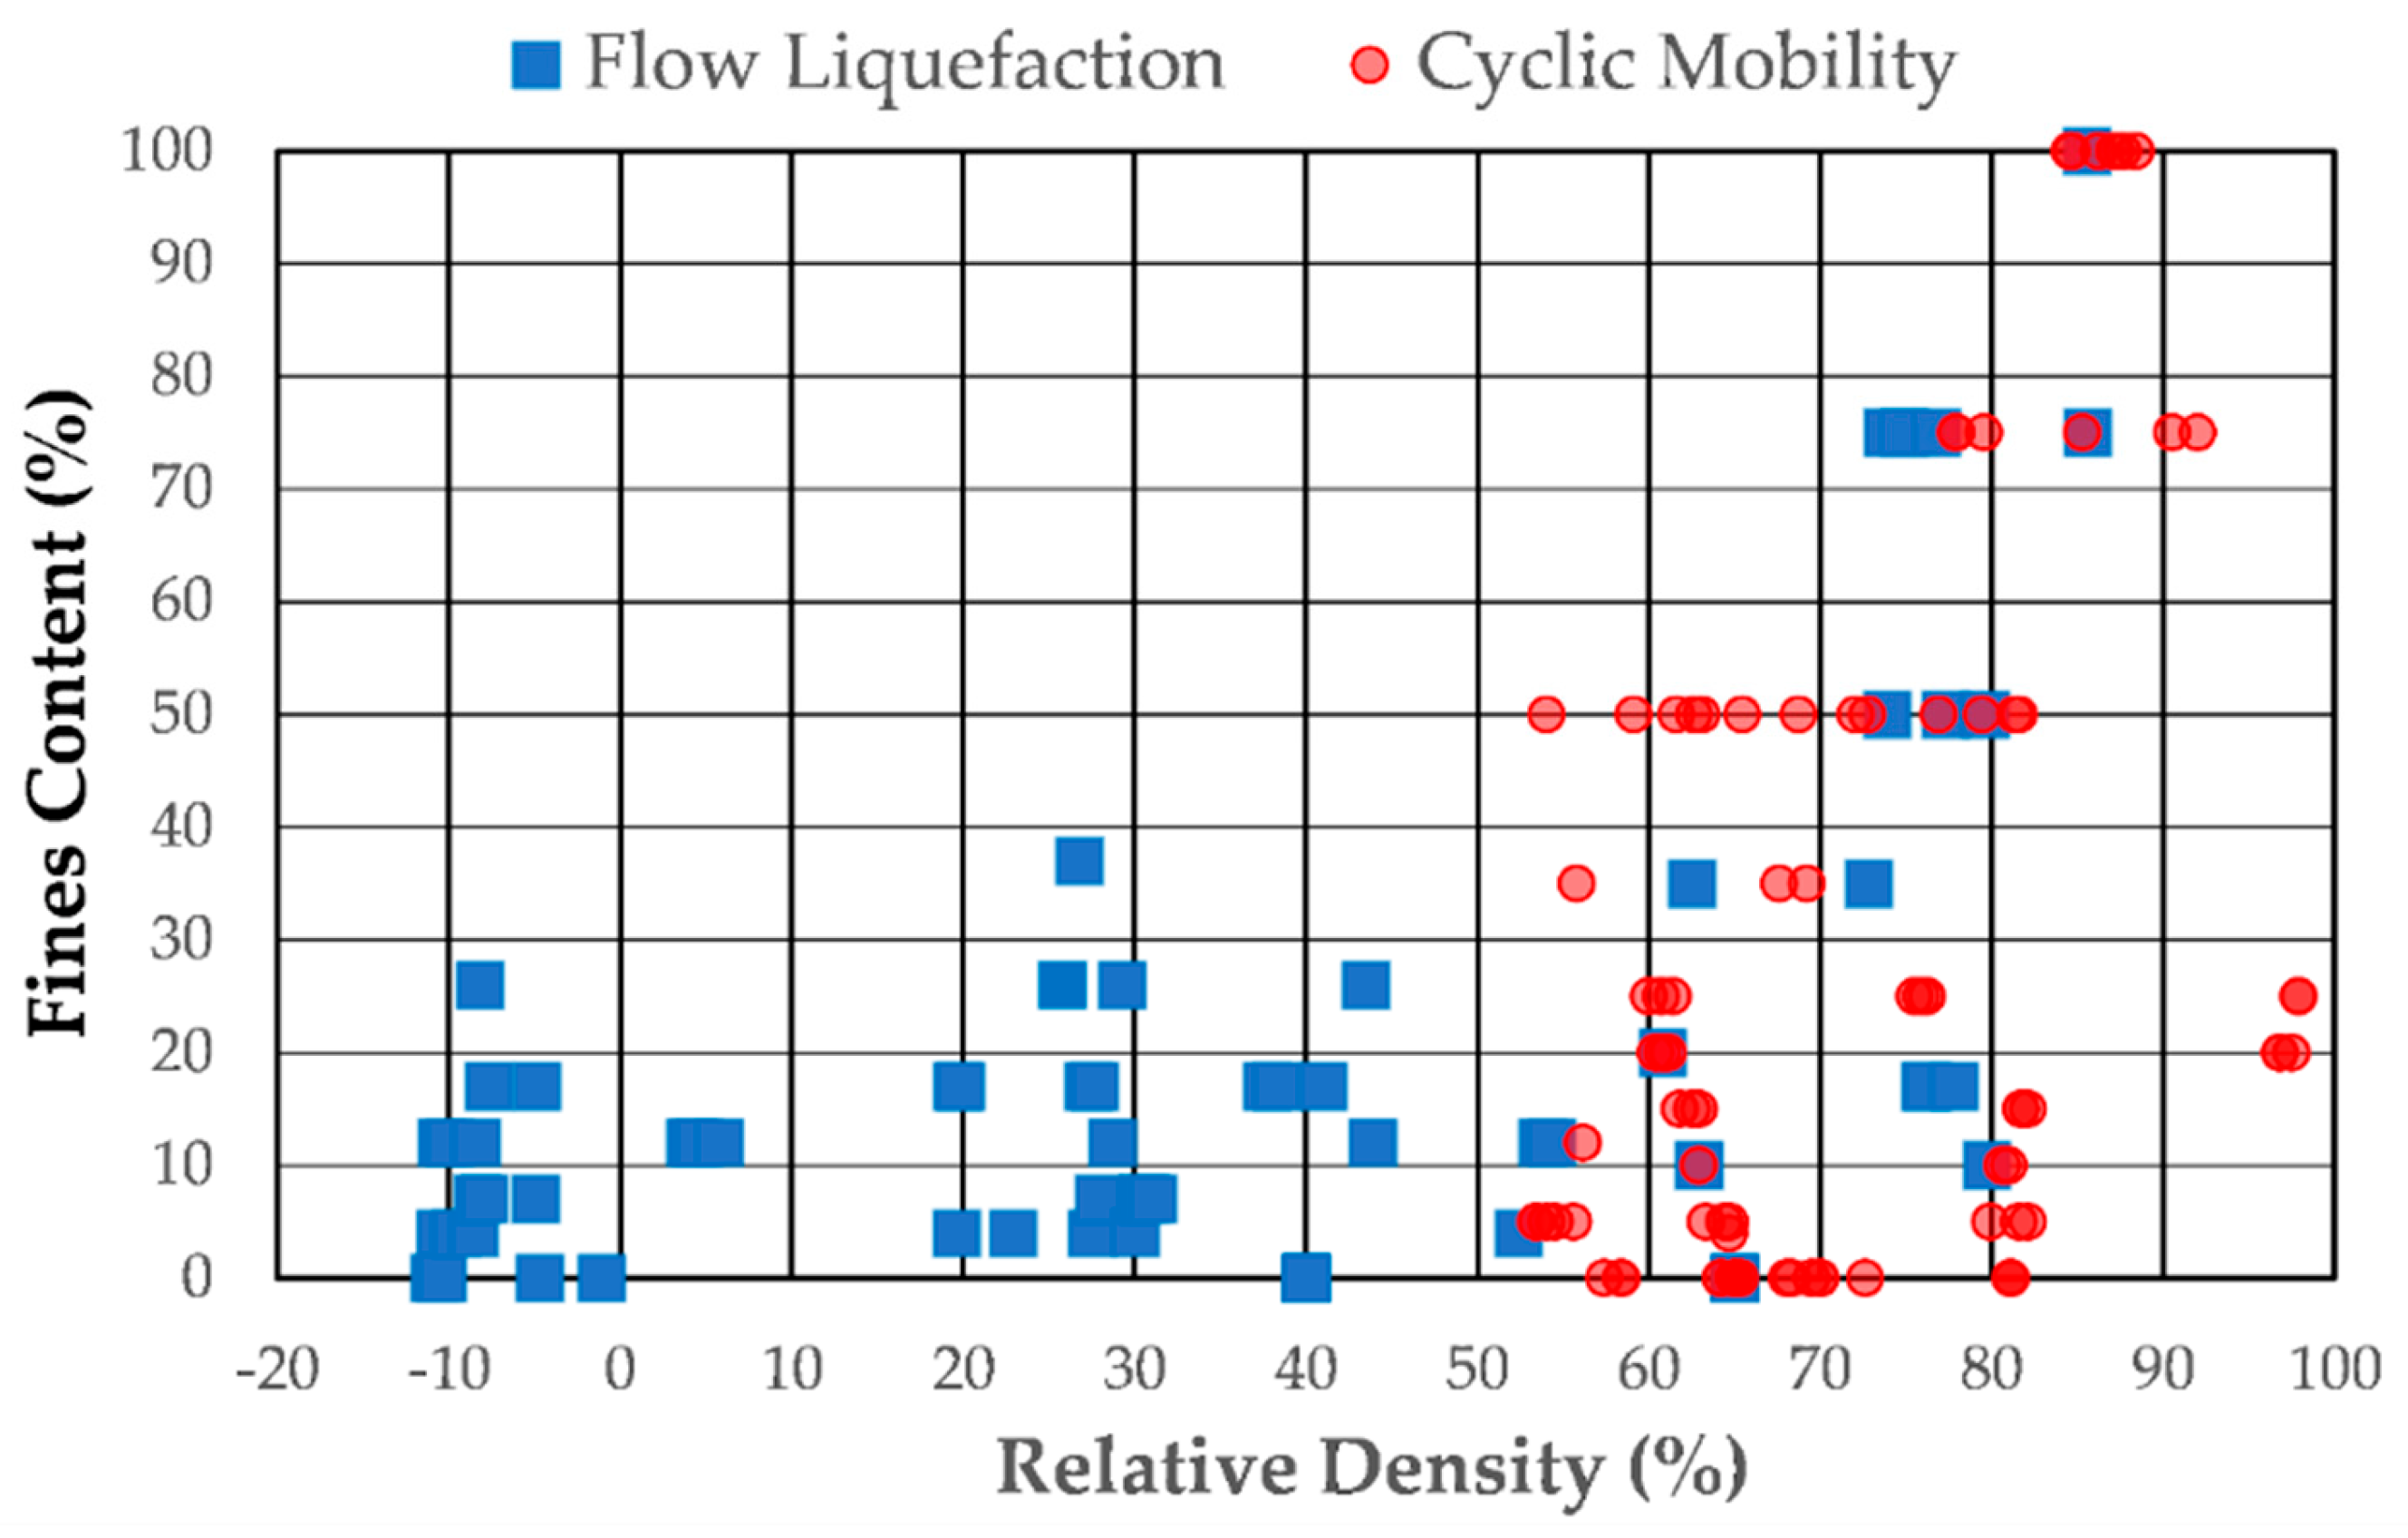
Analysis of the cyclic triaxial test results revealed that relative density is the dominant factor determining whether a soil undergoes flow liquefaction or cyclic mobility. Figure 14 illustrates that all specimens with relative densities below 50% exhibited flow liquefaction, irrespective of fines content. Conversely, most specimens with relative densities above 50% experienced cyclic mobility, although some with relative densities as high as 85% exhibited flow liquefaction.
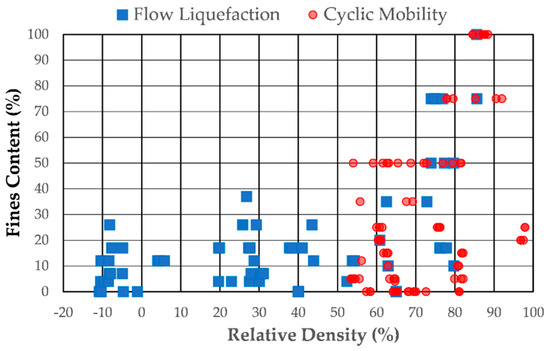
Figure 14.
Flow liquefaction and cyclic mobility as a function of specimens’ relative density and fines content.
4.2. Effect of Failure Criteria on the Number of Cycles Required to Trigger Liquefaction
The effect of failure criteria on the number of cycles required to trigger liquefaction may be seen in Figure 15. The figure plots the number of cycles required to induce liquefaction for each of the four strain-based criteria versus the number of cycles required to induce liquefaction for the case of initial liquefaction. This was chosen to compare the strain-based criteria against the initial liquefaction criteria, as initial liquefaction is the most commonly used liquefaction criterion. Additionally, for clarity, the figure is limited to tests that liquefied in 100 cycles or fewer, representing a very conservative upper bound for the number of cycles of loading applied by an earthquake in the field [28]. The results for the tests that required more than 100 cycles of loading to liquefy follow the same pattern as seen in the figure.
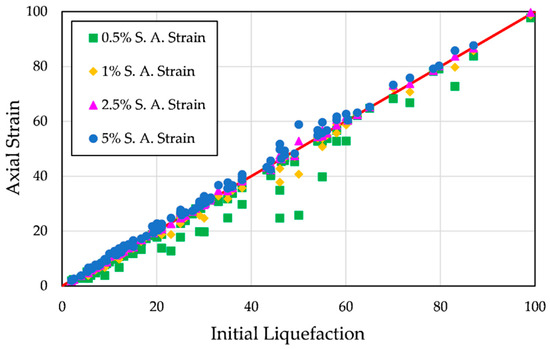
Figure 15.
Comparison of the number of cycles of loading to initiate liquefaction for different strain-based failure criteria to the number of cycles of loading required for initial liquefaction.
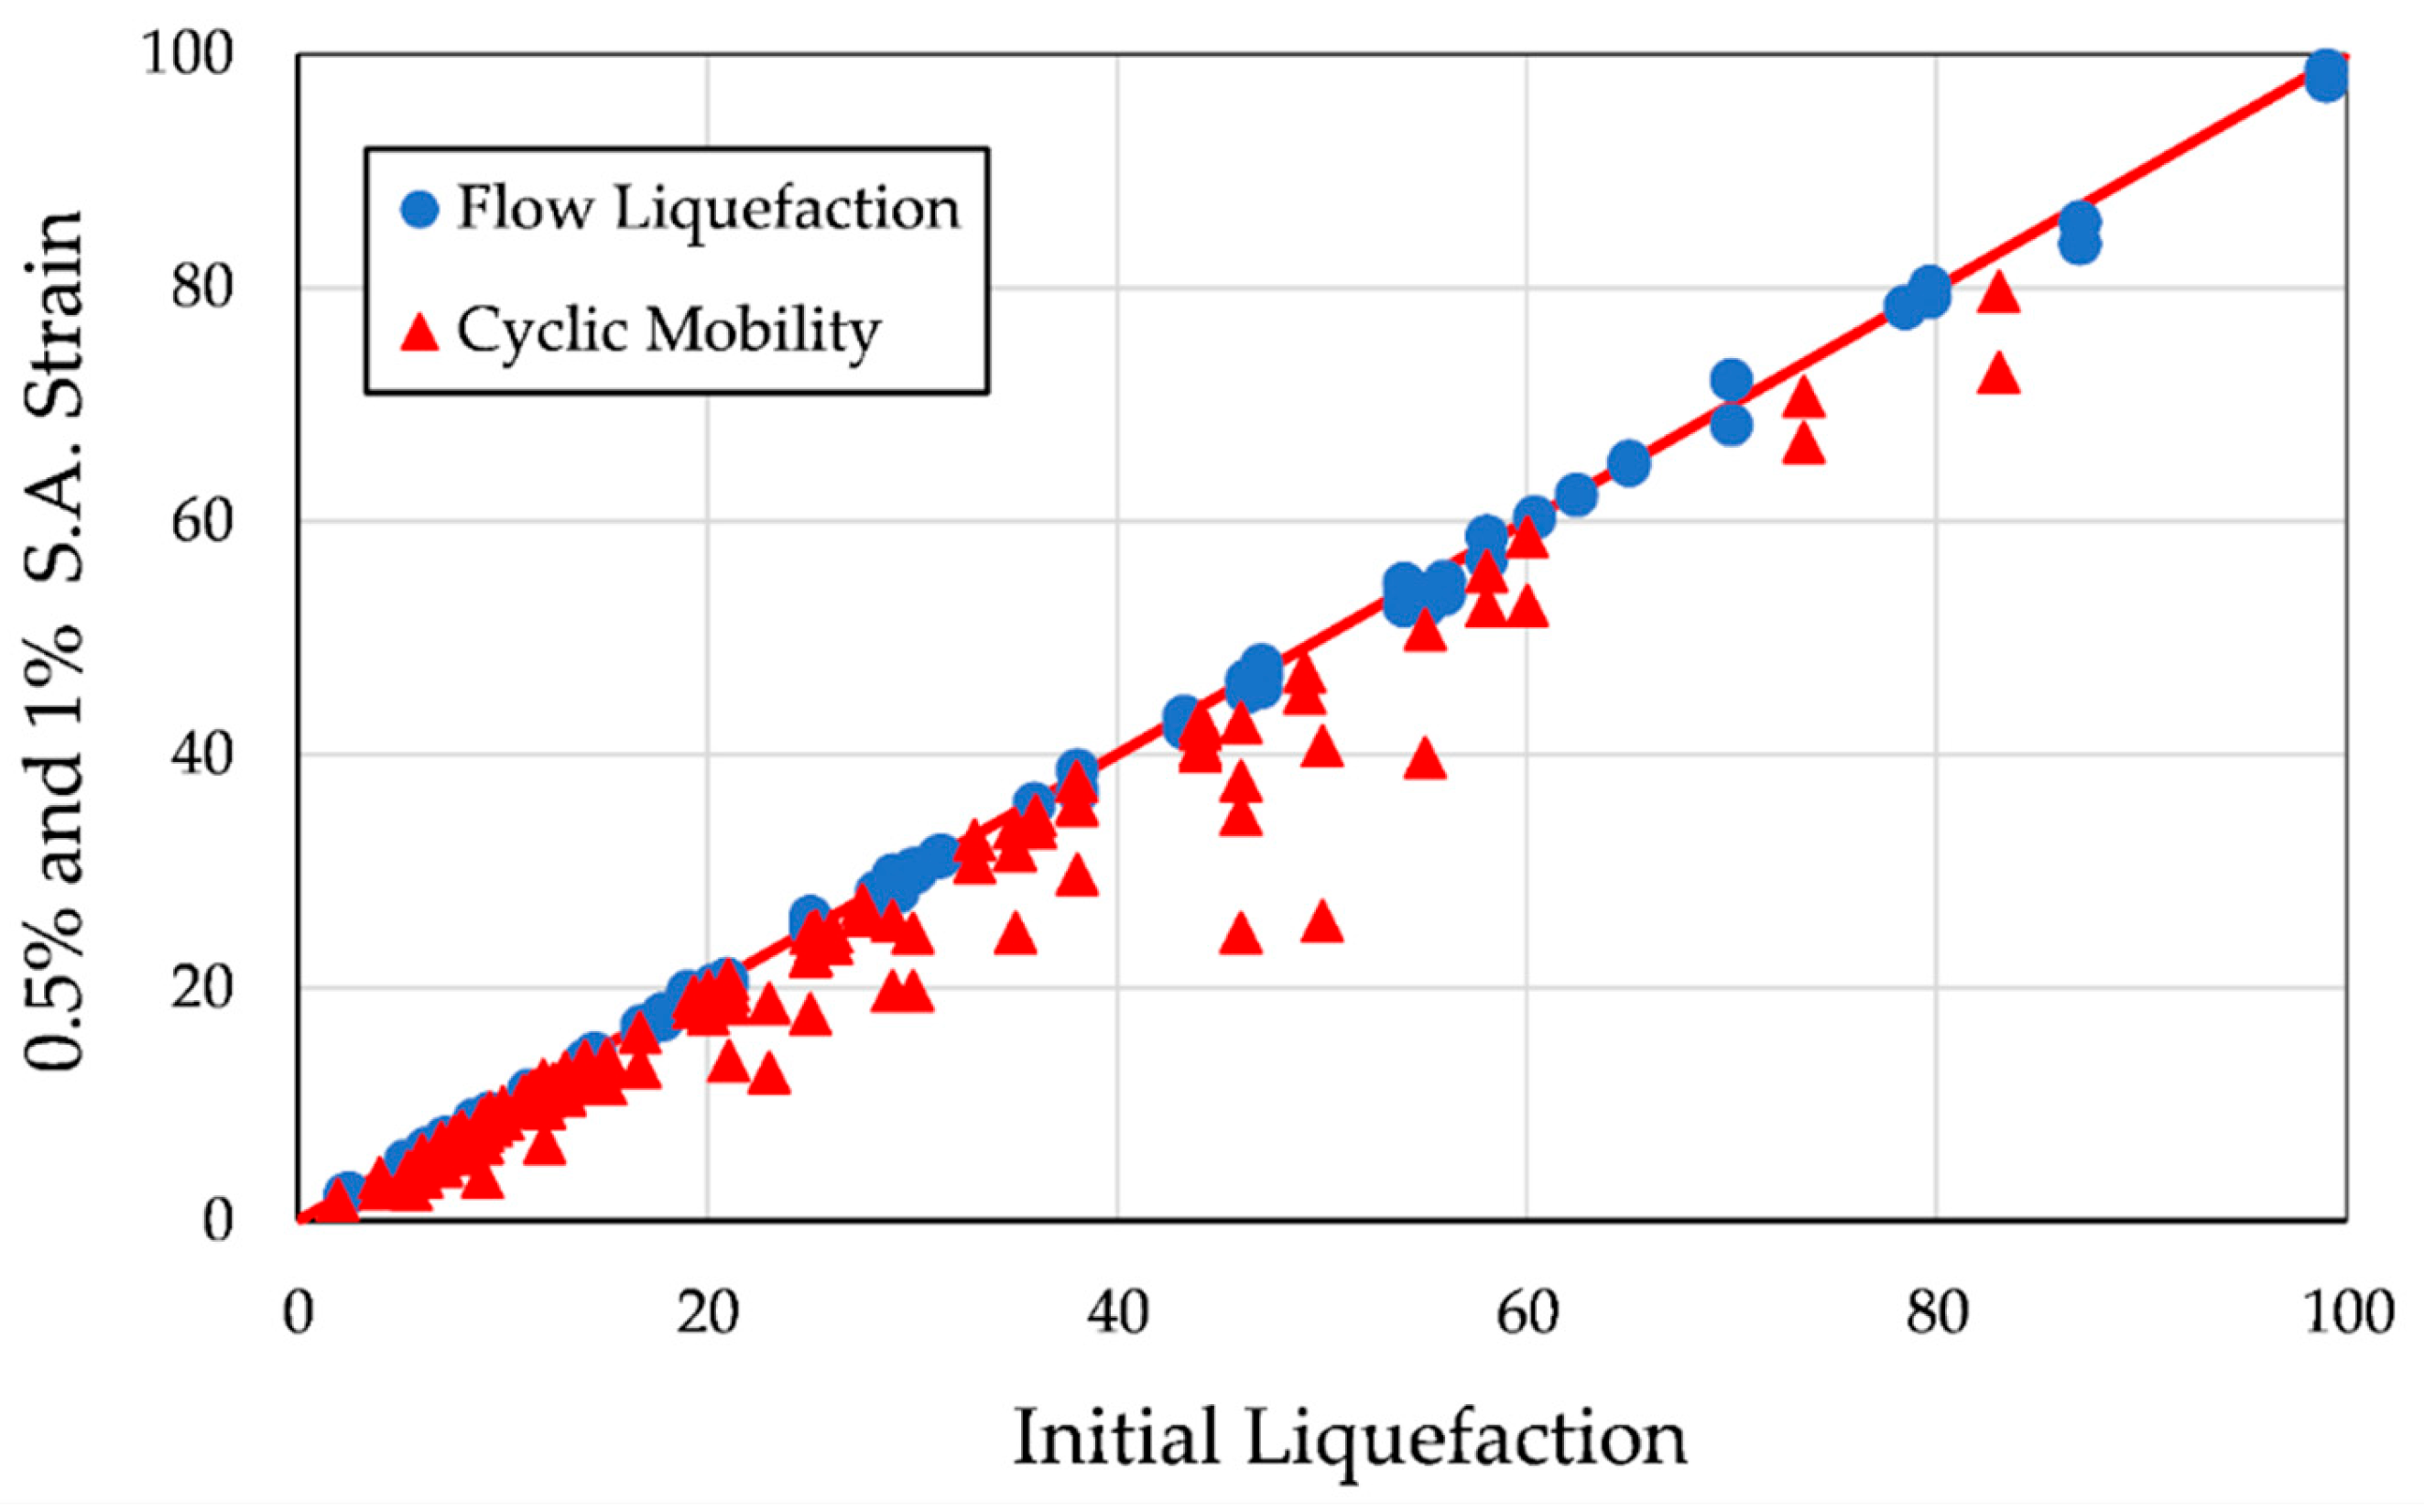
As may be seen in Figure 12, the use of 0.5% axial strain as a failure criterion produces values that plot below the red line. This means that fewer cycles are required to achieve initial liquefaction. This behavior is also to a lesser extent the case for the use of 1% axial strain as the liquefaction criterion. Figure 16 plots the data for the 0.5% and 1% single-amplitude strains separated by liquefaction mode. When compared to initial liquefaction, these strain criteria did an excellent job for soils that failed in flow liquefaction. However, for soils that failed in cyclic mobility, they did a relatively poor job. This difference occurs because in soils that undergo flow liquefaction, the advent of 0.5% strain, initial liquefaction, and the large monotonic strain that characterizes flow liquefaction all occur within a very small number of cycles of loading. An example of this behavior can be seen in Figure 3. Conversely, as may be seen in Figure 4, for soils that are susceptible to cyclic mobility, the advent of 0.5% strain, initial liquefaction, and larger levels of strain may differ by many cycles of loading.

Figure 16.
Comparison of the number of cycles of loading to initiate liquefaction for 0.5% and 1% single-amplitude axial strain to the number of cycles of loading required for initial liquefaction separated by liquefaction mode.
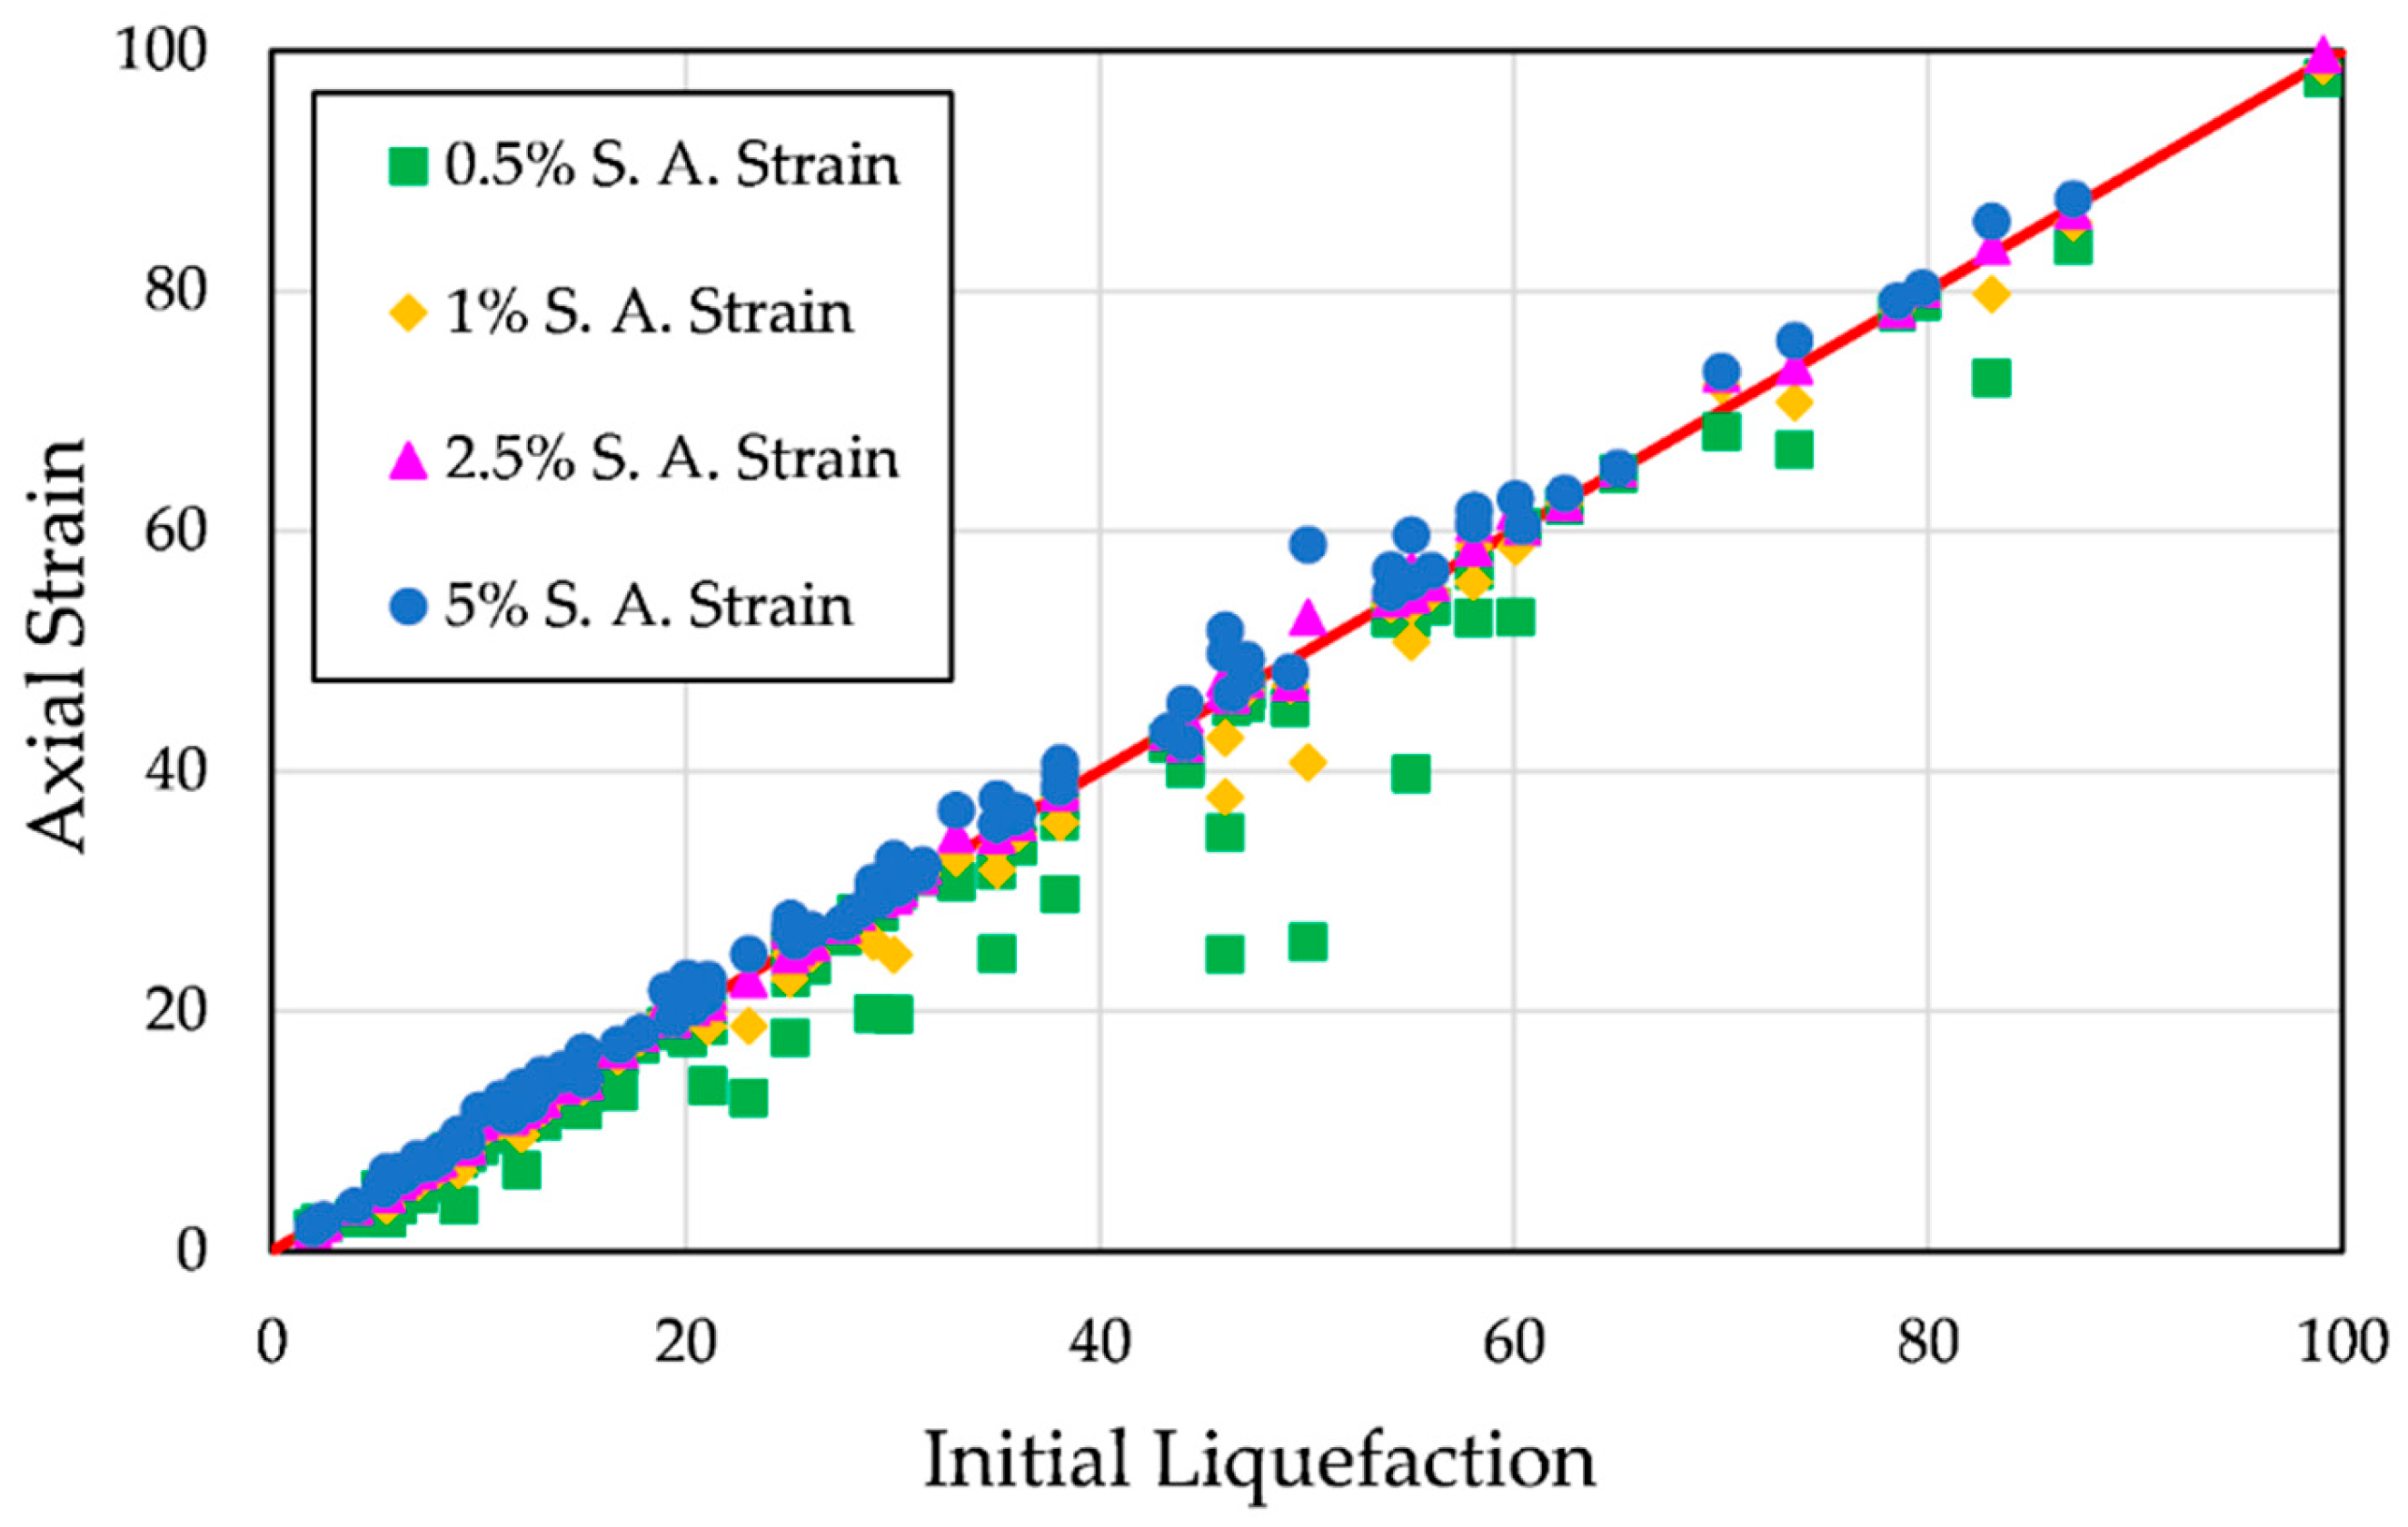
In Figure 15, it may be seen that the use of 2.5% and 5% axial strain produces values that plot on or very slightly above the red line. In Figure 17, it can be seen that for both 2.5% and 5% axial strains, the specimens subject to flow liquefaction are very accurately predicted, while some specimens subjected to cyclic mobility failure plot are slightly above the line. This pattern occurs for the reasons discussed in the previous paragraph. Overall, the failure criteria of 2.5% and 5% single-amplitude axial strain do an excellent job of matching the number of cycles to liquefaction from the initial liquefaction case.
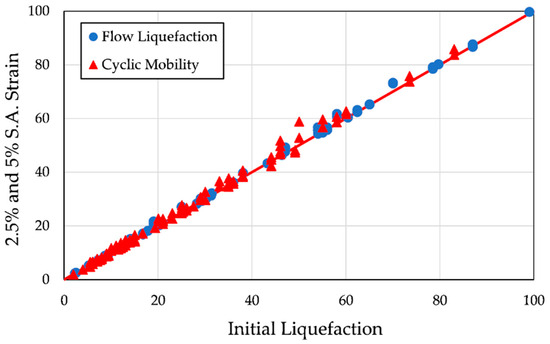
Figure 17.
Comparison of the number of cycles of loading to initiate liquefaction for 2.5% and 5% single-amplitude axial strain to the number of cycles of loading required for initial liquefaction separated by liquefaction mode.
It is recommended that neither 0.5% nor 1% single-amplitude axial strain be used as a failure criterion, as either may seriously underestimate the number of cycles to initial liquefaction, especially for soils subject to cyclic mobility. While conservative, this underprediction may have significant economic impacts on a project in terms of ground improvements. Conversely, the use of either 2.5% strain, 5% strain, or initial liquefaction as a liquefaction criterion was found to produce uniform results.
4.3. Cyclic Resistance of Soils Undergoing Flow Liquefaction
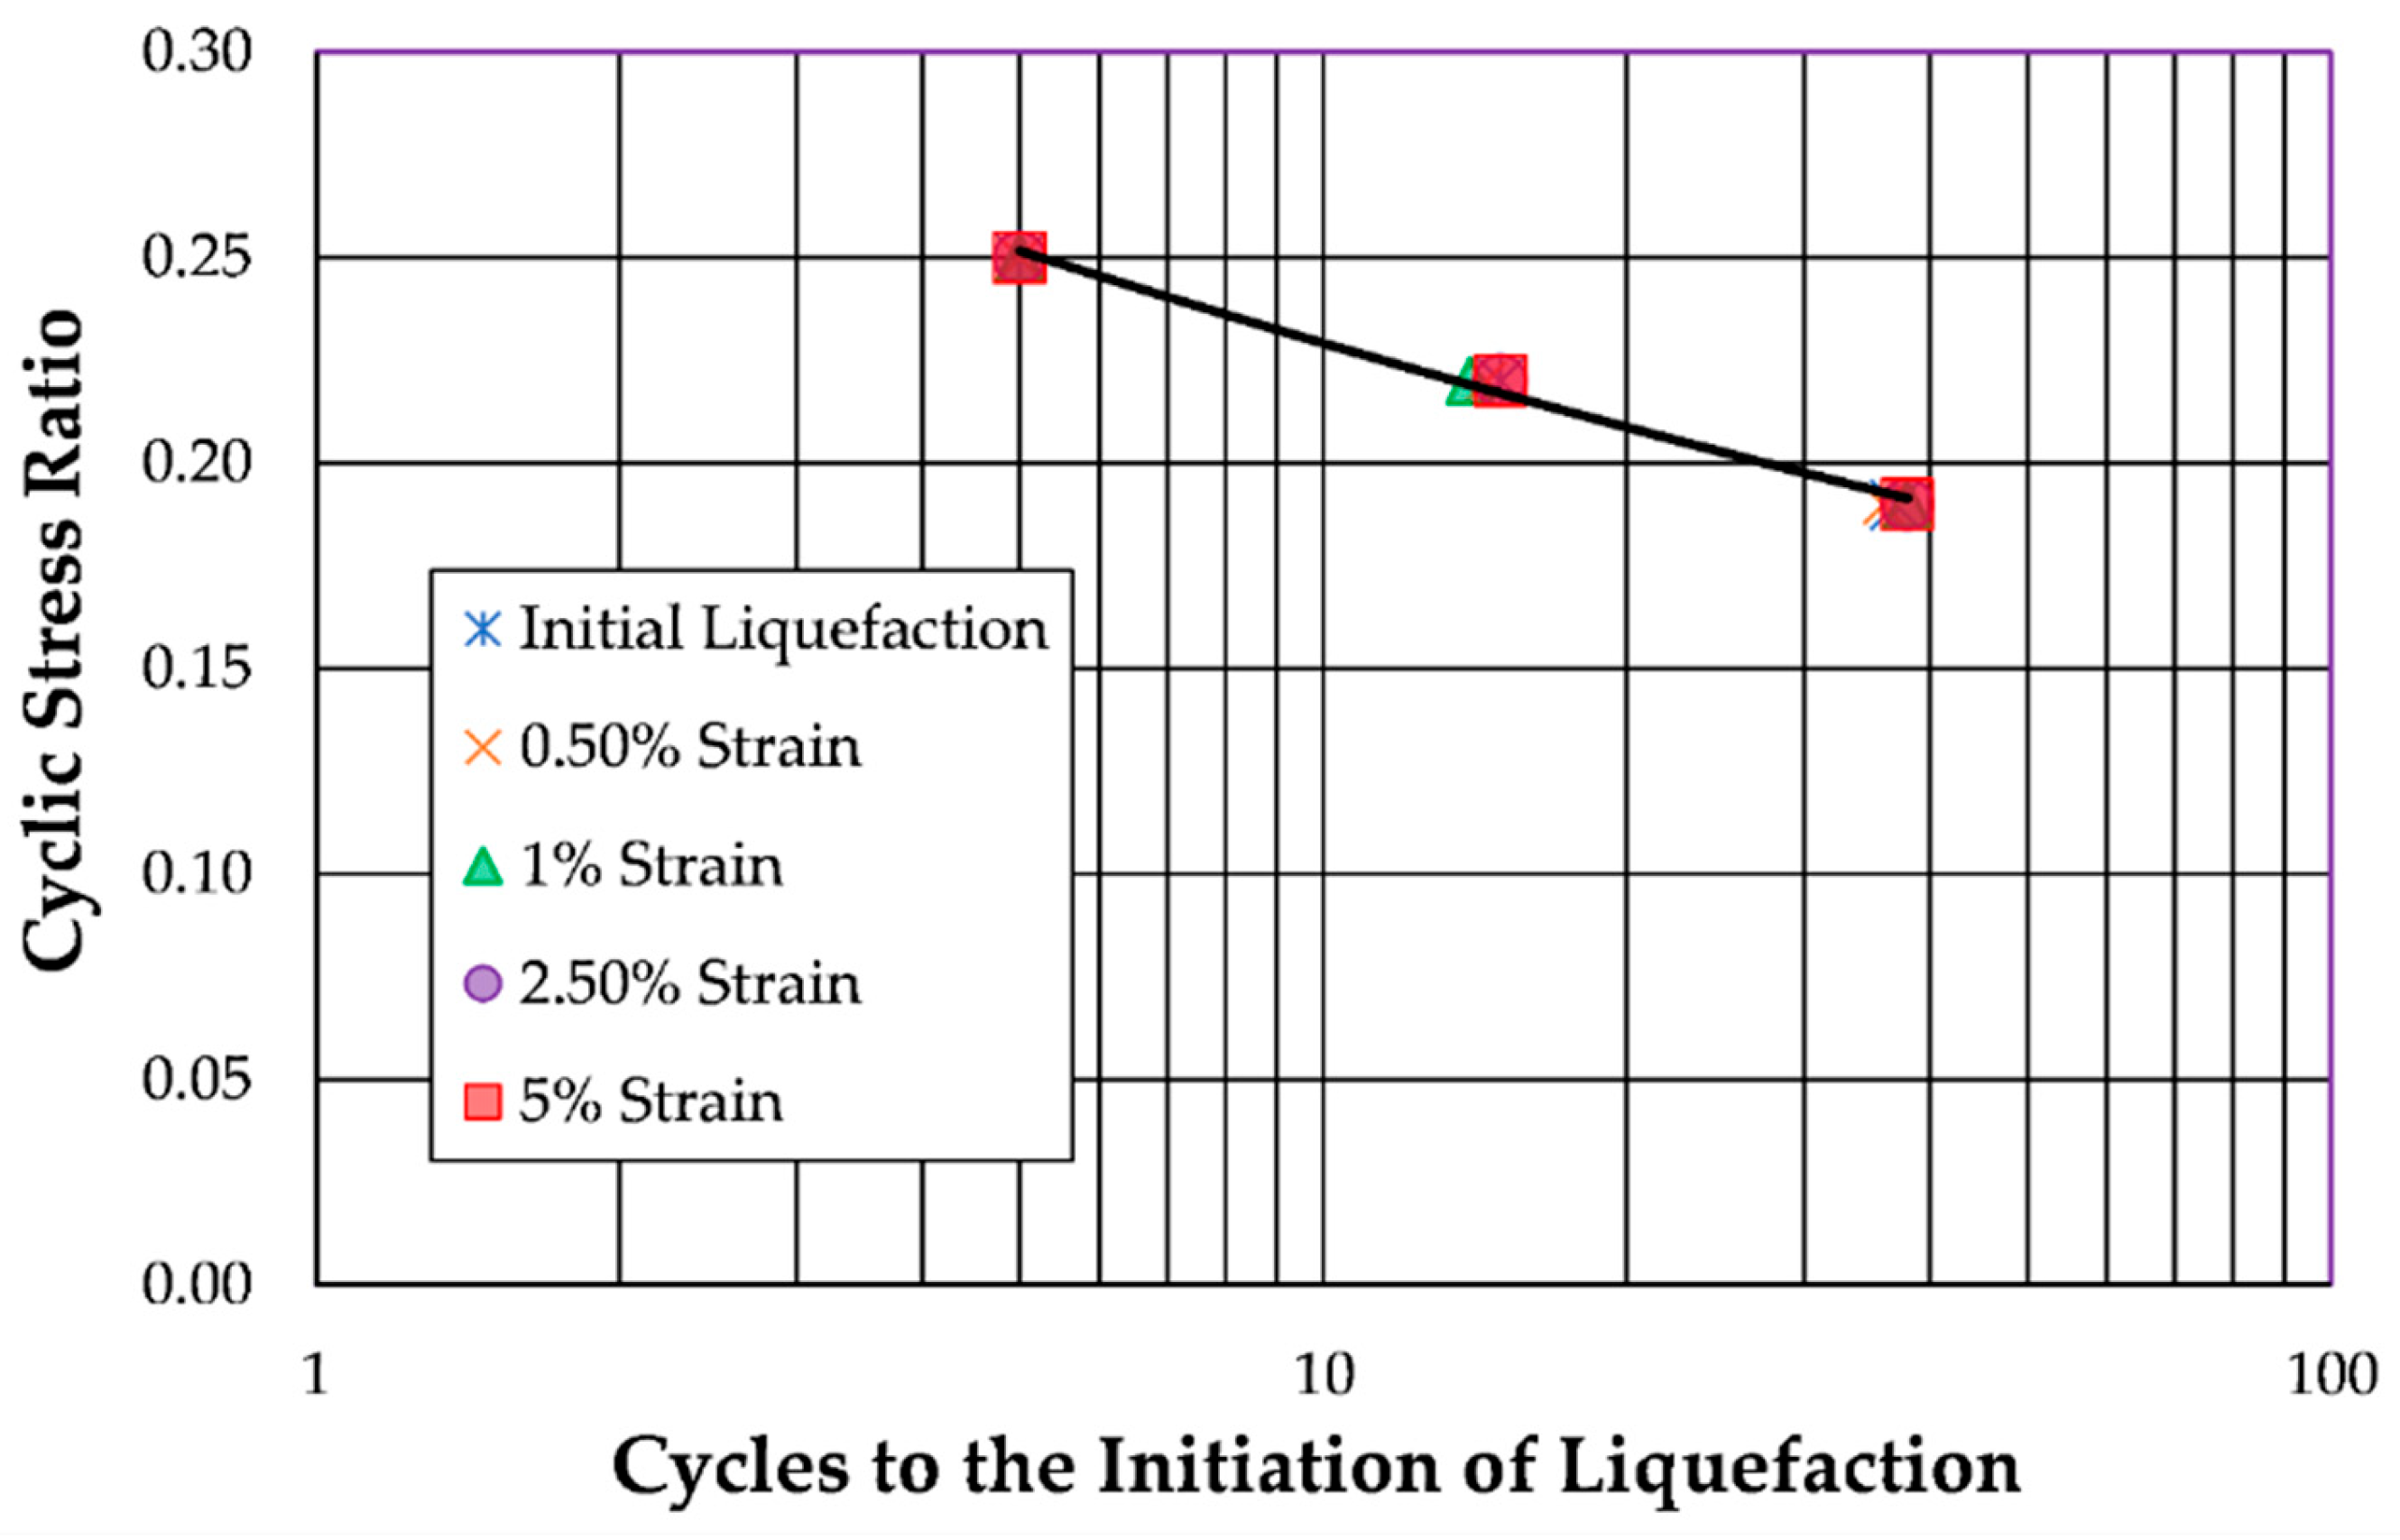
For specimens undergoing flow liquefaction, the choice of liquefaction criterion was found to have minimal impact on the number of loading cycles required to induce liquefaction. Since strains develop rapidly following initial liquefaction, all strain-based criteria occur were met approximately the same loading cycle. This behavior can be seen in Figure 18, which plots the cyclic resistance curves developed based on each of the four failure criteria. In Figure 18, all five curves are nearly identical; therefore, the selection of liquefaction criterion does not play a critical role in determining the cyclic resistance for soils undergoing flow liquefaction.
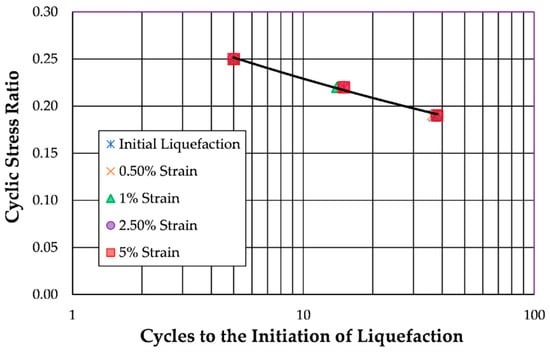
Figure 18.
Cyclic resistance curves for cyclic triaxial specimens undergoing flow liquefaction based upon the five liquefaction criteria chosen.
4.4. Cyclic Resistance of Soils Undergoing Cyclic Mobility
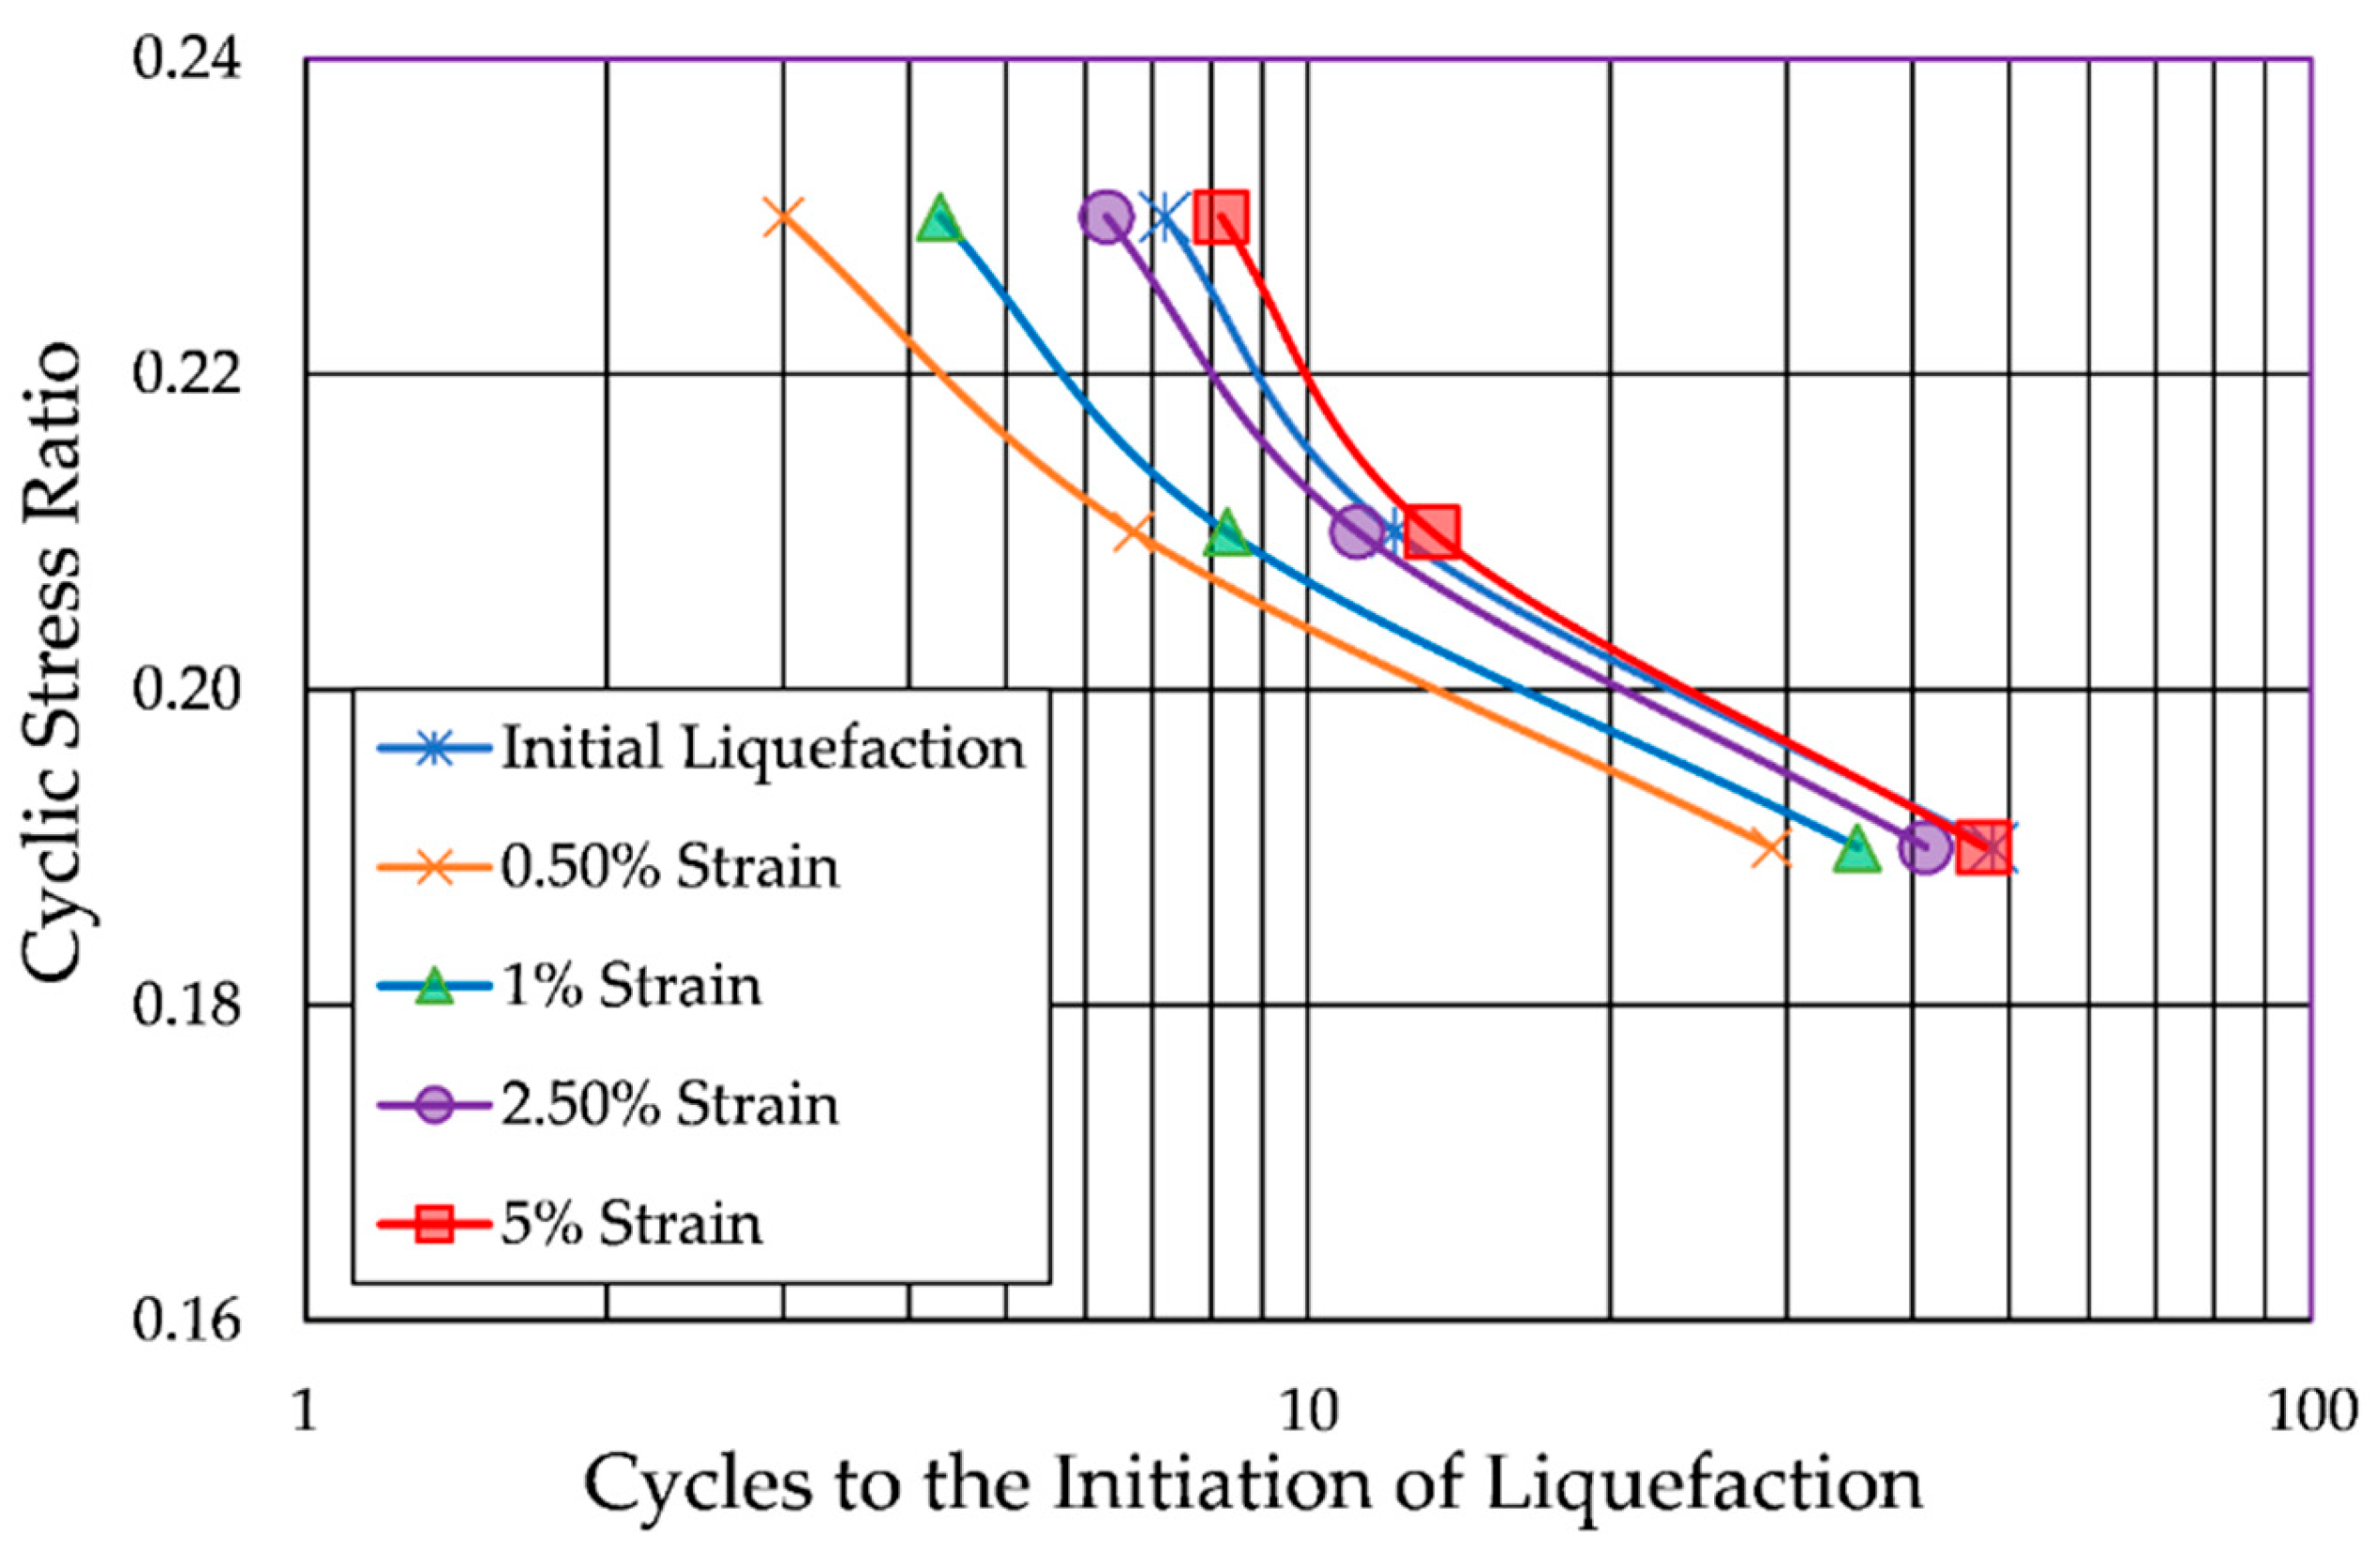
For specimens exhibiting cyclic mobility, the choice of failure criterion significantly affected the number of cycles required to induce liquefaction during cyclic loading. Strains accumulated gradually, leading to distinct cyclic resistance curves for each strain-based criterion. This behavior can be seen in Figure 19, which plots the cyclic resistance curves developed based on each of the five failure criteria. The curves plotted in Figure 19 indicate that the selected liquefaction criterion can play a critical role in determining the interpreted cyclic resistance of soils undergoing cyclic mobility.
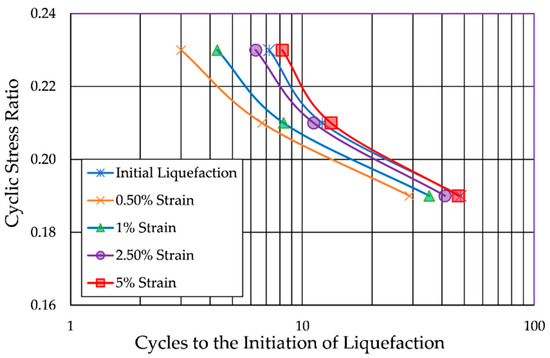
Figure 19.
Cyclic resistance curves for cyclic triaxial specimens undergoing cyclic mobility based upon the five liquefaction criteria chosen.
4.5. Dissipated Energy in Specimens Subjected to Flow Liquefaction and Cyclic Mobility
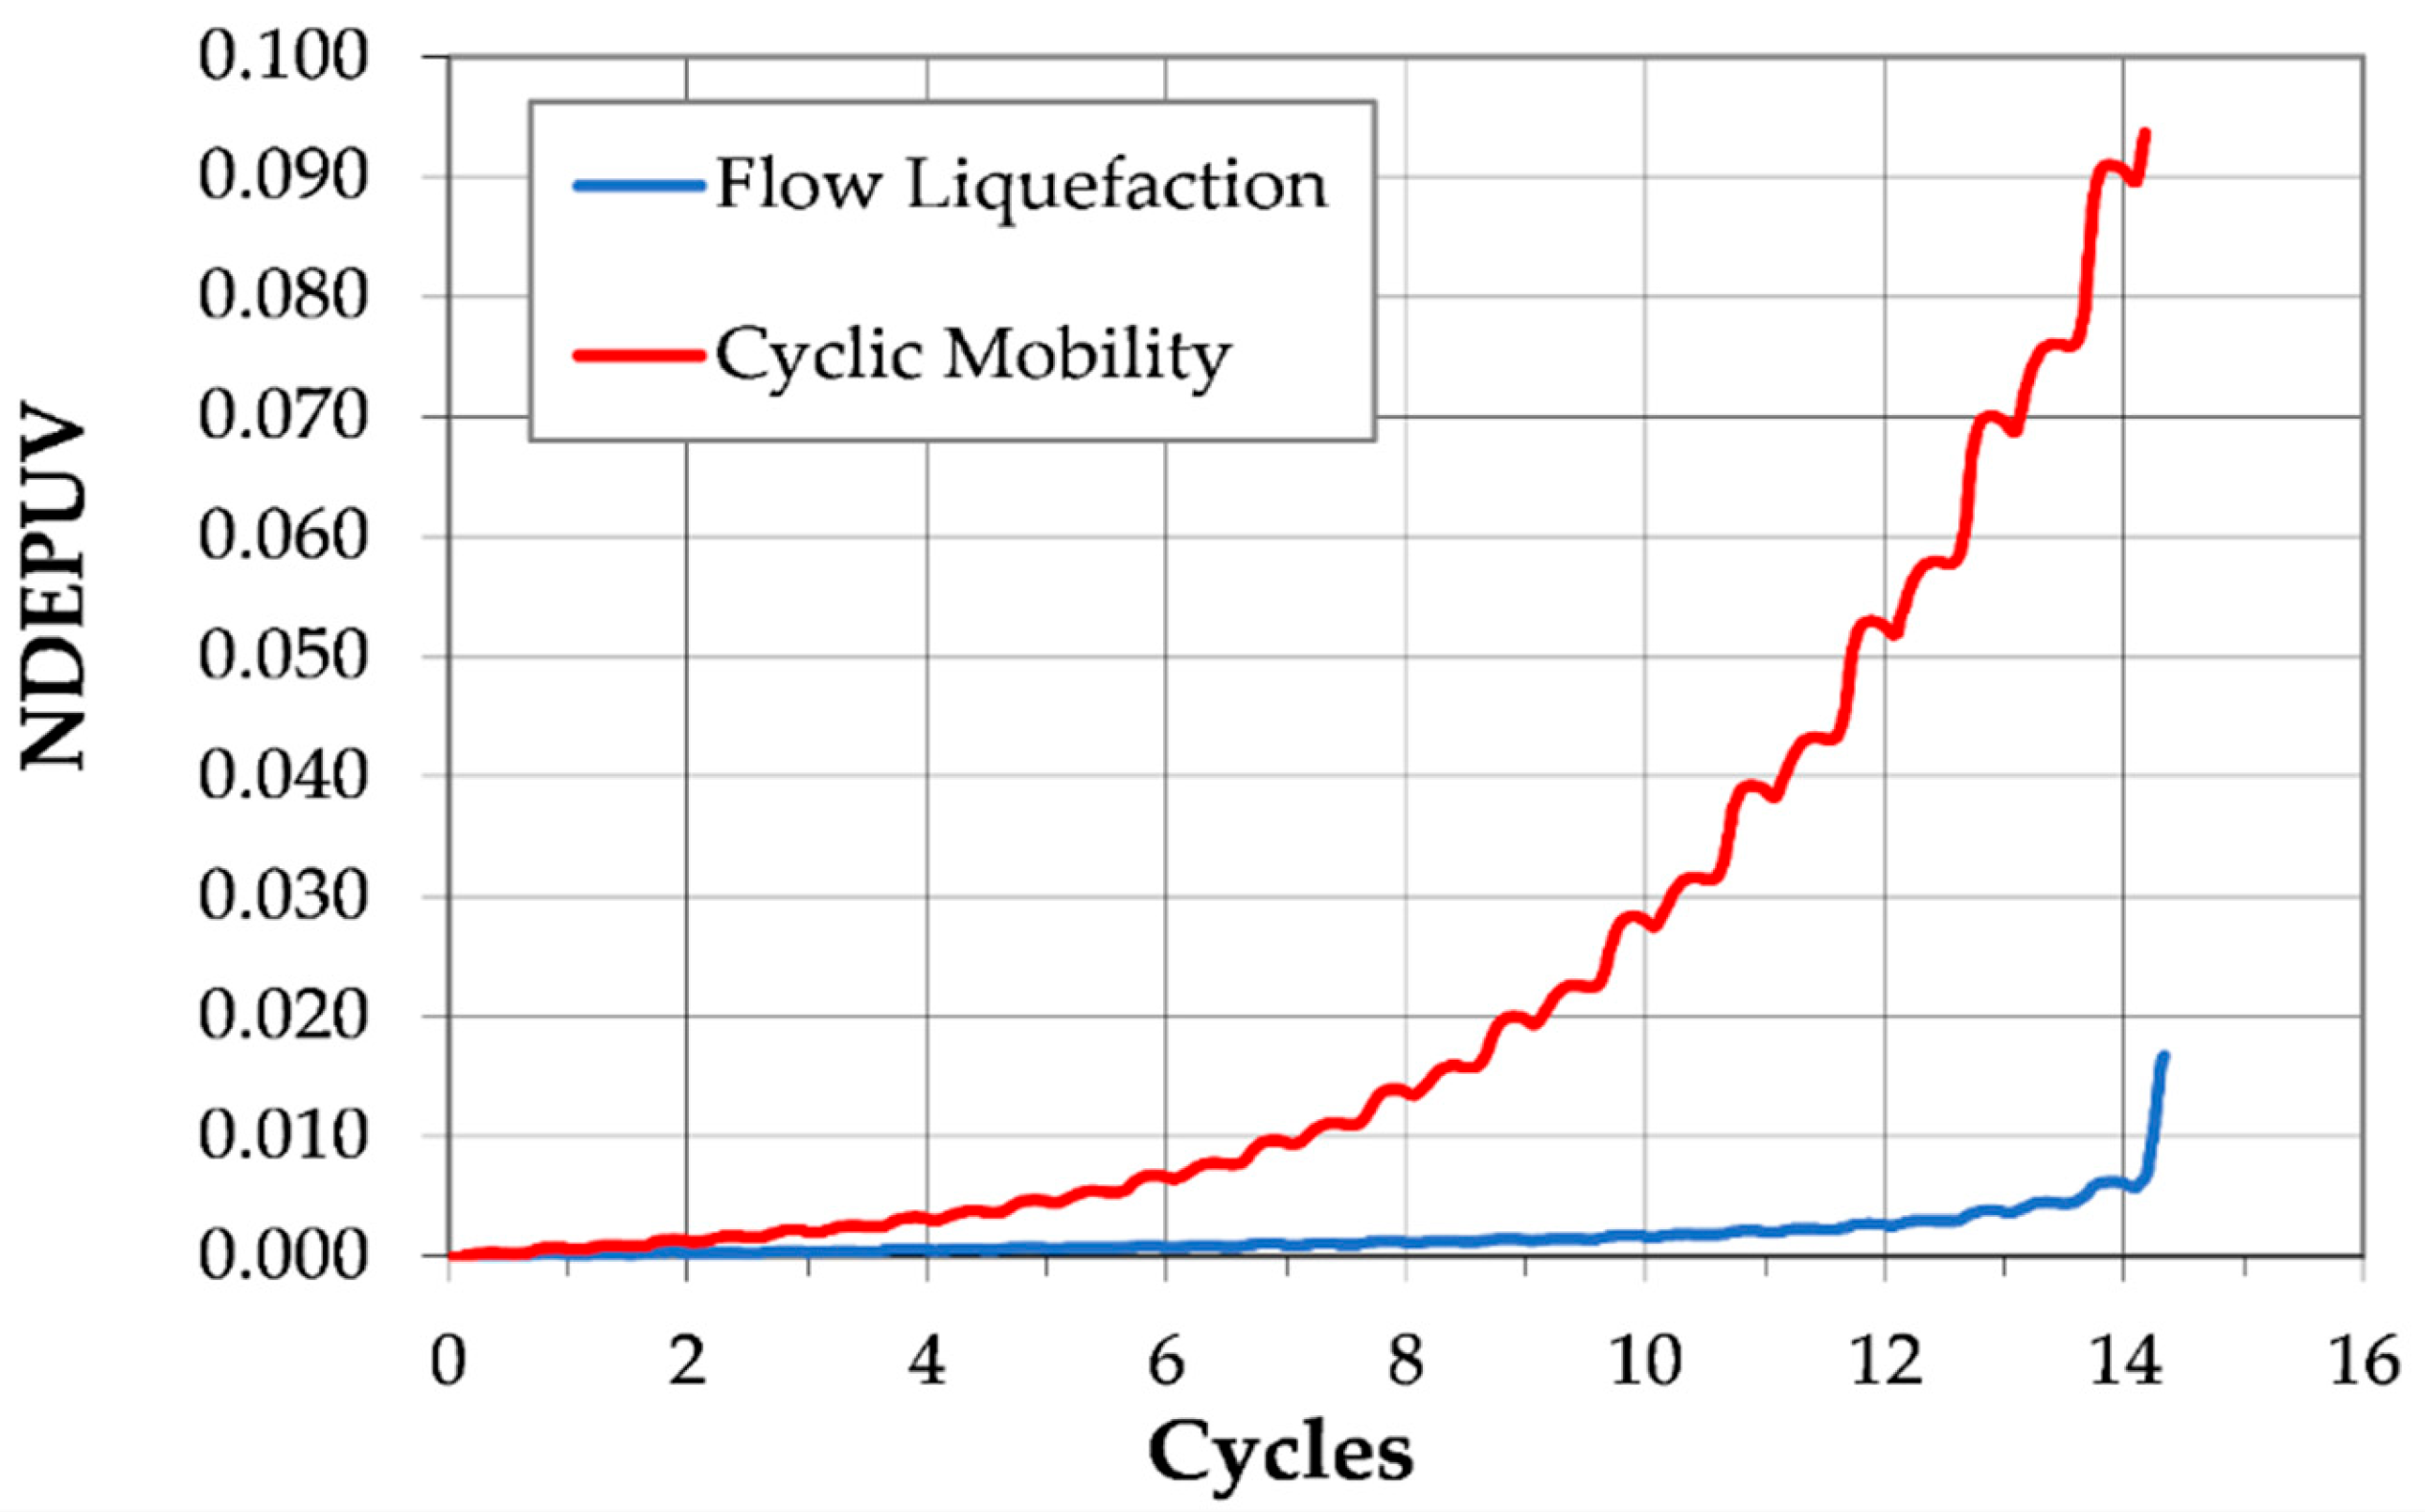
The amount of normalized dissipated energy per unit volume required to trigger liquefaction can differ greatly between specimens that undergo flow liquefaction and cyclic mobility. This is the case even if they are subjected to similar cyclic stress ratios and liquefy in a similar number of cycles of loading. Figure 20 shows a plot of NDEPUV vs. cycle of loading for the tests shown in Figure 6 and Figure 7 using a failure criterion of 5% single-amplitude axial strain. The specimen that underwent cyclic mobility failure required almost six times as much energy dissipation as the specimen that underwent flow liquefaction, despite requiring about the same number of cycles to liquefy.
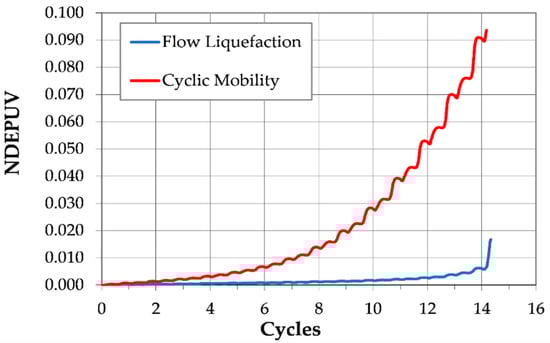
Figure 20.
Comparison of energy dissipation for soils failing in flow liquefaction and cyclic mobility.
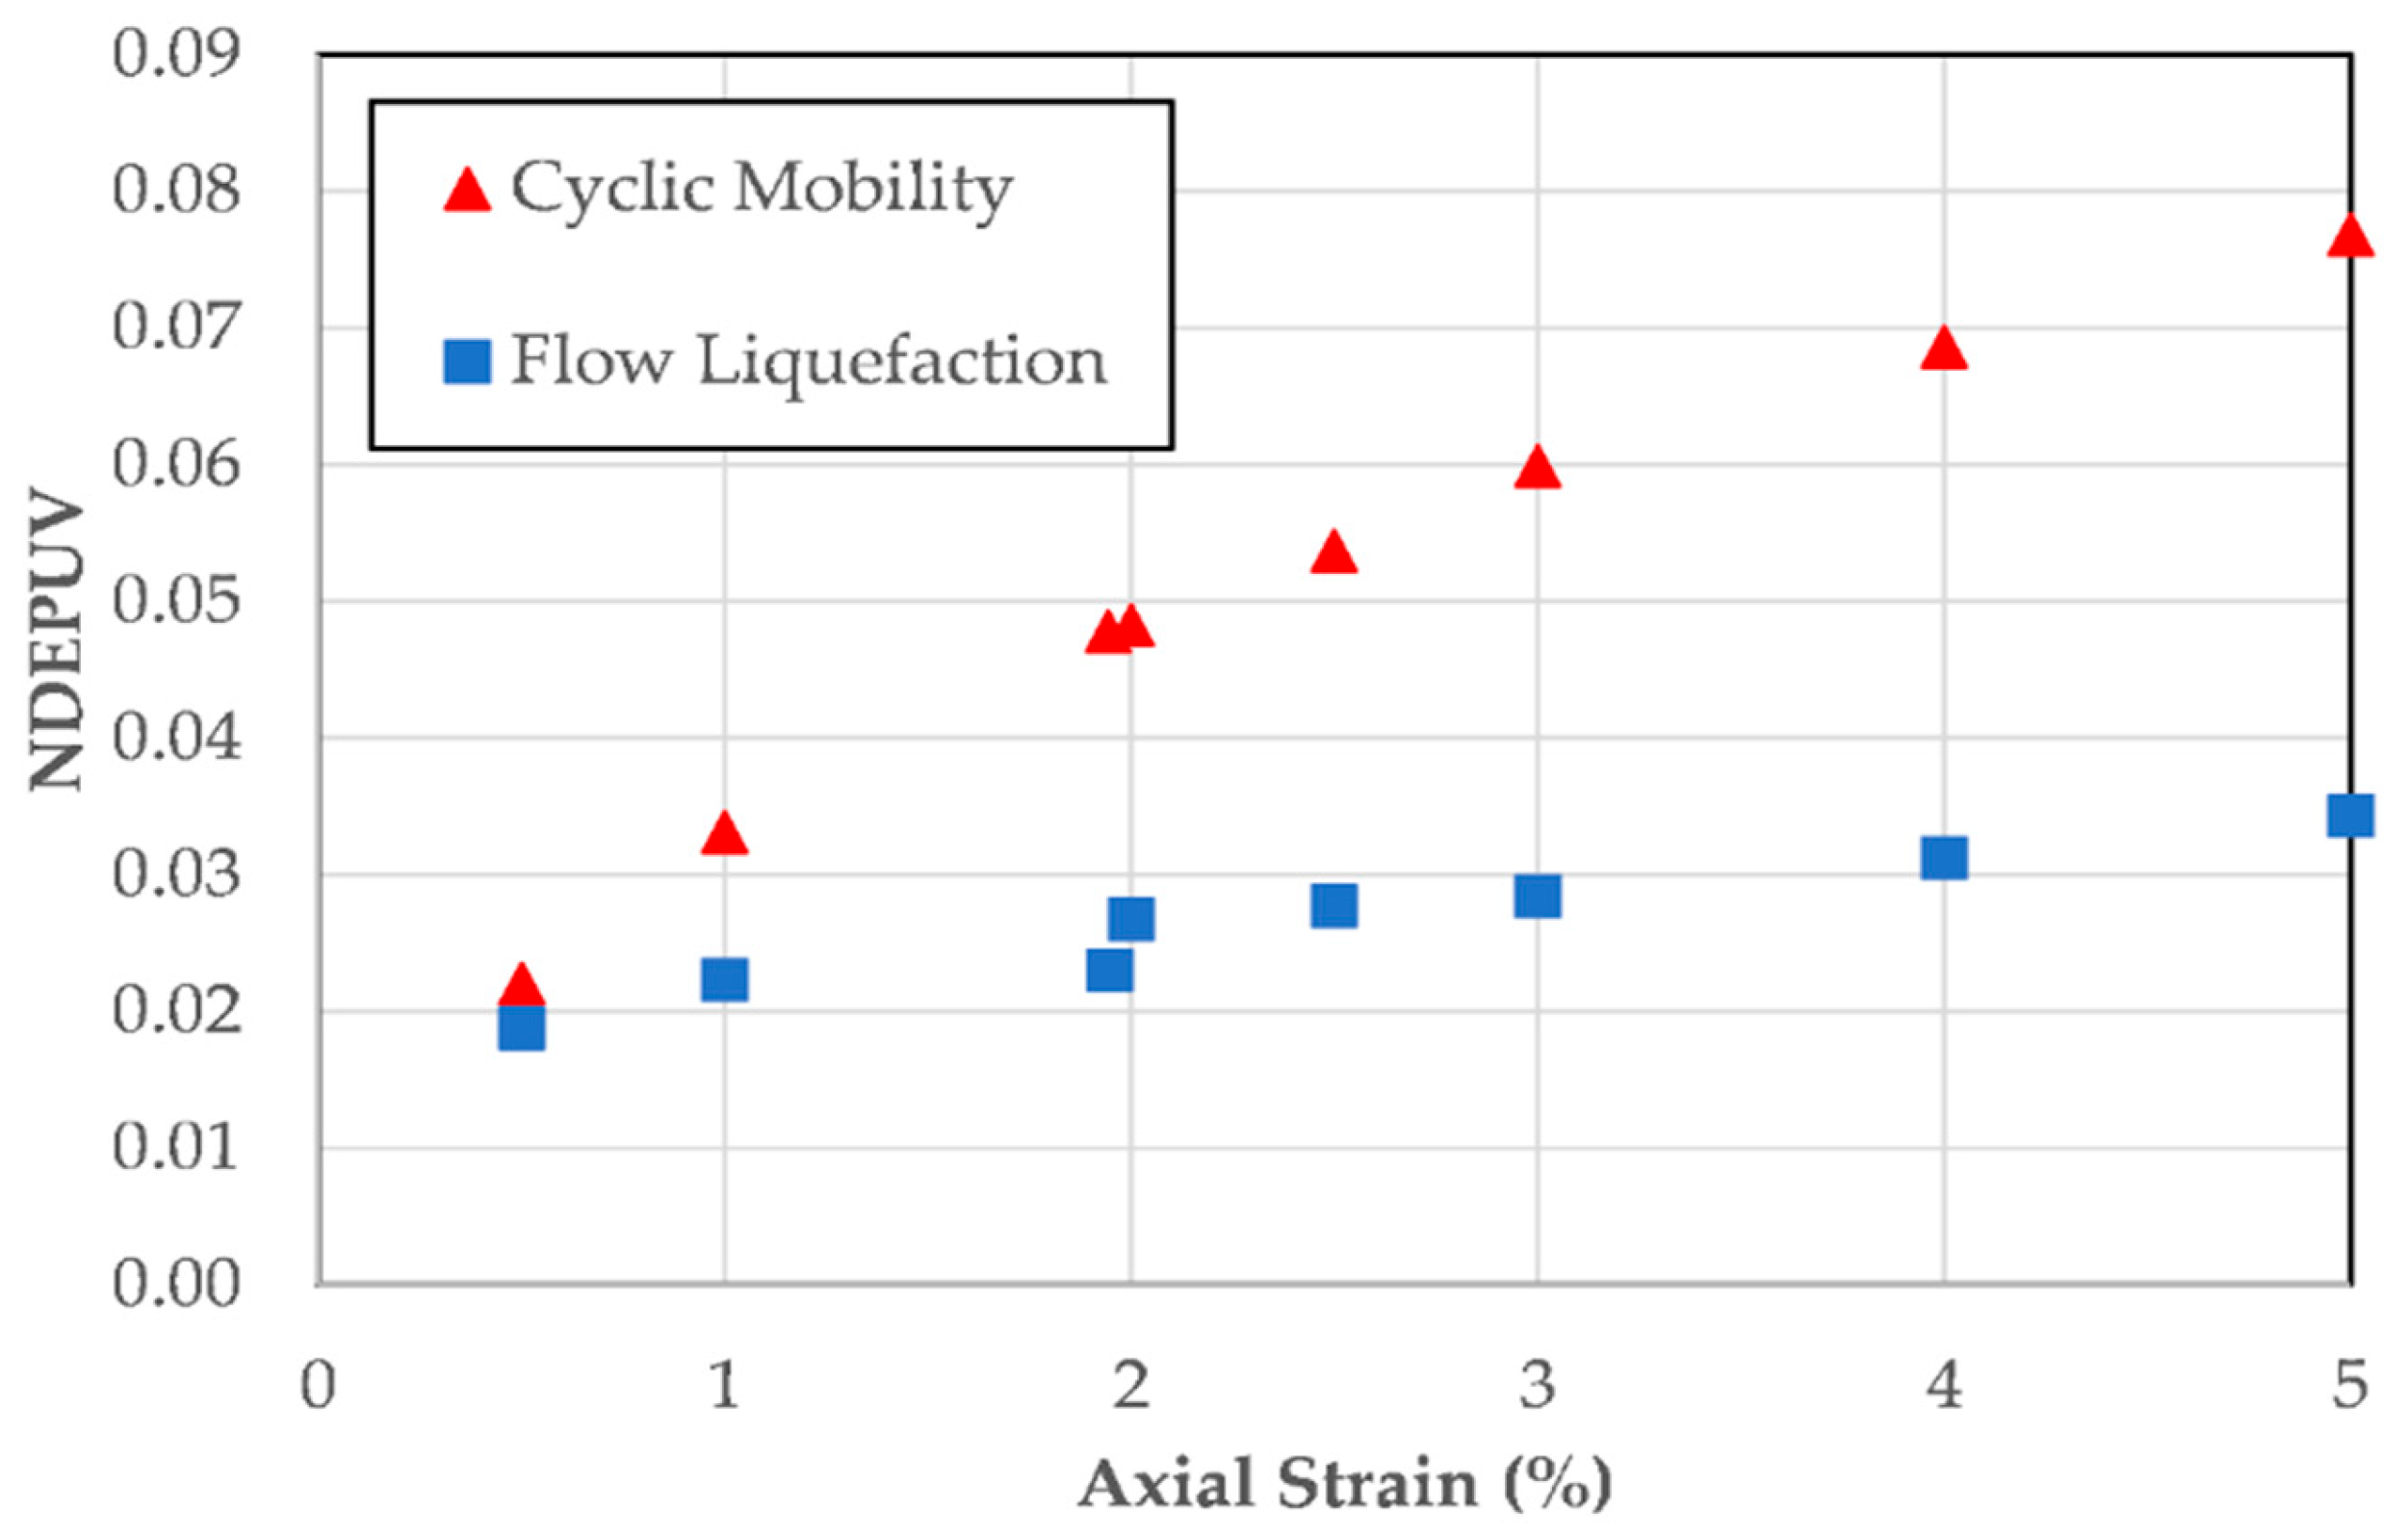
Figure 21 presents plots of the average NDEPUV required to achieve initial liquefaction and various levels of single-amplitude axial strain. The patterns seen in Figure 15 and Figure 16 can again be seen here. The specimens subjected to flow liquefaction require only about 1.5 times as much dissipated energy to achieve 5% strain as they do to reach 0.5% strain. This relatively constant NDEPUV value is due to the rapid straining that occurs just after initial liquefaction.
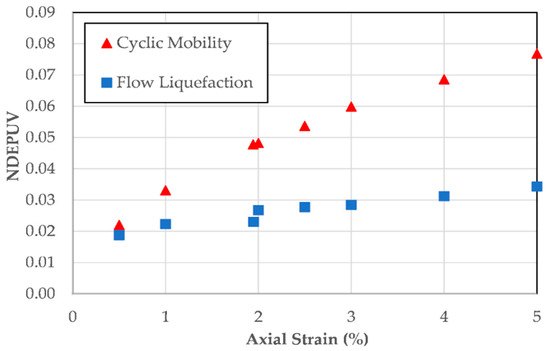
Figure 21.
The average NDEPUV required to achieve various single-amplitude axial strain levels for specimens subjected to flow liquefaction and cyclic mobility failures.
Conversely, the specimens subjected to cyclic mobility failures require about 3.5 times as much dissipated energy to achieve 5% strain as they do to reach 0.5% strain. This is due to the accumulation of positive and negative strains and corresponding increases in energy dissipation that occur during the loading.
5. Conclusions
Based on the results of 256 stress-controlled cyclic triaxial tests on sand–silt mixtures, the following conclusions were drawn.
- The most critical factor influencing the interpretation of cyclic triaxial test results is whether the soil undergoes flow liquefaction or cyclic mobility. The difference between the two behaviors is critical, because flow liquefaction results in sudden, large, permanent displacements of the soil mass. Conversely, cyclic mobility typically results in little, if any, permanent deformation of the soil mass.
- Relative density is the primary determinant of whether a soil experiences flow liquefaction or cyclic mobility. Soils with relative densities below 50% consistently underwent flow liquefaction, whereas 82% of soils with relative densities above 50% exhibited cyclic mobility. The influence of non-plastic fines content on failure mode susceptibility was found to be minimal.
- For soils susceptible to flow liquefaction, the choice of liquefaction criterion is relatively insignificant, because the rapid strain development causes all criteria to yield similar cycle counts for liquefaction initiation.
- For soils susceptible to cyclic mobility, the choice of liquefaction criterion is crucial, as the gradual accumulation of strain leads to significant variations in the number of cycles required for liquefaction initiation.
- Soils that undergo flow liquefaction require much less energy dissipation to trigger liquefaction, with the majority of their energy loss coming during the final, large, permanent displacement that accompanies initial liquefaction.
- Soils that undergo cyclic mobility require more energy to achieve a state of zero effective stress than specimens that undergo flow liquefaction. This is because these specimens undergo large biaxial straining without ever achieving the large, permanent, monotonic displacement that accompanies flow liquefaction.
- When choosing a liquefaction criterion for a cyclic triaxial test, it is recommended that either initial liquefaction or a minimum of 2.5% single-amplitude axial strain be chosen. These criteria will ensure a more accurate prediction of pore pressure generation if the test results are used to determine the input parameters for pore pressure generation models.
These findings underscore the importance of selecting an appropriate liquefaction criterion when interpreting cyclic triaxial test results, particularly for soils prone to cyclic mobility failures.
Funding
This research received no external funding.
Data Availability Statement
All data and materials are available on request from the corresponding author. The data are not publicly available due to ongoing research using part of the data.
Acknowledgments
The author would like to thank Valparaiso University for the support provided via the Alfred W. Sieving Endowed Chair of Engineering.
Conflicts of Interest
The author declares no conflicts of interest.
References
- Seed, H.B.; Lee, K.L. Liquefaction of Saturated Sands During Cyclic Loading. J. Soil Mech. Found. Div. 1966, 92, 105–134. [Google Scholar] [CrossRef]
- Lee, K.L.; Seed, H.B. Cyclic Stress Conditions Causing Liquefaction of Sand. J. Soil Mech. Found. Div. 1967, 93, 47–70. [Google Scholar] [CrossRef]
- Castro, G. Liquefaction of Sands. Ph.D. Thesis, Harvard University, Cambridge, MA, USA, 1969. [Google Scholar]
- Salvatore, N.; Pizzi, A.; Rollins, K.M.; Pagliaroli, A.; Amoroso, S. Liquefaction assessment of gravelly soils: The role of in situ and laboratory geotechnical tests through the case study of the Sulmona basin (Central Italy). Ital. J. Geosci. 2022, 141, 216–229. [Google Scholar] [CrossRef]
- Kumar, D.R.; Samui, P.; Burman, A. Suitability assessment of the best liquefaction analysis procedure based on SPT data. Multiscale Multidiscip. Model. Exp. Des. 2023, 6, 319–329. [Google Scholar] [CrossRef]
- Ntritsos, N.; Cubrinovski, M. A CPT-based effective stress analysis procedure for liquefaction assessment. Soil Dyn. Earthq. Eng. 2020, 131, 106063. [Google Scholar] [CrossRef]
- ASTM D5311/D5311M-13; Standard Test Method for Load Controlled Cyclic Triaxial Strength of Soil. ASTM International: West Conshohocken, PA, USA, 2013. Available online: www.astm.org (accessed on 11 March 2025).
- Polito, C. The Effects of Non-Plastic and Plastic Fines on the Liquefaction of Sandy Soils. Ph.D. Thesis, Virginia Polytechnic Institute and State University, Blacksburg, VA, USA, 10 December 1999. [Google Scholar]
- Askari, F.; Dabiri, R.; Shafiee, A.; Jafari, M. Liquefaction resistance of sand-silt mixtures using laboratory-based shear wave velocity. Int. J. Civ. Eng. 2011, 9, 135–144. [Google Scholar]
- Khashila, M.; Hussien, C.M.; Karray, M. On the Dynamic Soil Behavior under Triaxial and Simple Shear Modes. Int. J. Geomech. 2021, 21, 8. [Google Scholar] [CrossRef]
- Gobbi, S.; Reiffsteck, P.; Lenti, L.; d’Avila, M.P.S.; Semblat, J.F. Liquefaction triggering in silty sands: Effects of non-plastic fines and mixture-packing conditions. Acta Geotech. 2022, 17, 391–410. [Google Scholar] [CrossRef]
- Janalizadeh Choobbasti, A.; Selatahneh, H.; Karimi Petanlar, M. Effect of fines on liquefaction resistance of sand. Innov. Infrastruct. Solut. 2020, 5, 87. [Google Scholar] [CrossRef]
- Enomoto, T. Liquefaction and post-liquefaction properties of sand-silt mixtures and undisturbed silty sands. Soils Found. 2019, 59, 2311–2323. [Google Scholar] [CrossRef]
- El Ghoraiby, M.; Park, H.; Manzari, M. Stress-strain behavior and liquefaction strength characteristics of Ottawa F65 sand. Soil Dyn. Earthq. Eng. 2020, 138, 106292. [Google Scholar] [CrossRef]
- Nong, Z.-Z.; Park, S.-S.; Lee, D.-E. Comparison of sand liquefaction in cyclic triaxial and simple shear tests. Soils Found. 2021, 61, 1071–1085. [Google Scholar] [CrossRef]
- Ni, X.-Q.; Zhang, Z.; Ye, B.; Zhang, S. Unique relation between pore water pressure generated at the first loading cycle and liquefaction resistance. Eng. Geol. 2022, 296, 106476. [Google Scholar] [CrossRef]
- Sze, H.; Yang, J. Failure Modes of Sand in Undrained Cyclic Loading: Impact of Sample Preparation. J. Geotech. Geoenviron. Eng. 2014, 140, 152–169. [Google Scholar] [CrossRef]
- Green, R.A.; Mitchell, J.K.; Polito, C.P. An energy-based pore pressure generation model for cohesionless soils. In Proceedings of the John Booker Memorial Symposium—Developments in Theoretical Geomechanics, Sydney, NSW, Australia, 16–17 November 2000; Balkema: Rotterdam, The Netherlands, 2000; pp. 383–390. [Google Scholar]
- Nemat-Nasser, S.; Shokooh, A. A Unified Approach to Densification and Liquefaction of Cohesionless Sand in Cyclic Shearing. Can. Geotech. J. 1979, 16, 659–678. [Google Scholar] [CrossRef]
- Berrill, J.B.; Davis, R.O. Energy Dissipation and Seismic Liquefaction of Sands: Revised Model. Soils Found. 1985, 25, 106–118. [Google Scholar] [CrossRef] [PubMed]
- Figueroa, J.; Saada, A.; Liang, L.; Dahisaria, N. Evaluation of Soil Liquefaction by Energy Principles. J. Geotech. Eng. 1994, 120, 1554–1569. [Google Scholar] [CrossRef]
- Baziar, M.H.; Shahnazari, H.; Sharafi, H. A laboratory study on the pore pressure generation model for Firouzkooh silty sands using hollow torsional test. Int. J. Civ. Eng. 2011, 9, 126–134. [Google Scholar]
- Jafarian, Y.; Towhata, I.; Baziar, M.H.; Noorzad, A.; Bahmanpour, A. Strain energy-based evaluation of liquefaction and residual pore water pressure in sands using cyclic torsional shear experiments. Dyn. Earthq. Eng. 2012, 35, 13–28. [Google Scholar] [CrossRef]
- Kokusho, T. Liquefaction Potential Evaluation: Energy-Based Method Compared to Stress-Based Method. In Proceedings of the Seventh International Conference on Case Histories in Geotechnical Engineering, Chicago, IL, USA, 29 April–4 May 2013. [Google Scholar]
- Green, R.A. Energy-Based Evaluation and Remediation of Liquefiable Soils. Ph.D. Thesis, Department of Civil Engineering, Virginia Polytechnic Institute and State University, Blacksburg, VA, USA, 2001. [Google Scholar]
- Silver, M.L. Laboratory Triaxial Testing Procedures To Determine The Cyclic Strength of Soils. NUREG-0031; National Technical Information Service: Springfield, VA, USA, 1977. [Google Scholar]
- Ladd, R.S. Preparing Test Specimens Using Undercompaction. Geotech. Test. J. 1978, 1, 16–23. [Google Scholar] [CrossRef]
- Seed, H.B.; Idriss, I.M. Ground Motions and Soil Liquefaction During Earthquakes; Earthquake Engineering Research Institute: Berkeley, CA, USA, 1982; p. 134. Available online: http://catalog.hathitrust.org/api/volumes/oclc/9388022.html (accessed on 20 March 2025).


Disclaimer/Publisher’s Note: The statements, opinions and data contained in all publications are solely those of the individual author(s) and contributor(s) and not of MDPI and/or the editor(s). MDPI and/or the editor(s) disclaim responsibility for any injury to people or property resulting from any ideas, methods, instructions or products referred to in the content. |
© 2025 by the author. Licensee MDPI, Basel, Switzerland. This article is an open access article distributed under the terms and conditions of the Creative Commons Attribution (CC BY) license (https://creativecommons.org/licenses/by/4.0/).