1. Introduction
In many domains, the adoption of algorithmic decision-making (ADM) has helped complete tasks more accurately, safely, and profitably [
1,
2,
3,
4,
5]. In contrast to the recent successes, algorithm aversion is a major barrier to the adoption of ADM systems [
6,
7]. If effective means can be found to overcome algorithm aversion and enable the implementation of powerful algorithms, quality of life and prosperity can be enhanced [
8,
9,
10]. Allowing decision-makers to influence an algorithm and its prediction process has been shown to influence algorithm aversion [
9]. However, it is still largely unclear which ways of influencing an algorithm are appropriate and in which step of the process decision-makers should be involved to effectively reduce their aversion. This study aims to fill this research gap by investigating different ways of influencing an algorithm and their effects on algorithm aversion in the context of an economic experiment. We draw on the research design of Dietvorst, Simmons, and Massey (2018), but also extend their work by introducing a novel method for influencing an algorithm and testing its effectiveness.
Businesses throughout the world are driving the digital transformation. Progress in the field of ADM has wide-ranging effects on our everyday lives and is bringing about fundamental changes in all fields of human life [
11,
12,
13]. ADM systems make a considerable contribution towards tasks being completed faster and above all more cheaply [
14]. In addition, algorithms can better the performance of humans (from lay persons to experts) in a multitude of areas and make more accurate predictions, including the following examples: forecasts on the performance of employees [
15], the likelihood of ex-prisoners re-offending [
16], or in making medical diagnoses [
3,
17,
18,
19,
20].
Nevertheless, in certain fields, there is a lack of acceptance for the actual use of algorithms because subjects have reservations about them. This phenomenon, which is known as algorithm aversion, refers to the lack of trust in ADM systems which arises in subjects as soon as they recognize that the algorithms sometimes make inaccurate predictions [
7,
21,
22]. We therefore focus on the issue of how algorithm aversion can be reduced and how the level of acceptance of algorithms can be increased.
In recent years, scholars have explored many ideas for reducing algorithm aversion. Some have proven effective, but others have not. For example, decision-making on behalf of others [
23] has been shown to have no significant effect on algorithm aversion. Moreover, naming an algorithm has actually been shown to decrease willingness to use it [
24].
On the other hand, considering predictions of experts using an algorithm as an input variable for the algorithm has been shown to increase willingness to use it [
25]. Moreover, it has been observed that a more precise representation of the algorithmic output [
26] and additional information about the process of an algorithm [
27] decrease algorithm aversion. In particular, the latter implies that subjects like to exert some kind of influence on an algorithm. However, many of these tested means of reducing aversion are costly and difficult to implement in real-world scenarios, which is why it remains an important task to continue the research.
Most notably, Dietvorst, Simmons, and Massey (2018) demonstrate a way to significantly reduce algorithm aversion. In their experiment, the subjects can either choose an algorithm or make their own forecasts. Some of the subjects are—if they choose to use an algorithm—allowed to subsequently change the preliminary forecast of the algorithm by a few percentage points up or down (we describe this in our study as an opportunity to influence the ‘algorithmic output’). When they have this opportunity to make retrospective changes to the forecasts, significantly more subjects are prepared to consult the algorithm for their forecasts than otherwise [
9]. However, the impact of a slight influence on the configuration of the algorithm (an influence on the algorithmic input) has not been the focus of research, a gap that the present study aims to fill.
As long as the subjects are able to change the results of the algorithm (i.e., they have an influence on the algorithmic output), algorithm aversion can be significantly reduced. Decisions in favor of an algorithm are made more frequently if the users retain an element of control over it, whereby the extent to which they are able to modify the algorithm is irrelevant. Furthermore, users who can make slight modifications report that they are no less content with the forecasting process than users who can make unlimited changes. To sum up, users will deploy algorithms more often when they have the final say in how they deal with them [
9]. So, is it crucial for lowering algorithm aversion that users are given an opportunity to influence the algorithmic output, or can algorithm aversion be generally reduced by providing a way of influencing the forecasting process?
Human decision-makers want to influence algorithms instead of being at the mercy of their calculations [
28,
29]. In other words, decision-makers need partial control over an algorithm in order to make a decision in favor of its use. Having real or at least perceived control over the decisions to be made satisfies the psychological needs and personal interests of users [
30]. This feeling of control can arise either via a real understanding of the efficiency of an algorithm or via adaptations to the algorithmic decision-making process, which have little or no influence on the functioning or level of performance of an algorithm [
6]. In other words, if a user is granted control over decisions, this leads to a higher level of acceptance: if a recommendation algorithm for hotel rooms is used that only recommends hotel rooms based on the person’s previous search and purchasing behavior, the offers made are less readily accepted. However, if less than ideal offers are included, levels of acceptance of the algorithm improve [
31]. Participation in the decision-making process, or a belief that one can influence the decision-making process, can contribute towards the user exhibiting greater trust in a decision [
32].
Nolan and Highhouse (2014) argue that allowing subjects to modify mechanical prediction practices may enhance their perception of autonomy and thus their intentions to use them [
33]. In order to expand our understanding of algorithm aversion, we grant the subjects the opportunity to interact with an algorithm, not only by modifying its predictions afterwards, but also, adding to the existing literature, by giving them an influence on the weighting of the algorithm’s input variables. Analogous to the influence on the algorithmic output (both in the present study and in [
9]), we keep the extent of the subjects’ intervention in the algorithmic input small. In this way the algorithm can almost reach its maximum level of performance; however, this minor intervention could be of great significance in overcoming algorithm aversion (cf. [
6]). The present study is the first one to examine whether the opportunity to adjust the weighting of an algorithm’s input factors has an effect on its acceptance. In this study, it is observed whether influencing the algorithmic input can contribute towards a reduction of algorithm aversion in the same way as influencing the algorithmic output does.
The economic experiment extends our understanding of algorithm aversion. As in previous studies, subjects do not behave at all like homo economicus. However, their algorithm aversion can be mitigated. The ability to adjust algorithm output significantly increases willingness to use it. The ability to adjust algorithmic input does not work to the same extent. We therefore advise managers dealing with algorithms to create means of influencing algorithmic output to encourage their customers to use algorithms more often.
2. Materials and Methods
Previous research indicates that economic agents interacting with ADM systems exhibit algorithm aversion and are reluctant to use them (for a synoptic literature review, see [
6,
21]). This behavior of not relying on an algorithm persists even when an algorithm would be more competent in fulfilling a task than other available alternatives [
6,
7,
9,
25,
34,
35]. For instance, economic agents are less likely to rely on share price forecasts when they have been drawn up by an algorithm instead of a human expert, which shows the phenomenon of algorithm aversion in the field of share price forecasts [
36]. Other economic experiments examine the perceived task objectivity and the human-likeness of an algorithm in the context of stock index forecasting and show that the task objectivity affects the willingness to use algorithms with different human-likeness [
8]. The interaction of humans and algorithms is not only a subject in the field of share price forecasts, but also linked to robo advisors in the financial market research [
23].
The fact that algorithms can make more accurate predictions than human forecasters has already been shown on numerous occasions [
4,
5,
18]. Thus, it is key to find ways to mitigate algorithm aversion so that economic agents can arrive at more successful and accurate forecasts. Algorithm aversion can be reduced by providing the opportunity to modify the algorithmic output, even when the possibilities for modification are severely limited [
9].
In their literature review, Burton, Stein, and Jensen (2020) pose the question of whether the reduction of algorithm aversion by the modification of the algorithmic output can also be achieved by a modification of the algorithmic input. Even the illusion of having the freedom to act and make decisions could be a possible solution to overcome algorithm aversion [
6]. Users who interact with algorithms often receive their advice from a black box whose workings are a mystery to them. They thus develop theories about which kinds of information an algorithm uses as input and how this information is exactly processed [
37]. According to Colarelli and Thompson (2008), users need to at least have the feeling that they can exercise a degree of control in order to increase the acceptance of algorithms. This feeling of control can either come from a genuine understanding of how an algorithm works or by making modifications to the algorithmic decision-making process. Whether a genuine influence is exerted on the way the algorithm actually functions is not important here. It is only necessary to allow the users to have real or perceived control over decision-making in order to satisfy their need for a feeling of control [
30].
Kawaguchi (2021) has taken a look at how adding an input variable—in this case the predictions made by the subjects—to an algorithm’s forecasting process influences algorithm aversion [
25]. We draw on this approach and examine how an opportunity to influence the algorithmic input affects the willingness to use an algorithm. We give our subjects the possibility to influence the weighting of an input factor the algorithm uses for its predictions. In this way, we are testing an alternative approach to the reduction of algorithm aversion without influencing the algorithmic output. Since modification of the algorithmic output can also have a negative overall effect on forecasting performance, it is examined whether influencing the weighting of an input factor reduces algorithm aversion without allowing human modification of the algorithmic output. We do not want to deceive the subjects and thus give them—in the form of this input factor—the opportunity to exert an actual influence on the configuration of the forecasting computer. In this way, the subjects are given freedom to act in a limited way, which actually leads to slight differences in how the algorithm works. Thus, we address the issue of whether a general possibility to influence the algorithmic process is sufficient to reduce algorithm aversion, or whether an opportunity to influence the results themselves is necessary. We thus examine whether an opportunity to influence the weighting of the input variables of the algorithm (algorithmic input) can contribute towards a similar decrease in algorithm aversion as the opportunity to influence the algorithmic output.
To validate our results in light of previous research and to strengthen our findings, we first replicate the possibility of severely limited influence on algorithmic output [
9]. We determine whether this measure can also contribute to a reduction of algorithm aversion in the domain of share price forecasts when a choice is made between an algorithm and a subject’s own forecasts.
Hypothesis 1 is therefore: The proportion of decisions in favor of the algorithm will be higher when there is a limited possibility to influence the algorithmic output than when no influence is possible. Hence,
null hypothesis 1 is: The proportion of decisions in favor of the algorithm will not be higher when there is a limited possibility to influence the algorithmic output than when no influence is possible.
Other studies suggest that an influence on the input of an algorithm may also reduce the extent of algorithm aversion [
6,
25,
33,
38]. In order to examine whether the possibility to influence the weighting of an algorithm’s input variables can have an effect on the willingness to use the algorithm, and thus on algorithm aversion, without the negative effects on performance of influencing algorithmic output, we formulate
hypothesis 2 as follows: The proportion of decisions in favor of the algorithm will be higher when there is a limited possibility to influence the algorithmic input than when no influence is possible.
Null hypothesis 2 is therefore: The proportion of decisions in favor of the algorithm will not be higher when there is a limited possibility to influence the algorithmic input than when no influence is possible.
In order to answer our research question, an economic experiment is carried out between 17–27 March 2021 in the Ostfalia Laboratory of Experimental Economic Research (OLEW) with students of the Ostfalia University of Applied Sciences in Wolfsburg. In 51 sessions, a total of 157 subjects take part in the experiment. An amount of 118 subjects (75.16%) are male, and 39 subjects (24.84%) are female. The subjects are distributed across the faculties as follows: 66 subjects (42.04%) study at the Faculty of Vehicle Technology, 56 subjects (35.67%) at the Faculty of Business, 9 subjects (5.73%) at the Faculty of Health Care, and a further 26 subjects (16.56%) at other faculties based at other locations of the Ostfalia University of Applied Sciences. Their average age is 23.6 years.
The experiment is programmed with z-Tree (cf. [
39]). In the OLEW, there are twelve computer workplaces. However, only a maximum of four are used per session. This ensures that, in line with the measures to contain the COVID-19 pandemic, a considerable distance can be maintained between the subjects. The workplaces in the laboratory are also equipped with divider panels, which makes it possible to completely separate the subjects from each other. The experiments are constantly monitored by the experimenter so that communication between the subjects and the use of prohibited aids (such as smartphones) can be ruled out. Overall, a total of 51 sessions with a maximum of four subjects per session are carried out. A session lasts an average of 30 min. The detailed results of the experiment are available as
Supplementary Material at the end of the article.
In our study, the subjects are asked to forecast the exact price of a share in ten consecutive periods (
Appendix A). Here, the price of the share is always the result of four influencing factors (A, B, C, and D), which are supplemented by a random influence (Ɛ) (see [
40,
41,
42,
43]). First of all, the subjects are familiarized with the scenario and are informed that the influencing factors A, C, and D have a positive effect on the share price. This means that—other things being equal—when these influencing factors rise, the share price will also rise. The influencing factor B, on the other hand, has a negative effect on the share price. This means that—other things being equal—when the influencing factor B rises, the share price will fall (
Table 1). In addition, the subjects are informed that the random influence (Ɛ) has an expected value of zero. However, the random influence can lead to larger or smaller deviations from the share price level which the four influencing factors would suggest.
The subjects are informed of the four influencing factors before each of the ten rounds of forecasting. In addition, they always receive a graphic insight into the historical development of the share price, the influencing factors, and the random influence in the last ten periods. In this way, the subjects can recognize in a direct comparison how the levels of the four influencing factors have an effect on the share price during the individual rounds of forecasting. Through test questions we ensure that all subjects have understood this (
Appendix B).
The payment structure provides for a fixed show-up fee of EUR 4 and a performance-related element. The level of the performance-related payment is dependent on the precision of the individual share price forecasts, whereby the greater the precision of the forecasts, the higher the payment (
Table 2). The subjects can thus obtain a maximum payment of EUR 16 (EUR 4 show-up fee plus EUR 12 performance-related payment from ten rounds of forecasting).
In order to help them make the share price forecasts, a forecasting computer (algorithm) is made available to the subjects. The subjects are informed that in the past the share price forecasts of the forecasting computer have achieved a payment of at least EUR 0.60 per forecast in 7 out of 10 cases. The subjects are thus aware of the fact that the algorithm they are using does not function perfectly. In order to make its forecasts, the algorithm uses the information which it has been given on the fundamental influencing factors, the direction and strength of the influence, and the random influence (Ɛ) in a way that maximizes the accuracy and thus the expected payoff. In this way, however, it by no means achieves ‘perfect’ forecasts (for a detailed description of how the algorithm works, see
Appendix D). Based on the same information and the historical share prices, the subjects can make their own assessments. They would, however, be wrong to assume that they can outperform the algorithm in this way. Following the suggestions of the algorithm would thus seem to be the more sensible option. Before making their first share price forecast, the subjects make a one-off decision on whether they wish to base their payment for the subsequent ten rounds of forecasting on their own forecasts or on those made by the forecasting computer. Our set-up is oriented towards that used in the study carried out by Dietvorst, Simmons, and Massey (2018). Algorithm aversion is thus modeled as the behavior of not choosing an ADM system that would increase subjects’ payoff.
The experiment is carried out in three treatments. The 157 participants are divided up evenly over the three treatments, so that 52 subjects each carry out Treatments 1 and 2, and 53 subjects carry out Treatment 3. The distribution of the subjects among the three treatments has similarities to their distribution among the faculties as well as to their gender. The study uses a between-subjects design: each subject is assigned to only one treatment and encounters the respective decision-making situation. In Treatment 1 (no opportunity to influence the algorithm), the subjects make the decision (once only) whether they want to use their own share price forecasts as the basis for their payment or whether they want to use the share price forecasts made by the forecasting computer. Even if the subjects choose the algorithm for determining their bonus, they have to make their own forecasts. In this case, their payoff only depends on the algorithm’s forecasts, not on the forecasts made by the subjects themselves. The obligation to submit one’s own forecasts even when choosing the algorithm is based on the study by Dietvorst, Simmons, and Massey (2018). Regardless of this decision, the subjects make their own forecasts without having access to the forecast of the algorithm. (
Figure A2 in
Appendix C).
With Treatment 2 (opportunity to influence the algorithmic output), we intend to replicate the results of Dietvorst, Simmons, and Massey (2018). To this end, the subjects make the decision (once only) whether they solely want to use their own share price forecasts as the basis for their payment or whether they solely wish to use the share price forecasts made by the forecasting computer (which, however, can be adjusted by up to +/− EUR 5) as the basis for their performance-related payment. The algorithmic forecast is only made available to the subjects if they decide in favor of the forecasting computer (
Figure A3).
In Treatment 3, we introduce the opportunity to influence the configuration of the algorithm (algorithmic input). Before handing in their first share price forecast, the subjects again make the decision (once only) whether they want to solely use their own share price forecasts as the basis for their performance-related payment or whether they want to solely use the share price forecasts made by the forecasting computer. If they decide in favor of the share price forecasts of the forecasting computer, the subjects receive a one-off opportunity to influence the configuration of the algorithm (
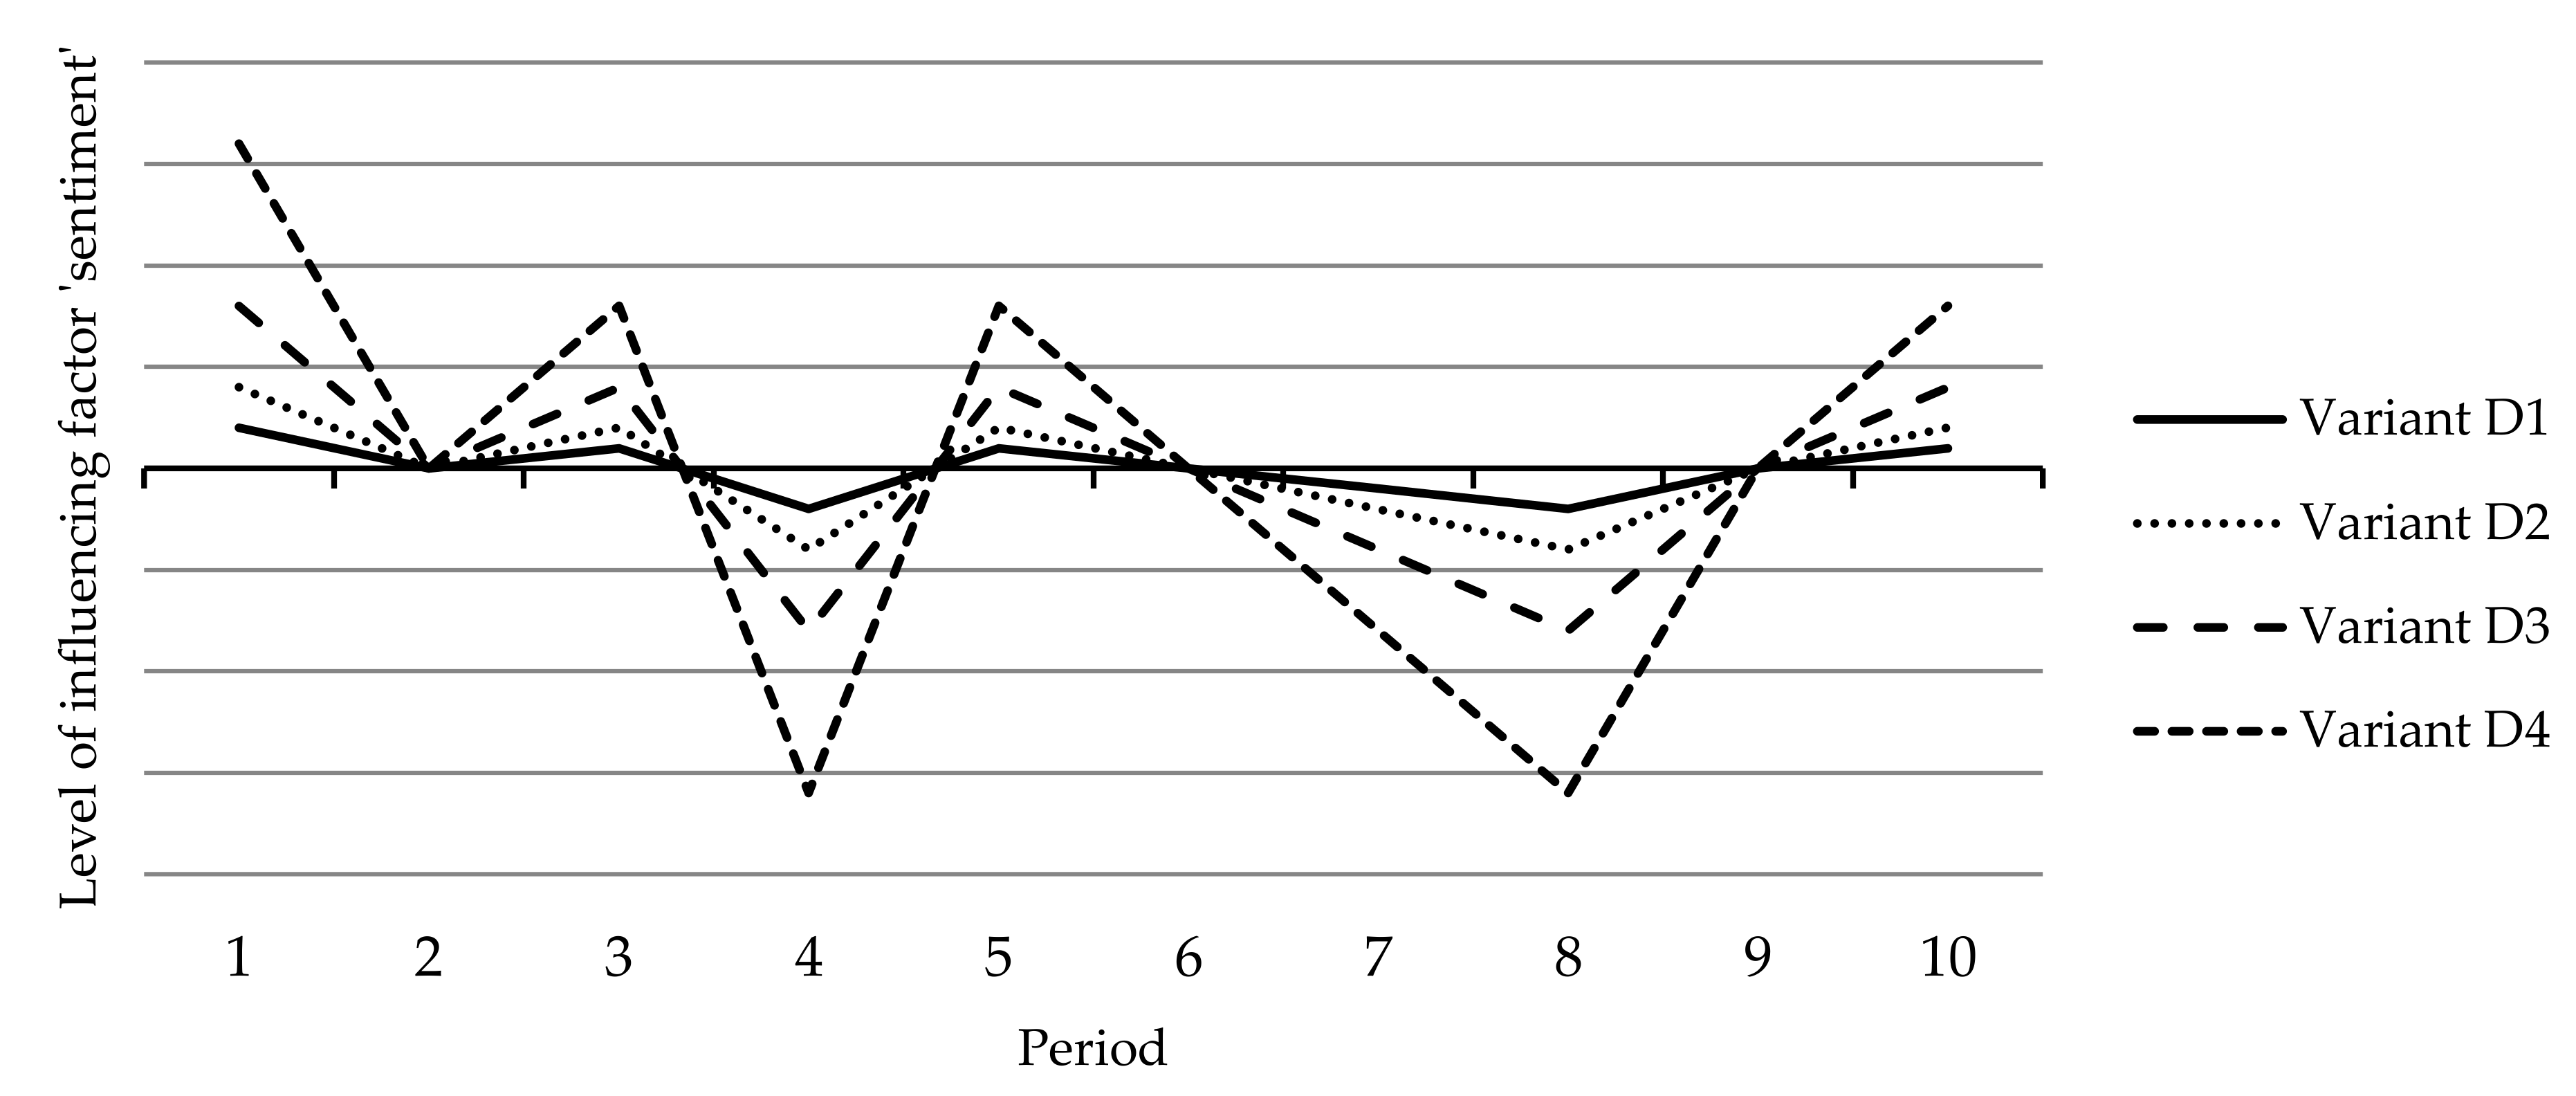
Figure A4). To this end, they are given a more detailed explanation. The algorithm uses data on four different factors which influence the formation of the share price (A, B, C, and D). The last of these four influencing factors is identified as the sentiment of capital market participants and can be taken into account to various extents by the forecasting computer. To do so, the subjects can choose from four different levels. Whereas variant D1 attaches relatively little importance to sentiment, the extent to which sentiment is taken into account in the other variants increases continuously and is relatively strong in variant D4 (
Figure 1).
Subjects who decide to use the forecasting computer in Treatment 3, and thus receive the opportunity to influence the configuration of the algorithm, have a one-off chance to change the weighting of the input variable D of the algorithm (
Figure A1 in
Appendix A.3). This occurs solely by means of their choice of which degree of sentiment should be taken into account (variant D1, D2, D3, or D4).
3. Results
The results show that the various possibilities to influence the forecasting process lead to different decisions on the part of the subjects. In Treatment 1 (no influence possible), 44.23% of the subjects opt for the use of the algorithm. The majority of the subjects here (55.77%) put their faith in their own forecasting abilities. In Treatment 2 (opportunity to influence the algorithmic output), on the other hand, 69.23% of the subjects decide to use the forecasting computer, and 30.77% of the subjects choose to use their own forecasts. In Treatment 3 (opportunity to influence the algorithmic input), 58.49% of the subjects decide to use the forecasting computer, and 41.51% of the subjects choose to use their own forecasts (
Figure 2).
On average, across all three treatments, the subjects obtain a payment of EUR 9.57. However, there are large differences in the amounts of the payment depending on the strategy chosen. Subjects who choose their own forecasts achieve an average total payment of EUR 8.94. When the algorithm is chosen, the average payment in all three treatments is between EUR 9.99 and EUR 10.11 (
Figure 3). The Wilcoxon rank-sum test shows that the average payment—regardless of the treatment—is significantly higher if the algorithm is used as the basis of the forecasts (T1: z = 4.27,
p ≤ 0.001; T2: z = 3.25,
p ≤ 0.001; T3: z = 5.27,
p ≤ 0.001). No matter which treatment is involved, it is thus clearly in the financial interests of the subjects to put their faith in the algorithm. The algorithm consistently outperforms human judgment, yet, across all treatments, 42.68% of the subjects refrain from using it. In our study too, the phenomenon of algorithm aversion is thus evident in the field of share price forecasts [
8,
36].
We perform the Chi-square test on subject’s decisions between the algorithm and their own forecasts among the individual treatments. Whereas in Treatment 1 a total of 44.23% of the decisions are in favor of the algorithm, 69.23% of the subjects who can make changes to the algorithmic output (Treatment 2) decide to use the forecasting computer (𝛘2 (N = 104) = 6.62, p ≤ 0.010). Null hypothesis 1 thus has to be rejected; the opportunity to modify the algorithmic output by up to +/− EUR 5 leads to the subjects selecting the forecasting computer significantly more frequently to determine their payment.
When subjects are given the opportunity to influence the algorithmic input (Treatment 3), the majority of the subjects (58.49%) choose to use the forecasting computer (𝛘2 (N = 105) = 2.14, p ≤ 0.144). Nevertheless, null hypothesis 2 is not rejected. The possibility to influence the algorithmic input (via the extent to which the influencing factor D is taken into account) does not lead to the subjects selecting the forecasting computer significantly more often as the basis for their performance-related payment.
In each treatment, there are between 52 and 53 participants, leading to a total of 157 participants. The 67 subjects who, regardless of which treatment they are in, use their own forecasts as the basis of their payment, diverge by an average of EUR 18.28 from the actual share price and thus achieve an average bonus of EUR 0.49 per round of forecasting. The 90 subjects who decide to use the forecasts of the forecasting computer exhibit a lower average forecasting error independently of which treatment they are in. The average bonus and the average payment of the subjects who use the forecasting computer are also higher than that of subjects who rely on their own forecasting abilities. Because of the different ways in which the algorithm can be influenced, the average forecast error, average bonus per round, and average total payment also vary between treatments for those subjects who rely on the ADM (
Table 3).
In Treatment 2, the subjects are given the opportunity to adapt the algorithmic output in each round of forecasting by up to +/− EUR 5. The subjects do not fully exploit the scope granted to them to exert an influence on the algorithm and make an average change to the algorithmic forecast of EUR 2.11. In Treatment 3, the subjects are given a one-off opportunity via the influencing factor D (sentiment) to exert an influence on the configuration of the algorithm (input). Eight subjects select variant D1, which takes sentiment into account to a minor extent. Eleven subjects choose to take sentiment into account to a moderate extent, seven to a considerable extent, and five to a great extent.
If the results are viewed in isolation, a similar picture is revealed. Regardless of whether subjects used their own forecasts or the forecasts of the forecasting computer to determine their payment, the average forecast error in Treatment 1 (no influence possible) is higher than in the other two treatments, which offer the subjects the opportunity to influence the algorithm. Whereas the forecasts in Treatment 1 deviate by an average of EUR 16.18 from the resulting share price, the average forecast error in Treatment 2 is EUR 15.14 and EUR 15.15 in Treatment 3. That those subjects who are given the opportunity to influence the algorithm are more successful is shown by their average bonus and higher average overall payment (
Table 4).
4. Discussion
Algorithm aversion is characterized by the fact that it mostly occurs when algorithms recognizably do not function perfectly, and prediction errors occur [
7]. Even when it is recognizable that the algorithm provides significantly more reliable results than humans (lay persons as well as experts), many subjects are still reluctant to trust the algorithm [
9]. Due to the advancing technological transformation and the increasing availability of algorithms, it is inevitable to enhance the understanding of algorithm aversion and to study ways to mitigate it.
Previous research had shown that giving users the ability to influence algorithmic output in terms of minimal adjustments to the forecasts contributes to a significant reduction of algorithm aversion [
9]. This groundbreaking finding is confirmed in the context of share price forecasts in the present paper. As shown in our introduction section, as a reaction to this interesting concept, a rich literature that focuses on further ways to mitigate algorithm has emerged [
23,
24,
26,
27].
Most noteworthy in the context of our research, Kawaguchi (2021) examined the effect of having an algorithm select its users’ individual forecasts as an additional input variable [
25], and Jung and Seiter (2021) examined the effect of having subjects self-select the variables an algorithm should consider [
38]. Both studies report significant changes in the extent of algorithm aversion due to the manipulation on the input they investigate. The results from the present study are in line with previous findings regarding influence on an algorithm’s output [
9] but point in a different direction regarding influence on algorithm’s input [
25,
38].
The algorithm used in our study does not give perfect forecasts, and if there are no opportunities to influence the algorithm’s decision-making process, the majority of users choose not to use the forecasting computer. But the ability to influence algorithmic output (replicated from [
9]) leads subjects to use the algorithm significantly more often compared to the control treatment, even when the amount of adjustment allowed in the process is relatively small (T1 vs. T2). By using the algorithm more frequently, the subjects also enhance their financial performance.
Our study essentially contributes to the scientific discourse by testing the possibility of influence on the weighting of the variables an algorithm uses in its forecasting process (the algorithmic input). Even though the financial performance is slightly enhanced, there is no significantly higher willingness to use the algorithm compared to the control treatment when there is a possibility to influence the input (T1 vs. T3). The assumption of Nolan and Highhouse (2014) that intention to use a forecasting aid can be improved by the possibility to influence its configuration is not confirmed [
33]. We also cannot confirm Burton, Stein, and Jensen’s (2020) conjecture that changing an ADM’s input mitigates algorithm aversion, at least for the consideration of a limited influence on the weighting of the algorithmic input [
6]. The differences in our results compared to Kawaguchi (2021) and Jung and Seiter (2021) are likely due to the fact that the extent of the subjects’ influence on the input of the algorithm is much smaller in the present study [
25,
38]. Another crucial difference is that the input factors of the algorithm in our study are predetermined, and only the weighting can be changed.
We examine whether major reductions in algorithm aversion are due to the fact that the subjects can exercise an influence on the process of algorithmic decision-making in general, or only because they can influence its forecasts. We expand the research about algorithm aversion by showing that a general opportunity to influence an algorithm is obviously not sufficient to significantly reduce algorithm aversion. Subjects want to retain control over the results and to have the final say in the decision-making process, even if this intervention is limited by considerable restrictions. Since no significantly higher willingness to use them can be achieved by adjusting the input, we recommend focusing on the output of algorithms in order to identify further possibilities for mitigating algorithm aversion. It seems to be of considerable relevance at which point in the process of algorithmic decision-making an intervention is allowed.
4.1. Implications
Nevertheless, our study has interesting implications for real-life situations. The overall financial benefit can be maximized by influencing the algorithmic output. Decision-makers tend to trust an algorithm more if they can keep the upper hand in the decision-making process. This even applies when the possibilities to exert an influence are limited. The average quality of the forecasts is slightly reduced due to the changes made by the decision-maker (
Table 3), but this is over-compensated for by a significantly higher utilization rate of the—still clearly superior—algorithm, and, in a comparison between the treatments, this leads to a higher average total payment (
Table 4). The opportunity to influence the algorithmic input has a similar effect with regard to the overall pecuniary benefit. The forecasts made after the subjects have made changes to the algorithm actually exhibit a slightly lower forecast error and a somewhat higher bonus. To a similar degree to which the subjects do not fully take advantage of the opportunity to influence the algorithmic output, they also fail to put their faith in the algorithm. Their average payment is nevertheless significantly higher than that of the subjects who cannot influence the algorithm. From this we conclude for real-world settings that customers should not be involved in formulas or configuration options of algorithms, but rather be given the opportunity to influence the output, for example through override functions, veto rights, emergency stop buttons, etc.
4.2. Limitations
Our study also has some limitations which should be noted. We give the subjects a genuine opportunity to influence the algorithmic input. However, we also make it clear in the instructions that the influencing factor D, which can be taken into account to different degrees, only has a moderate influence on the formation of the share price. The influencing factors A, B, and C, on the other hand, have a considerable influence. This circumstance could contribute towards the subjects not developing enough trust in their opportunity to influence the input and thus tending to rely on their own forecasts. In addition, our results were obtained in the context of share price forecasts. The validity of our results for the many other areas of ADM systems has yet to be verified.
4.3. Future Research
Future research work may wish to investigate further possibilities to reduce algorithm aversion. This study has again shown that granting subjects the opportunity to influence the algorithmic output can effectively reduce algorithm aversion. However, there is a risk that the forecasting performance of the algorithm can deteriorate as a result of the modifications. For this reason, it is important to examine alternative forms of reducing algorithm aversion. Our study has shown that modifying the algorithmic input to a small extent is only of limited use here. It would be interesting to see what happens when the possible adjustments to the algorithmic input, and thus the perceived control over the algorithm, are greater. In our study, opportunities to influence the algorithmic input cannot reduce algorithm aversion to the same extent as giving subjects the chance to influence the algorithmic output. We therefore recommend that further research be carried out to search for other alternatives to reduce algorithm aversion. One possible approach could be to merely give users the illusion of having control over the algorithmic process. In this way, algorithm aversion could be decreased without a simultaneous reduction of the forecasting quality.


