
E-Commerce Cross-Border and Domestic Dynamics: Decision Tree and Spatial Insights on Seller Origin Impact


Abstract
:1. Introduction
2. Literature Review
2.1. Country’s Evaluation of E-Commerce
2.2. Key Factors Influencing Online Retailing
2.3. Physical and Electronic Goods and Services in Online Purchases
2.4. Spatial Dependence in Online Purchases in Relation to Seller Origin
2.5. Contributions of the Study
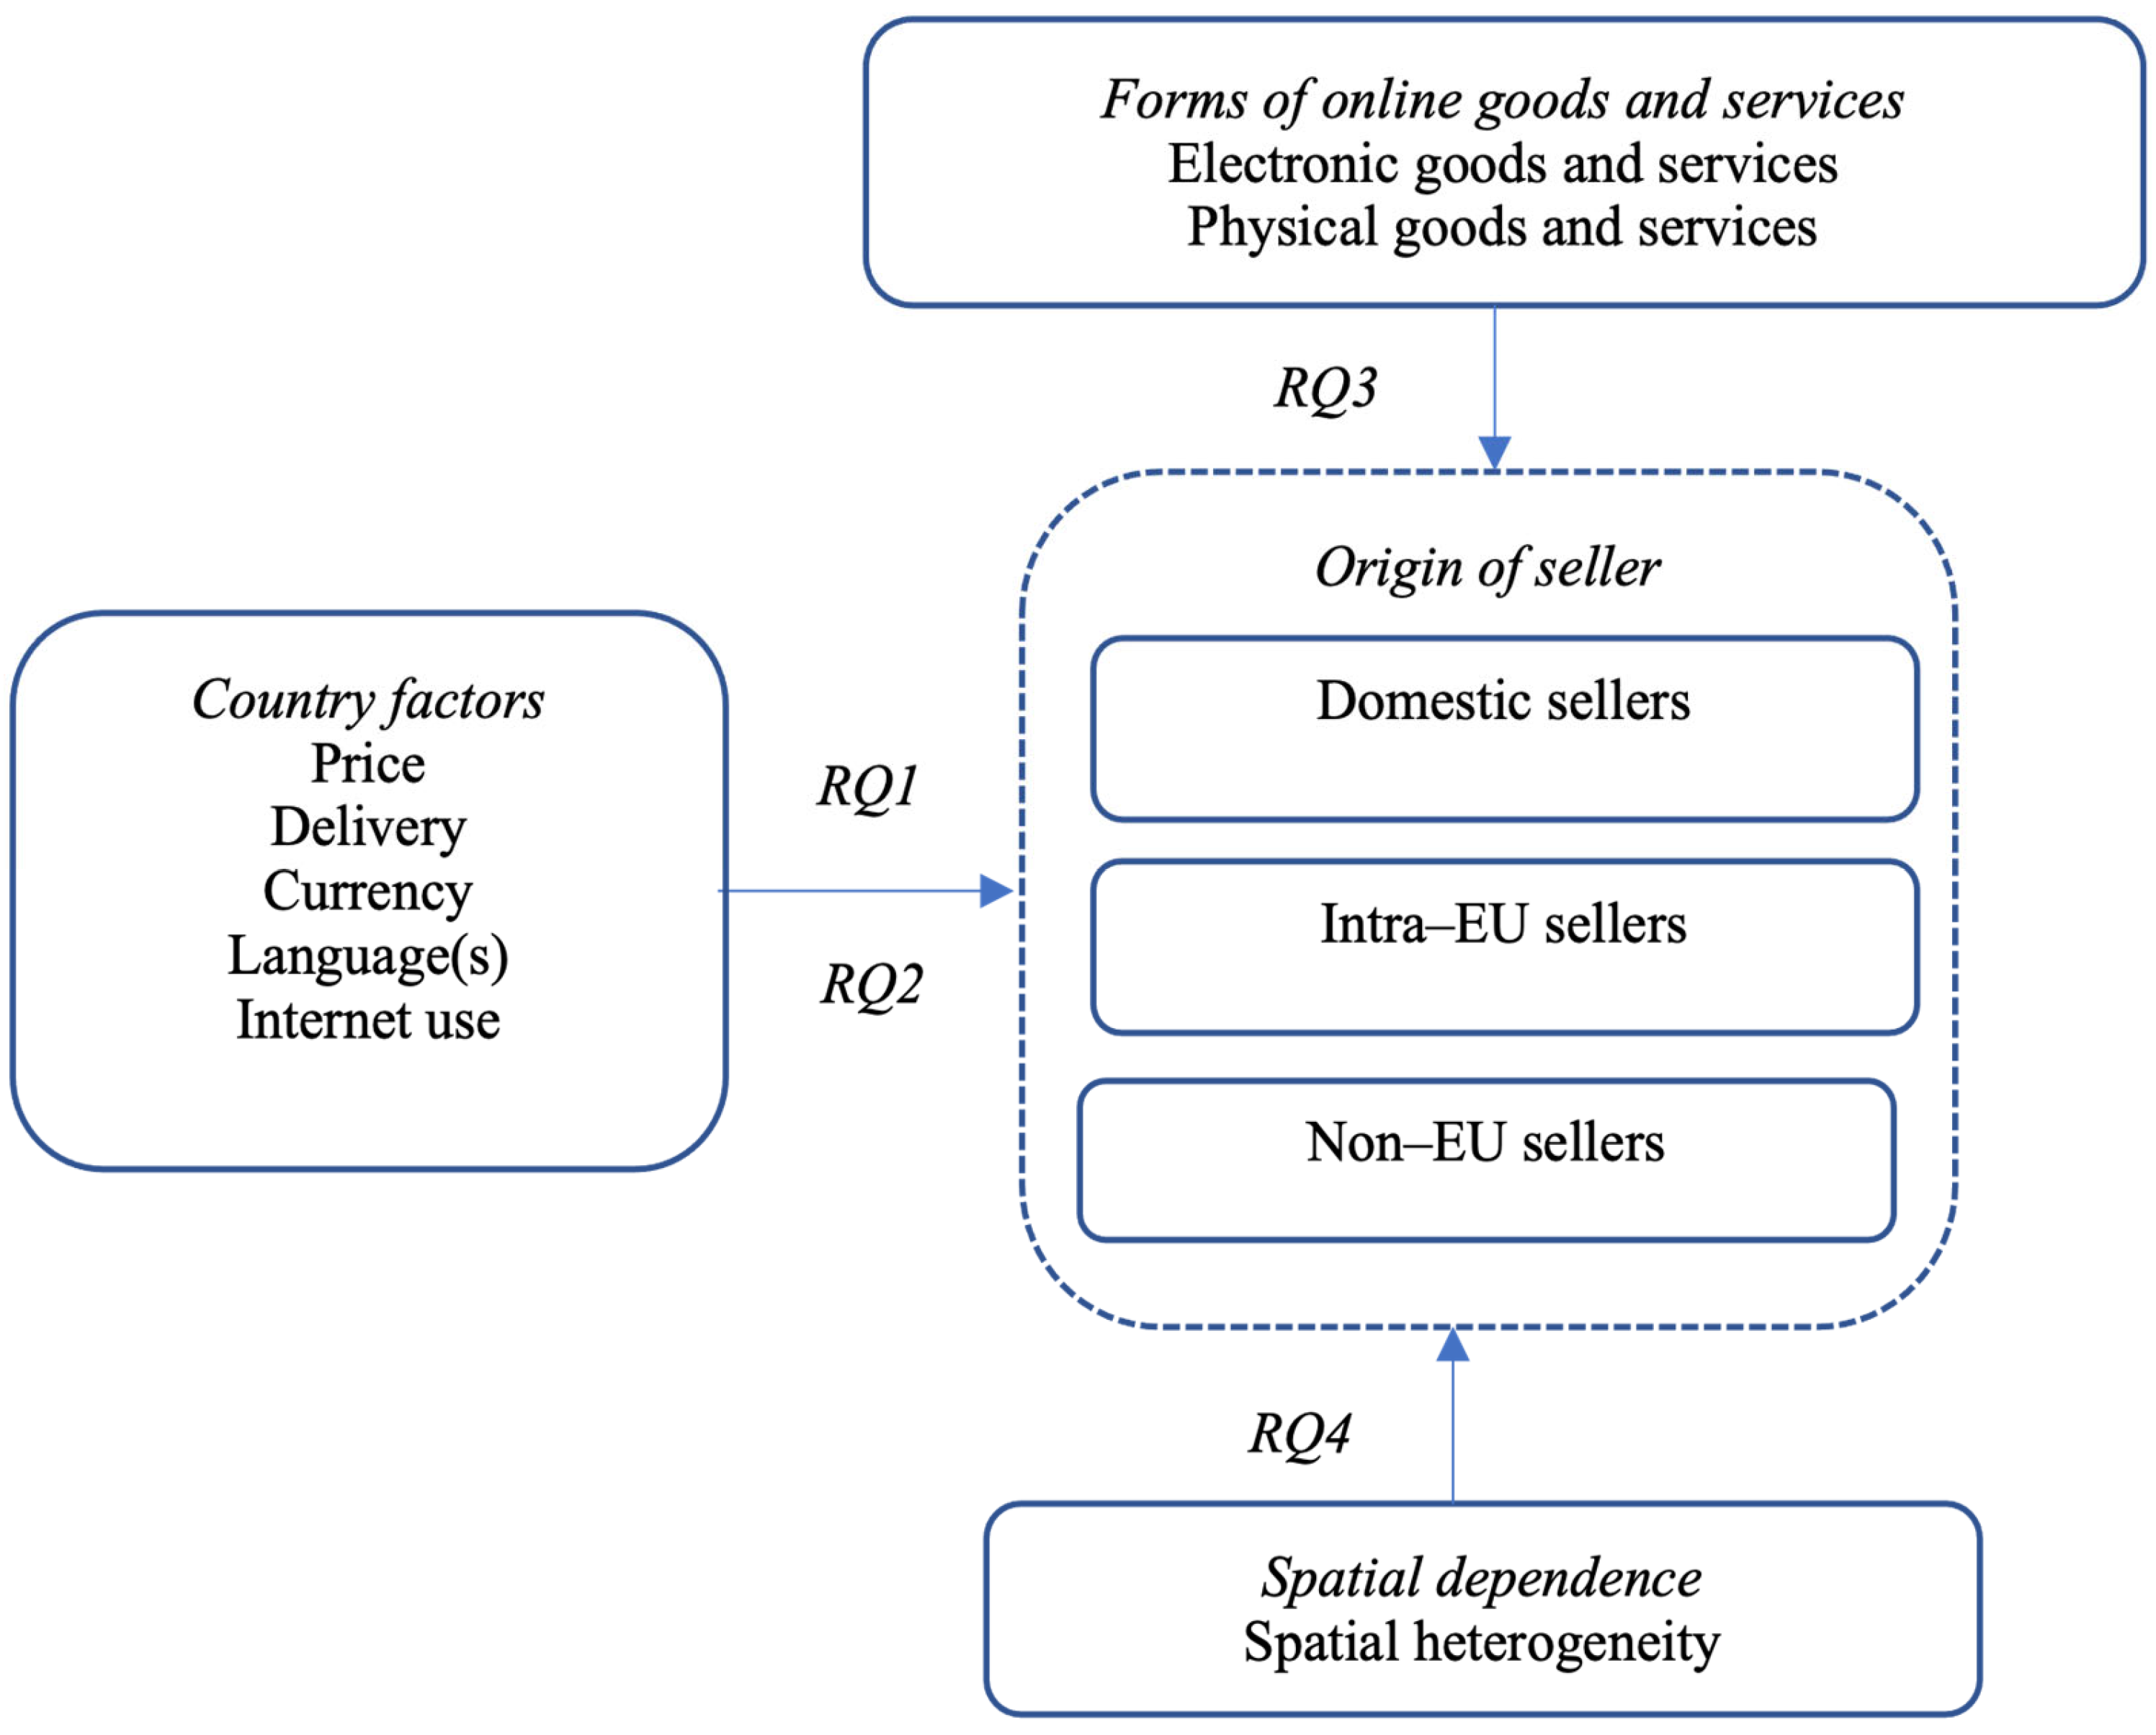
2.6. Model of the Study
3. Materials
4. Methods
4.1. Regression Analysis of Country Differences in Online Purchases
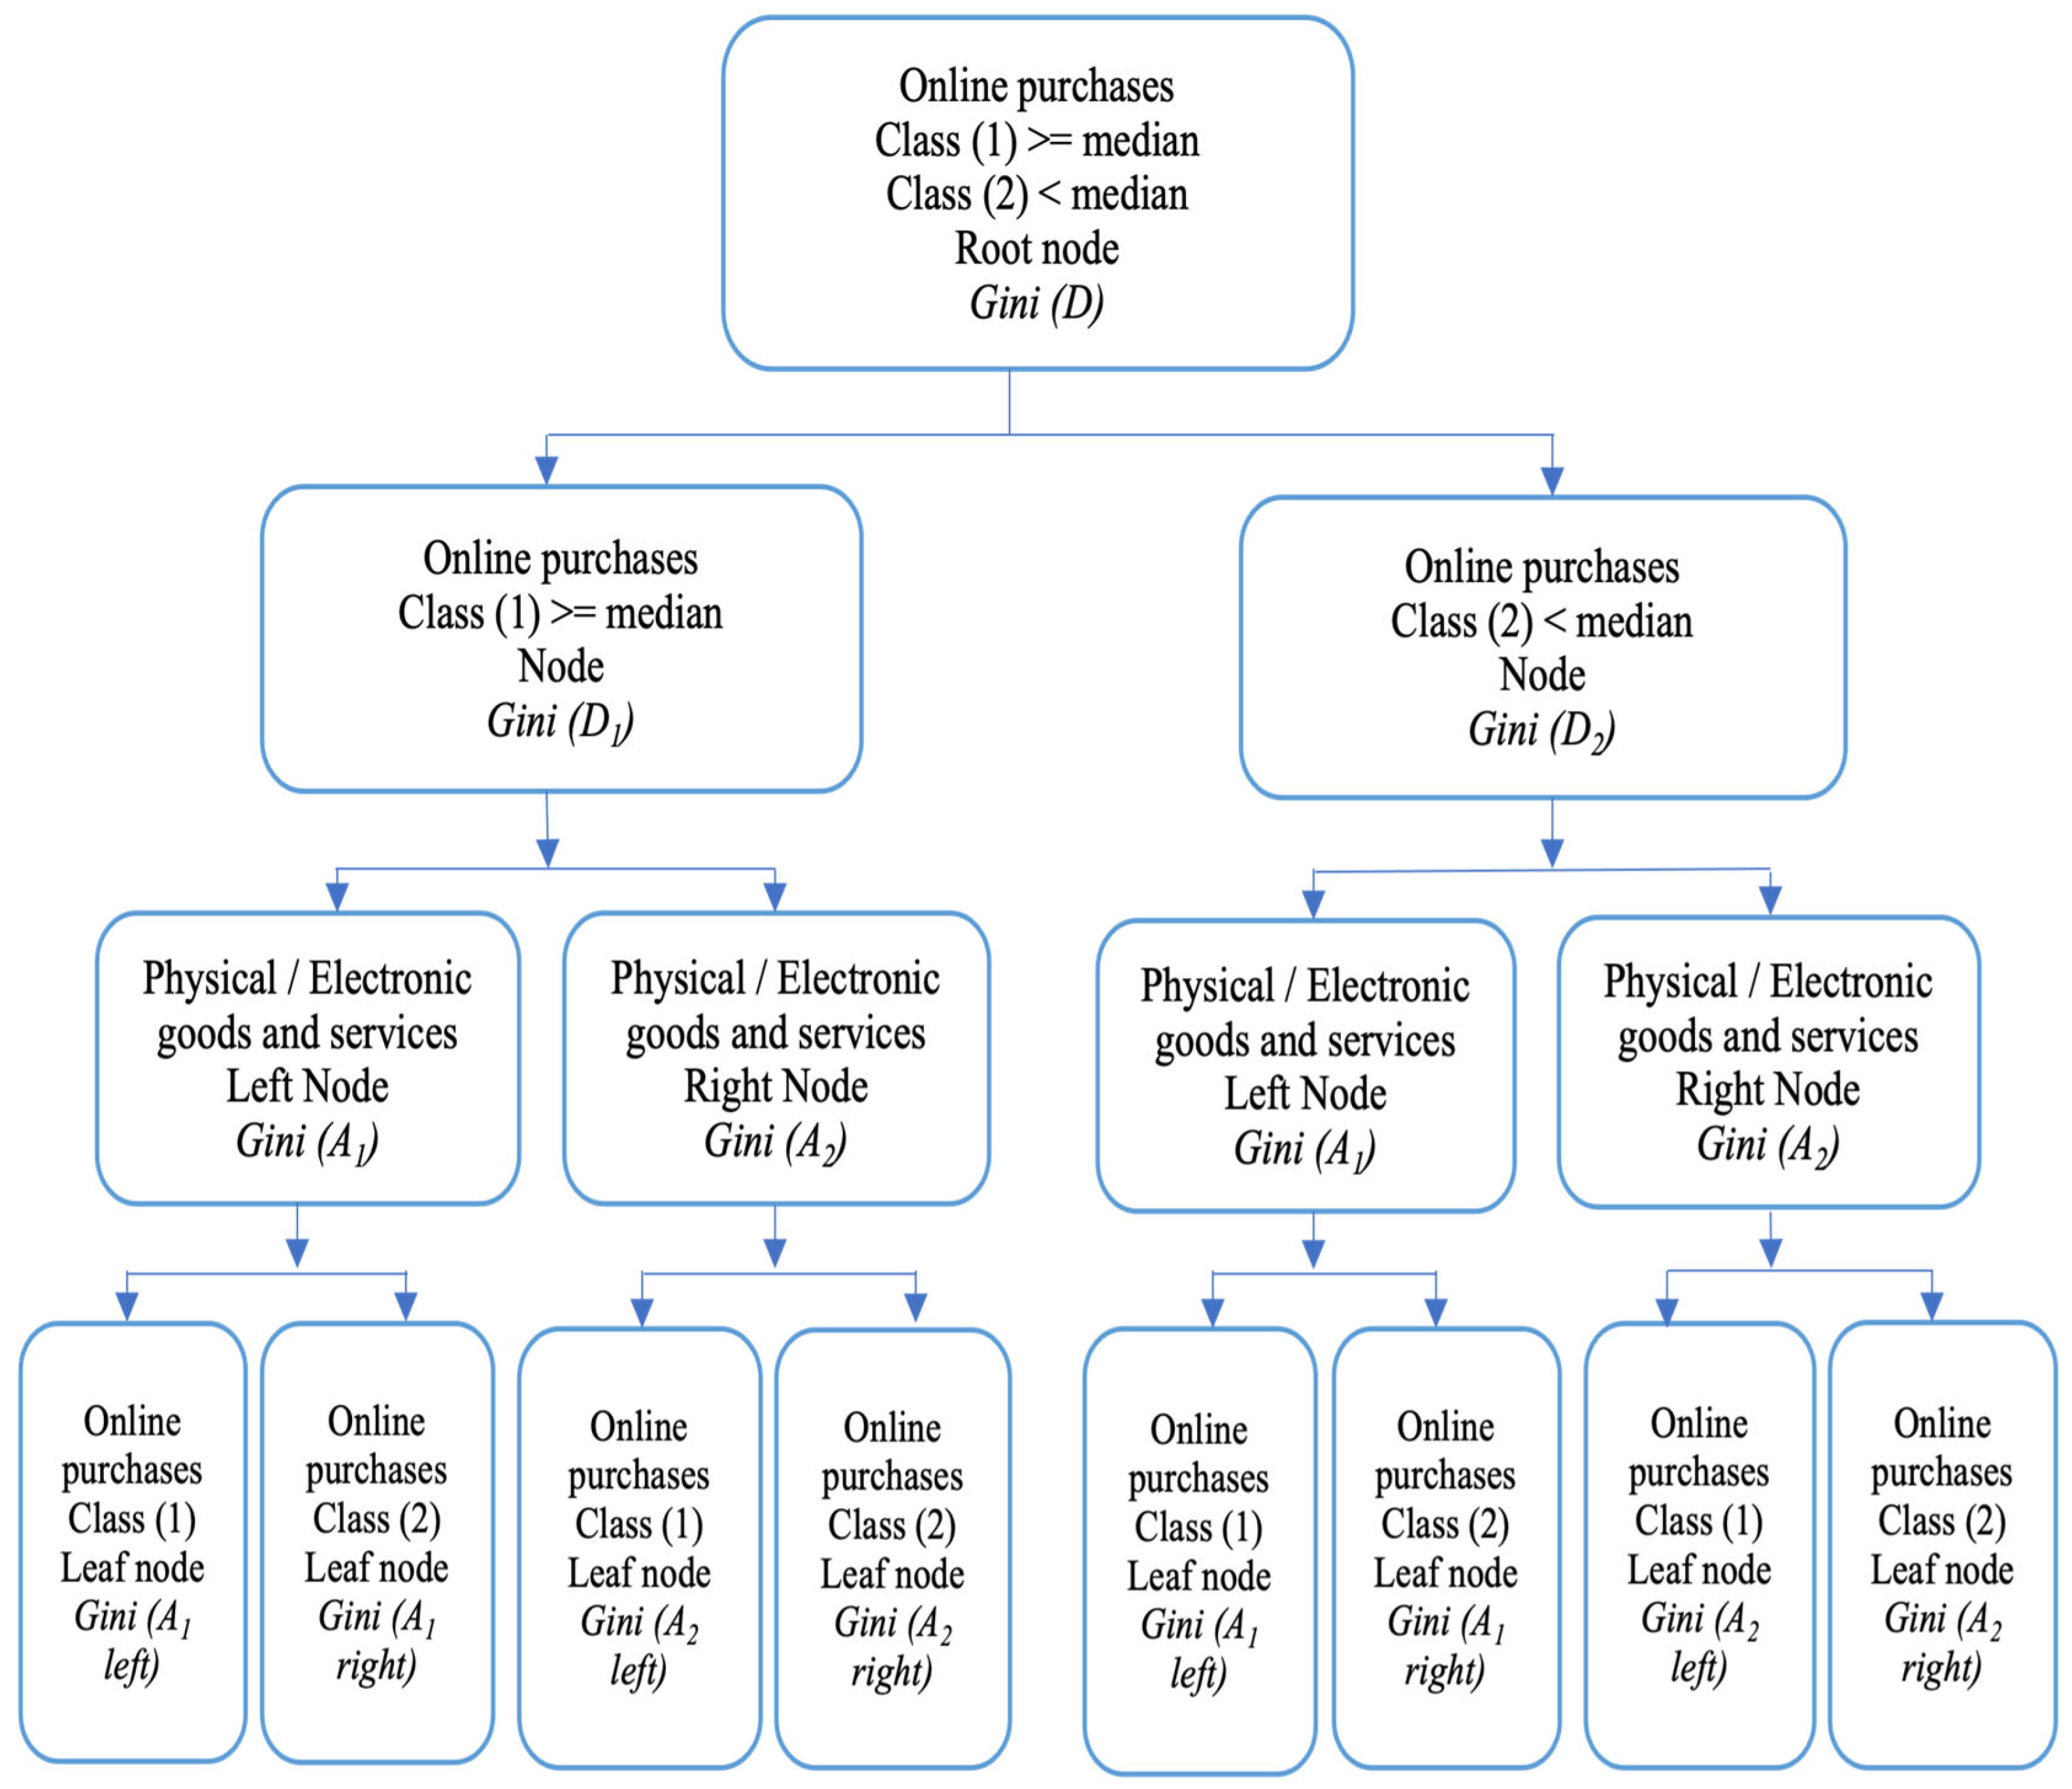
4.2. Feature Importance for Selection of Goods and Services in Online Purchases and Regression Analysis on Their Electronic and Physical Forms
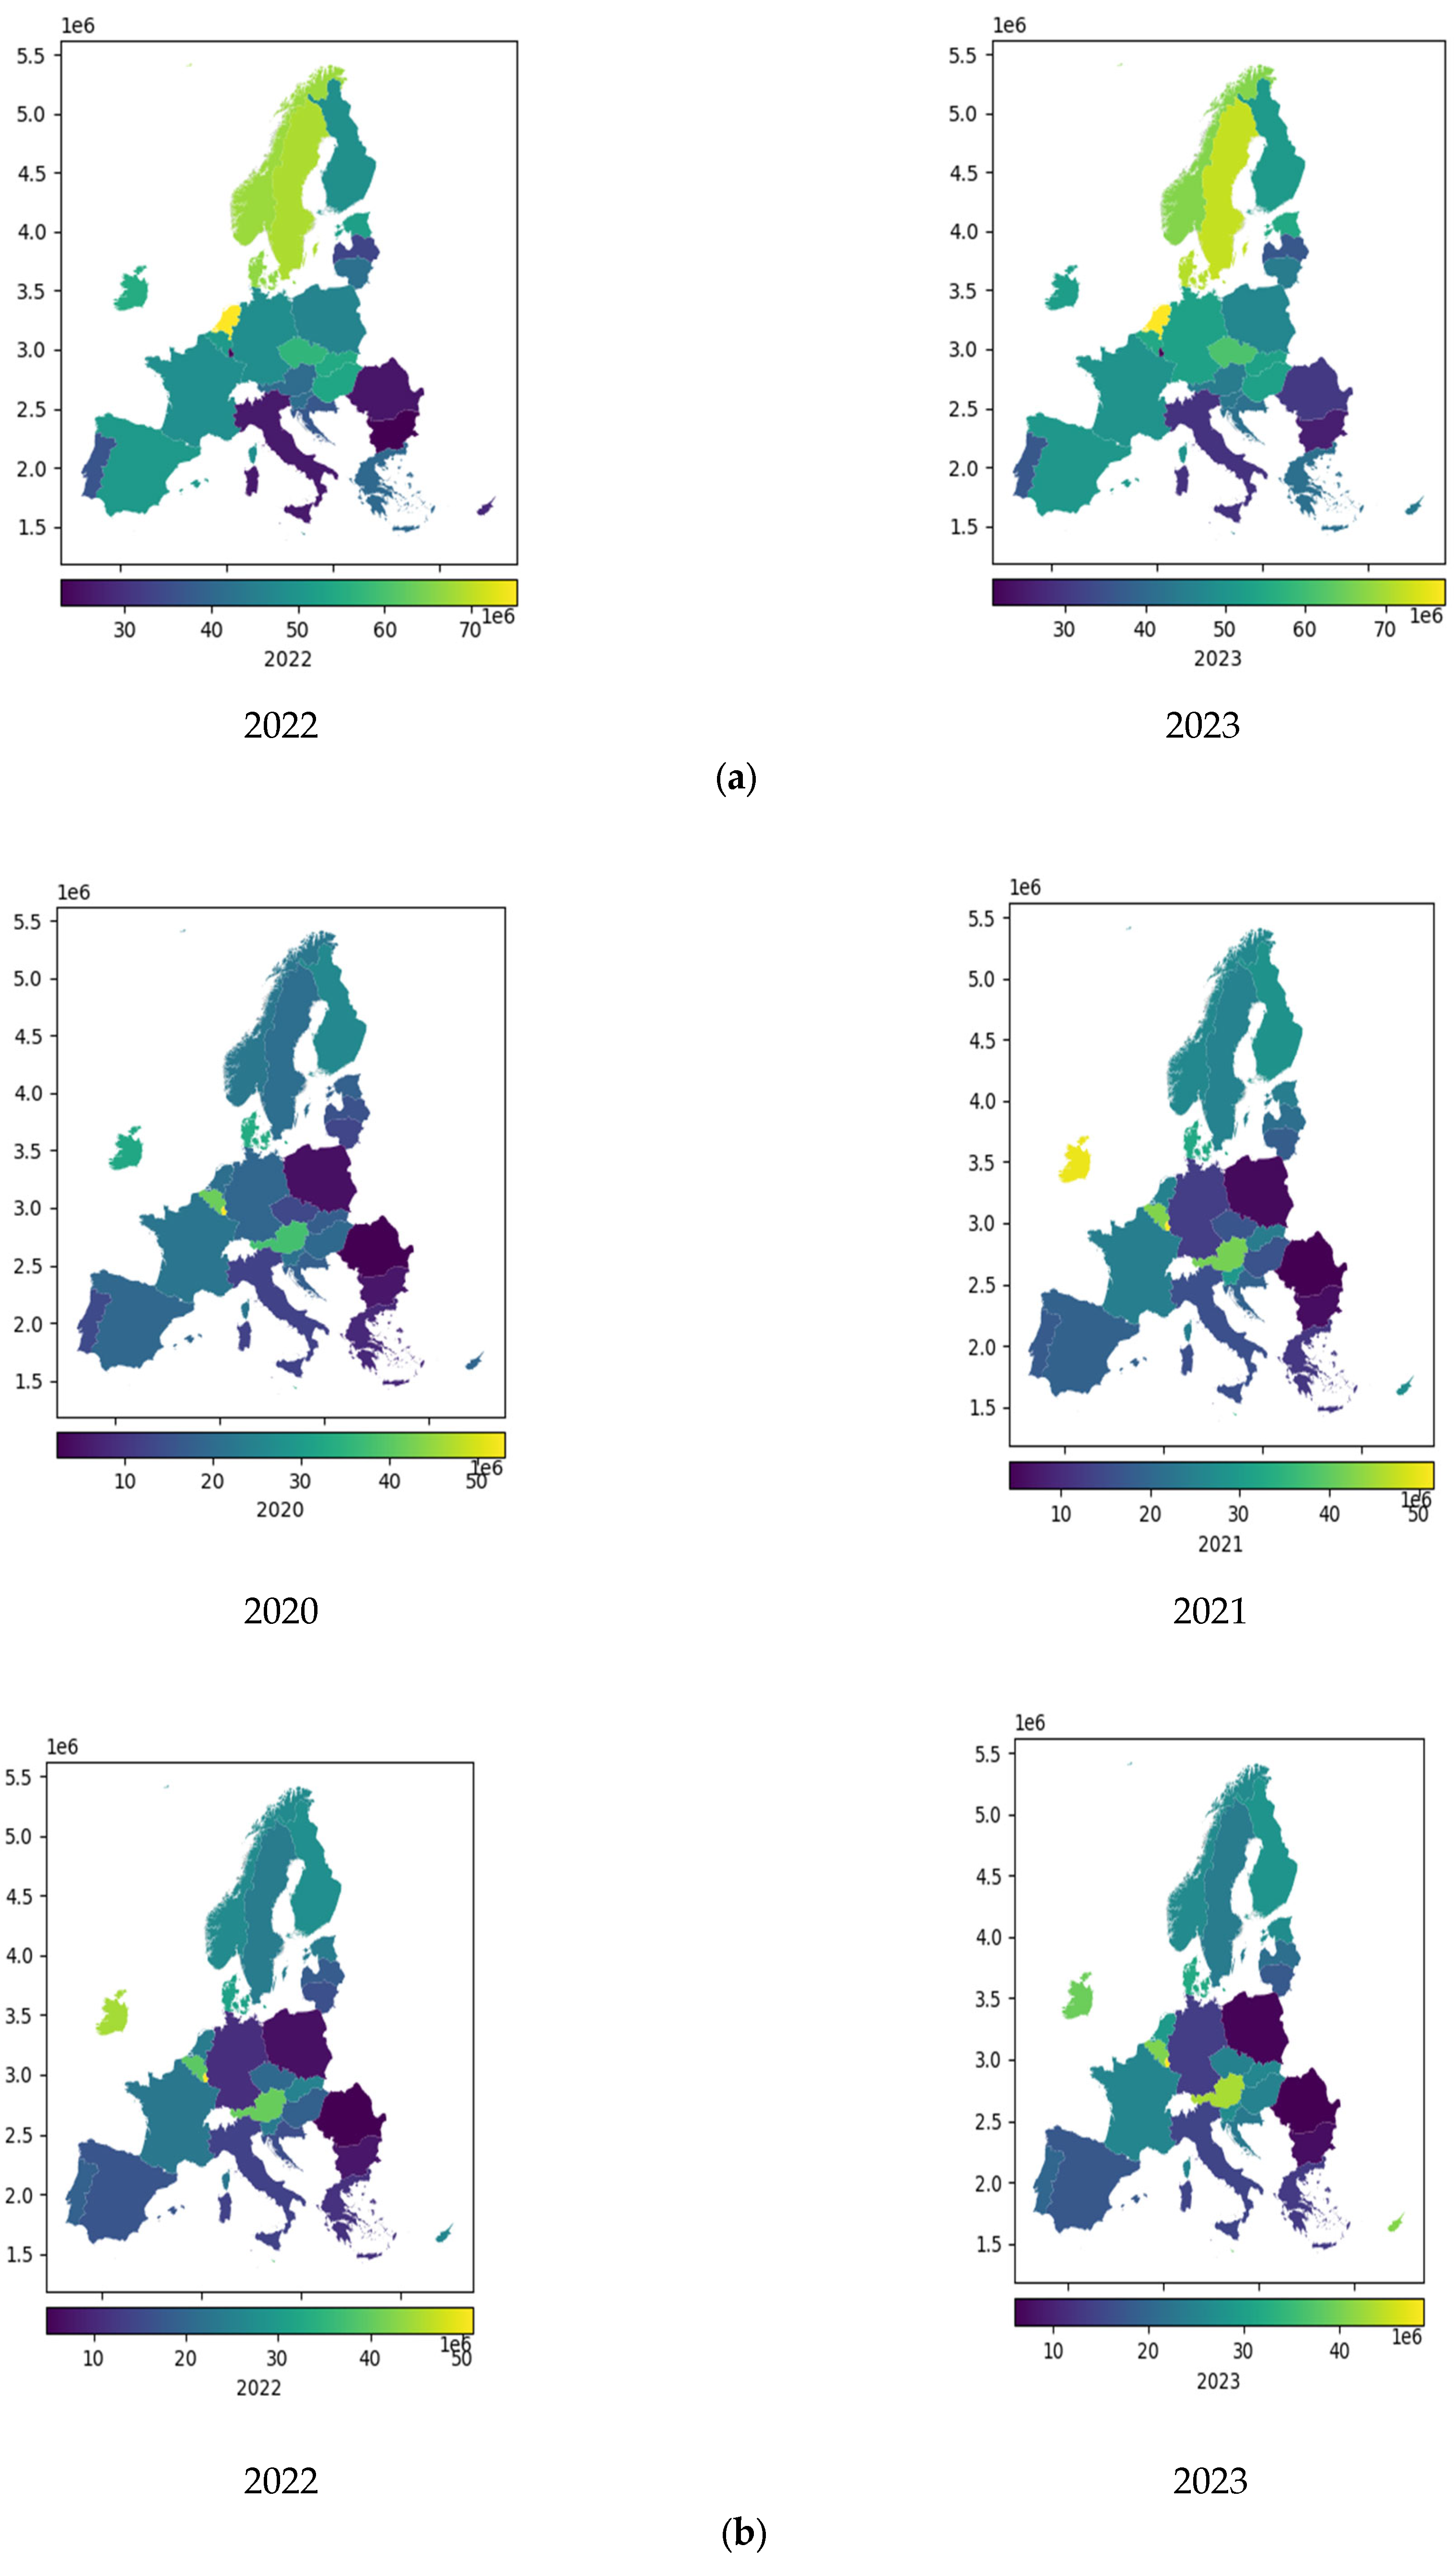
4.3. Spatial Autocorrelation Analysis of Online Purchases by Seller Origin
5. Results
5.1. Regression Analysis of Countries’ Differences in Online Purchases by Seller Origin
5.2. Feature Importance Selection and Regression Analysis for Electronic and Physical Online Goods and Services
5.3. Spatial Analysis of Local and Global Autocorrelation of Online Purchases
6. Discussion
7. Policy and Marketing Suggestions
8. Conclusions
9. Limitations
Funding
Informed Consent Statement
Data Availability Statement
Acknowledgments
Conflicts of Interest
Abbreviations
Appendix A

| Group/Indicator, Measure | Symbol | Mean | Std. Dev. | Min. | Max. |
|---|---|---|---|---|---|
| 1 Origin of sellers, % of individuals | |||||
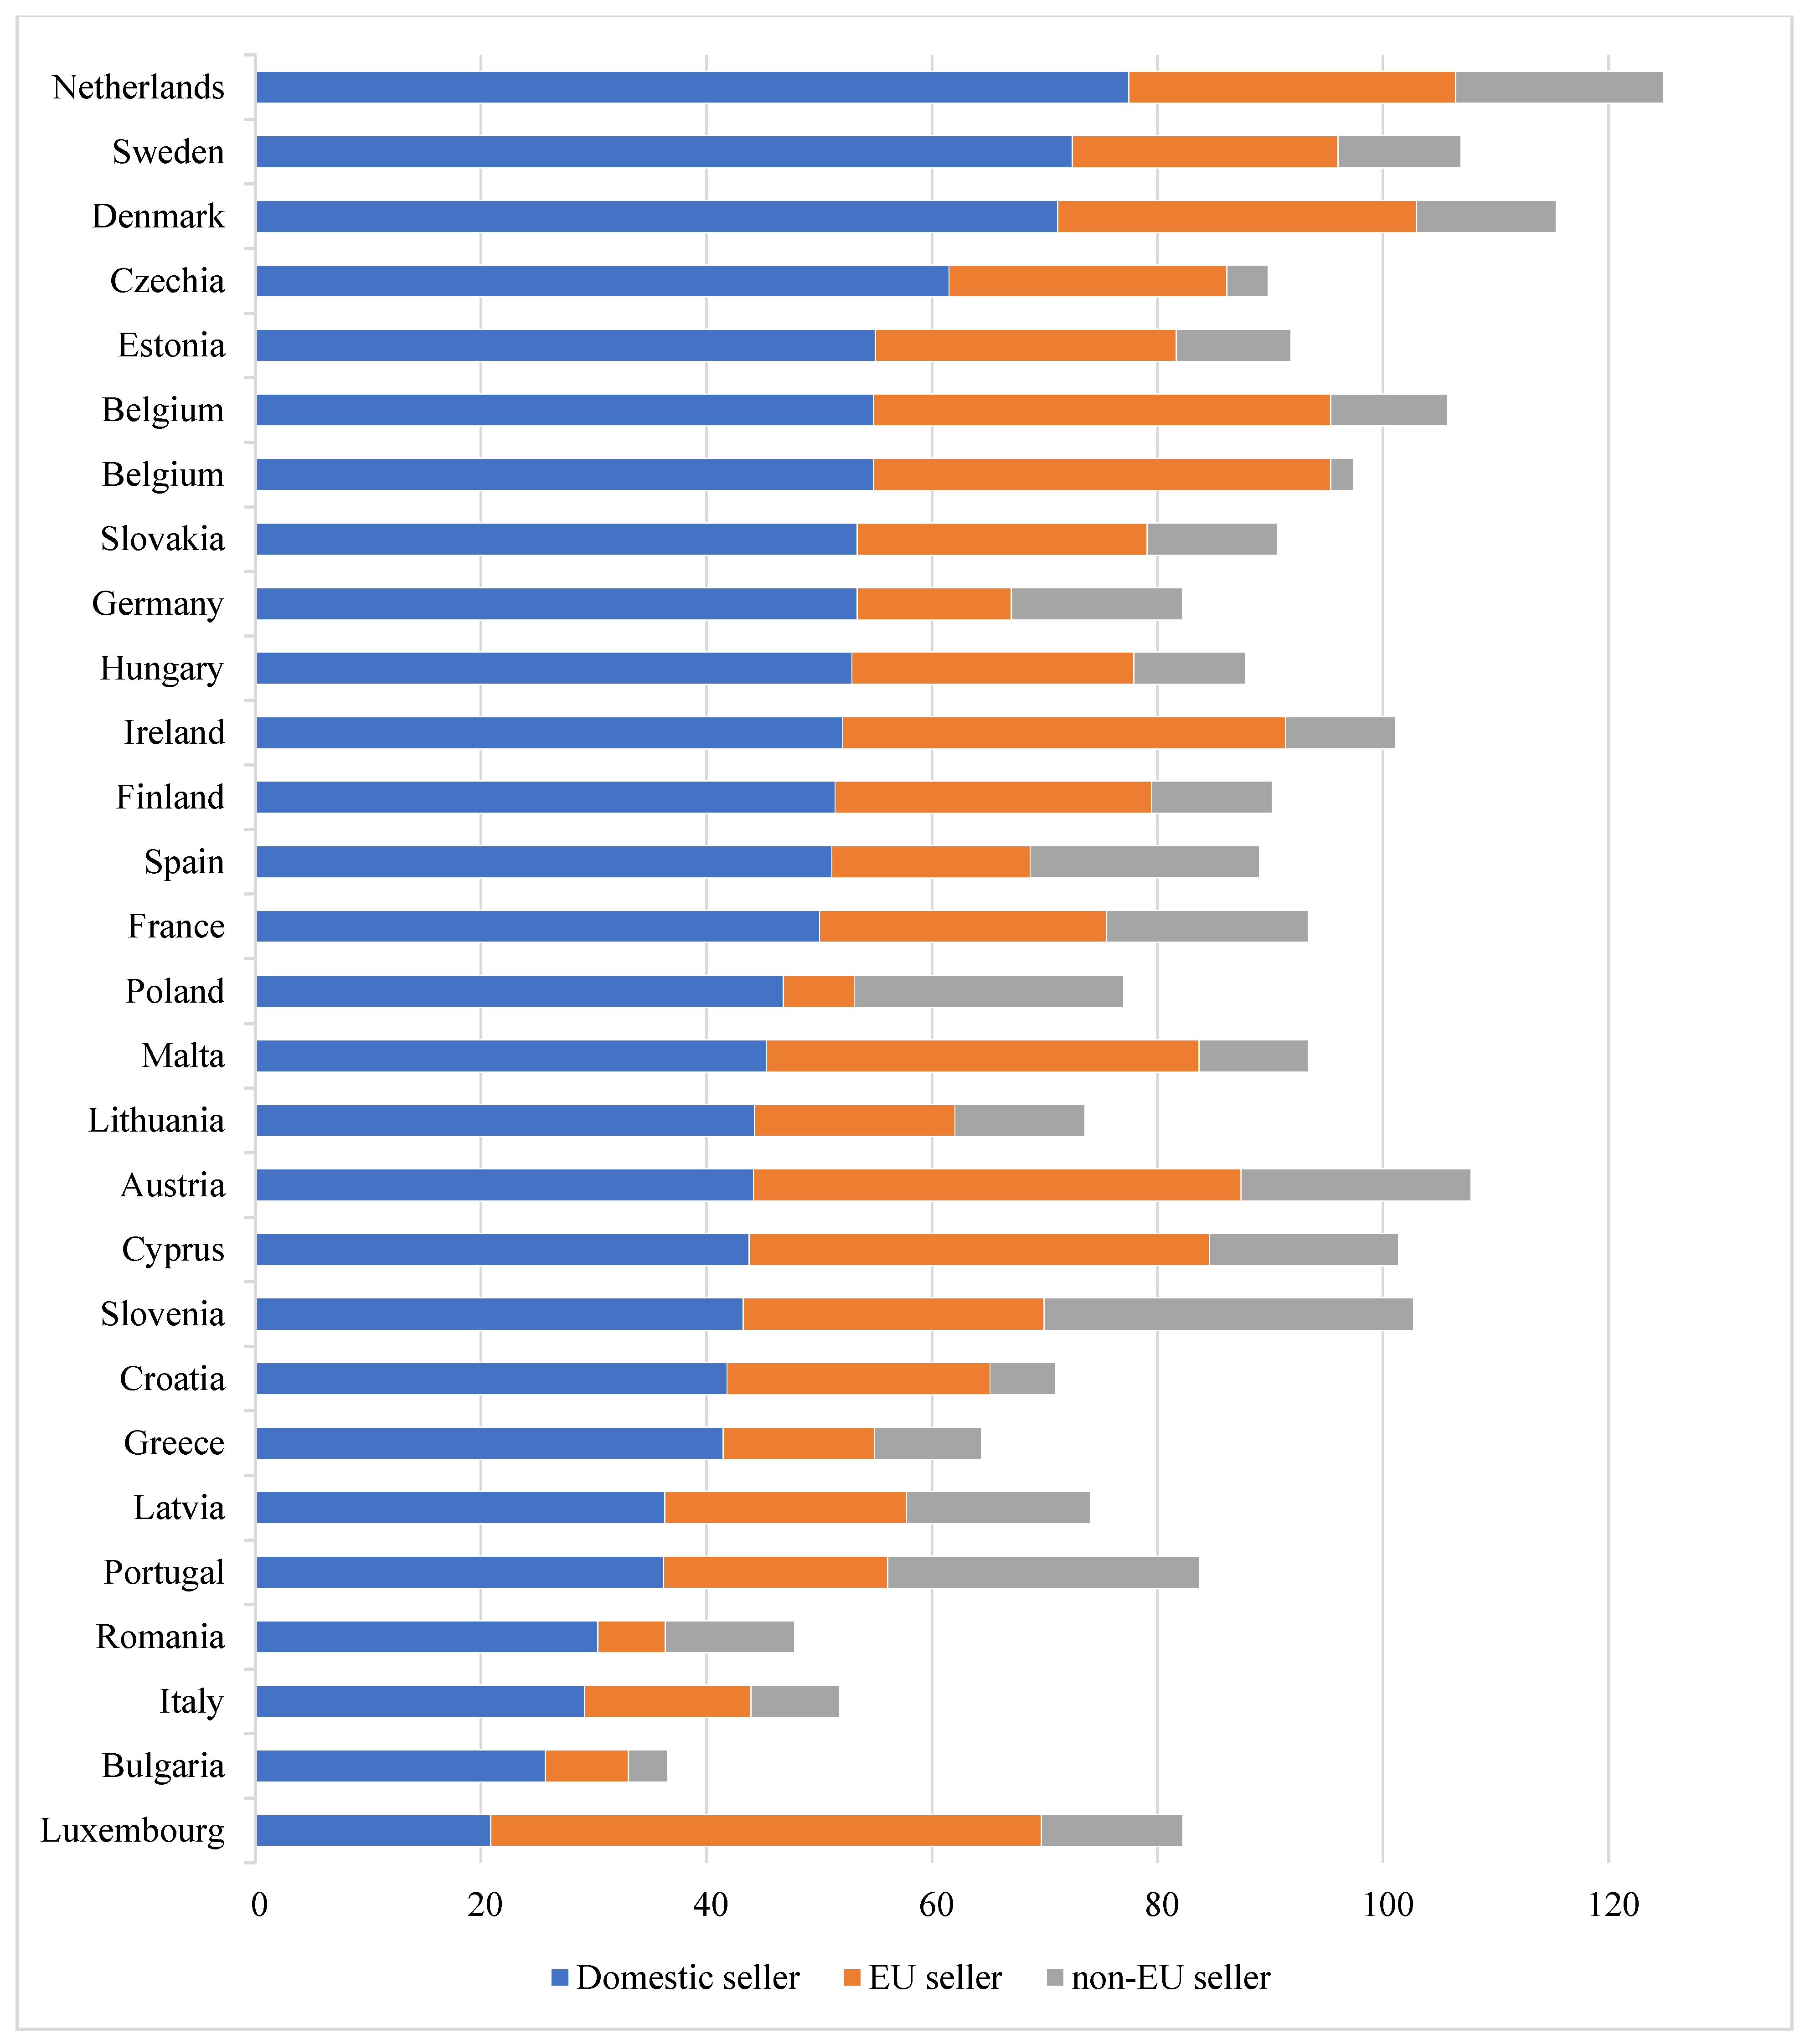
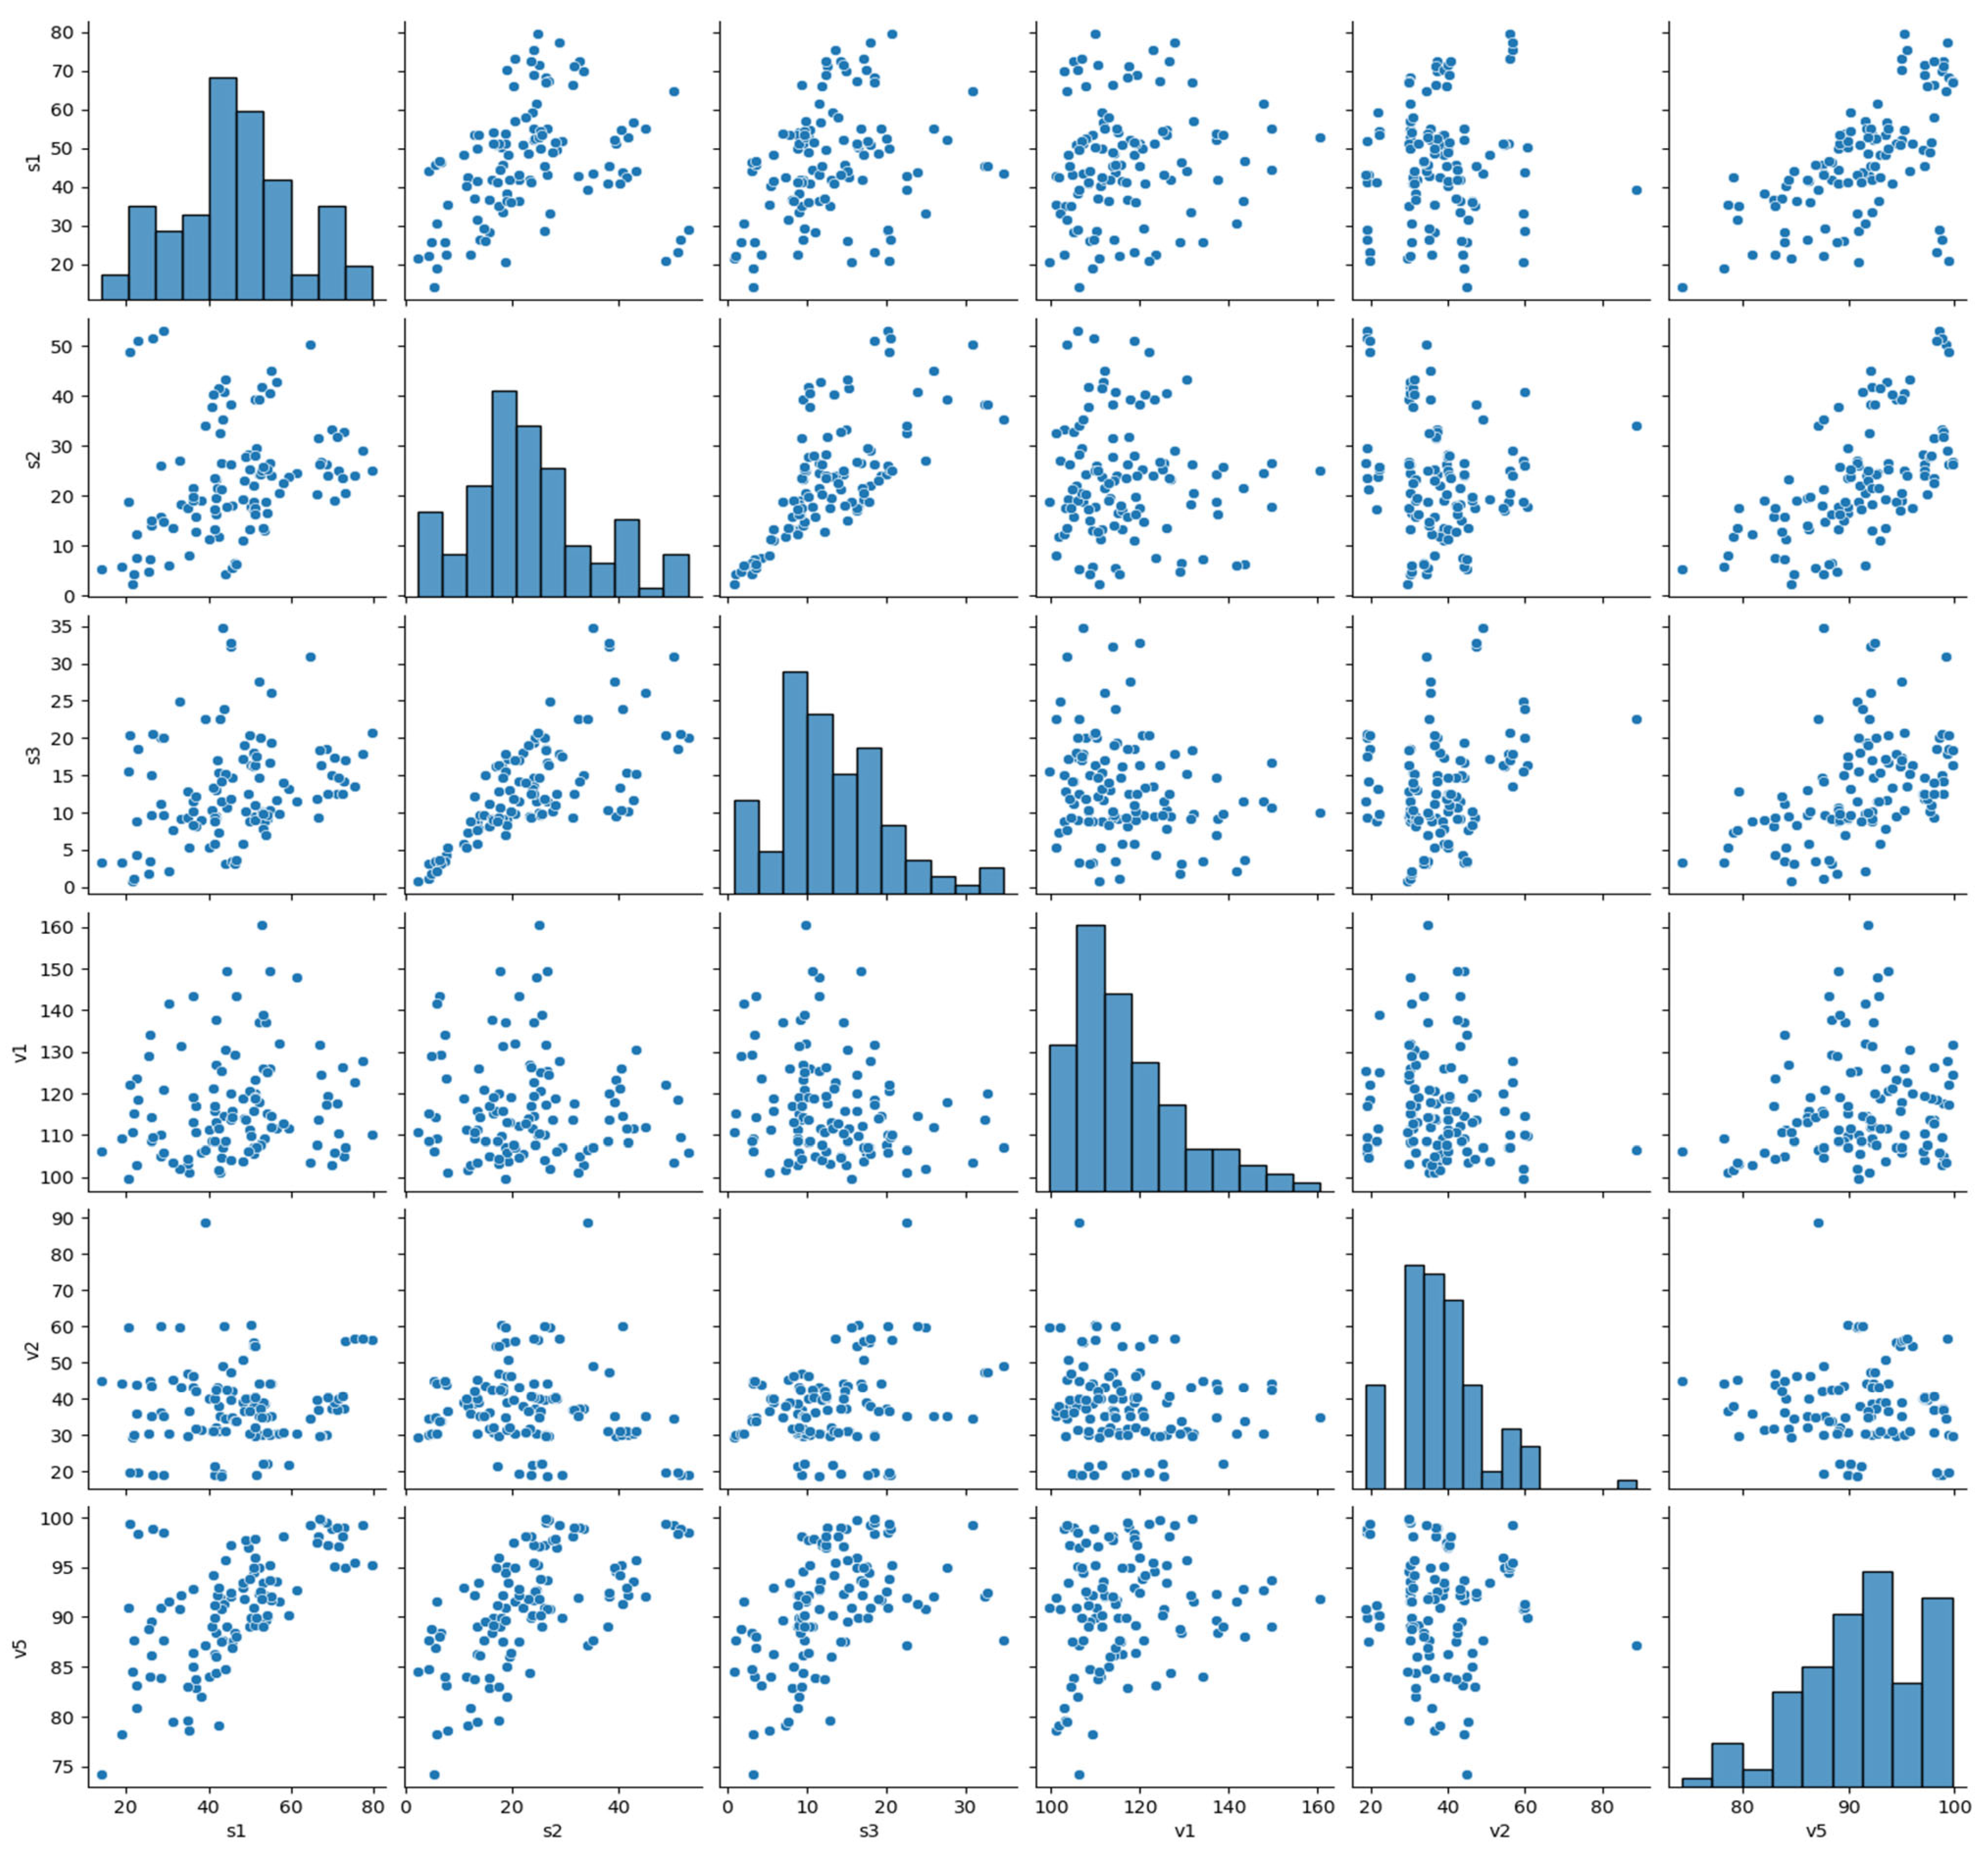
| Domestic seller | s1 | 46.39 | 14.60 | 14.04 | 79.57 |
| EU seller | s2 | 23.32 | 11.60 | 2.30 | 53.09 |
| Non–EU seller | s3 | 13.12 | 6.83 | 0.81 | 34.80 |
| 2 country online purchase indicators | |||||
| Harmonized indices of consumer price, % | v1 | 116.83 | 12.26 | 99.67 | 160.59 |
| Distribution of population by degree of urbanization (cities), % | v2 | 38.03 | 11.18 | 18.70 | 88.80 |
| Sole/multi official language(s), binary | v3 | – | – | – | – |
| Currency national/Euro, binary | v4 | – | – | – | – |
| Internet use, % of individuals | v5 | 91.02 | 5.59 | 74.27 | 99.81 |
| 3 Online purchases (3 months)—Physical goods and services, % of individuals | |||||
| Bicycles, mopeds, cars, or other vehicles or their spare parts | p1 | 5.52 | 3.14 | 0.53 | 12.86 |
| Printed books, magazines, or newspapers | p2 | 12.85 | 6.85 | 1.36 | 29.23 |
| Children toys or childcare items | p3 | 10.10 | 4.44 | 1.57 | 23.74 |
| Clothes (including sport clothing), shoes, or accessories | p4 | 36.88 | 11.44 | 11.75 | 64.68 |
| Computers, tablets, mobile phones, or accessories | p5 | 12.99 | 5.10 | 2.35 | 26.78 |
| Cosmetics, beauty, or wellness products | p6 | 15.83 | 6.45 | 3.24 | 32.17 |
| Consumer electronics or household appliances | p7 | 11.38 | 5.42 | 1.39 | 25.34 |
| Furniture, home accessories, or gardening products | p8 | 14.72 | 7.57 | 1.46 | 35.98 |
| Medicine or dietary supplements such as vitamins (online renewal of prescriptions is not included) | p9 | 12.08 | 7.21 | 1.68 | 38.96 |
| Sports goods (excluding sport clothing) | p10 | 13.13 | 6.05 | 3.07 | 31.06 |
| 4 Online purchases (3 months)—Electronic goods and services, % of individuals | |||||
| Other apps (e.g., related to learning languages, traveling, weather) (excluding free apps) | e1 | 4.21 | 3.24 | 0.05 | 14.15 |
| Films or series as a streaming service or downloads | e2 | 19.95 | 14.45 | 1.14 | 58.35 |
| Tickets to cultural or other events | e3 | 14.78 | 11.12 | 0.26 | 46.78 |
| Computer or other software as downloads including upgrades | e4 | 8.83 | 5.87 | 0.70 | 21.77 |
| Games online or as downloads for smartphones, tablets, computers, or consoles | e5 | 9.41 | 6.11 | 0.78 | 26.17 |
| Apps related to health or fitness (excluding free apps) | e6 | 4.15 | 3.28 | 0.08 | 13.53 |
| Tickets to sport events | e7 | 4.19 | 3.29 | 0.20 | 16.29 |
| E-books, online magazines, or online newspapers | e8 | 8.55 | 7.45 | 0.62 | 34.33 |
| Music as a streaming service or downloads | e9 | 20.05 | 14.57 | 1.14 | 58.35 |
| Subscriptions to the internet or mobile phone connections | e10 | 11.38 | 8.96 | 1.36 | 48.78 |


References
- OECD. Going Digital Toolkit, Based on the Eurostat Digital Economy and Society Statistics Comprehensive Database. 2020. Available online: https://goingdigital.oecd.org/en/indicator/72 (accessed on 30 April 2024).
- European E-Commerce Report. 2023. Available online: https://www.eurocommerce.eu/european-e-commerce-report/ (accessed on 30 April 2024).
- Directive on Electronic Commerce. Directive 2000/31/EC of the European Parliament and of the Council of 8 June 2000 on Certain Legal Aspects of Information Society Services, in Particular Electronic Commerce, in the Internal Market. 2000. Available online: https://eur-lex.europa.eu/legal-content/EN/TXT/?uri=CELEX%3A32000L0031 (accessed on 30 April 2024).
- Digital Single Market Strategy for Europe. Communication from the Commission to the European Parliament, the Council, the European Economic and Social Committee and the Committee of the Regions. 2015. Available online: https://eur-lex.europa.eu/legal-content/EN/TXT/?uri=CELEX%3A52015DC0192 (accessed on 30 April 2024).
- Digital Services Act. Regulation (EU) 2022/2065 of the European Parliament and of the Council of 19 October 2022 on a Single Market for Digital Services and Amending Directive 2000/31/EC. 2022. Available online: https://eur-lex.europa.eu/legal-content/EN/TXT/?uri=celex%3A32022R2065 (accessed on 30 April 2024).
- Digital Markets Act. Regulation (EU) 2022/1925 of the European Parliament and of the Council of 14 September 2022 on Contestable and Fair Markets in the Digital Sector and Amending Directives (EU) 2019/1937 and (EU) 2020/1828. 2022. Available online: https://eur-lex.europa.eu/legal-content/EN/TXT/?uri=CELEX%3A32022R1925&qid=1691500364531 (accessed on 30 April 2024).
- Sleuwaegen, L.; Smith, P.M. Who purchases cross-border? Individual and country level determinants of the decision to purchase cross-border in the European Single Market. Electron. Commer. Res. 2022, 22, 749–785. [Google Scholar] [CrossRef]
- Cho, H.; Lee, J. Searching for Logistics and Regulatory Determinants Affecting Overseas Direct Purchase: An Empirical Cross-National Study. Asian J. Shipp. Logist. 2017, 33, 11–18. [Google Scholar] [CrossRef]
- Kim, T.Y.; Dekker, R.; Heij, C. Cross-border electronic commerce: Distance effects and express delivery in European Union Markets. Int. J. Electron. Commer. 2017, 21, 184–218. [Google Scholar] [CrossRef]
- Gomez-Herrera, E.; Martens, B.; Turlea, G. The drivers and impediments for cross-border e-commerce in the EU. Inform. Econ. Pol. 2014, 28, 23–96. [Google Scholar] [CrossRef]
- Shen, Y. Price and advertising competition in an online marketplace: The tradeoff between quality and cost. Electron. Commer. Res. Appl. 2023, 60, 101276. [Google Scholar] [CrossRef]
- Ni, Y.; Qin, Z.; Lv, S. Does COO really matter in value Co-creation of cross-border E-commerce? In Proceedings of the International Conference on Electronic Business (ICEB), Hong Kong, China, 5–8 December 2020; pp. 81–91. Available online: https://iceb.johogo.com/proceedings/2020/ICEB_2020_paper_07_full.pdf (accessed on 22 June 2024).
- Zheng, Z.; Srikant, R. A Game-Theoretic Model for Product Placement in Online Platform Markets. IFAC PaperOnLine 2019, 52, 259–261. [Google Scholar] [CrossRef]
- Malalgoda, N.; Lim, S.H. Online shopping, brick-and-mortar retailers and transit ridership in the U.S. Res. Transport. Econ. 2023, 102, 101358. [Google Scholar] [CrossRef]
- Mengqi, L.; Guo, L.; Huamin, W.; Xiaochuan, L. Does free brand spillover benefit online retailers? Roles of logistics service selection. Transp. Res. Part E Logist. Transp. Rev. 2023, 178, 103270. [Google Scholar] [CrossRef]
- Richard, M.O.; Habibi, M.R. Advanced modeling of online consumer behavior: The moderating roles of hedonism and culture. J. Bus. Res. 2016, 69, 1103–1119. [Google Scholar] [CrossRef]
- Wang, Z.; Huang, X. Understanding the role of digital finance in facilitating consumer online purchases: An empirical investigation. Finance Res. Lett. 2023, 55, 103939. [Google Scholar] [CrossRef]
- Martikainen, E.; Schmiedel, H.; Takalo, T. Convergence of European retail payments. J. Bank. Finance 2015, 50, 81–91. [Google Scholar] [CrossRef]
- Grishchenko, N. The inverted digital divide during COVID-19 pandemic? Evidence from a panel of EU countries. Telemat. Inform. 2022, 72, 101856. [Google Scholar] [CrossRef]
- Mahmood, M.; Hina Batool, S.; Rafiq, M.; Safdar, M. Examining digital information literacy as a determinant of women’s online shopping behavior. Inf. Technol. People 2022, 35, 2098–2114. [Google Scholar] [CrossRef]
- Ariansyah, K.; Sirait, E.R.E.; Suryanegara, M.; Nugroho, B.A. Drivers and barriers to e-commerce adoption in Indonesia: Individuals’ perspectives and the implications. Telecommun. Policy 2021, 45, 102219. [Google Scholar] [CrossRef]
- Lutz, S.U. The European digital single market strategy: Local indicators of spatial association 2011–2016. Telecommun. Policy 2019, 43, 393–410. [Google Scholar] [CrossRef]
- Kim, Y.; Srite, M.; Zhao, H. Trust antecedents in online reviews across national cultures. Decis. Support. Syst. 2023, 173, 113998. [Google Scholar] [CrossRef]
- Brand, B.M.; Reith, R. Cultural differences in the perception of credible online reviews—The influence of presentation format. Decis. Support Syst. 2022, 154, 113710. [Google Scholar] [CrossRef]
- Dos Santos, A.M.; Contreras, L.O.; Moreno, C.F.; Felicio, A.J. Should a family firm communicate their family identity and country of origin? A cross-cultural study from Chile and Spain. Int. J. Emerg. Mark. 2022, 17, 725–746. [Google Scholar] [CrossRef]
- Peña-García, N.; Gil-Saura, I.; Rodríguez-Orejuela, A.; Siqueira-Junior, J.R. Purchase intention and purchase behavior online: A cross-cultural approach. Heliyon 2020, 6, e04284. [Google Scholar] [CrossRef]
- Rosillo-Díaz, E.; Blanco-Encomienda, F.J.; Crespo-Almendros, E. A cross-cultural analysis of perceived product quality, perceived risk and purchase intention in e-commerce platforms. J. Enterprise Inform. Manag. 2020, 33, 139–160. [Google Scholar] [CrossRef]
- Hepple, S.J.; Dennison, J.A. The effects of national culture on social commerce and online fashion purchase intention. Mob. Commer. Concepts Methodol. Tools Appl. 2017, 2, 870–896. Available online: https://www.igi-global.com/chapter/the-effects-of-national-culture-on-social-commerce-and-online-fashion-purchase-intention/178834 (accessed on 22 June 2024).
- Shao, B.; Cheng, Z.; Wan, L.; Yue, J. The impact of cross border E-tailer’s return policy on consumer’s purchase intention. J. Retail. Consum. Serv. 2021, 59, 102367. [Google Scholar] [CrossRef]
- Imannuel, D.G.; Putri, K.R.; Furqan, M.; Kartono, R.; Sundjaja, A.M. Factor Influence Indonesian Customer Purchase Intention Towards Cross Border Seller in Indonesia E-Commerce Platform. In Proceedings of the 2021 3rd International Conference on Cybernetics and Intelligent System (ICORIS), Makassar, Indonesia, 25–26 October 2021. [Google Scholar] [CrossRef]
- Yim, S.T.; Son, J.C.; Lee, J. Spread of E-commerce, prices and inflation dynamics: Evidence from online price big data in Korea. J. Asian Econ. 2022, 80, 101475. [Google Scholar] [CrossRef]
- Dekimpe, M.G.; van Heerde, H.J. Retailing in times of soaring inflation: What we know, what we don’t know, and a research agenda. J. Retail. 2023, 99, 322–336. [Google Scholar] [CrossRef]
- Lu, C.-W.; Lin, G.-H.; Wu, T.-J.; Hu, I.-H.; Chang, Y.-C. Influencing Factors of Cross-Border E-Commerce Consumer Purchase Intention Based on Wireless Network and Machine Learning. Secur. Comm. Netw. 2021, 2021, 9984213. [Google Scholar] [CrossRef]
- Ayob, A.H. E-commerce adoption in ASEAN: Who and where? Future Bus. J. 2021, 7, 4. [Google Scholar] [CrossRef]
- Valarezo-Unda, A.; Garin-Muñoz, T.; Herguera, I.; Amaral, T.P. Drivers and barriers to cross-border e-commerce: Evidence from Spanich individual behavior. Telecommun. Policy 2018, 42, 464–473. [Google Scholar] [CrossRef]
- Nasri, W. Determinants of Consumer Online Purchasing Intention: An Empirical Study in Tunisia. Int. J. Cyber Res. Educ. 2022, 4, 309689. [Google Scholar] [CrossRef]
- Bartol, J.; Vehovar, V.; Bosnjak, M.; Petrovčič, A. Privacy concerns and self-efficacy in e-commerce: Testing an extended APCO model in a prototypical EU country. Electron. Commerce Res. Appl. 2023, 60, 101289. [Google Scholar] [CrossRef]
- Azami, S. Factors Affecting Customers’ Purchasing Behavior in Online Shopping. SSRN Electron. J. 2019, 1–22. [Google Scholar] [CrossRef]
- Huang, W.-L.; Hu, P.; Tsai, S.; Chen, X.-D. The business analysis on the home-bias of E-commerce consumer behavior. Electron. Commerce Res. 2021, 21, 855–879. [Google Scholar] [CrossRef]
- Blum, B.S.; Goldfarb, A. Does the internet defy the law of gravity? J. Int. Econ. 2006, 70, 384–405. [Google Scholar] [CrossRef]
- Hortaçsu, A.; Martínez-Jerez, F.A.; Douglas, J. The Geography of Trade in Online Transactions: Evidence from eBay and MercadoLibre. Am. Econ. J. Microecon. 2009, 1, 53–74. [Google Scholar] [CrossRef]
- Sadowski, A.; Lewandowska-Gwarda, K.; Pisarek-Bartoszewska, R.; Engelseth, P. A longitudinal study of e-commerce diversity in Europe. Electron. Commerce Res. 2021, 21, 169–194. [Google Scholar] [CrossRef]
- Eurostat. Individuals Using the Internet for Buying Goods or Srvices. 2024. Available online: https://ec.europa.eu/eurostat/databrowser/view/tin00096/default/table?lang=en&category=t_isoc.t_isoc_i.t_isoc_iec (accessed on 30 April 2024).
- Genuer, R.; Poggi, J.M.; Tuleau-Malot, C. Variable selection using random forests. Pattern Recogn. Lett. 2010, 31, 2225–2236. [Google Scholar] [CrossRef]
- Moran, P. The interpretation of statistical maps. J. Roy. Stat. Soc. B Stat. Met. 1948, 10, 243–251. [Google Scholar] [CrossRef]
- Anselin, L. Local Indicators of Spatial Association—LISA. Geogr. Anal. 1995, 27, 93–115. Available online: https://geodacenter.github.io/workbook/6a_local_auto/lab6a.html#ref-Anselin:95 (accessed on 22 June 2024). [CrossRef]
- Measuring the Value of E-commerce. United Nations. UN Trade and Development. Geneva. 2023. Available online: https://unctad.org/publication/measuring-value-e-commerce (accessed on 22 June 2024).
- Vidal, M.M.; Castellano-Tejedor, C.C. Identification of marketing strategies influencing consumers’ perception of healthy food products and triggering purchasing decisions. Businesses 2022, 2, 410–422. [Google Scholar] [CrossRef]
- Sulova, S. A conceptual framework for the technological advancement of e-commerce applications. Businesses 2023, 3, 220–230. [Google Scholar] [CrossRef]
| Author(s) | Objectives of the Study | Country/Data | Cross-Border/Domestic Online Purchases |
|---|---|---|---|
| Sleuwaegen and Smith, 2022 [7] | To investigate how personal and country-specific environmental conditions affect the decision of individuals to make cross-border online purchases | 30 EEA countries (28 EU Member States plus Norway and Iceland) for 2006, 2008, 2010, 2011, 2012, and 2014 | Cross-border e-commerce |
| Cho and Lee, 2017 [8] | To identify logistics, regulatory, and globalization determinants of overseas direct purchases | 61 countries, 2012–2014 | Overseas direct purchases |
| Kim et al., 2017 [9] | To provide an empirical analysis of express delivery services in cross-border e-commerce | the Netherlands consumer electronics manufacturer services to 721 regions in Germany, Italy, Spain, Sweden, and the UK, 2013–2015 | Cross-border e-commerce |
| Gomez-Herrera et al., 2014 [10] | To investigate whether distance still matters for online trade in physical goods in a linguistically fragmented EU market | 27 EU Member States, 2011 | Online and offline purchases in bilateral trade |
| Present study | To assess the impact of country-of-seller on cross-border and domestic online purchases | 28 EU Member States and Norway, 2020–2023 | Cross-border, intra-EU, and domestic online purchases |
| Variables | Domestic Seller | Intra–EU Seller | Non–EU Seller |
|---|---|---|---|
| Price (v1) | −0.0159 (0.050) | 0.0560 (0.036) | −0.1006 (0.026) *** |
| Urbanization (v2) | −0.0252 (0.107) | −0.0510 (0.076) * | −0.2178 (0.055) *** |
| Currency (v3) | –8.01053 (1.369) *** | 11.8806 (0.972) *** | 4.1367 (0.699) *** |
| Language(s) (v4) | −13.7694 (2.828) *** | 2.7507 (2.007) | 3.5379 (1.444) ** |
| Internet use (v5) | 1.2199 (0.276) *** | 0.5950 (0.196) *** | 0.4961 (0.141) *** |
| Number of observations | 112 | 112 | 112 |
| Fixed effects country | Yes | ||
| Fixed effects year | Yes |
| Variables/Test | Domestic Seller | Intra–EU Seller | Non–EU Seller |
|---|---|---|---|
| Degree of urbanization (endogeneity) or Internet use (exogeneity) | 0.3290 (0.4404)/ 1.6539 (0.2072) *** | −0.0811 (0.0881)/ 2.0908 (0.2783) *** | 0.1986 (0.0561) ***/ 1.1468 (0.1774) *** |
| p–value Wu–Hausman test | 0.6418 | 0.000 | 0.000 |
| p–value Wooldridge test | 0.6409 | 0.000 | 0.000 |
| Origin of Seller/Type of Goods and Services in Online Retailing | Domestic Seller | Intra–EU Seller | Non–EU Seller |
|---|---|---|---|
| Physical online goods and services | p4 Clothes, shoes, or accessories p3 Children toys p2 Printed books, magazines, or newspapers | p2 Printed books, magazines, or newspapers p10 Sports goods p5 Computers, mobile phones, or accessories | p2 Printed books, magazines, or newspapers p5 Computers, mobile phones, or accessories p8 Furniture, home accessories, or gardening products |
| Coefficient (Standard. error) | 14.6926 *** (2.512) | 5.3205 * (2.717) | −1.0179 (1.959) |
| Electronic online goods and services | e8 E-books, online-magazines, or online-newspapers e4 Computer or other software as downloads e9 Music as a streaming service or downloads | e2 Other apps (e.g., related to learning languages, travelling, weather) e8 E-books, online-magazines, or online-newspapers e9 Music as a streaming service or downloads | e4 Computer or other software as downloads e5 Games online or as downloads e1 other apps (e.g., related to learning languages, travelling, weather) |
| Coefficient (Standard. error) | 43.9261 *** (2.495) | 16.9816 *** (1.429) | 4.1057 *** (1.222) |
| Number of observations | 112 | 112 | 112 |
| Fixed effects country | Yes | ||
| Fixed effects year | Yes |
| Origin of Seller/Year | 2020 | 2021 | 2022 | 2023 |
|---|---|---|---|---|
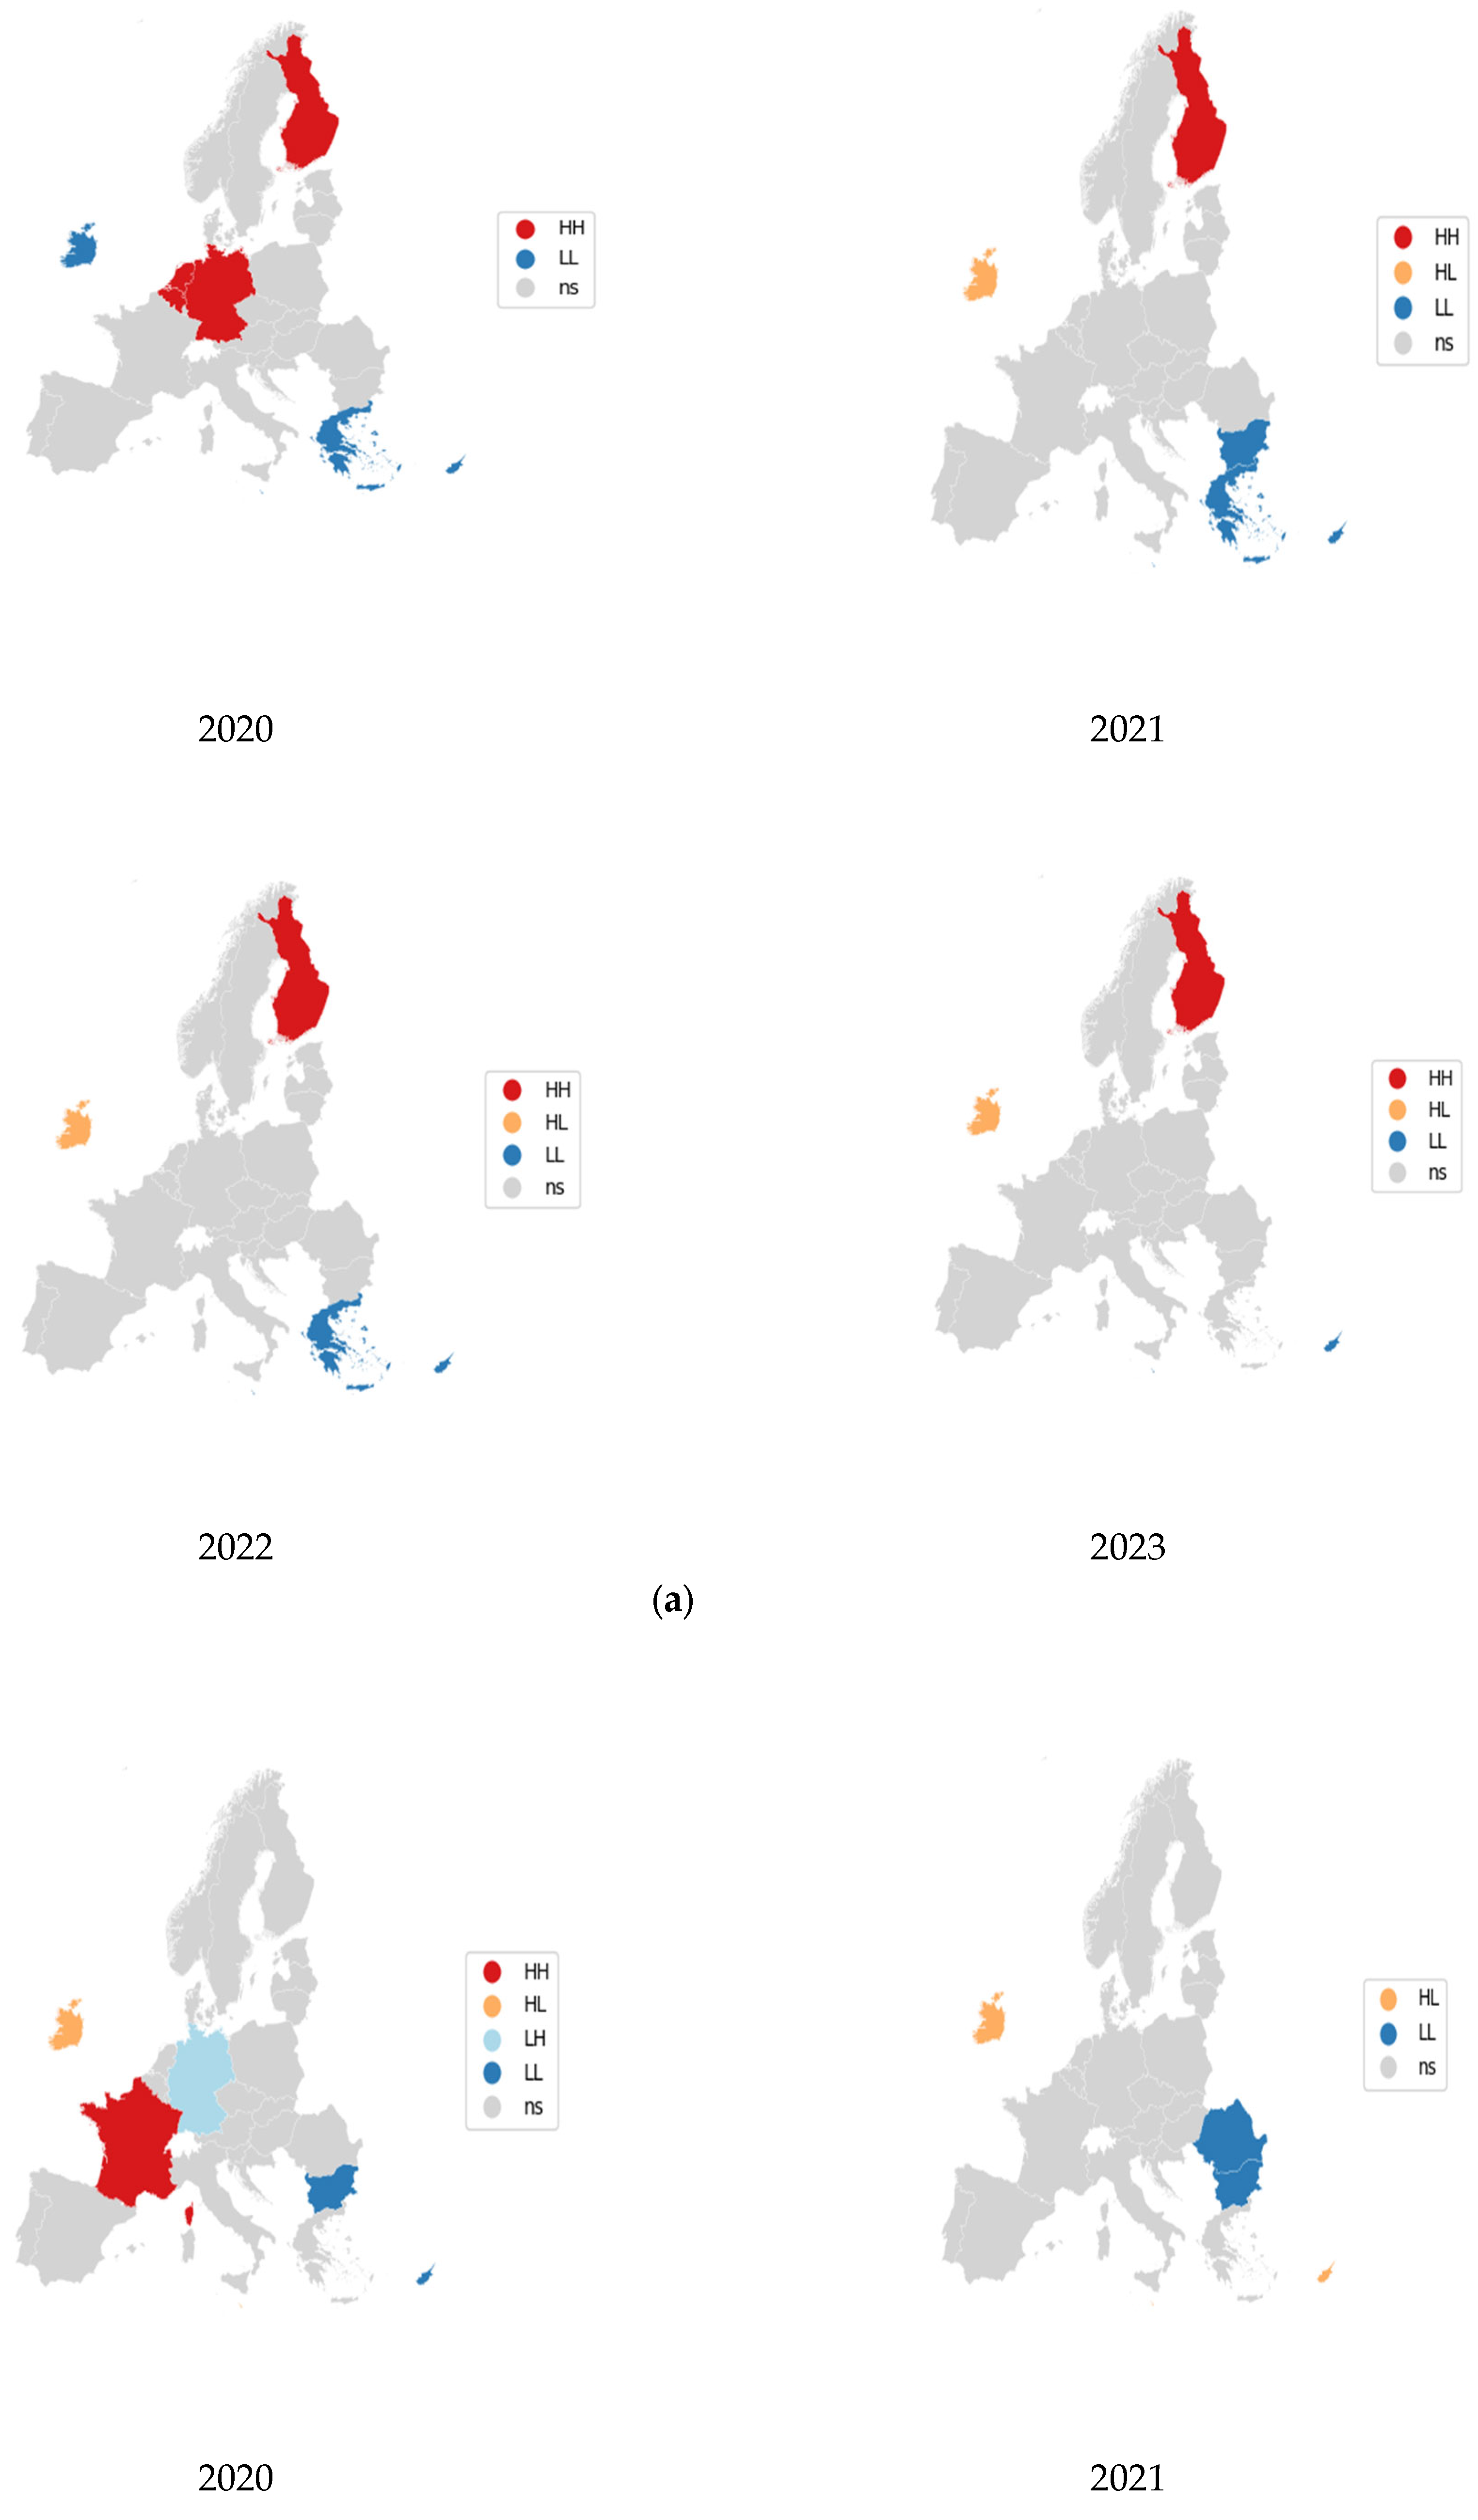
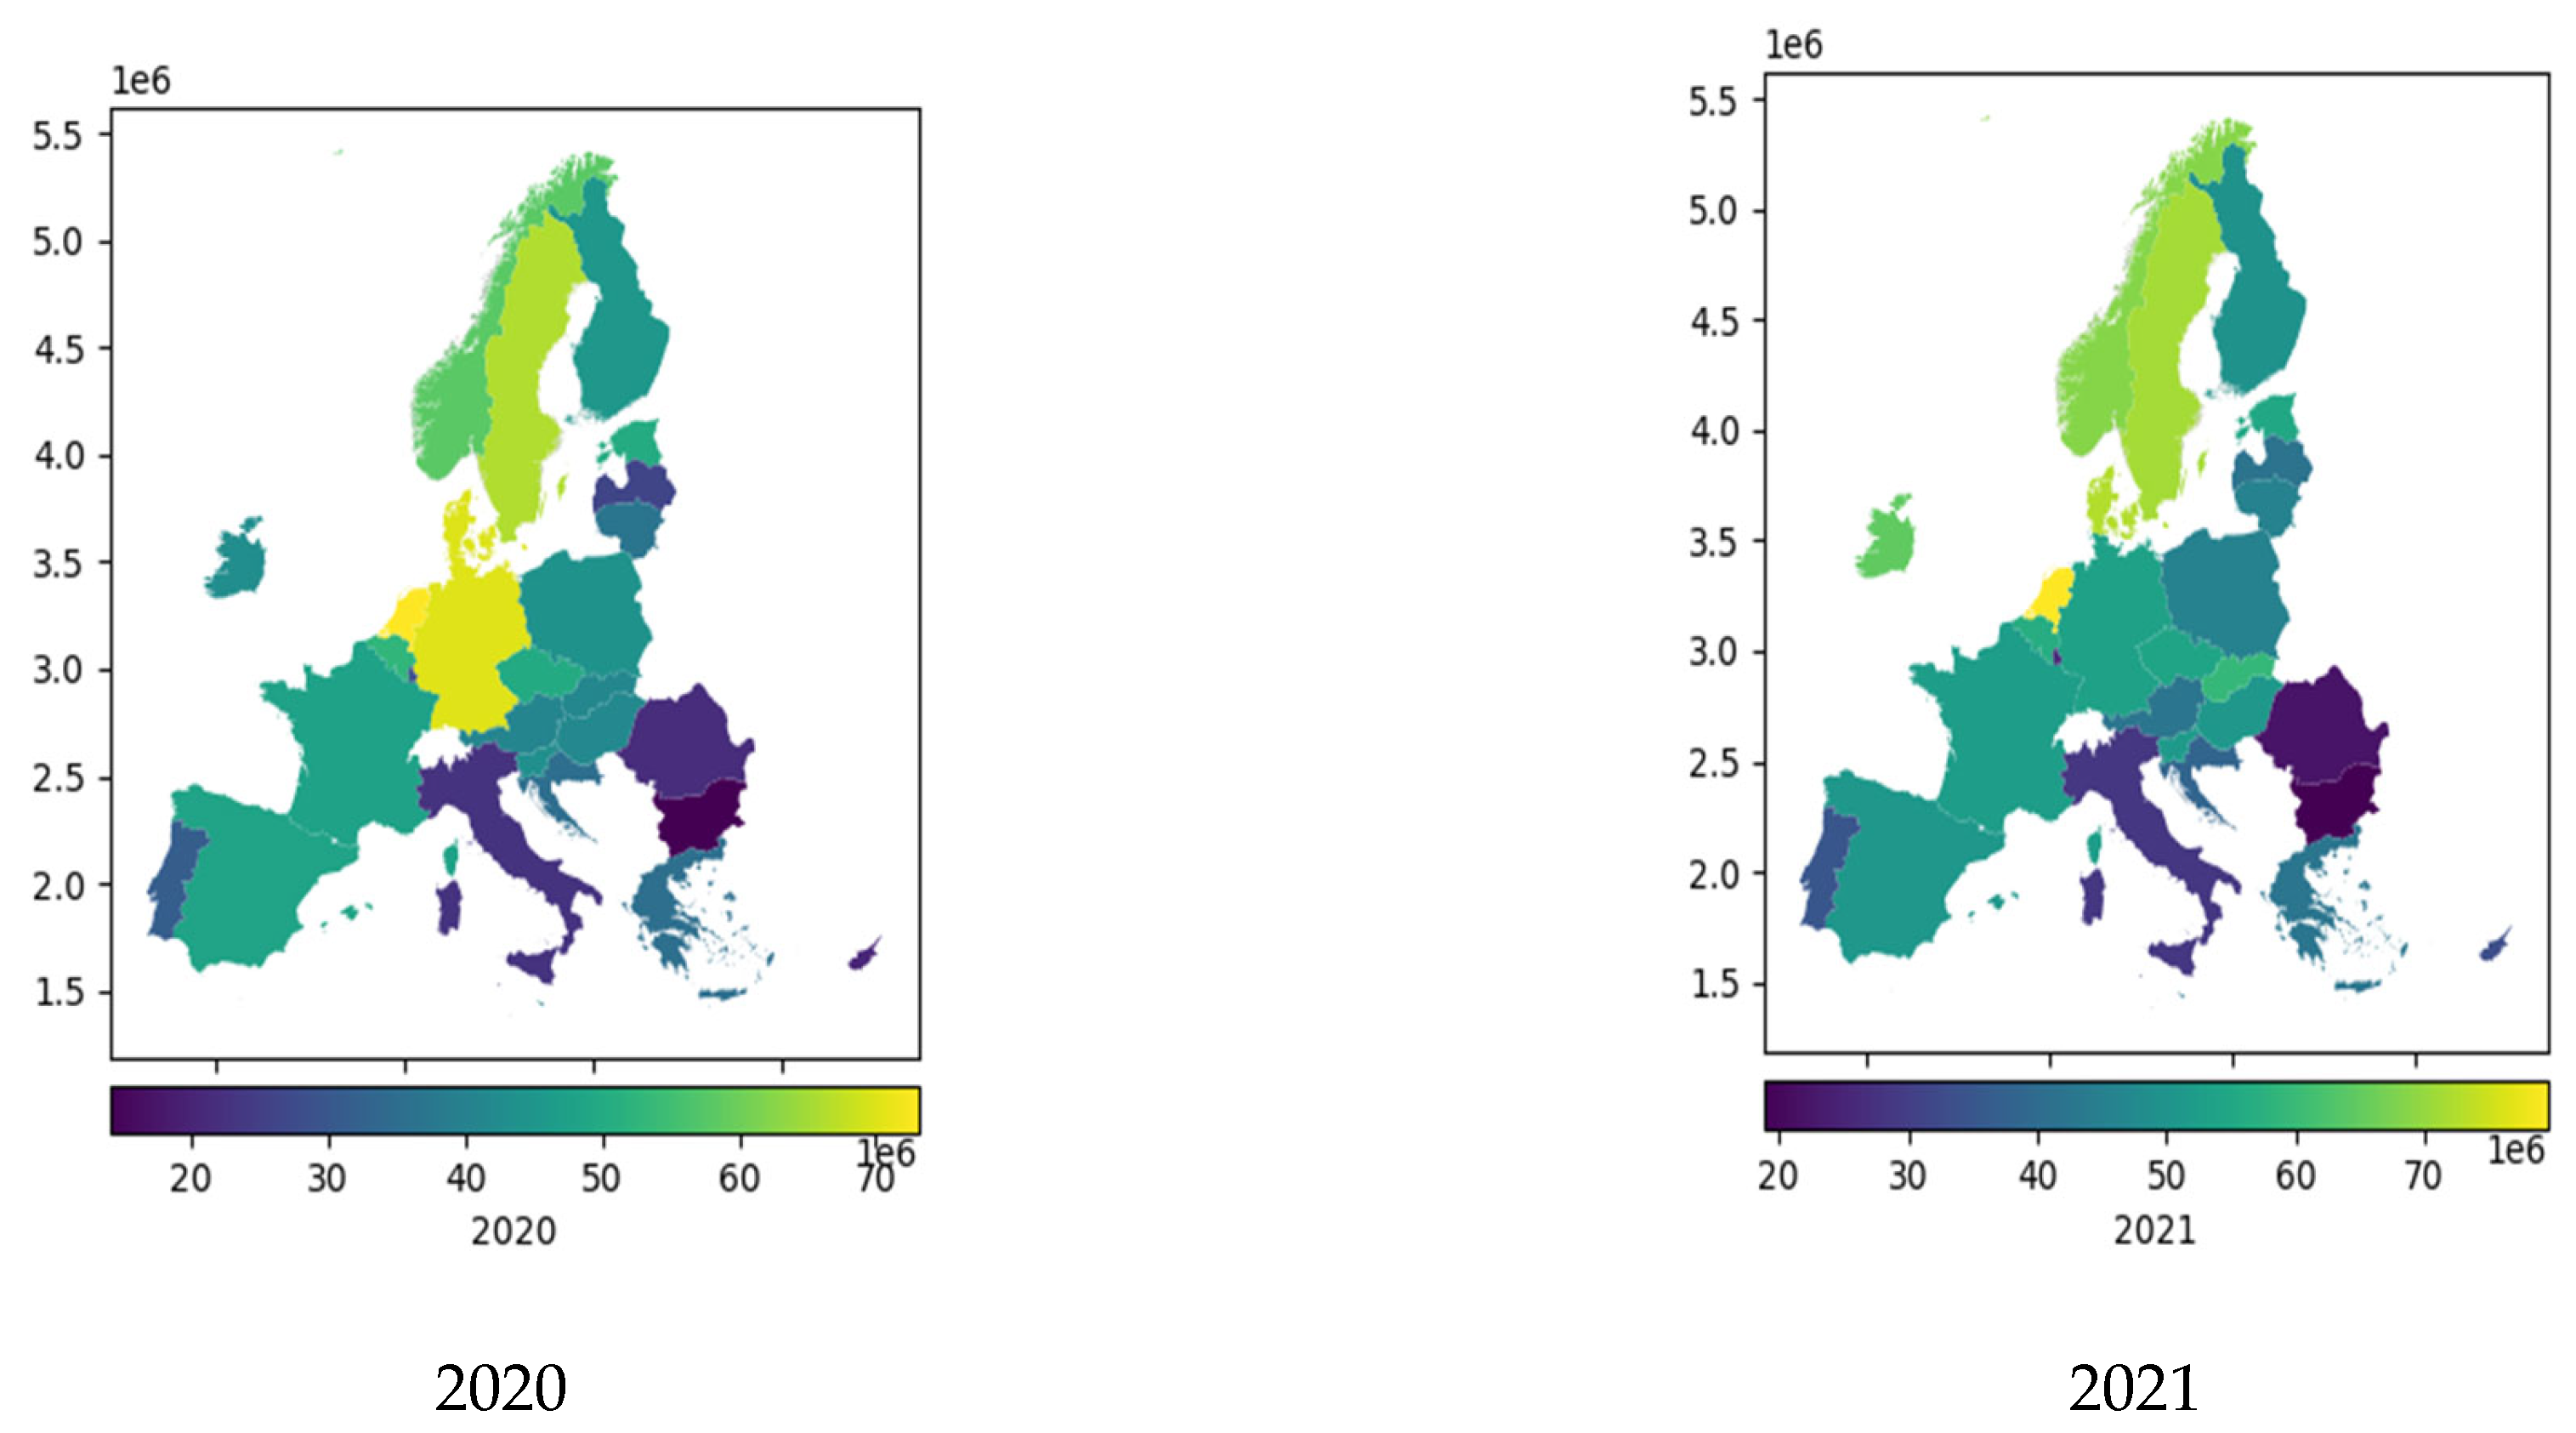
| Domestic seller | 0.4781 (0.002) | 0.2849 (0.044) | 0.2530 (0.053) | 0.2915 (0.034) |
| Intra–EU seller | 0.3400 (0.021) | 0.2483 (0.052) | 0.2060 (0.078) | 0.2385 (0.094) |
| Non–EU seller | 0.3544 (0.017) | 0.2359 (0.058) | 0.2125 (0.069) | 0.2138 (0.074) |
Disclaimer/Publisher’s Note: The statements, opinions and data contained in all publications are solely those of the individual author(s) and contributor(s) and not of MDPI and/or the editor(s). MDPI and/or the editor(s) disclaim responsibility for any injury to people or property resulting from any ideas, methods, instructions or products referred to in the content. |
© 2024 by the author. Licensee MDPI, Basel, Switzerland. This article is an open access article distributed under the terms and conditions of the Creative Commons Attribution (CC BY) license (https://creativecommons.org/licenses/by/4.0/).
Share and Cite
Grishchenko, N. E-Commerce Cross-Border and Domestic Dynamics: Decision Tree and Spatial Insights on Seller Origin Impact. Businesses 2024, 4, 270-298. https://doi.org/10.3390/businesses4030018
Grishchenko N. E-Commerce Cross-Border and Domestic Dynamics: Decision Tree and Spatial Insights on Seller Origin Impact. Businesses. 2024; 4(3):270-298. https://doi.org/10.3390/businesses4030018
Chicago/Turabian StyleGrishchenko, Natalia. 2024. "E-Commerce Cross-Border and Domestic Dynamics: Decision Tree and Spatial Insights on Seller Origin Impact" Businesses 4, no. 3: 270-298. https://doi.org/10.3390/businesses4030018
APA StyleGrishchenko, N. (2024). E-Commerce Cross-Border and Domestic Dynamics: Decision Tree and Spatial Insights on Seller Origin Impact. Businesses, 4(3), 270-298. https://doi.org/10.3390/businesses4030018