Comparison between Demand and Supply of Some Ecosystem Services in National Parks: A Spatial Analysis Conducted Using Italian Case Studies
Abstract
:1. Introduction
2. Materials and Methods
2.1. Case Studies
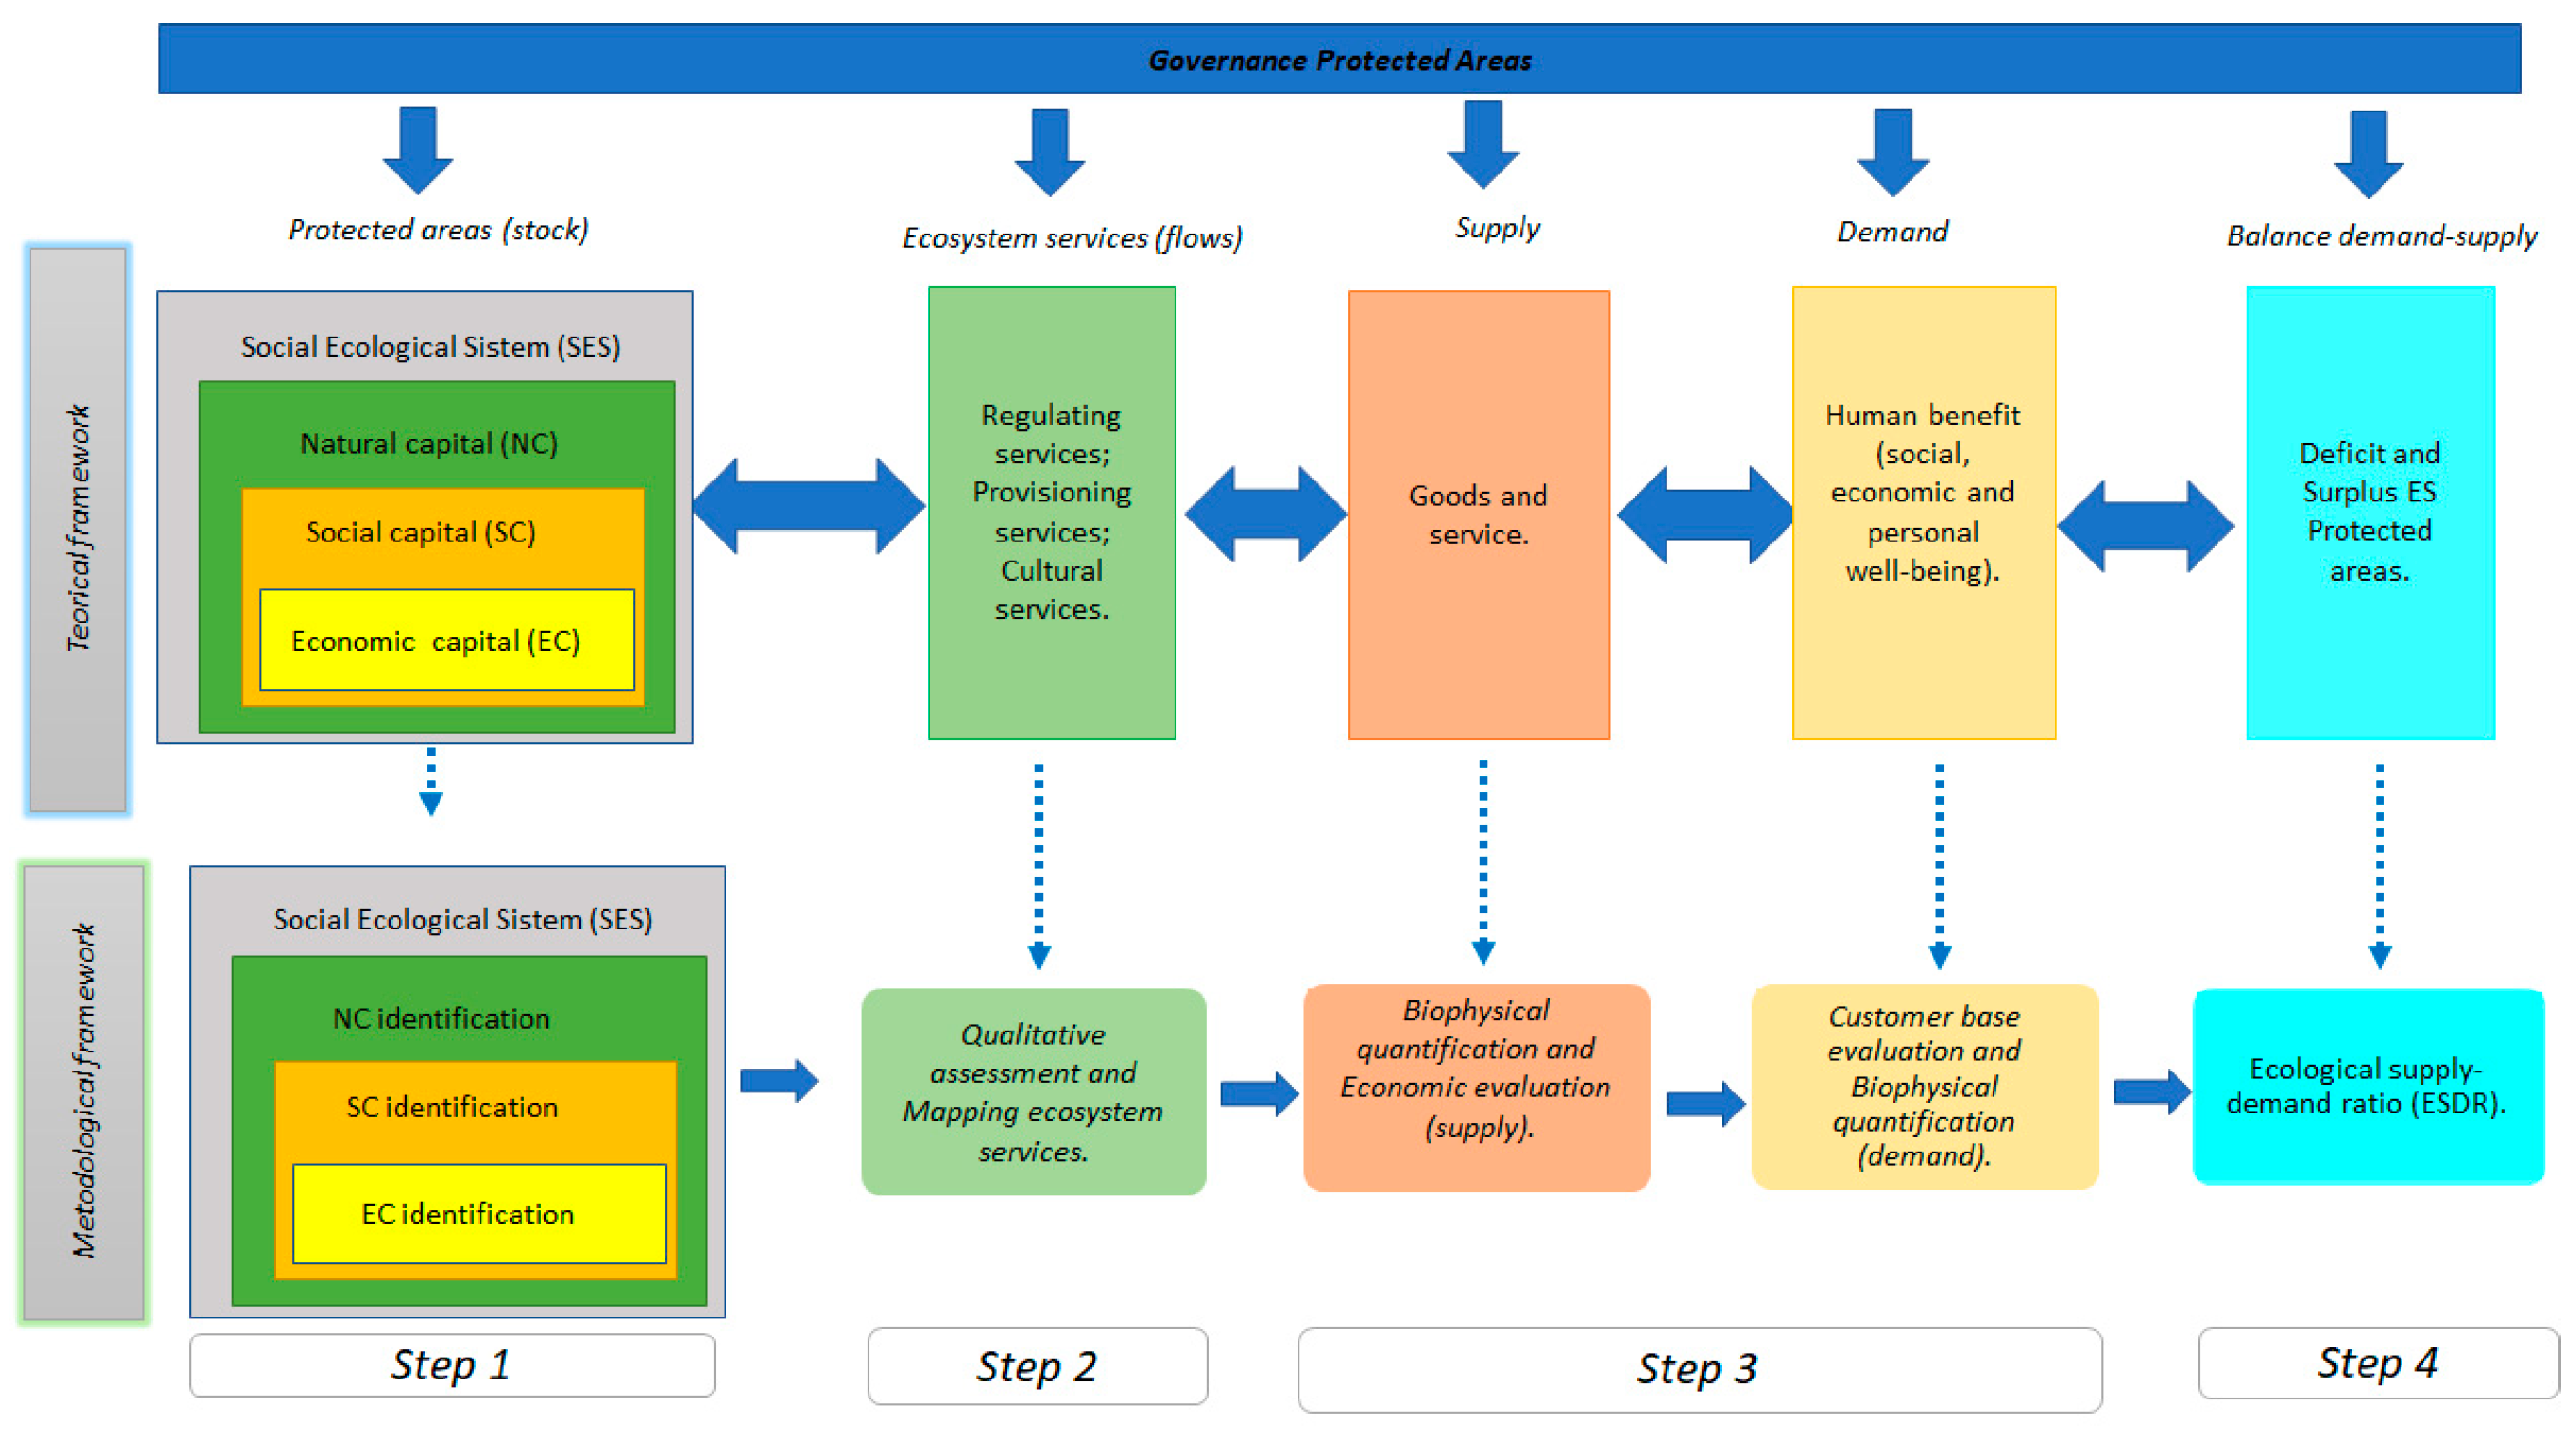
2.2. Theoretical and Methodological Framework
2.2.1. Step 1. Capital Identification
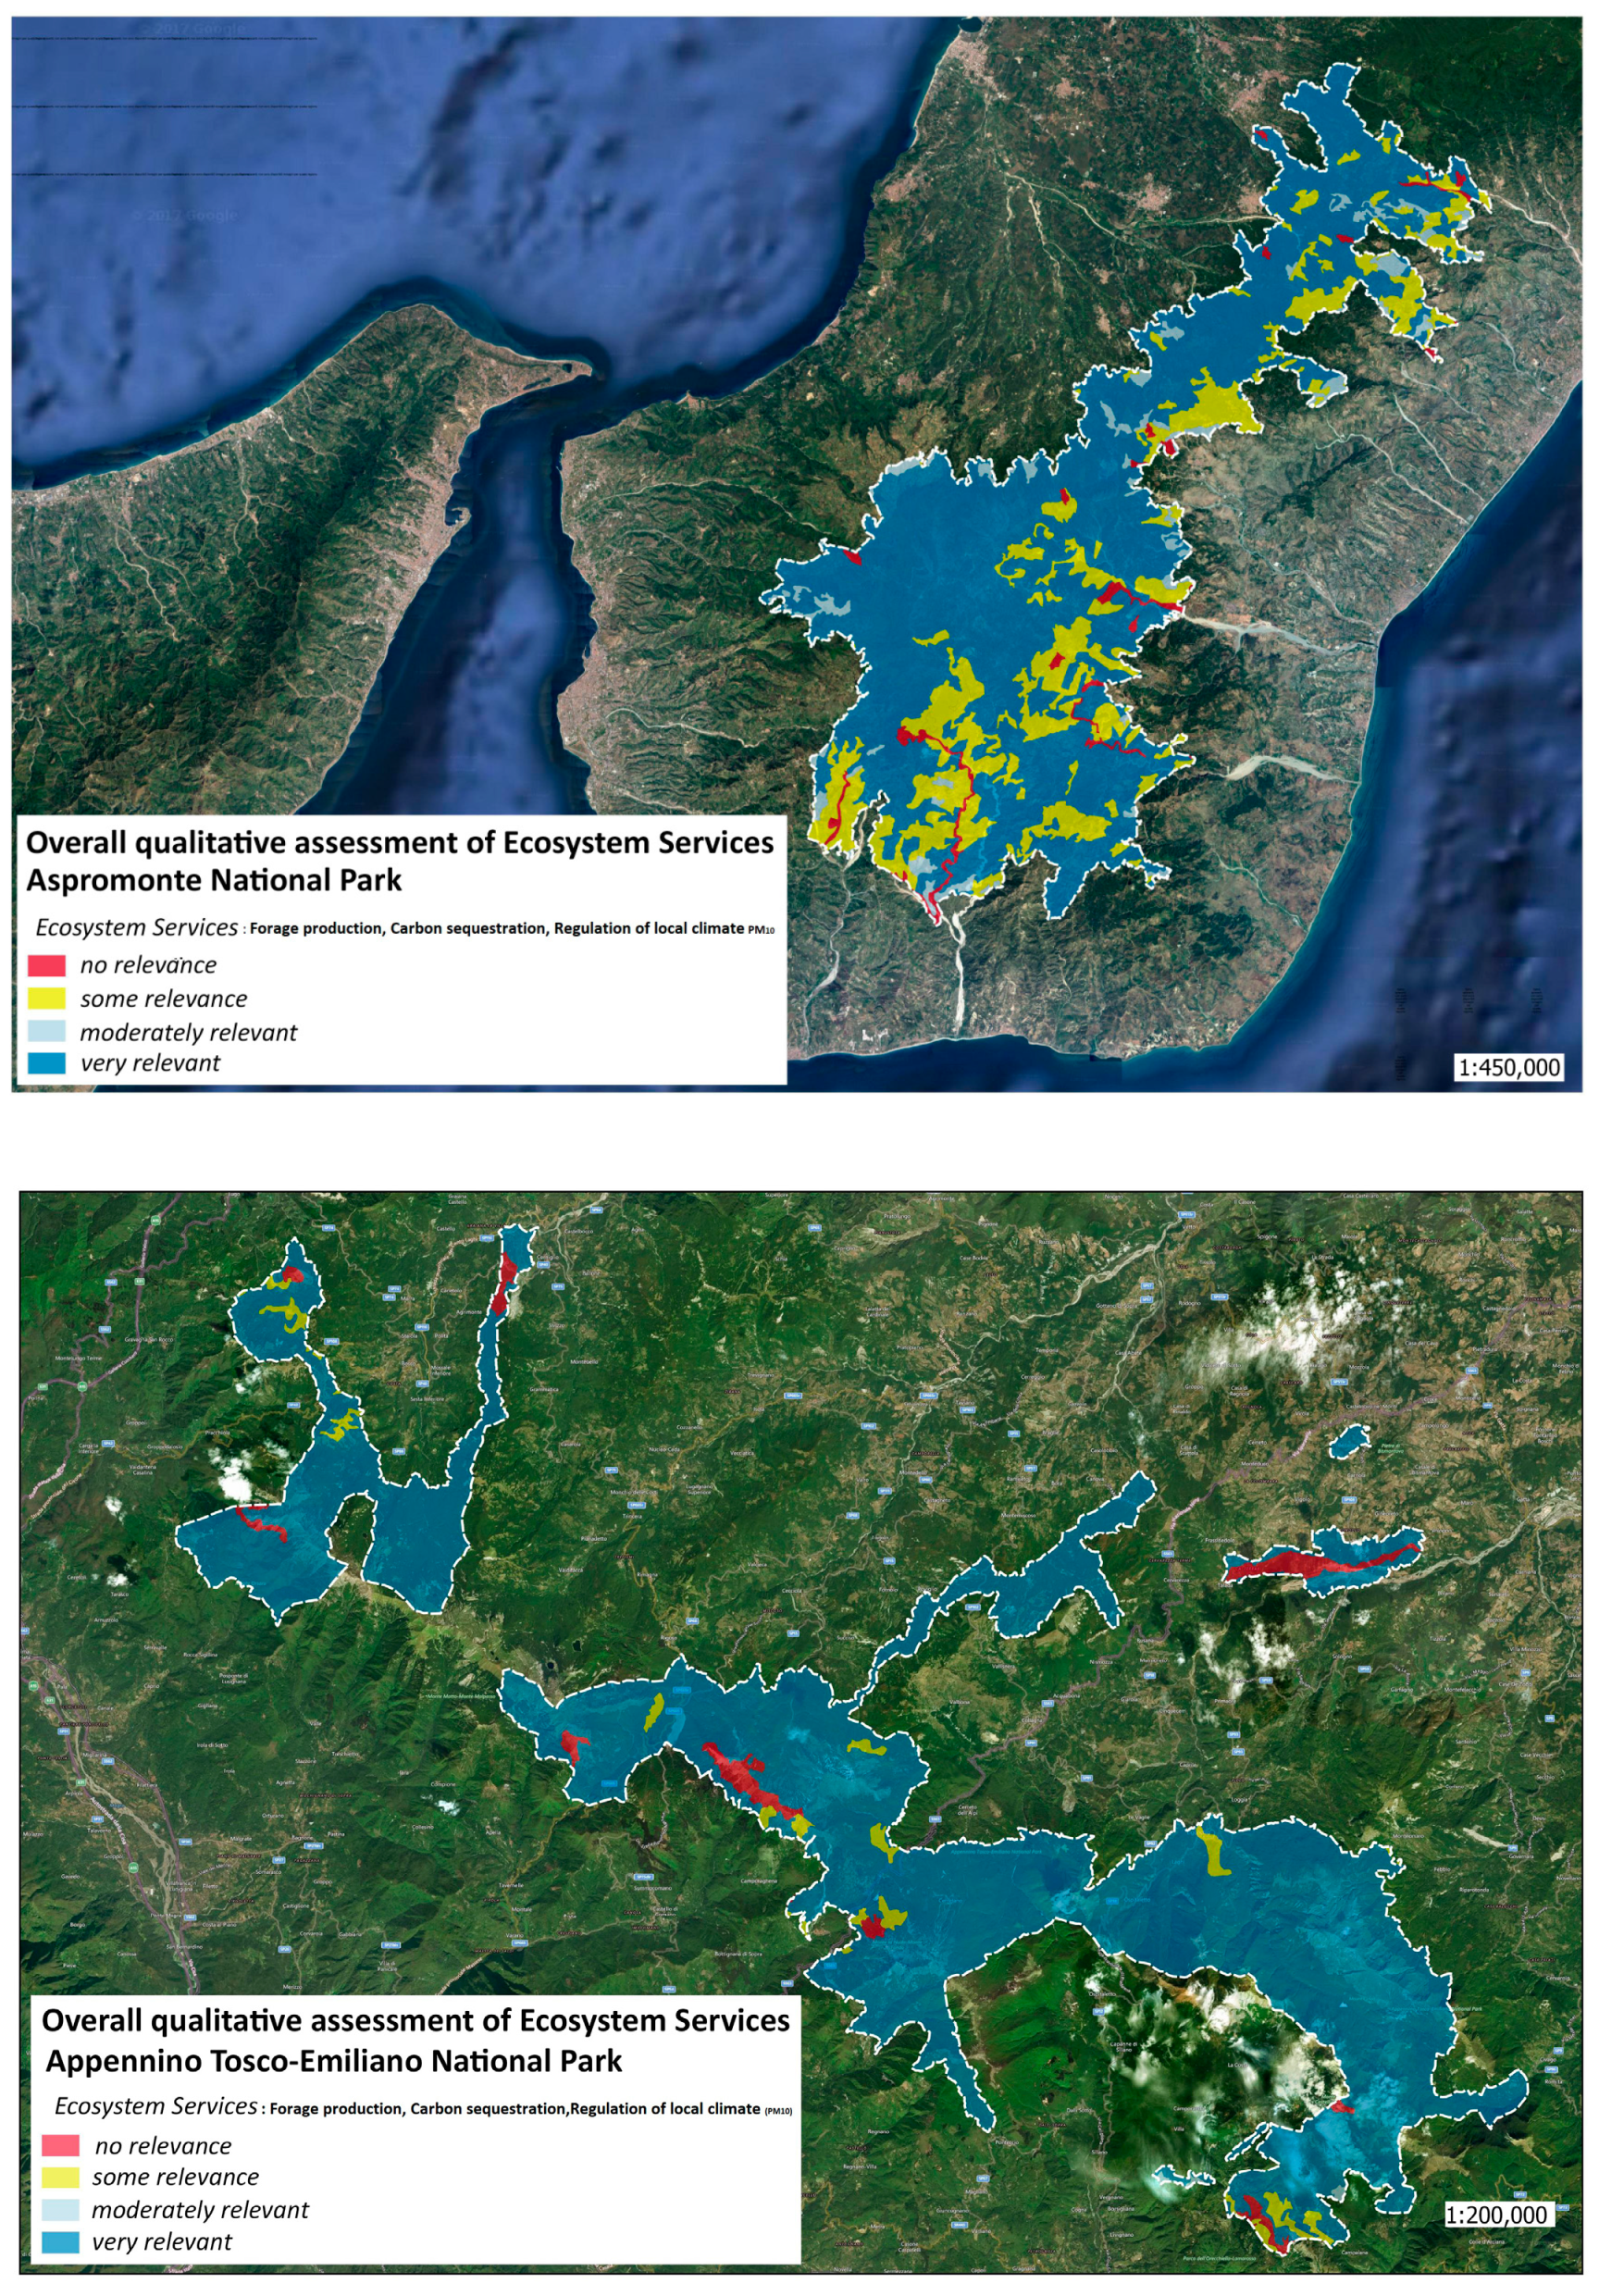
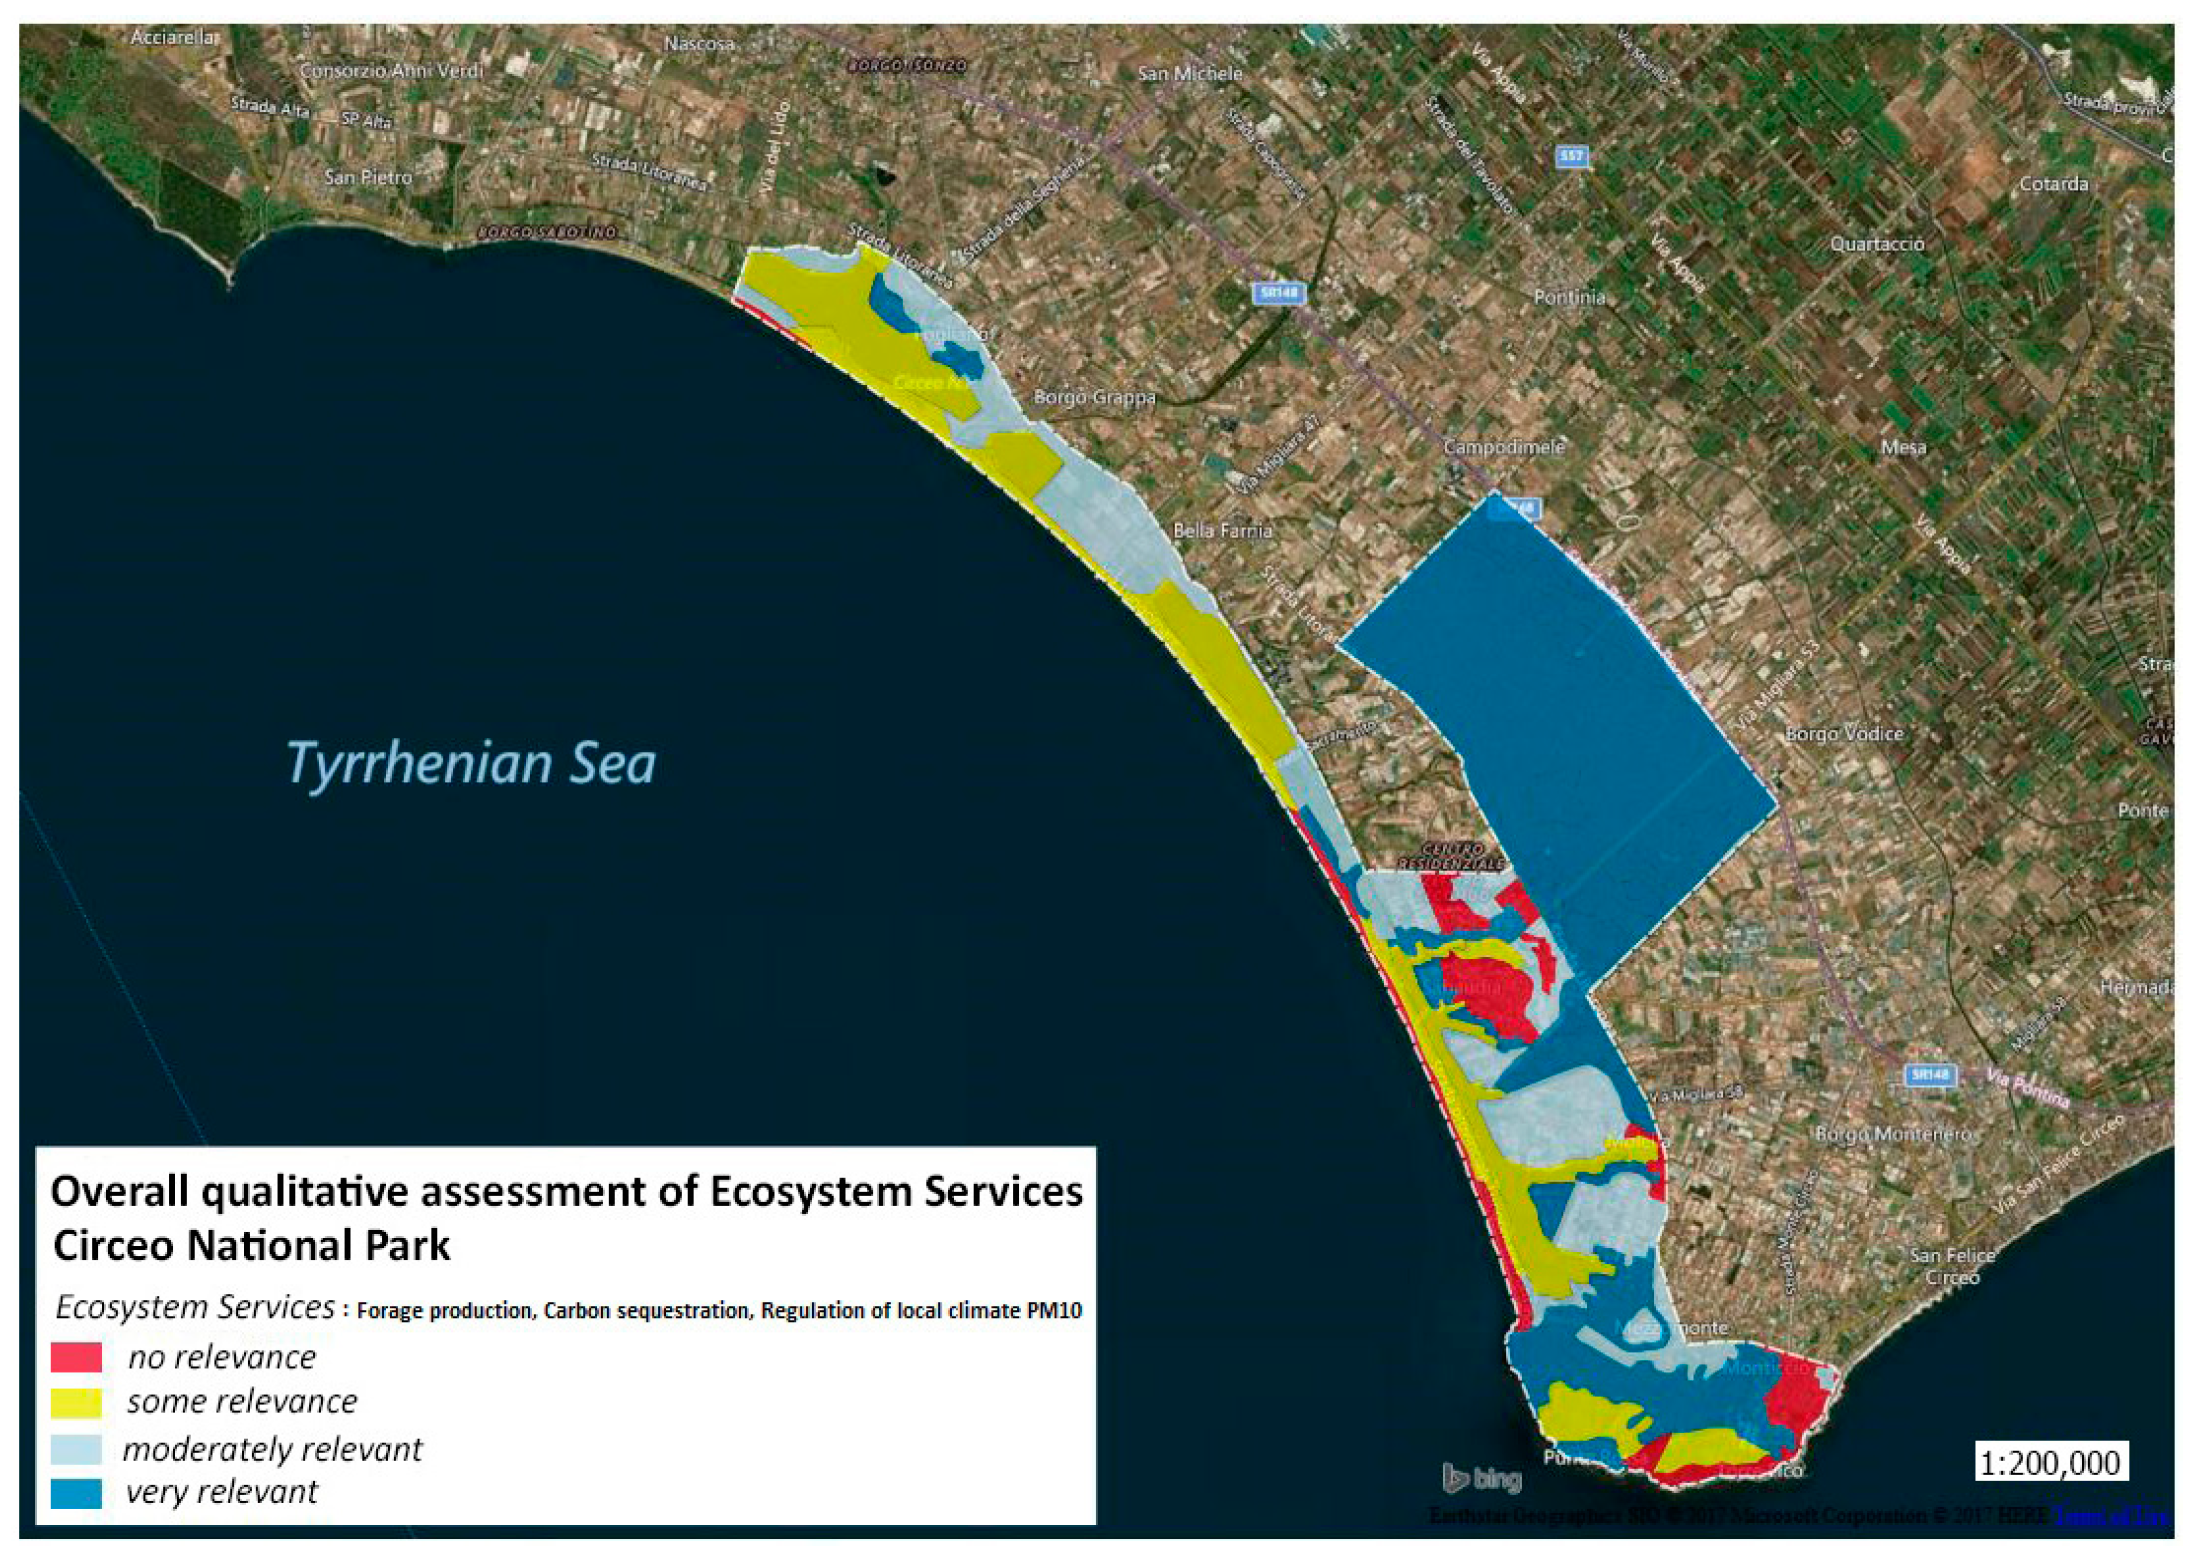
2.2.2. Step 2. Valuation and Mapping of ES
2.2.3. Step 3. Biophysical Quantification (Supply-Demand) and Economic Evaluation
Forage Production
Carbon Sequestration
Regulation of Local Climate (PM10)
2.2.4. Balance Demand-Supply
3. Results
4. Discussion
5. Conclusions
Author Contributions
Funding
Institutional Review Board Statement
Informed Consent Statement
Data Availability Statement
Acknowledgments
Conflicts of Interest
Appendix A
| INFC Categories | Regions | |||
|---|---|---|---|---|
| Emilia Romagna | Toscana | Lazio | Calabria | |
| Spruce woods | 13.2 | 13.3 | 20.2 | 0 |
| white spruce woods | 12.4 | 12.3 | 0 | 8.6 |
| Scots pine and Mountain pine | 3.9 | 8.7 | 0 | 0 |
| Black pine forests, laricio pine forests | 6.3 | 8.7 | 5.5 | 8.6 |
| Mediterranean pines | 4.3 | 4.2 | 3.4 | 4.7 |
| Other coniferous forests, pure or mixed | 4.8 | 7.8 | 8.3 | 10.3 |
| Beech woods | 6.2 | 8.1 | 3.5 | 6.4 |
| Oak wood, Downy Oak Woods, English oak woods | 2.2 | 1.9 | 1.5 | 2.3 |
| Sessile oak and other oaks | 4.7 | 2.9 | 3.1 | 4.8 |
| Chestnut groves | 5.3 | 6.4 | 6.6 | 6.2 |
| Hornbeams | 3.2 | 3.8 | 2.2 | 1.8 |
| Hygrophilous woods | 3.4 | 4.6 | 3.3 | 4.5 |
| Other deciduous forests | 3.4 | 4.3 | 2.7 | 3.4 |
| Holm oak woods | 5.2 | 2.3 | 1.9 | 3.7 |
| Cork oak woods | 0 | 2.3 | 2.1 | 2.7 |
| Others broadleaves | 0 | 2.1 | 1.1 | 3 |
| INFC Categories | WBD | BEF |
|---|---|---|
| Spruce woods | 0.38 | 1.29 |
| white spruce woods | 0.38 | 1.34 |
| larch woods and stone pine woods | 0.56 | 1.22 |
| Scots pine and Mountain pine | 0.47 | 1.33 |
| Mediterranean pines | 0.53 | 1.53 |
| Other coniferous forests, pure or mixed | 0.43 | 1.37 |
| Beech woods | 0.61 | 1.36 |
| Sessile oak and other oaks | 0.69 | 1.45 |
| Chestnut groves | 0.49 | 1.33 |
| Hornbeams | 0.66 | 1.28 |
| Oak wood, Downy Oak Woods, English oak woods | 0.65 | 1.39 |
| Holm oak woods | 0.72 | 1.45 |
| Cork oak woods | 0.72 | 1.45 |
| Other deciduous forests | 0.53 | 1.47 |
| Black pine forests, laricio pine forests | 0.52 | 1.44 |
| Hygrophilous woods | 0.41 | 1.39 |
| Others broadleaves | 0.63 | 1.49 |
| Corine Land Cover Class | Coefficient * | Approach |
|---|---|---|
| 3.1.1. Broad-leaved forest | 0.16 t/ha/year | data 1/3 of the value for coniferous |
| 3.1.2. Coniferous forest | 0.49 t/ha/year | average approx. of the highest values of Escobedo and Nowak [76], Nowak et al. 2006 [77], compared to fully wooded areas (x 4) |
| 3.1.3. Mixed forest | 0.325 t/ha/year | average of the previous values |
References
- MEA. Ecosystems and Human Well-Being: Biodiversity Synthesis; World Resource Institute: Washington, DC, USA, 2005. [Google Scholar]
- Wu, S.; Li, S. Ecosystem service relationships: Formation and recommended approaches from a systematic review. Ecol. Indic. 2019, 99, 1–11. [Google Scholar] [CrossRef]
- Graeme, S.C.; von Cramon-Taubadel, S. Linking economic growth pathways and environmental sustainability by understanding development as alternate social–ecological regimes. Proc. Natl. Acad. Sci. USA 2018, 115, 9533–9538. [Google Scholar]
- Wang, Z.; Mao, D.; Li, L.; Jia, M.; Dong, Z.; Miao, Z.; Ren, C.; Song, C. Quantifying changes in multiple ecosystem services during 1992–2012 in the Sanjiang Plain of China Sci. Total Environ. 2015, 514, 119–130. [Google Scholar] [CrossRef]
- Haines-Young, R.; Potschin, M. The links between biodiversity, ecosystem services and human well-being. Ecosyst. Ecol. New Synth. 2010, 1, 110–139. [Google Scholar]
- Burkhard, B.; Kroll, A.; Nedkov, S.; Müller, F. Mapping ecosystem service supply, demand and budgets. Ecol. Indic. 2012, 21, 17–29. [Google Scholar] [CrossRef]
- Costanza, R.; de Groot, R.; Sutton, P.C.; van der Ploeg, S.; Anderson, S.; Kubiszewski, I.; Farber, S.; Turner, R.K. Changes in the global value of ecosystem services. Glob. Environ. Chang. 2014, 26, 152–158. [Google Scholar] [CrossRef]
- Burkhard, B.; Maes, J. Mapping Ecosystem Services; Pensoft Publishers: Sofia, Bulgaria, 2017; 374p, Available online: http://ab.pensoft.net/articles.php?id=12837 (accessed on 21 November 2020).
- Wei, H.; Fan, W.; Wang, X.; Lu, N.; Dong, X.; Zhao, Y.; Ya, X.; Zhao, Y. Integrating supply and social demand in ecosystem services assessment: A review. Ecosyst. Serv. 2017, 25, 15–27. [Google Scholar] [CrossRef]
- Villamagna, A.M.; Angermeier, P.L.; Bennet, E.M. Capacity, pressure, demand, and flow: A conceptual framework for analyzing ecosystem service provision and delivery. Ecol. Complex. 2013, 15, 114–121. [Google Scholar] [CrossRef]
- Crossman, N.D.; Burkhard, B.; Nedkov, S.; Willemen, L.; Petz, K.; Palomo, I.; Drakou, E.G.; Martín López, B.; McPhearson, T.; Boyanova, K.; et al. A blue print for mapping and modeling ecosystem services. Ecosyst. Serv. 2013, 4, 4–14. [Google Scholar] [CrossRef]
- Martínez-Harms, M.J.; Balvanera, P. Methods for mapping ecosystem service supply: A review. Int. J. Biodivers. Sci. Ecosyst. Serv. Manag. 2012, 8, 17–25. [Google Scholar] [CrossRef]
- Bastian, O. The role of biodiversity in supporting ecosystem services in Natura 2000 sites. Ecol. Indic. 2013, 24, 12–22. [Google Scholar] [CrossRef]
- Schröter, M.; Barton, D.N.; Remme, R.P.; Hein, L. Accounting for capacity and flow of ecosystem services: A conceptual model and a case study for Telemark, Norway. Ecol. Indic. 2014, 36, 539–551. [Google Scholar] [CrossRef]
- Richards, D.R.; Friess, D.A. A rapid indicator of cultural ecosystem service usage at a fine spatial scale: Content analysis of social media photographs. Ecol. Ind. 2015, 53, 187–195. [Google Scholar] [CrossRef]
- Egoh, B.N.; Paracchini, M.L.; Zulian, G.; Schägner, J.P.; Bidoglio, G. Exploring restoration options for habitats, species and ecosystem services in the European Union. J. Appl. Ecol. 2014, 51, 899–908. [Google Scholar] [CrossRef] [Green Version]
- Stürck, J.; Poortinga, A.; Verburg, P.H. Mapping ecosystem services: The supply and demand of flood regulation services in Europe. Ecol. Indic. 2014, 38, 198–211. [Google Scholar] [CrossRef]
- Larondelle, N.; Lauff, S. Balancing demand and supply of multiple urban ecosystem services on different spatial scales. Ecosyst. Serv. 2016, 22, 18–31. [Google Scholar] [CrossRef]
- Wolff, S.; Schulp, C.J.E.; Kastner, T.; Verburg, P.H. Quantifying spatial variation in ecosystem services demand: A global mapping approach. Ecol. Econ. 2017, 136, 14–29. [Google Scholar] [CrossRef]
- Nikodinoska, N.; Paletto, A.; Pastorella, F.; Granvik, M.; Franzese, P.P. Assessing, valuing and mapping ecosystem services at city level: The case of Uppsala (Sweden). Ecol. Mode 2018, 368, 411–424. [Google Scholar] [CrossRef]
- Balvanera, P.; Quijas, S.; Karp, D.S.; Ash, N.; Bennett, E.M.; Boumans, R.; Brown, C.; Chan, K.M.A. Ecosystem services. In The GEO Handbook on Biodiversity Observation Networks; Walters, M., Scholes, R.J., Eds.; Springer Open: Cham, Switzerland, 2016; pp. 39–78. [Google Scholar]
- Yahdjian, L.; Sala, O.E.; Havstad, K.M. Rangeland ecosystem services: Shifting focus from supply to reconciling supply and demand. Front. Ecol. Environ. 2015, 13, 44–51. [Google Scholar] [CrossRef]
- Lamarque, P.; Quétier, F.; Lavorel, S. The diversity of the ecosystem services concept and its implications for their assessment and management. CR Biol. 2011, 334, 441–449. [Google Scholar] [CrossRef]
- Honey-Rosés, J.; Pendleton, L.H. A emand Driven Research Agenda for Ecosystem Services. Ecosyst. Serv. 2016, 1, 160–162. [Google Scholar]
- Balvanera, P.; Daily, G.C.; Ehrlich, P.R.; Ricketts, T.H.; Bailey, S.A.; Kark, S.; Kremen, C.; Pereira, H. Conserving biodiversity and ecosystem services. Science 2001, 291, 2047. [Google Scholar] [CrossRef] [PubMed]
- Vollmer, D.; Shaad, K.; Souter, N.J.; Farrell, T.; Dudgeon, D.; Sullivan, C.A.; Fauconnier, I.; MacDonald, G.M.; McCartney, M.P.; Power, A.G.; et al. Integrating the social, hydrological and ecological dimensions of freshwater health: The Freshwater Health Index. Sci. Total Environ. 2018, 627, 304–313. [Google Scholar] [CrossRef]
- Feng, Z.; Cuib, Y.; Zhangc, H.; Gaoc, Y. Assessment of human consumption of ecosystem services in China from 2000 to 2014 based on an ecosystem service footprint model. Ecol. Indic. 2018, 94, 468–481. [Google Scholar] [CrossRef]
- Martínez-López, J.; Bagstad, K.; Balbi, S.; Magrach, A.; Voigt, B.; Athanasiadis, I.; Pascual, M.; Willcock, S.; Villa, F. Towards globally customizable ecosystem service models. Sci. Total Environ. 2019, 650, 2325–2336. [Google Scholar] [CrossRef] [PubMed]
- Bukvareva, E.; Zamolodchikov, D.; Kraev, G.; Grunewald, K.; Narykov, A. Supplied, demanded and consumed ecosystem services: Prospects for national assessment in Russia. Ecol. Indic. 2017, 78, 351–360. [Google Scholar] [CrossRef]
- Nedkov, S.; Burkhard, B. Flood regulating ecosystem services-mapping supply and demand, in the Etropole municipality. Bulgaria. Ecol. Indic. 2012, 21, 67–79. [Google Scholar] [CrossRef]
- Burkhard, B.; Kandziora, M.; Hou, Y.; Müller, F. Ecosystem Service Potentials, Flows and Demands—Concepts for Spatial Localisation, Indication and Quantification. Landsc. Online 2014, 34, 1–32. [Google Scholar] [CrossRef]
- Li, J.; Jiang, H.; Bai, Y.; Alatalo, J.M.; Li, X.; Jiang, H. Indicators for spatial–temporal comparisons of ecosystem service status between regions: A case study of the Taihu river basin, China. Ecol. Indic. 2016, 60, 1008–1016. [Google Scholar] [CrossRef]
- Guan, Q.; Hao, J.; Ren, G.; Li, M.; Chen, A.; Duan, W.; Chen, H. Ecological indexes for the analysis of the spatial–temporal characteristics of ecosystem service supply and demand: A case study of the major grain-producing regions in Quzhou, China. Ecol. Indic. 2020, 108, 105748. [Google Scholar] [CrossRef]
- Chen, J.; Jiang, B.; Bai, Y.; Xib Xu, X.; Alatalo, J.M. Quantifying ecosystem services supply and demand shortfalls and mismatches for management optimization. Sci. Total Environ. 2019, 650, 1426–1439. [Google Scholar] [CrossRef] [PubMed]
- Syrbe, R.U.; Grunewald, K. Ecosystem service supply and demand—The challenge to balance spatial mismatches. Int. J. Biodivers. Sci. Ecosyst. Serv. Manag. 2017, 13, 148–161. [Google Scholar] [CrossRef] [Green Version]
- Kroll, F.; Müller, F.; Haase, D.; Fohrer, N. Rural-urban gradient analysis of ecosystem services supply and demand dynamics. Land Use Policy 2012, 29, 521–535. [Google Scholar] [CrossRef]
- Guarini, M.R.; Morano, P.; Sica, F. Historical School Buildings. A Multi-Criteria Approach for Urban Sustainable Projects. Sustainability 2020, 12, 1076. [Google Scholar] [CrossRef] [Green Version]
- Cortinovis, C.; Geneletti, D. A performancebased planning approach integrating supply and demand of urban ecosystem services. Landsc. Urban Plan. 2020, 201, 103842. [Google Scholar] [CrossRef]
- Hummel, C.; Provenzale, A.; van der Meer, J.; Wijnhoven, S.; Nolte, A.; Poursanidis, D. Ecosystem services in European protected areas: Ambiguity in the views of scientists and managers? PLoS ONE 2017, 12, e0187143. [Google Scholar] [CrossRef] [Green Version]
- Tittensor, D.P.; Walpole, M.; Hill, S.L.; Boyce, D.G.; Britten, G.L.; Burgess, N.D. A mid-term analysis of progress toward international biodiversity targets. Science 2014, 346, 241–244. [Google Scholar] [CrossRef] [PubMed]
- Vitousek, P.M.; Mooney, H.A.; Lubchenco, J.; Melillo, J.M. Human domination of Earth’s ecosystems. Science 1997, 277, 494–499. [Google Scholar] [CrossRef] [Green Version]
- Sil, Â.; Rodrigues, A.P.; Carvalho-Santos, C.; Nunes, J.P.; Honrado, J.; Alonso, J. Trade-offs and synergies between provisioning and regulating ecosystem services in a mountain area in Portugal affected by landscape change. Mount. Res. Dev. 2016, 36, 452–464. [Google Scholar] [CrossRef] [Green Version]
- Buonocore, E.; Appolloni, L.; Russo, G.F.; Franzese, P.P. Assessing natural capital value in marine ecosystems through an environmental accounting model: A case study in Southern Italy. Ecol. Model. 2020, 419, 108958. [Google Scholar] [CrossRef]
- Marino, D.; Marucci, A.; Palmieri, M.; Gaglioppa, P. Monitoring the Convention on Biological Diversity (CBD) Framework using Evaluation of Effectiveness methods. The Italian case. Ecol. Indic. 2015, 55, 172–182. [Google Scholar] [CrossRef]
- Marino, D.; Gaglioppa, P.; Schirpke, U.; Guadagno, R.; Marucci, A.; Palmieri, M.; Pellegrino, D.; Gusmerotti, N. Assessment and governance of Ecosystem Services for improving management effectiveness of Natura 2000 sites. Biobased Appl. Econ. 2014, 3, 229–247. [Google Scholar]
- Marino, D.; Schirpke, U.; Gaglioppa, P.; Guadagno, R.; Marucci, A.; Palmieri, M.; Pellegrino, D.; De Marco, C.; Scolozzi, R. Assessment and Governance of Ecosystem Services: First insights from LIFE+ Making Good Natura project. Annali di Botanica 2014, 4, 83–90. [Google Scholar]
- Costanza, R.; Daly, H. Natural capital and sustainable development. Conserv. Biol. 1992, 6, 37–46. [Google Scholar] [CrossRef]
- Putnam, R.D. Tuning in, tuning out: The strange disappearance of social capital in America. Polit. Sci. Polit. 1995, 28, 664–683. [Google Scholar] [CrossRef]
- Fisher, B.; Turner, R.K.; Morling, P. Defining and classifying ecosystem services for decision making. Ecol. Econ. 2009, 68, 643–653. [Google Scholar] [CrossRef] [Green Version]
- Figueroa, E.; Aronson, J. New linkages for protected areas: Making them worth conserving and restoring. J. Nat. Conserv. 2006, 14, 225–232. [Google Scholar] [CrossRef]
- Carpenter, S.R. Alternate states of ecosystems: Evidence andits implications. In Ecology Achievement and Challenge; Huntly, M.C., Levin, S.N., Eds.; Blackwell: London, UK, 2001. [Google Scholar]
- Turner, R.A.; Addison, J.; Arias, A.; Bergseth, B.J.; Marshall, N.A.; Morrison, T.H.; Tobin, R.C. Trust, confidence, and equity affect the legitimacy of natural resource governance. Ecol. Soc. 2016, 21, 18. [Google Scholar] [CrossRef] [Green Version]
- Marino, D.; Palmieri, M. Investing in nature: Working with public expenditure and private payments for a new governance model. In Re-connecting Natural and Cultural Capital Contributions from Science and Policy; Paracchini, M.L., Zingari, P.C., Blasi, C., Eds.; Office of Publications of the European Union: Luxembourg, 2016. [Google Scholar]
- Schirpke, U.; Marino, D.; Marucci, A.; Palmieri, M.; Scolozzi, R. Operationalizing ecosystem services for effective management of protected areas: Experiences and challenges. Ecosyst. Serv. 2017, 28, 105–114. [Google Scholar] [CrossRef]
- Marino, D.; Cavallo, A. Understanding changing in traditional agricultural landscapes: Towards a framework. J. Agric. Sci. Technol. 2012, 2, 971–987. [Google Scholar]
- Ruskule, A.; Vinogradovs, I.; Pecina, M.V. The Guidebook on the Introduction to the Ecosystem Service Framework and Its Application in Integrated Planning; The LIFE Viva Grass project; University of Latvia: Rīga, Latvia, 2018; ISBN 978-9934-556-39-5. [Google Scholar]
- Schirpke, U.; Scolozzi, R.; De Marco, C. Analisi dei Servizi Ecosistemici Nei Siti Pilota. Parte 4: Selezione dei Servizi Ecosistemici. Report del Progetto Making Good Natura; (LIFE+11 ENV/IT/000168); EURAC Research: Bolzano, Italy, 2013; p. 43. [Google Scholar]
- De Vreesea, R.; Leysa, M.; Fontaineb, C.M.; Dendoncker, N. Social mapping of perceived ecosystem services supply—The role ofsocial landscape metrics and social hotspots for integrated ecosystemservices assessment, landscape planning and management. Ecol. Indic. 2016, 66, 517–533. [Google Scholar] [CrossRef]
- Chan, K.M.A.; Guerry, A.D.; Balvanera, P.; Klain, S.; Satterfield, T.; Basurto, X.; Bostrom, A.; Chuenpagdee, R.; Gould, R.; Halpern, B.S.; et al. Where are cultural and social in ecosystem services? A framework for constructive engagement. Bioscience 2012, 62, 744–756. [Google Scholar] [CrossRef]
- Fagerholm, N.; Kaeyhko, N.; Ndumbaro, F.; Khamis, M. Community stakehol-ders’ knowledge in landscape assessments—Mapping indicators for landscapeservices. Ecol. Indic 2012, 18, 421–433. [Google Scholar] [CrossRef]
- Menzel, S.; Teng, J. Ecosystem services as a stakeholder-driven concept forconservation science. Conserv. Biol. 2009, 24, 907–909. [Google Scholar] [CrossRef]
- Plieninger, T.; Dijks, S.; Oteros-Rozas, E.; Bieling, C. Assessing, mapping, and quantifying cultural ecosystem services at community level. Land Use Policy 2013, 33, 118–129. [Google Scholar] [CrossRef] [Green Version]
- van Riper, C.J.; Kyle, G.T.; Sutton, S.G.; Barnes, M.; Sherrouse, B.C. Mapping outdoor recreationists’ perceived social values for ecosystem services at Hinchinbrook Island National Park, Australia. Appl. Geogr. 2012, 35, 164–173. [Google Scholar] [CrossRef]
- van Oudenhoven, A.P.E.; Petz, K.; Alkemade, R.; de Groot, R.S.; Hein, L. Indicators for assessing effects of management on ecosystem services. Ecol. Indic. 2012, 21, 110–122. [Google Scholar] [CrossRef]
- Geijzendorffer, I.R.; Roche, P.K. The relevant scales of ecosystem services demand. Ecosyst. Serv. 2014, 10, 49–51. [Google Scholar] [CrossRef]
- MATTM. Unioncamere L’economia Reale Nei Parchi Nazionali, e Nelle Aree Naturali Protette, Fatti, Cifre e Storie Della Green Economy. Rapporto 2014. 2014; ISBN 978-88-6077-140-7. Available online: https://www.unioncamere.gov.it/download/3714.html (accessed on 10 November 2020).
- Häyhä, T.; Franzese, P.P. Ecosystem services assessment: A review under an ecological—Economic and systems perspective. Ecol. Model. 2014, 289, 124–132. [Google Scholar] [CrossRef]
- Hein, L.; van Koppen, K.; de Groot, R.S.; van Ierland, E.C. Spatial scales, stakeholders and the valuation of ecosystem services. Ecol. Econ. 2006, 57, 209–228. [Google Scholar] [CrossRef]
- Pagiola, S.; von Ritter, K.; Bishop, J.T. Assessing the Economic Value of Ecosystem Conservation; TNC-IUCN-WB: Washington, DC, USA, 2004. [Google Scholar]
- ISTAT. Coltivazioni Agricole, Foreste e Caccia; Anno 2000. Informazioni, 28; Istituto Nazionale di Statistica: Roma, Italy, 2003. [Google Scholar]
- Vv.Aa. InVEST +VERSION+ User’s Guide. The Natural Capital Project, Stanford University; University of Minnesota, The Nature Conservancy, and World Wildlife Fund: Minneapolis, MN, USA, 2014. [Google Scholar]
- Ricke, K.; Drouet, L.; Caldeira, K.; Tavoni, M. Country Level Social Cost of Carbon. Nat. Clim. Chang. 2018, 8, 895–900. [Google Scholar] [CrossRef]
- Fischer, P.H.; Brunekreef, B.; Lebret, E. Air pollution related deaths during the 2003 heat wave in the Netherlands. Atmos. Environ. 2004, 38, 1083–1085. [Google Scholar] [CrossRef]
- Anttila, P.; Salmi, T. Characterizing temporal and spatial pat-terns of urban PM10 using six years of Finnish monitoring data. Boreal Environ. Res. 2006, 11, 463. [Google Scholar]
- Schirpke, U.; Scolozzi, R.; De Marco, C. Modello Dimostrativo di Valutazione Qualitativa e Quantitativa dei Servizi Ecosistemici Nei Siti Pilota. Parte1: Metodi di Valutazione; Report del progetto Making Good Natura (LIFE+11 ENV/IT/000168); EURAC Research: Bolzano, Italy, 2014; p. 75. [Google Scholar]
- Escobedo, F.J.; Nowak, D.J. Spatial heterogeneity and air pollution removal by an urban forest. Landsc. Urban Plan. 2009, 90, 102–110. [Google Scholar] [CrossRef]
- Nowak, D.J.; Crane, D.E.; Stevens, J.C. Air pollution removal by urban trees and shrubs in the United States. Urban For. Urban Green. 2006, 4, 115–123. [Google Scholar] [CrossRef]
- Nowak, D.J.; Crane, D.E.; Stevens, J.C.; Hoehn, R.E.; Walton, J.T.; Bond, J. A ground-based method of assessing urban forest structure and ecosystem services. Arboric. Urban For. 2008, 34, 347–358. [Google Scholar]
- Feld, C.K.; Martins da Silva, P.; Paulo Sousa, J.; De Bello, F.; Bugter, R.; Grandin, U.; Hering, D.; Lavorel, S.; Mountford, O.; Pardo, I.; et al. Indicators of biodiversity and ecosystem services: A synthesis across ecosystems and spatial scales. Oikos 2009, 118, 1862–1871. [Google Scholar] [CrossRef]
- Layke, C.; Mapendembe, A.; Brown, C.; Walpole, M.; Winn, J. Indicators from the global and sub-global Millennium Ecosystem Assessments: An analysis and next steps. Ecol. Indic. 2011, 17, 77–87. [Google Scholar] [CrossRef]
- Kremer, P.; Hamstead, Z.; Haase, D.; McPhearson, T.; Frantzeskaki, N.; Andersson, E.; Kabisch, N.; Larondelle, N.; Lorance Rall, E.; Voigt, A.; et al. Key insights for the future of urban ecosystem services research. Ecol. Soc. 2016, 21, 29. [Google Scholar] [CrossRef] [Green Version]
- Goldenberg, R.; Kalantari, Z.; Cvetkovic, V.; Mörtberg, U.; Deal, B.; Destouni, G. Distinction, quantification and mapping of potential and realized supply-demand of flow-dependent ecosystem services. Sci. Total Environ. 2017, 593–594, 599–609. [Google Scholar] [CrossRef]
- Franzese, P.P.; Manes, F.; Scardi, M.; Riccio, A. Modelling matter and energy flows in the biosphere and human economy. Ecol. Model. 2020, 422, 108984. [Google Scholar] [CrossRef]
- Maes, J.; Teller, A.; Erhard, M.; Liquete, C.; Braat, L.; Berry, P.; Egoh, B.; Puydarrieux, P.; Fiorina, C.; Santos, F.; et al. Mapping and Assessment of Ecosystems and Their Services. An Analytical Framework for Ecosystem Assessments under Action 5 of the EU Biodiversity Strategy to 2020; Publications Office of the European Union: Luxembourg, 2013. [Google Scholar]
- Schirpke, U.; Marino, D.; Marucci, A.; Palmieri, M. Positive effects of payments for ecosystem services on biodiversity and socioeconomic development: Examples from Natura 2000 sites in Italy. Ecosyst. Serv. 2018, 34, 96–105. [Google Scholar] [CrossRef]
- Vallecillo, S.; La Notte, A.; Zulian, G.; Ferrini, S.; Maes, J. Ecosystem services accounts: Valuing the actual flow of nature-based recreation from ecosystems to people. Ecol. Model. 2019, 392, 196–221. [Google Scholar] [CrossRef]
- Syrbe, R.-U.; Walz, U. Spatial indicators for the assessment of ecosystem services: Providing, benefiting and connecting areas and landscape metrics. Ecol. Indic. 2012, 21, 80–88. [Google Scholar] [CrossRef]
- Kettunen, M.; Genovesi, P.; Gollasch, S.; Pagad, S.; Starfinger, U.; ten Brink, P.; Shine, C. Technical Support to EU Strategy on Invasive Species (IAS)—Assessment of the Impacts of IAS in Europe and the EU; (Final Module Report for the European Commission); Institute for European Environmental Policy (IEEP): Brussels, Belgium, 2008; 44p. [Google Scholar]
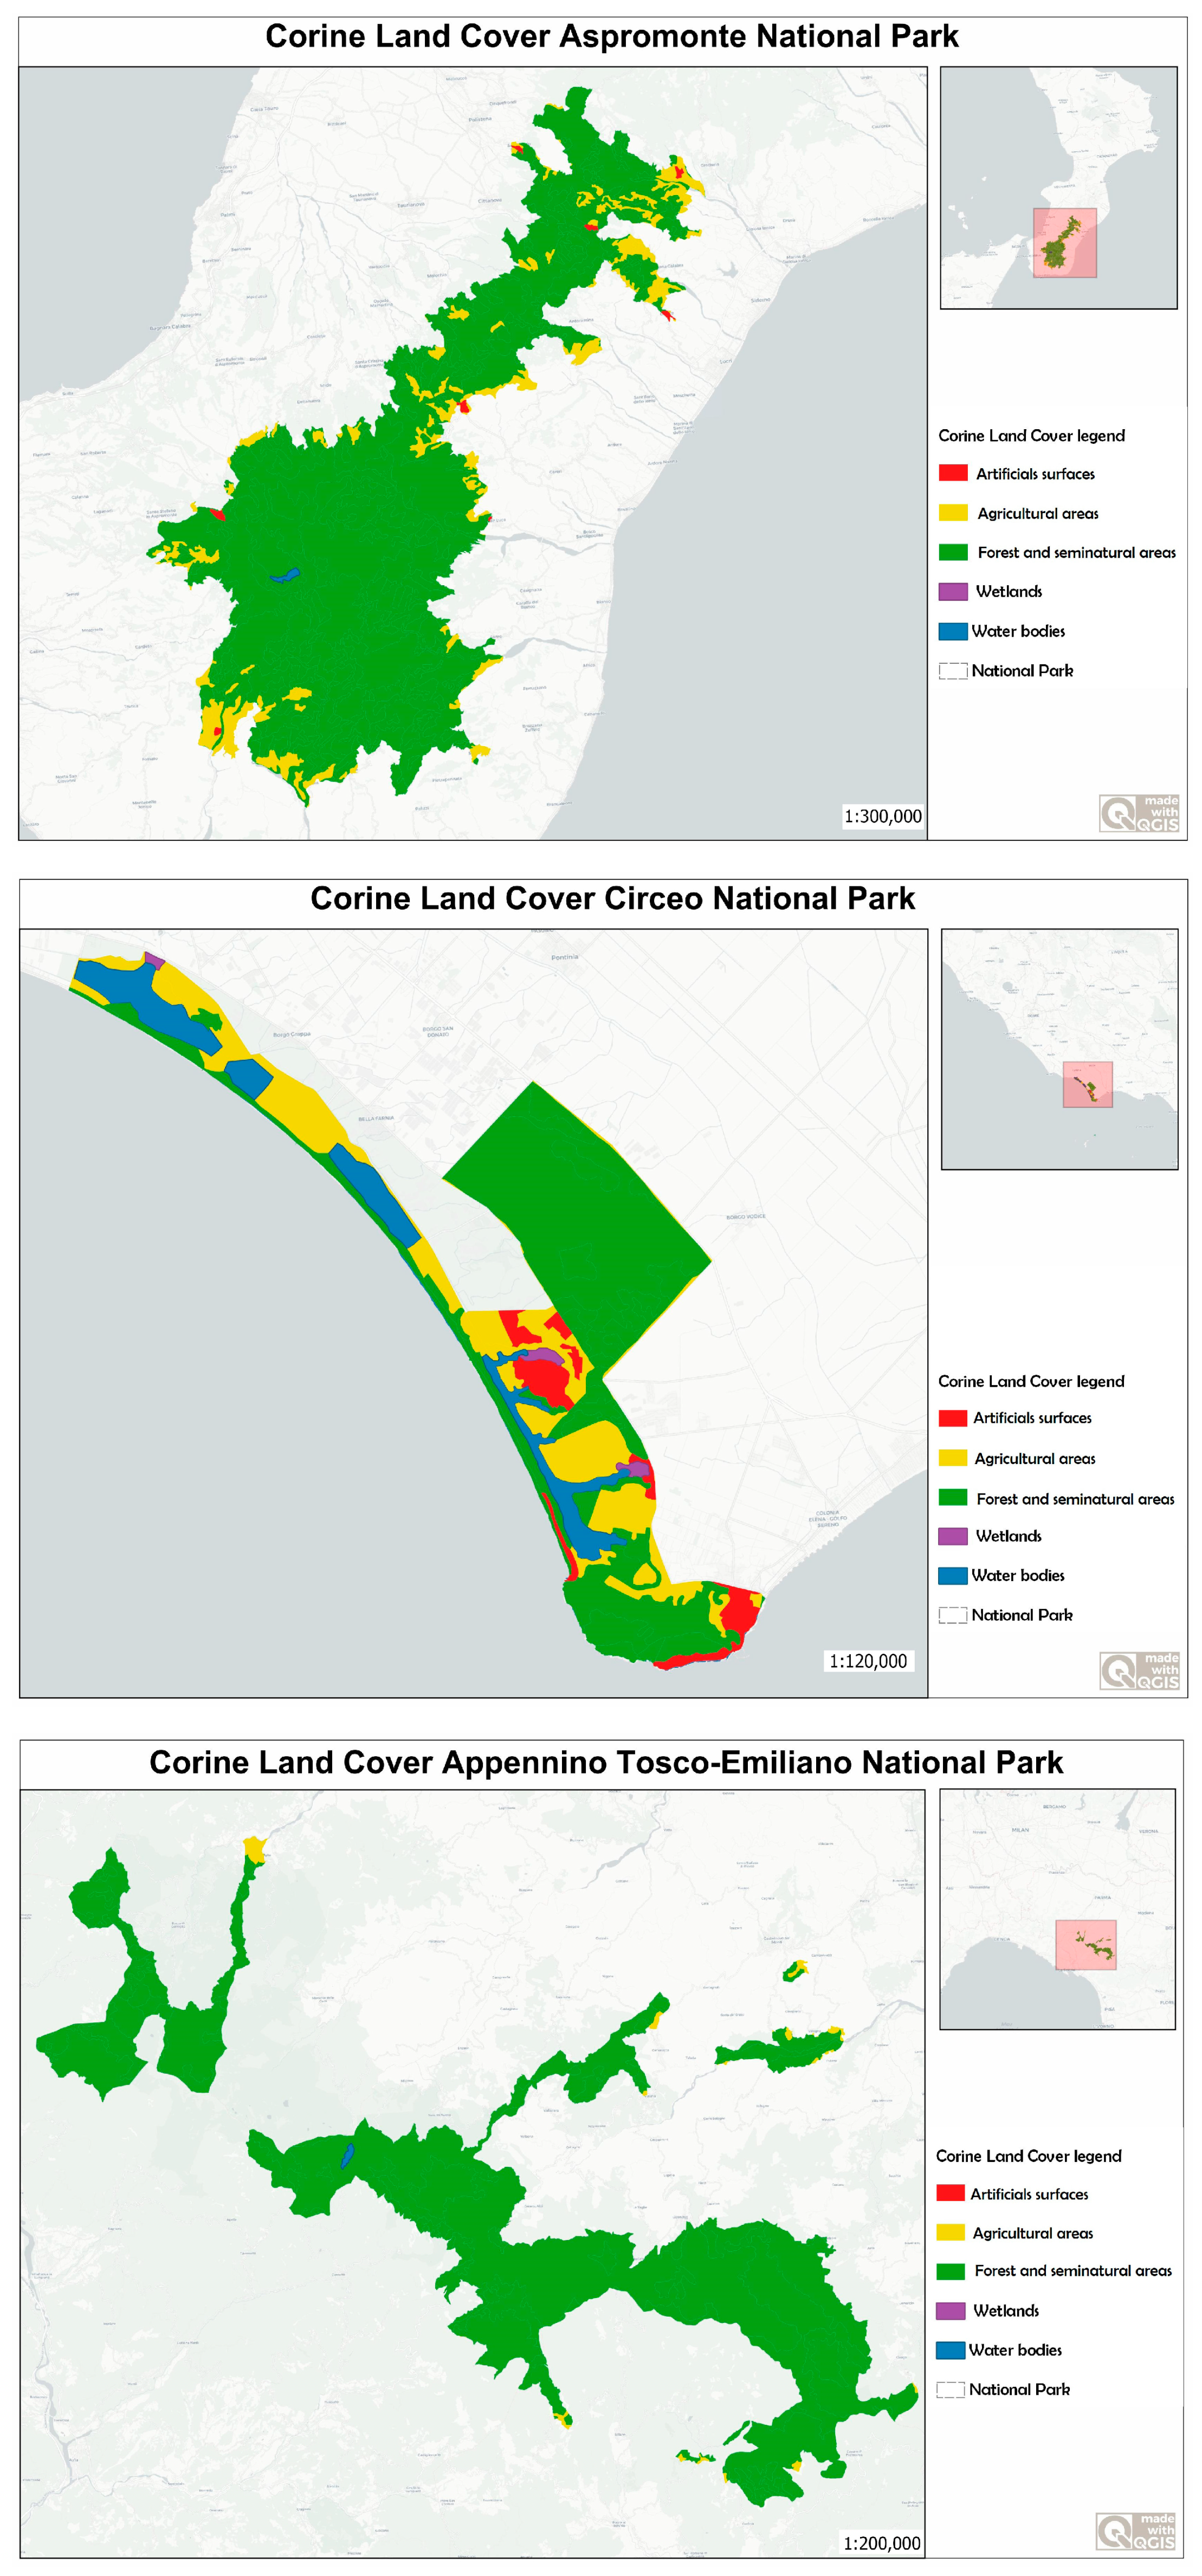
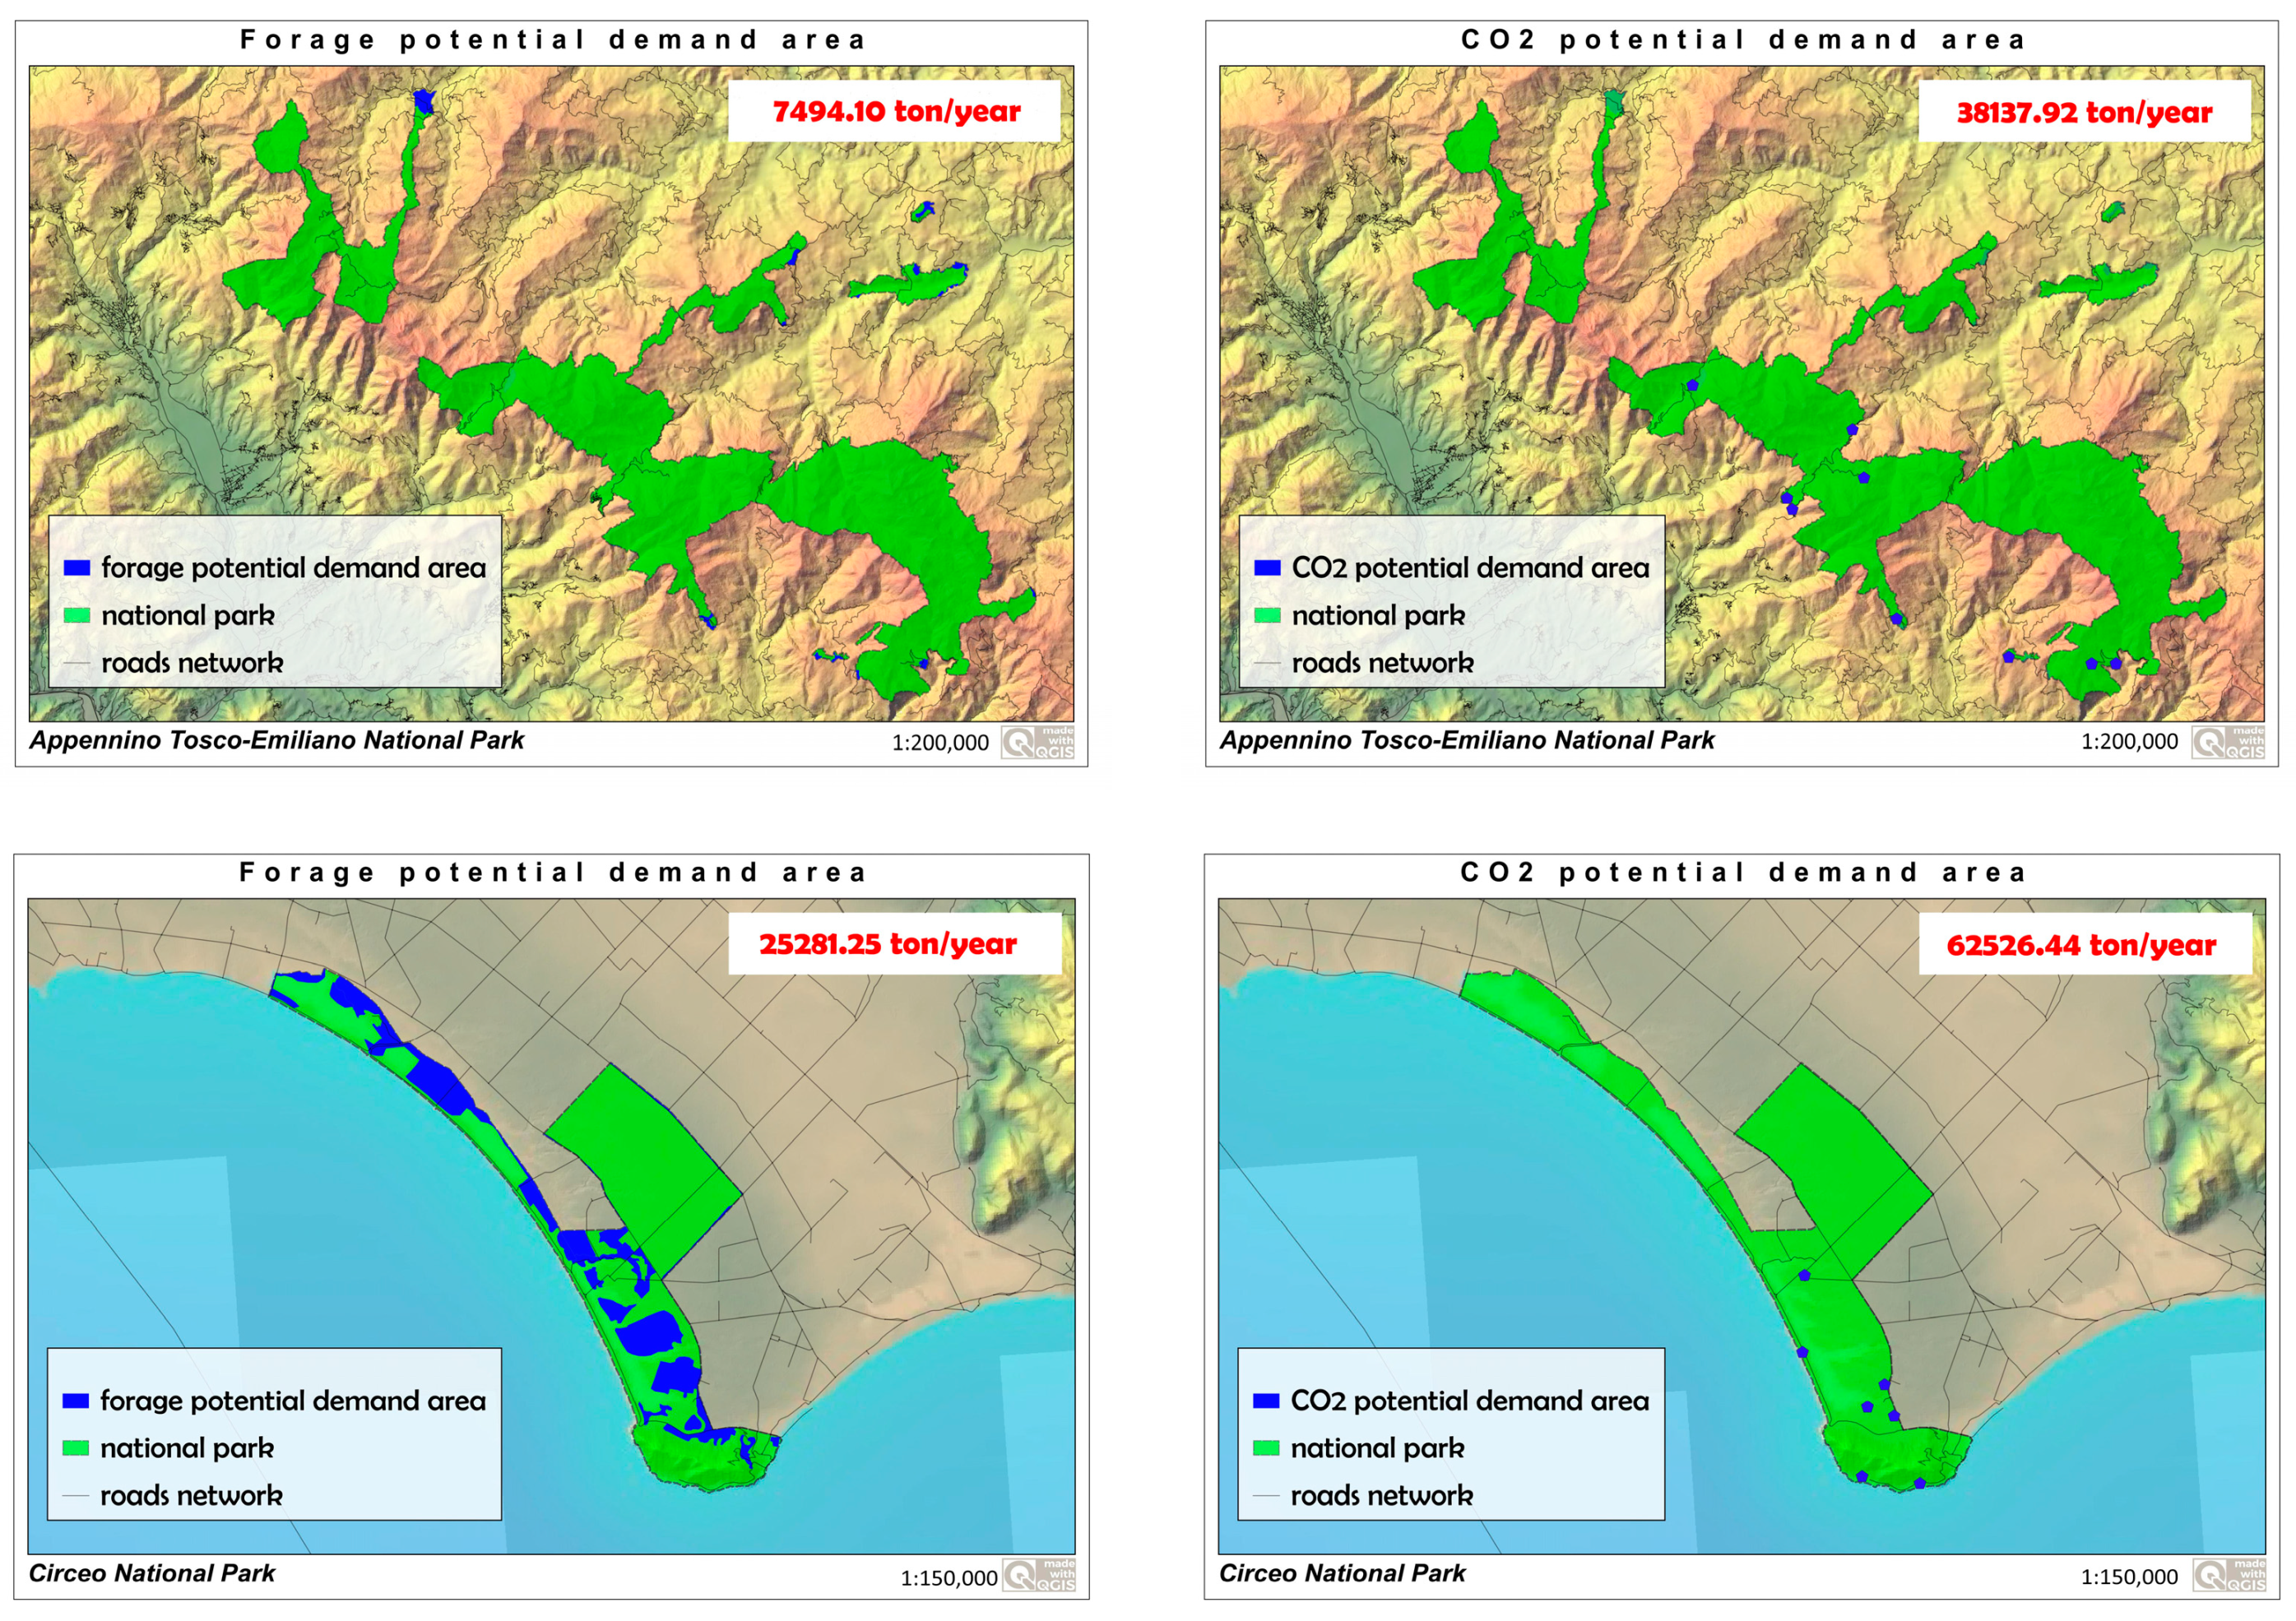
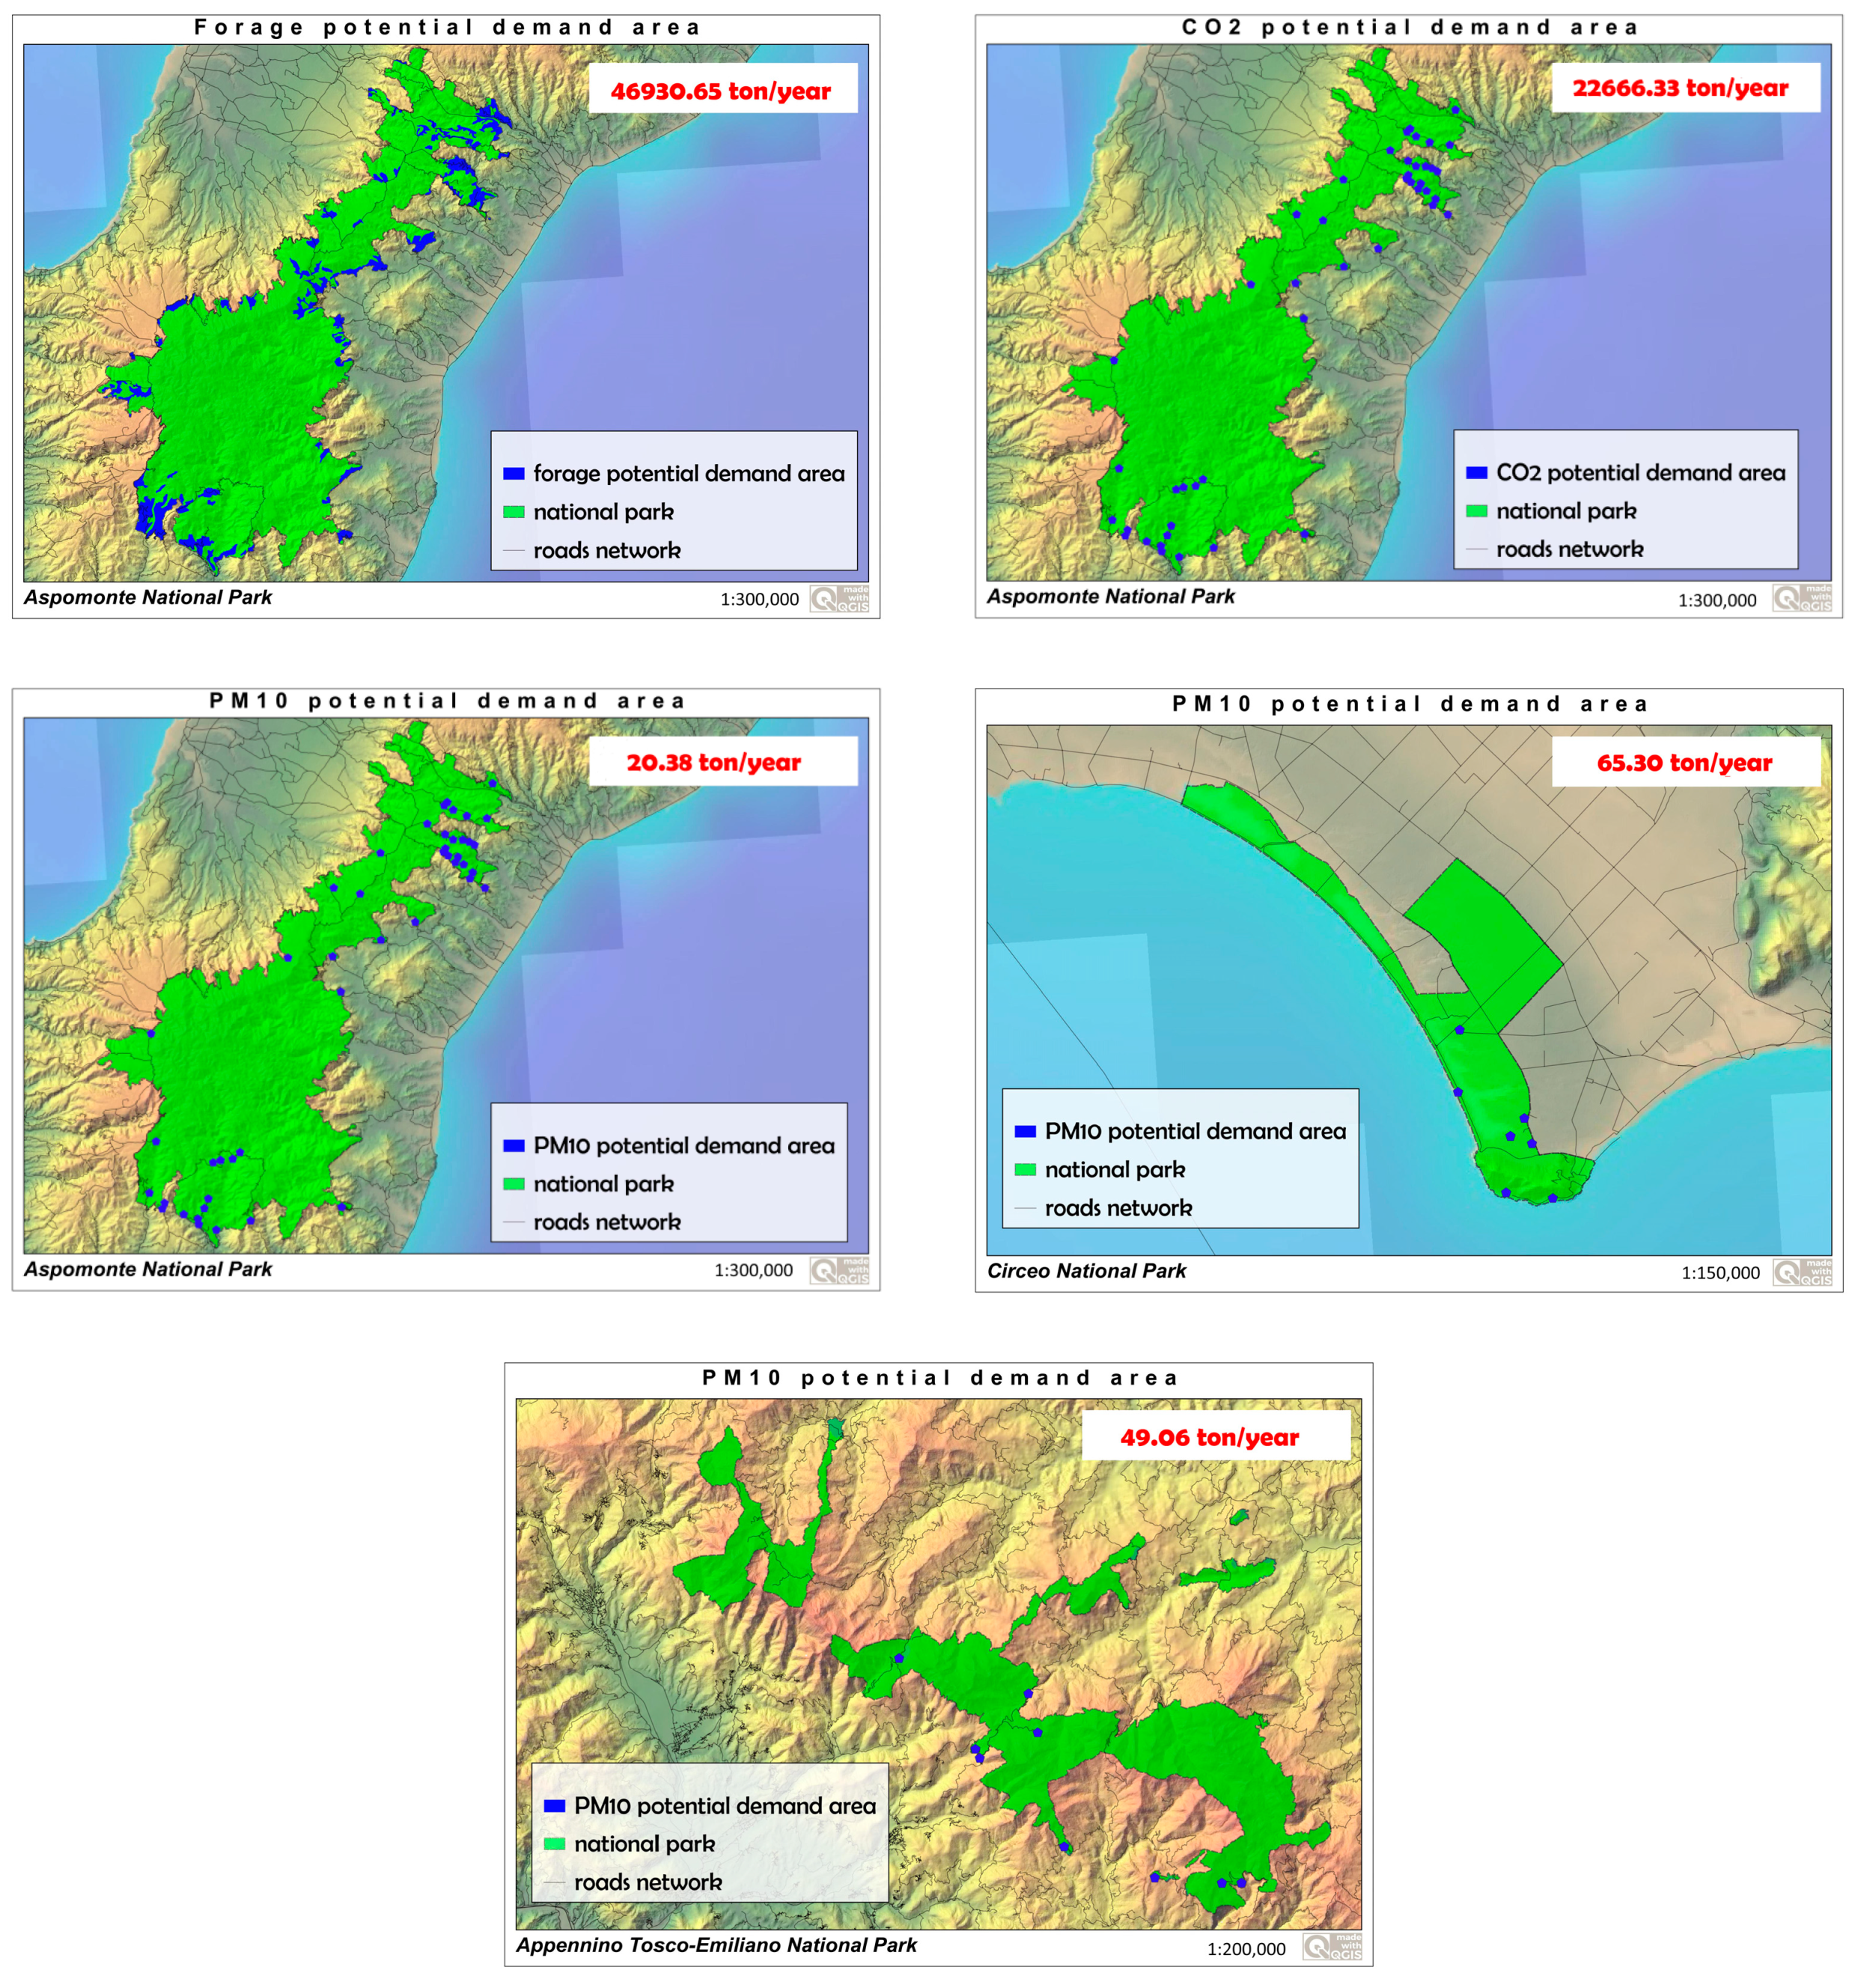
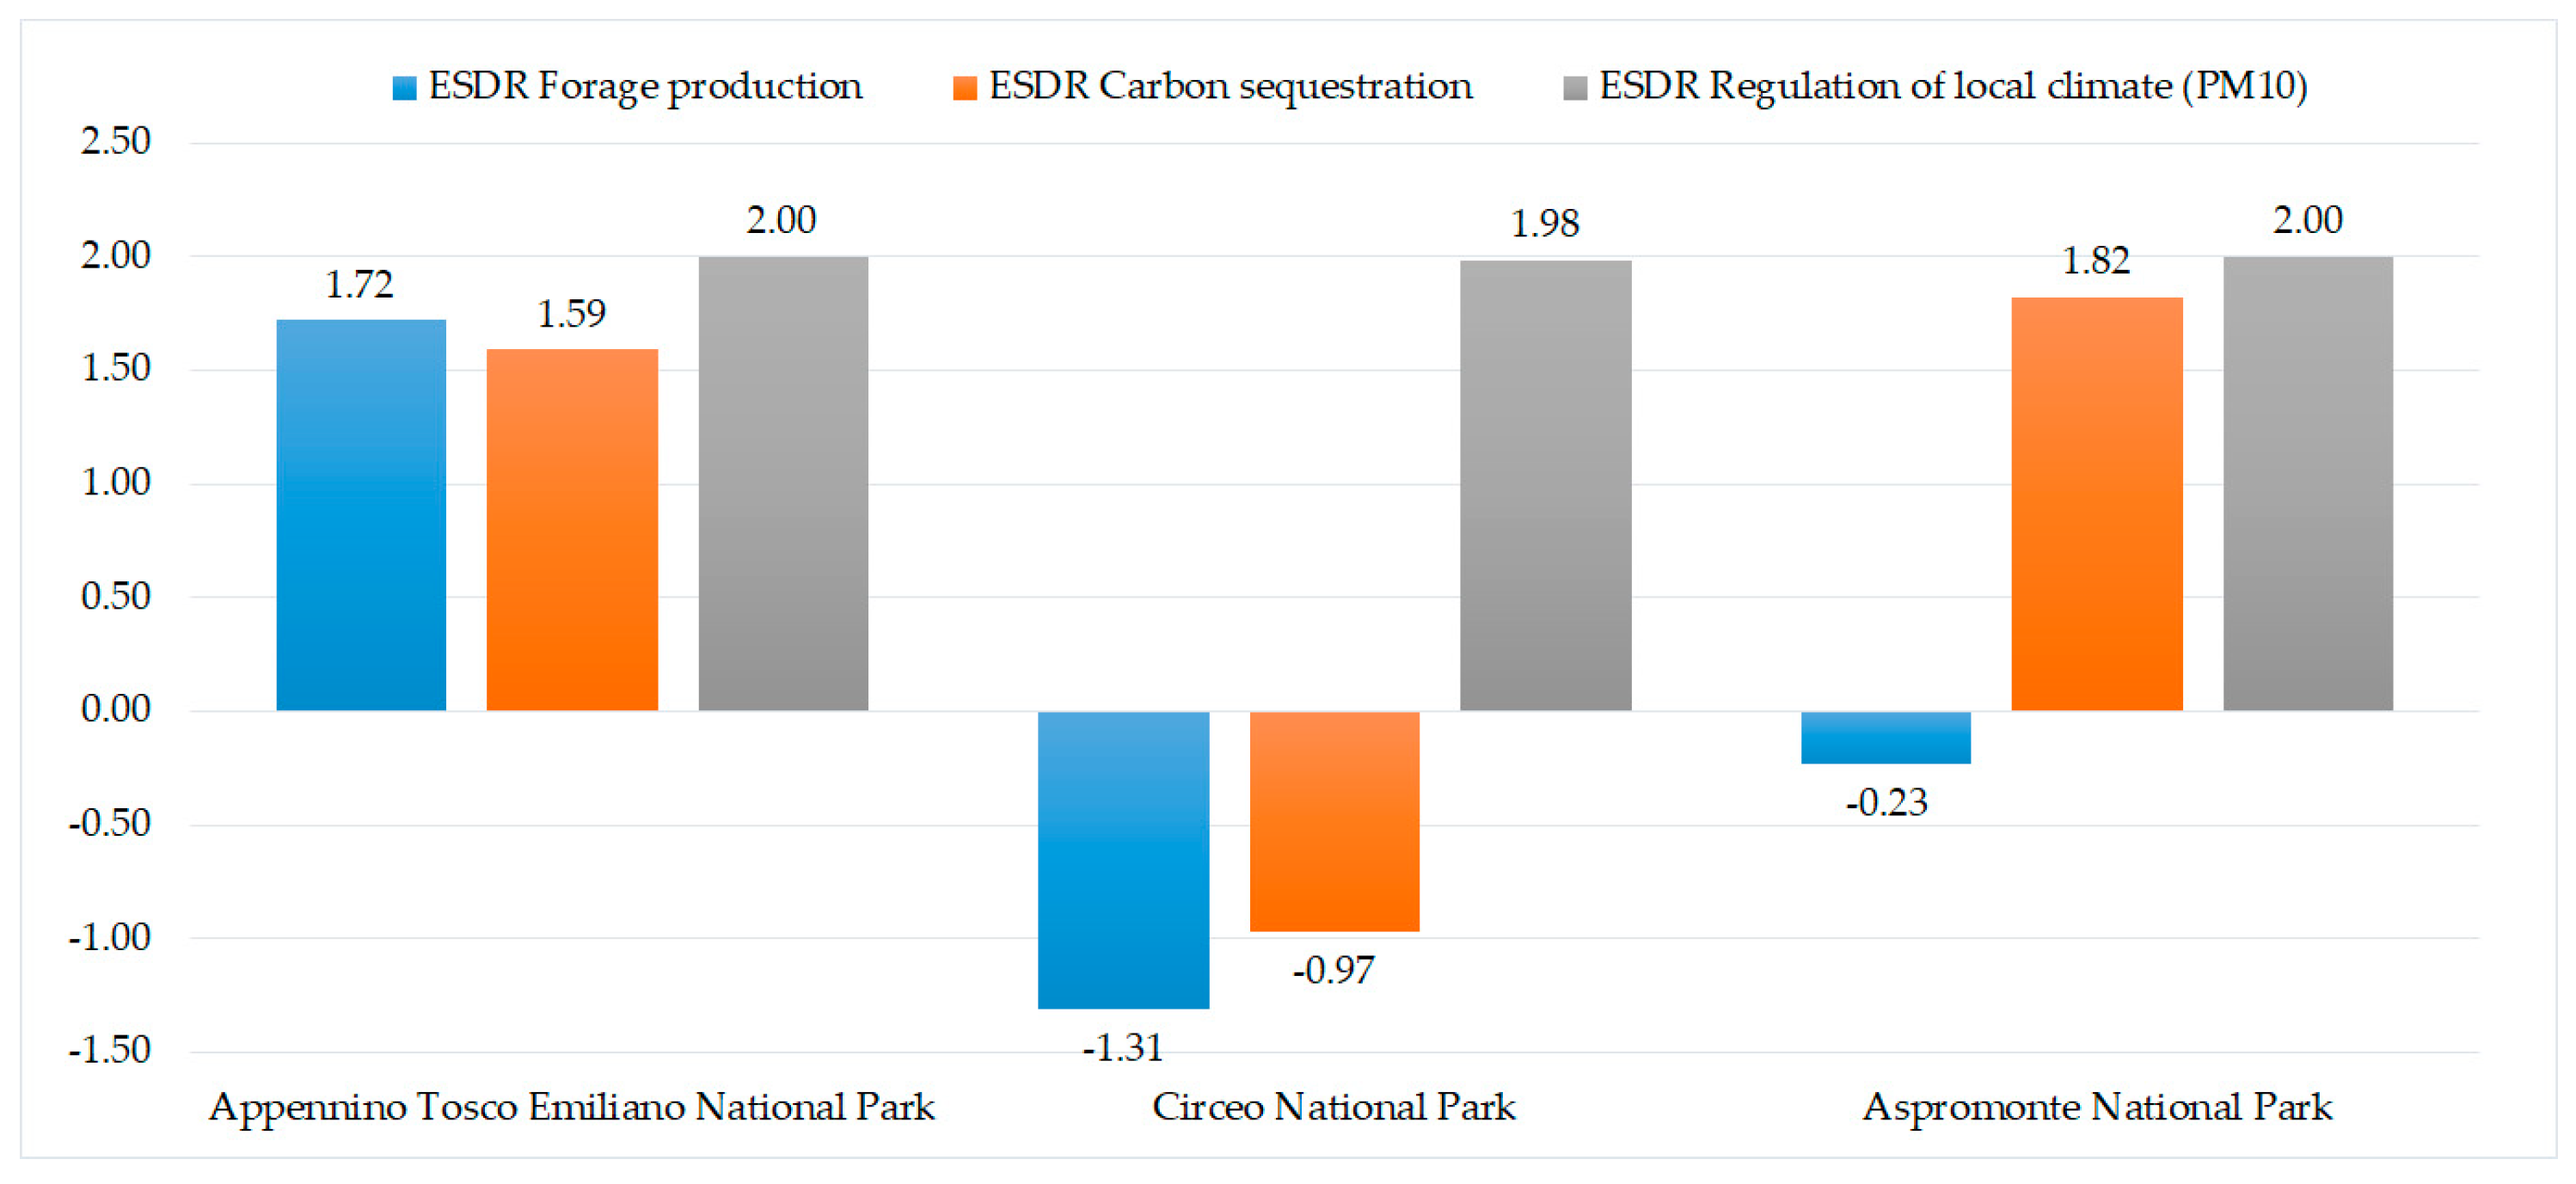

| UEPA Code | Name | Region | Biogeographical Region | Extend (ha) | Main Land Cover (%) | City (n.) | Population (2015) (n. inhabitants) |
|---|---|---|---|---|---|---|---|
| EUAP1158 | Appennino Tosco Emiliano National Park | Emilia-Romagna, Tuscany | Continental | 22,800 | 78.5 forest; 17.5 pastures | 13 | 5,600 |
| EUAP0004 | Circeo National Park | Lazio | Mediterranean | 5,620 | 47.5 forest; 19.4 arable; 12.5 water basins | 4 | 20,400 |
| EUAP0011 | Aspromonte National Park | Calabria | Mediterranean | 64,150 | 62.9 forest; 4.6 pastures; 16.6 agricultural land | 37 | 18,050 |
| National Park | Natural Capital Habitat N2000 | Social Capital | Economic Capital | Beneficiaries | ||
|---|---|---|---|---|---|---|
| Built Capital | Human Capital | |||||
| Private | Public | |||||
| Appennino Tosco Emiliano | 3140; 3150; 3240; 3250; 3260; 3270; 4030; 4060; 5130; 6110; 6170; 6210; 6230; 6410; 6430; 6510; 6520; 7140; 7210; 8110; 8130; 8220; 9110; 9150; 9180; 91E0; 9210; 9220; 9260; 92A0 | Companies: agri-food, agricultural, zootechnics. Activities: commercial, tourist. Rural settlements housing. | Operators in the agricultural, livestock, trade, and tourism sectors. Local population. | Managing bodies, Local Authorities. | Pastoralism and breeding, agriculture, harvesting and processing of undergrowth products, beekeeping, fruit and vegetable activities, tourism. | Local population; breeders, farmers, tourists, urbanized areas |
| Circeo | 1150 *; 1210; 1240; 1310; 1410; 1420 1510 *; 2110; 2120; 2190; 2210; 2230; 2240; 2250 *; 2270 *; 3170 *; 5210; 5320; 5330; 6220 *; 6420; 8210 9180 *; 9190; 91B0; 91M0; 9280; 9330; 9340 | Companies: zootechnics, viticulture, oil producers, agricultural. Activities: tourism, commercial. Seaside resorts, housing. | Farmers, breeders, tour operators, trade operators. Local population. | Farming agriculture, tourism, trade, production, processing, and marketing of agricultural products (oil, wine), seaside tourism. | ||
| Aspromonte | 3150; 3170 *; 3270 3280; 4090; 5330; 5332; 5430; 6175; 6220 *; 6420; 6430; 6431; 7110 *; 7220 *; 8210; 8220; 9110 *; 9180 *; 92A0; 92D0; 9210 *; 9220 *; 9260; 9280; 9330; 9340; 9510 *;9530 *; 9560 * | Companies: horticultural, fruit and vegetable. Craft activities, rural, and pastoral settlements. | Farmers, Breeders, Operators in the agri-food sector, craft activities workers. Local population. | Oil production, Pastoralism, and breeding, production, processing, and marketing of agricultural products (fruit, vegetables, oil, wine), artisanal production, tourist activities. | ||
| ES | National Parks | Demand (t/year) | Supply (t/year) | Economic Value (€) |
|---|---|---|---|---|
| Forage production | Appennino Tosco Emiliano | 7494.10 | 99,409.76 | 12,426,219.56 ** |
| Circeo | 25,281.25 | 5252.92 | 656,615.24 ** | |
| Aspromonte | 46,930.65 | 37,147.66 | 4,643,457.03 ** | |
| Carbon sequestration | Appennino Tosco Emiliano | 38,137.92 | 333,280.04 | 124,943,354.20 * 8,042,047.37 ** |
| Circeo | 62,526.44 | 21,619.9 | 8,105,110.55 * 521,689.88 ** | |
| Aspromonte | 22,666.33 | 491,589.16 | 184,291,860.19 * 11,862,046.43 ** | |
| Regulation of local climate (PM10) | Appennino Tosco Emiliano | 49.06 | 52,066.08 | 285,562,143.03 * |
| Circeo | 65.30 | 13,518.00 | 74,140,957.98 * | |
| Aspromonte | 20.38 | 111,770.97 | 613,014,697.90 * |
| ES | Indicator Flow | Indicator Demand | Service Providing Units (SPU) (Hotspots) | Service Benefiting Areas (SBA) | Spatial Relation SPU-SBA | Governance Protected Areas Benefits |
|---|---|---|---|---|---|---|
| Forage production | Average forage production | Consumption of forage on farms | Areas of grassland and pastures | Head of cattle | In situ; Decoupled | Regional Private |
| Carbon sequestration | CO2 captured by forest biomass | PM10 per employee per economic enterprise | Forest cover | Employees per economic enterprise | In situ - omnidirectional | Global |
| Regulation of local climate (PM10) | PM10 captured by forest biomass | PM10 per employee per economic enterprise | Forest cover | Employees per economic enterprise | In situ - omnidirectional | Global |
Publisher’s Note: MDPI stays neutral with regard to jurisdictional claims in published maps and institutional affiliations. |
© 2021 by the authors. Licensee MDPI, Basel, Switzerland. This article is an open access article distributed under the terms and conditions of the Creative Commons Attribution (CC BY) license (http://creativecommons.org/licenses/by/4.0/).
Share and Cite
Marino, D.; Palmieri, M.; Marucci, A.; Tufano, M. Comparison between Demand and Supply of Some Ecosystem Services in National Parks: A Spatial Analysis Conducted Using Italian Case Studies. Conservation 2021, 1, 36-57. https://doi.org/10.3390/conservation1010004
Marino D, Palmieri M, Marucci A, Tufano M. Comparison between Demand and Supply of Some Ecosystem Services in National Parks: A Spatial Analysis Conducted Using Italian Case Studies. Conservation. 2021; 1(1):36-57. https://doi.org/10.3390/conservation1010004
Chicago/Turabian StyleMarino, Davide, Margherita Palmieri, Angelo Marucci, and Massimo Tufano. 2021. "Comparison between Demand and Supply of Some Ecosystem Services in National Parks: A Spatial Analysis Conducted Using Italian Case Studies" Conservation 1, no. 1: 36-57. https://doi.org/10.3390/conservation1010004
APA StyleMarino, D., Palmieri, M., Marucci, A., & Tufano, M. (2021). Comparison between Demand and Supply of Some Ecosystem Services in National Parks: A Spatial Analysis Conducted Using Italian Case Studies. Conservation, 1(1), 36-57. https://doi.org/10.3390/conservation1010004


