Article

Observing Spatiotemporal Inconsistency of Erosion and Accretion in the Barak River Using Remote Sensing and GIS Techniques

1
National Institute of Technology, Silchar 788010, Assam, India
2
Institute of Technology, University of Kashmir, Srinagar 190006, Jammu and Kashmir, India
3
Department of Geography, Gauhati University, Guwahati 781014, Assam, India
4
Department of Ecology, Environment, and Remote sensing, Government of Jammu and Kashmir, Srinagar 190018, Jammu and Kashmir, India
*
Author to whom correspondence should be addressed.
Conservation 2023, 3(1), 14-31; https://doi.org/10.3390/conservation3010002
Submission received: 4 October 2022 / Revised: 19 December 2022 / Accepted: 20 December 2022 / Published: 26 December 2022

Abstract

:
Alluvial rivers all over the world have one common problem, which is their meandering pattern. This meander formation is because of natural and anthropogenic processes. Barak River is dynamic, and due to this, it is exposed to regular shifting and creates many problems for the people who reside near the river. The livelihood of many people depends on agriculture, which they conduct on the nearby sides of the river. However, the regular shifting of riverbanks makes their life miserable and leads to severe economic losses. Further, roadways and railways run along the banks of the Barak River, and during monsoon, Assam (Silchar), along with three states, Mizoram, Manipur, and Tripura, become disconnected from the rest of India because the road and rail connections fail due to riverbank erosion. Therefore, considering the catchment area and the importance of this river, we have tried to understand the spatiotemporal changes (erosion, deposition, and unchanged area) in the Barak River. From our analysis, we found that the maximum and minimum amount of erosion occurred from 2012–2017 and 2002–2012 and were 727.56 ha and 332.69 ha, respectively. While the highest amount of deposition that occurred during 1984–2017 was 1054.21 ha, the minimum amount of deposition that occurred during 2012–2017 was 351.32. Overall, it was identified that the area under the deposition was more dynamic than the erosion from 1984–2017. Moreover, from the temporal analysis of land use/land cover from 1984–2017, it was found that the area that comes under the settlement and arable land has increased by 10.47% and 5.05%, respectively. The dynamic factors, such as the nature of channel gradient, land use/land cover, and riparian vegetative cover, could be the probable driving forces that cause changes in the erosional and depositional areas. This study will help us understand the dynamics of the Barak River and other rivers of this type worldwide. This study shall help implement strategies that will help manage bank erosion by adapting scientific bank protection measures.

1. Introduction

Floodplain rivers serve as a stunning morphometric representation of the alluvium region. One of the most ancient expressions of the river channel in the floodplain area is the formation of meanders and river meandering processes. Studying meandering patterns and their effects on floodplain regions is the fundamental goal of river dynamics. The meandering form that alluvial rivers most frequently adopt causes lateral migration and, as a result, geomorphic dangers [1]. River morphology varies regionally and temporally under diverse environmental conditions [2,3,4,5,6,7,8]. This morphological behavior is more frequent in alluvial rivers [9]. Bank erosion is a geomorphic process in the river channel at the time of a flood or after a flood. Freely flowing rivers have a curving channel with a concave side eroded, and a convex side deposited as a point bar [10]. The size and shape of the river channel alter as a result of this geomorphic process [11]. Alluvial rivers are dynamic by nature; bank erosion is a frequent occurrence and is accompanied by the regular shifting of the river channel, which can be disastrous for those who live close to the riverside [12].
It is a common natural phenomenon of erosion and deposition that occurs on a riverbank, mainly because of its erosion and deposition [13]. Other common factors also have a significant effect on this erosion–accretion process, like physical parameters such as adjacent land use, topography, soil characteristics of the riverbank, watershed area, and other hydraulic and hydrological properties such as river discharge, flow velocity, and rainfall impact [14,15,16]. Moreover, other man-made activities like the construction of hydraulic structures such as dams, flumes, sluice gates, agriculture and irrigation, and infrastructural activities like road development and building construction have also deeply impacted the natural flow of the river [17]. These factors affect the river flow as well as decide the sediment transport processes, which ultimately change the physical behavior of the river [18,19]. Anthropogenic activities mainly affect the dynamic equilibrium of rivers, and sometimes the overexploitation of natural resources leads to changes in hydraulic and hydrological parameters [7]. These factors change the process of bank erosion and may enhance the rate of change of migration or meandering. A river is normally unsteady in nature, but a rapid change in discharge enhances the changes in meandering geometry, bend curvature, and acceleration to form a cutoff. Understanding the dynamics of the channel within the floodplains is essential to minimize the cost of project maintenance [20,21]. It is necessary to monitor channel behavior to mitigate disasters due to floods and drought [22]. Erosion and accretion and their effects on the evolution of channels are crucial geomorphic research problems relevant to various scientific and engineering fields [23]. For planning and river training work, it is essential to study channel dynamics that provide a strong understanding of the magnitude and occurrence of erosion and accretion [24,25].
Ground surveying is time-consuming and requires precise measurement, which changes after every flood event, to study the meandering of a river in river reach. Therefore, advanced techniques like geospatial tools and remote sensing data are suitable for finding the changes that occur over time at regular intervals at a planned scale [26,27,28]. In different studies conducted on various major rivers of the world, it has been found that for monitoring river erosion or accretion, geospatial techniques are more appropriate. Yang et al. (1999) employed satellite remote sensing and GIS to analyze channel river migration in the Yellow River Delta in China. They discovered that as flow decreases, the river transforms from a braided river to a weak meandering river [29]. Geospatial approaches were used in research on the Ganga River in India by Pati et al. (2008), and they discovered that the river is altering its route through time and space [30]. Research on the Ebro River in Spain (Ollero, 2010) found that bank erosion had caused the river to shift 7 km over the last 80 years [31]. An integrated approach of geographical information systems and remote sensing has been used by Archana et al. (2012) on the Brahmaputra River in India from upstream to downstream and found that the configuration of the river channel system has changed from 1990–2008 [32]. Another study conducted by Mount et al. (2013) on the Jamuna River, Bangladesh, found that bank erosion has occurred at various distinguished spatial and temporal scales [33]. A study was conducted in India by Dhari et al. (2015) with the help of RS and GIS on the Ganga River and found that the river has changed its course from a straight to a braided channel [34]. The Tammaro River in Italy underwent a small widening and a significant rise in the area of sand bars, sinuosity, and river length, according to a GIS-aided historical map study from 1870 to 1955 [35]. Using GIS and aerial imagery, Yousefi et al. (2017) evaluated the channel morphology of the Talar River’s meandering reach and found that the beach area and sediment bar had decreased by 90 and 97 percent, respectively, over the previous 45 years [36]. With the help of Landsat and hydrological data, Dewan et al. (2017) studied the Ganges-Padma River system in Bangladesh and found that bank erosion rates were significantly correlated with annual average discharge for the Padma River (r2 = 0.6283) and that the Ganges bank erosion rate is influenced by mean flood flow (r2 = 0.6738) [37].
A study was conducted on the Barak River, where it was observed that erosion of the bank occurred at regular intervals from 1984–2017 in its alluvial plains, due to which the river has changed its course [38,39]. It was also found that there are many locations on this river where a large amount of shifting of banks has already occurred [40]. The livelihood of many people depends on agriculture, which they usually engage in on the nearby sides of the river. However, regular riverbank shifting makes their life miserable and leads to severe economic losses. Further, most of the national highways are along the Barak River, and many new road-widening projects are coming soon. During the monsoon, Silchar, as well as three other states, Mizoram, Manipur, and Tripura, are disconnected from the rest of India because the road and rail connections fail due to landslides and riverbank erosion.
There has not been much research on the Barak River’s temporal and spatial channel alterations. Due to the river’s significance and catchment area, this research paper attempted to investigate the dynamics of the Barak River and further determine the natural meandering characteristics of this type of river throughout the world. This study was conducted with the following specific objectives: to assess the erosion and accretion of the river channel between 1984 and 2017 and map changes in channel position, to identify high erosion and deposition zones using temporal remote sensing data, and to locate the areas on the river channel within the stretch that has not changed over the past three decades.

2. Materials and Methods

2.1. Study Area

The Manipur hills serve as the source of the Barak River, which then travels through the states of Mizoram and Assam. The river traverses the alluvial soil in Assam before passing across Bangladesh to arrive at the Bay of Bengal. In Bangladesh, the river splits into two streams: the Surma and Kushiyara. The Barak River’s 102 km length, from Govindapur Part II upstream to Tukergram downstream. Twelve reaches make up the additional study area and allow for in-depth analysis. The Barak River basin covers an area from 22°44′ N to 25°58′ N and 89°50′ E to 94°0′ E (Figure 1). It has been noted that the Barak River basin typically experiences subtropical weather that is warm and humid. The yearly rainfall in this basin ranges from 2500 to 4000 mm. More than 80% of this rainfall takes place from April through October. The average annual minimum (Tmin) and maximum (Tmax) temperatures are, respectively, between 17.74 °C and 19.617 °C and 25.147 °C and 29.652 °C. According to the study by Annayat and Sil (2020), the area for the study has a very sparse vegetative cover, primarily made up of bamboo brake (Bambusoideae) type plants [39]. The region was discovered to be covered in both wet and dry grasslands. When the bed material was analyzed, it was found that the soil primarily consisted of fine-grained, non-cohesive sediments, with just a small amount of silt and clay.

2.2. Methods

2.2.1. Data

Satellite images (Landsat Images) from different years, such as 1984, 1992, 2002, 2012, and 2017, served as the foundational data for the study area. The United States Geological Survey provided download links for every Landsat image (USGS). Table 1 displays the information on Landsat images for the chosen study area. Depending on the availability of satellite images, those with a time difference of 8, 10, and 5 years are retrieved. To maintain consistency, all Landsat images from December and January, or dates close to those dates, were used [41]. All images have been georeferenced and standardized to the spheroid datum and the Universal Transverse Mercator zone 46. (WGS84).

2.2.2. Methods

Identification of Erosion, Deposition, and Unchanged Area

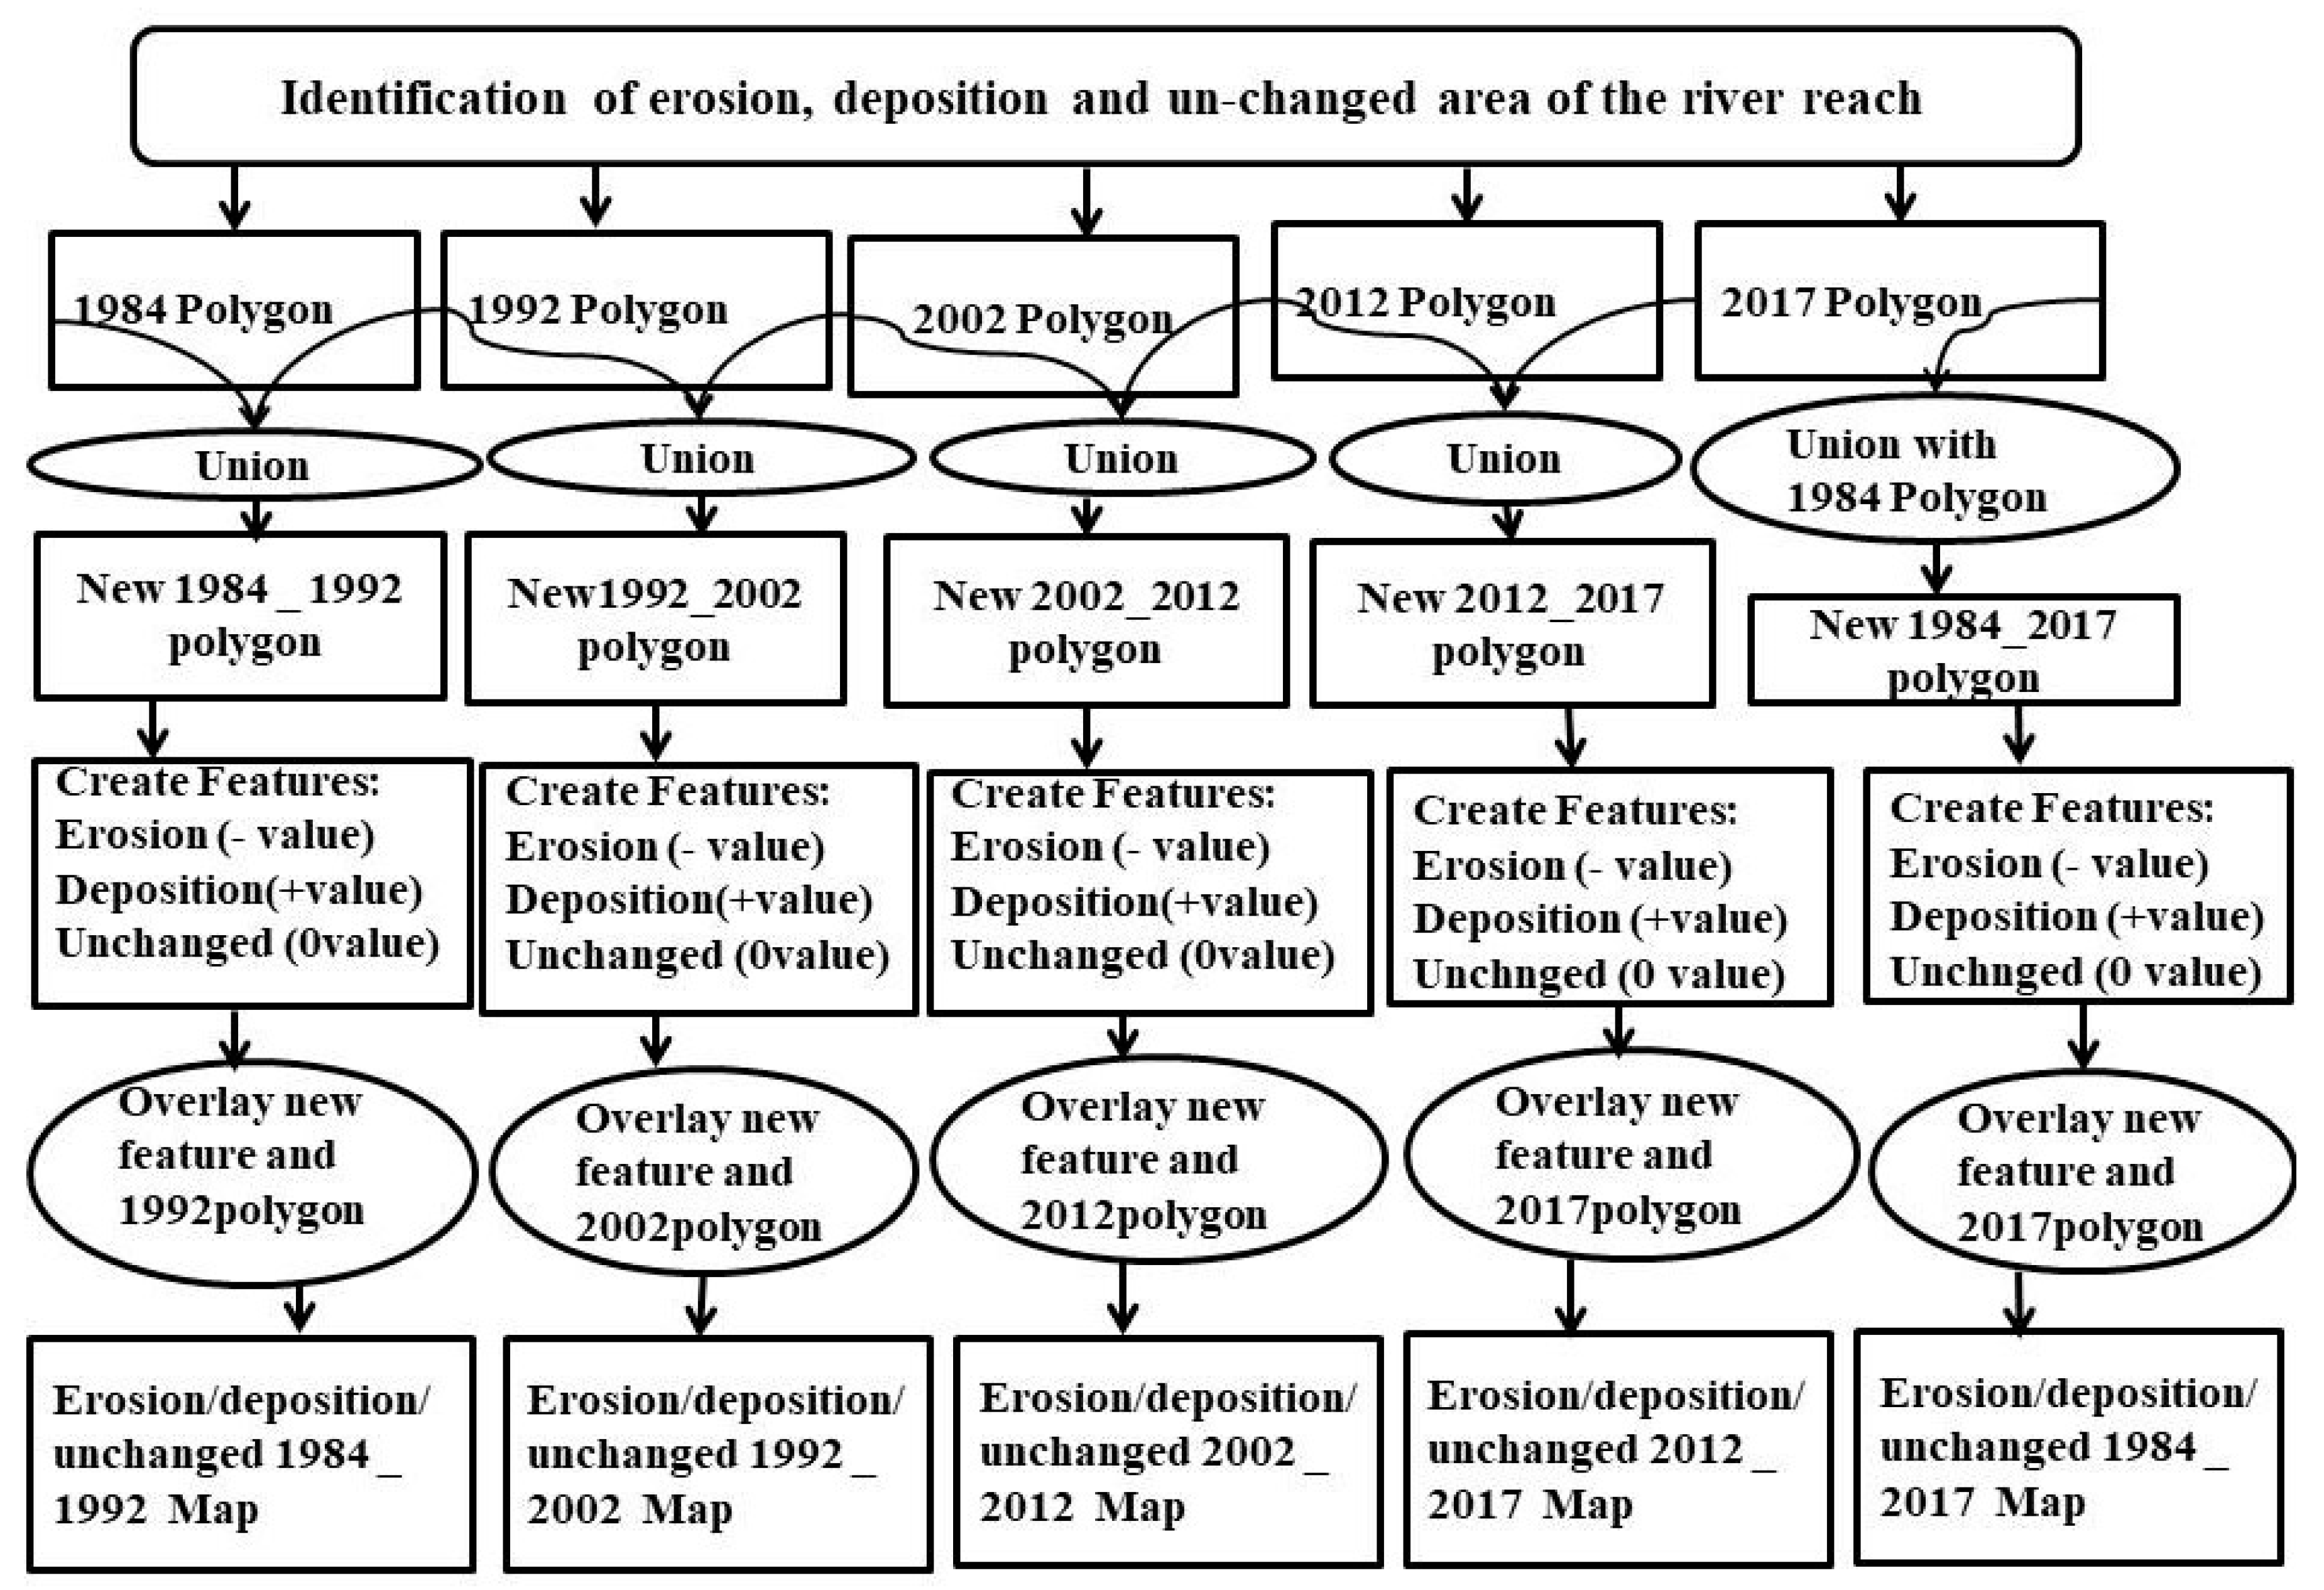
The current approach chart displays the whole study’s schematic flow diagram (Figure 2). The methodology for the temporal assessment of erosion and deposition along both banks of each reach can be found in the Padma River in Bangladesh and the Tana River in Kenya [42,43]. Filtering methods were used to pre-process the gathered Landsat data [44]. Various image processing techniques, including mosaicking, resampling, re-projection, and image enhancement, were utilized with image processing software (ERDAS envision) [45,46,47]. To extract the study area and river reaches, 60 m resolution data and 30 m resolution data were used. After that, a comparison of the Barak River’s accretion and erosion between 1984 and 2017 was conducted (i.e., 102 km and 33 years). Using multi-temporal Landsat remote sensing images, the erosion and accretion of the river are calculated for the years 1984–1992, 1992–2002, 2002–2012, 2012–2017, and 1984–2017 while taking into account 12 meandering reaches across a distance of 102 km. The research area’s course is divided into unequal distances based on the river’s physical properties and meandering pattern, with denser divisions where sinuosity is higher.
A union was made for two sequential polygons of the river for the years 1984 and 1992. Accretion and erosion are denoted by positive and negative values, which are assigned as attributes to the developed polygons. A positive attribute value means that there is a deposition, and a negative attribute value means there is erosion. However, if there is no change in their polygon area, there is neither accretion nor erosion, and it is assigned a zero-attribute value. The Landsat TM/ETM images are available for free download and are easily accessible. Landsat images with great temporal resolution have been available for the past three decades and all seasons, allowing for assessing temporal changes in river morphology. We feel more confident using Landsat data for the current study because many researchers have used it for various geomorphological analyses and have concentrated on the different morphological changes [48,49,50].

Land Use/Land Cover Classification

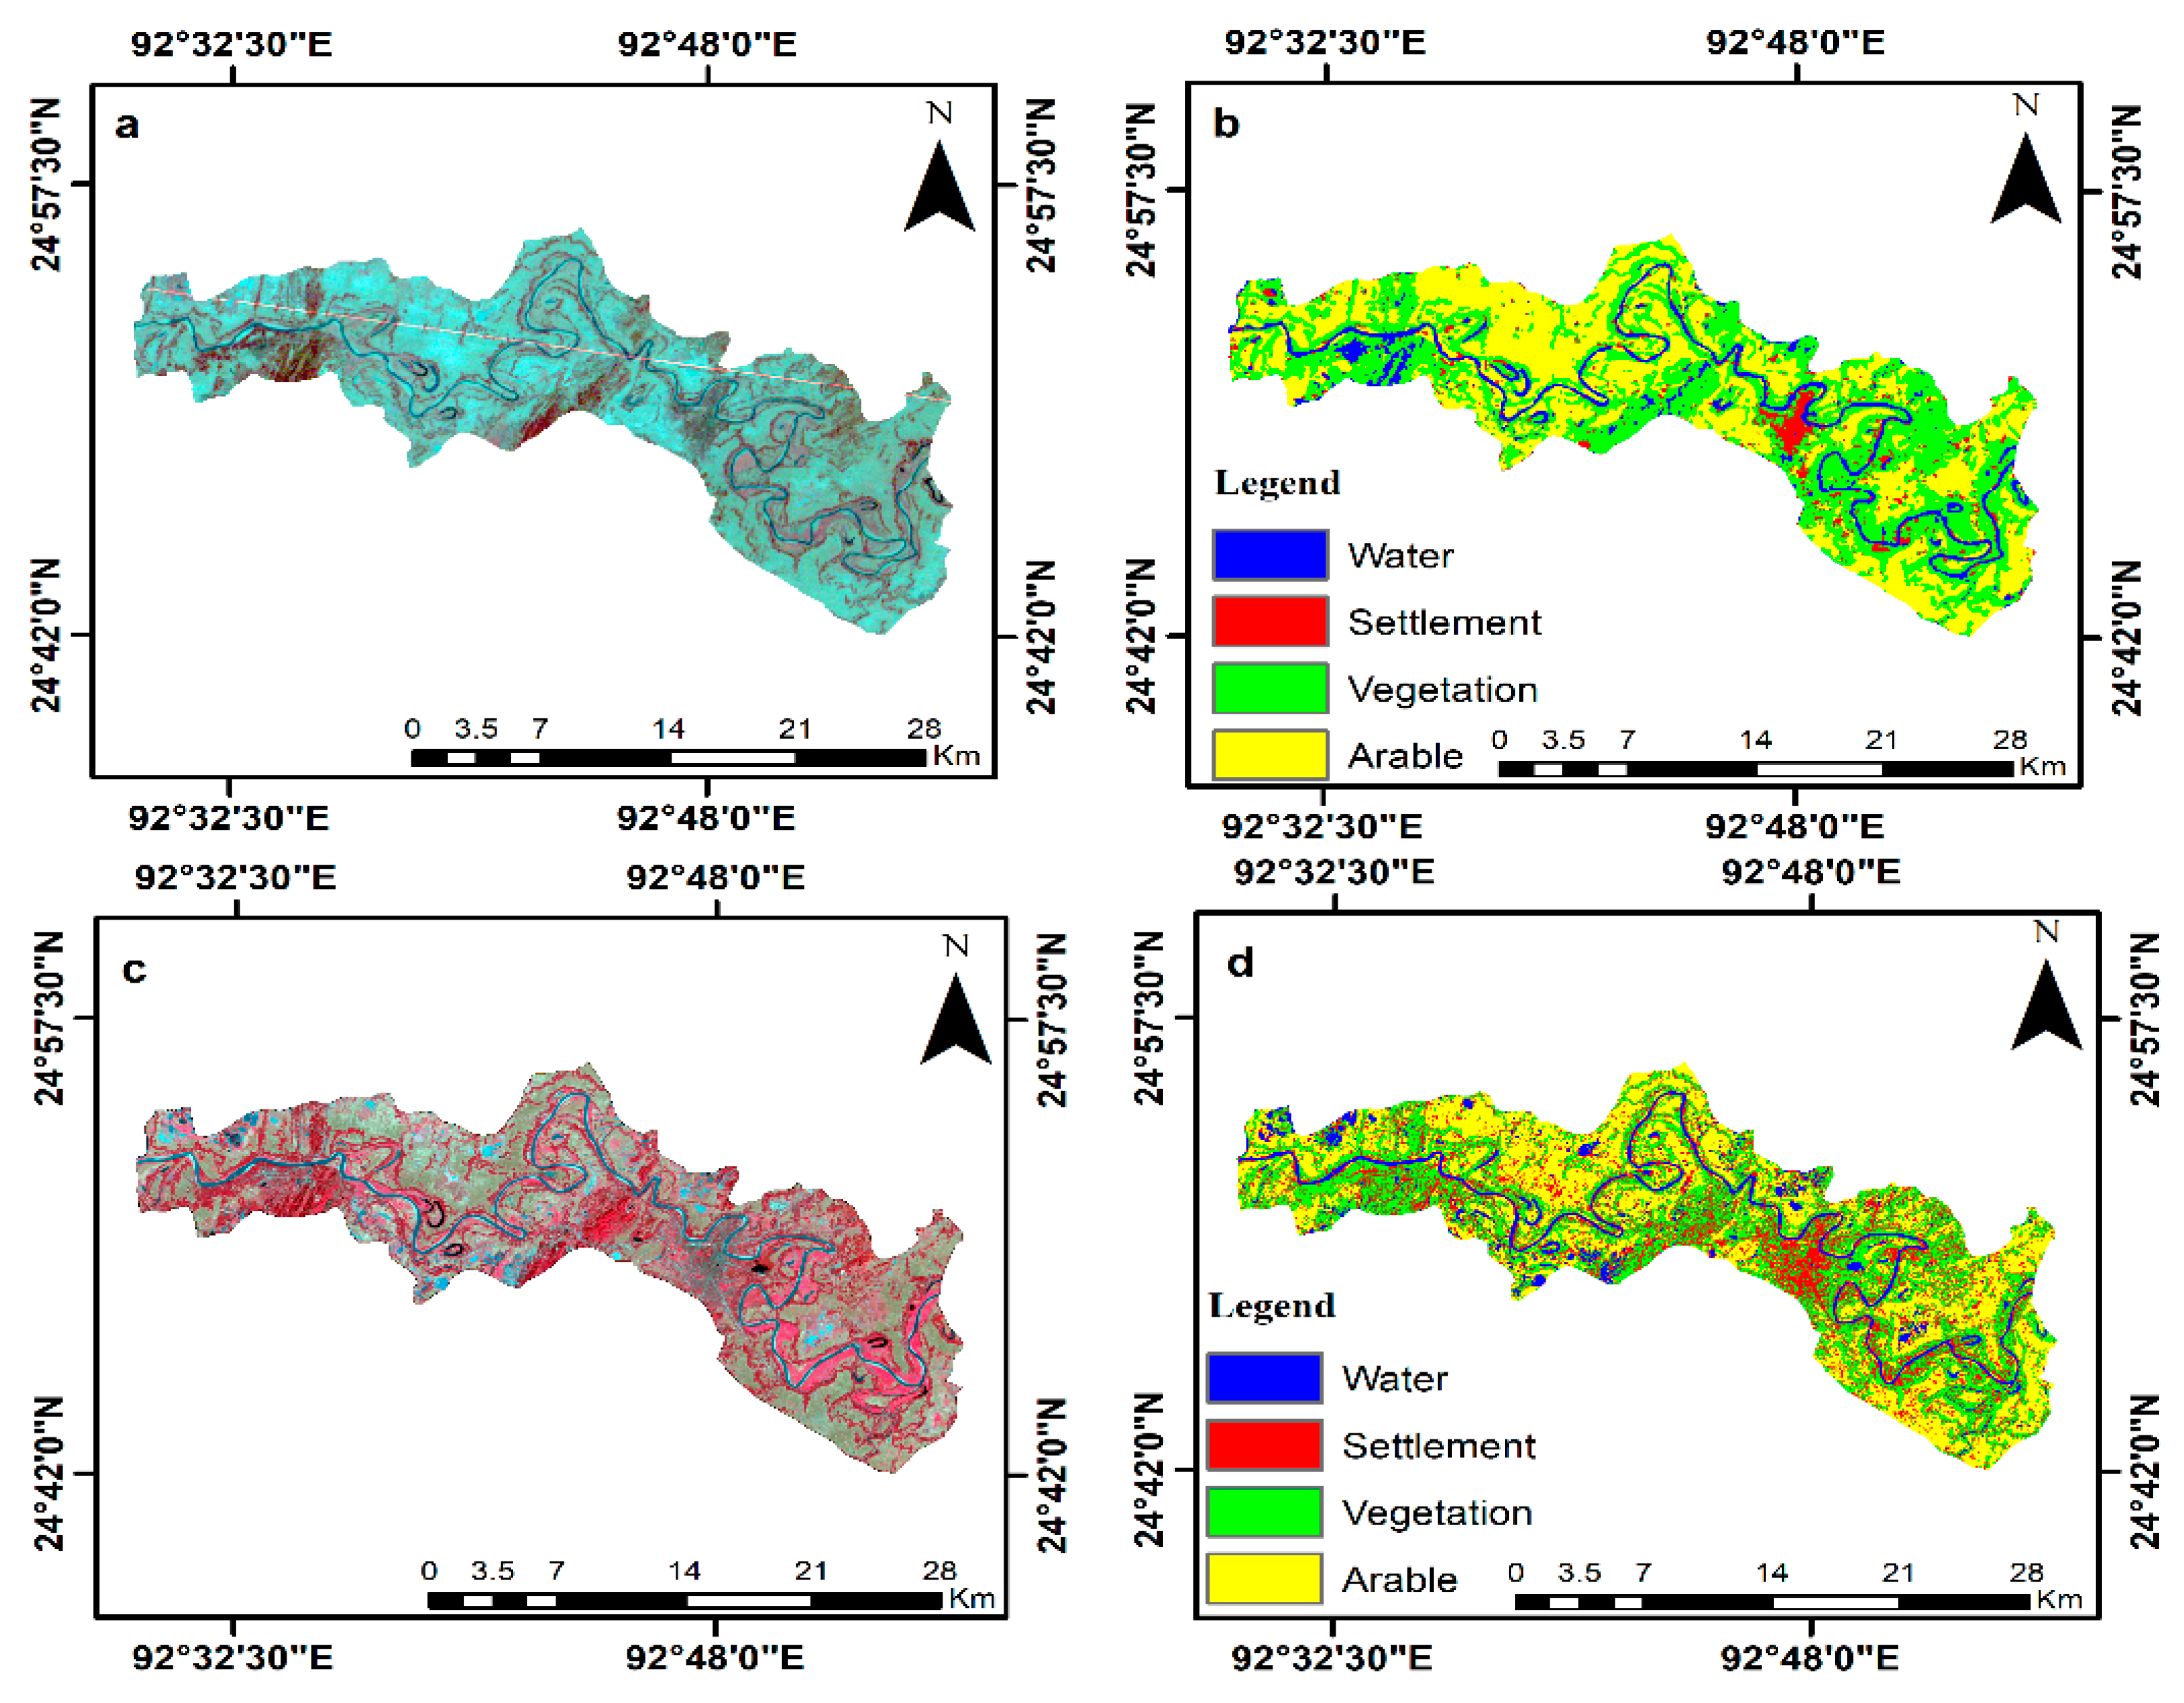
The land use land cover (LULC) map displays alterations in any location over time [51]. The area occupied by woods, agricultural land, water bodies, settlements, and other features are shown on the LULC map. In the current study, LULC maps of the various time periods were created using the supervised classification method known as Maximum Likelihood Classification (MLC). A 3 km buffer was created on both sides of the bank to study the channel movement and assess risk and vulnerability in the Barak River. The LULC maps are divided into various classes for the examination of the land cover. This study is divided into four classes: areas with water bodies, vegetation and arable land, and settlements (Figure 3). The map in Figure 4 highlights the areas where settlement and arable land growth have been investigated using time-series satellite data from 1984 to 2017.

Slope Analysis

To develop the river network for the study area, a 30 m resolution digital elevation model (DEM) was obtained from the website http://eartgexplorer.usgs.gov, accessed on 20 December 2022. A slope map was prepared, and slope values were obtained from the SRTM-DEM using the spatial analyst tool. The slope in this study area supports us in describing the several types of slopes, i.e., flat, gentle, moderate, and steep.

3. Results

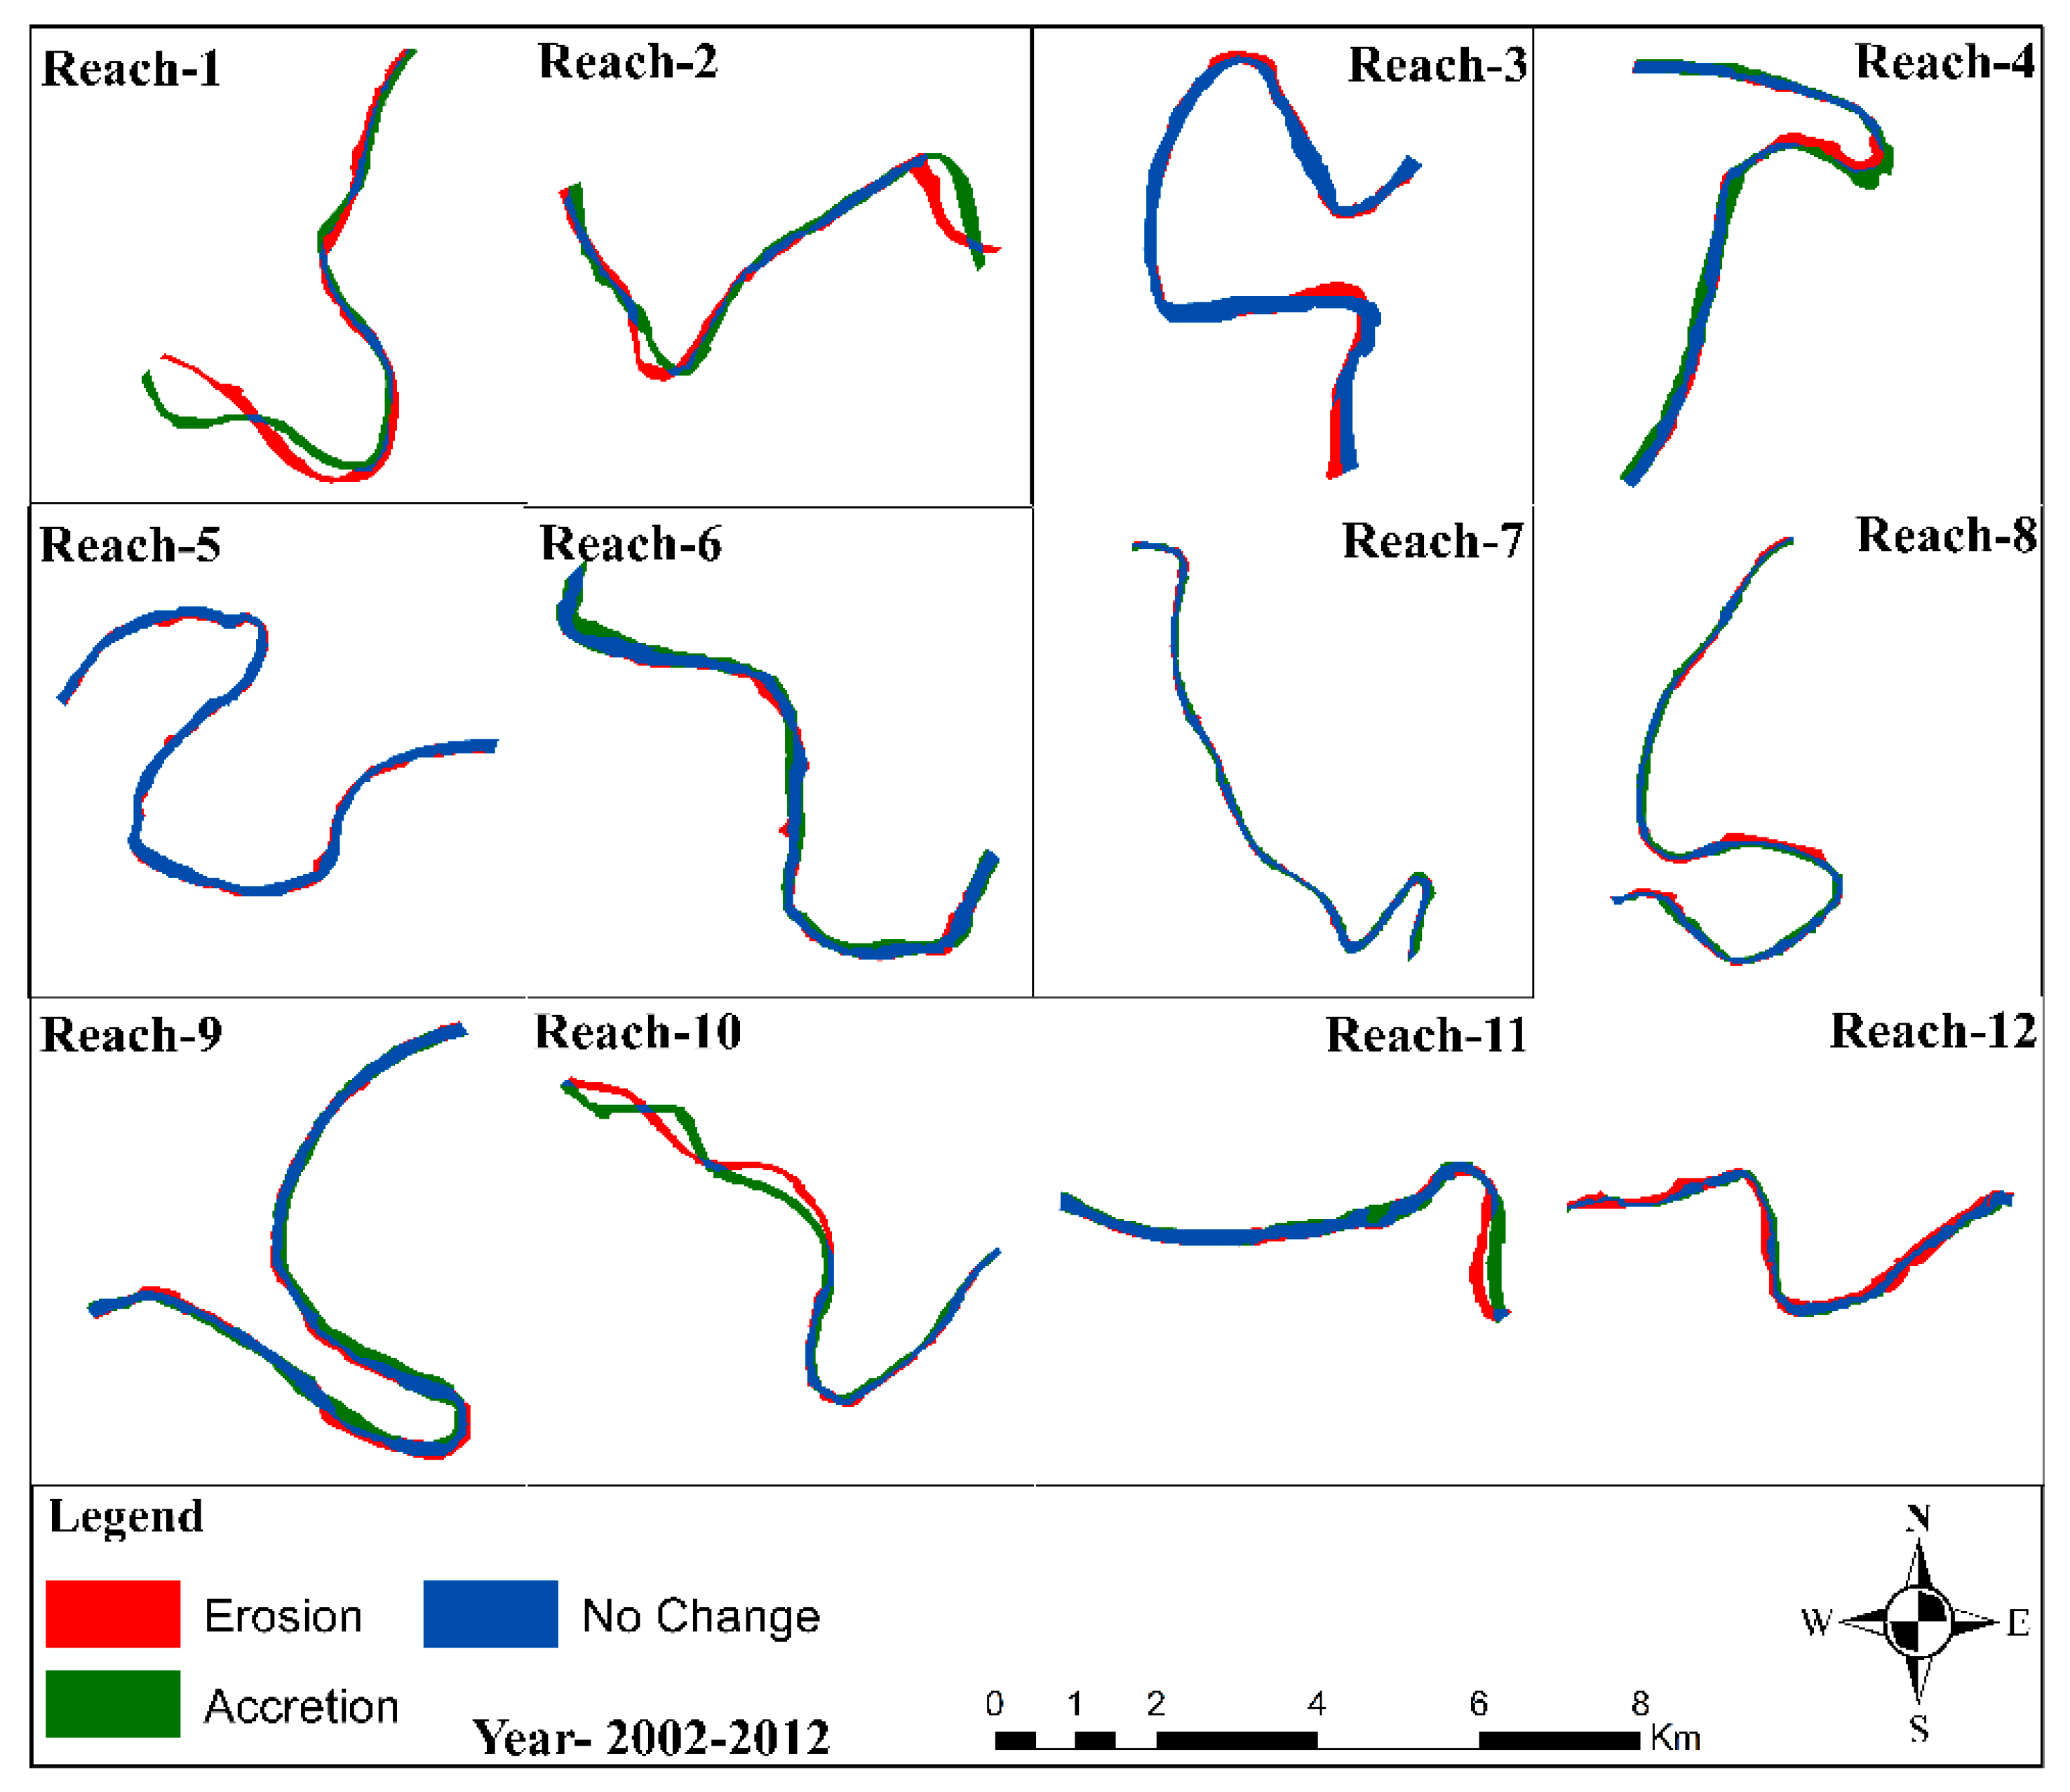
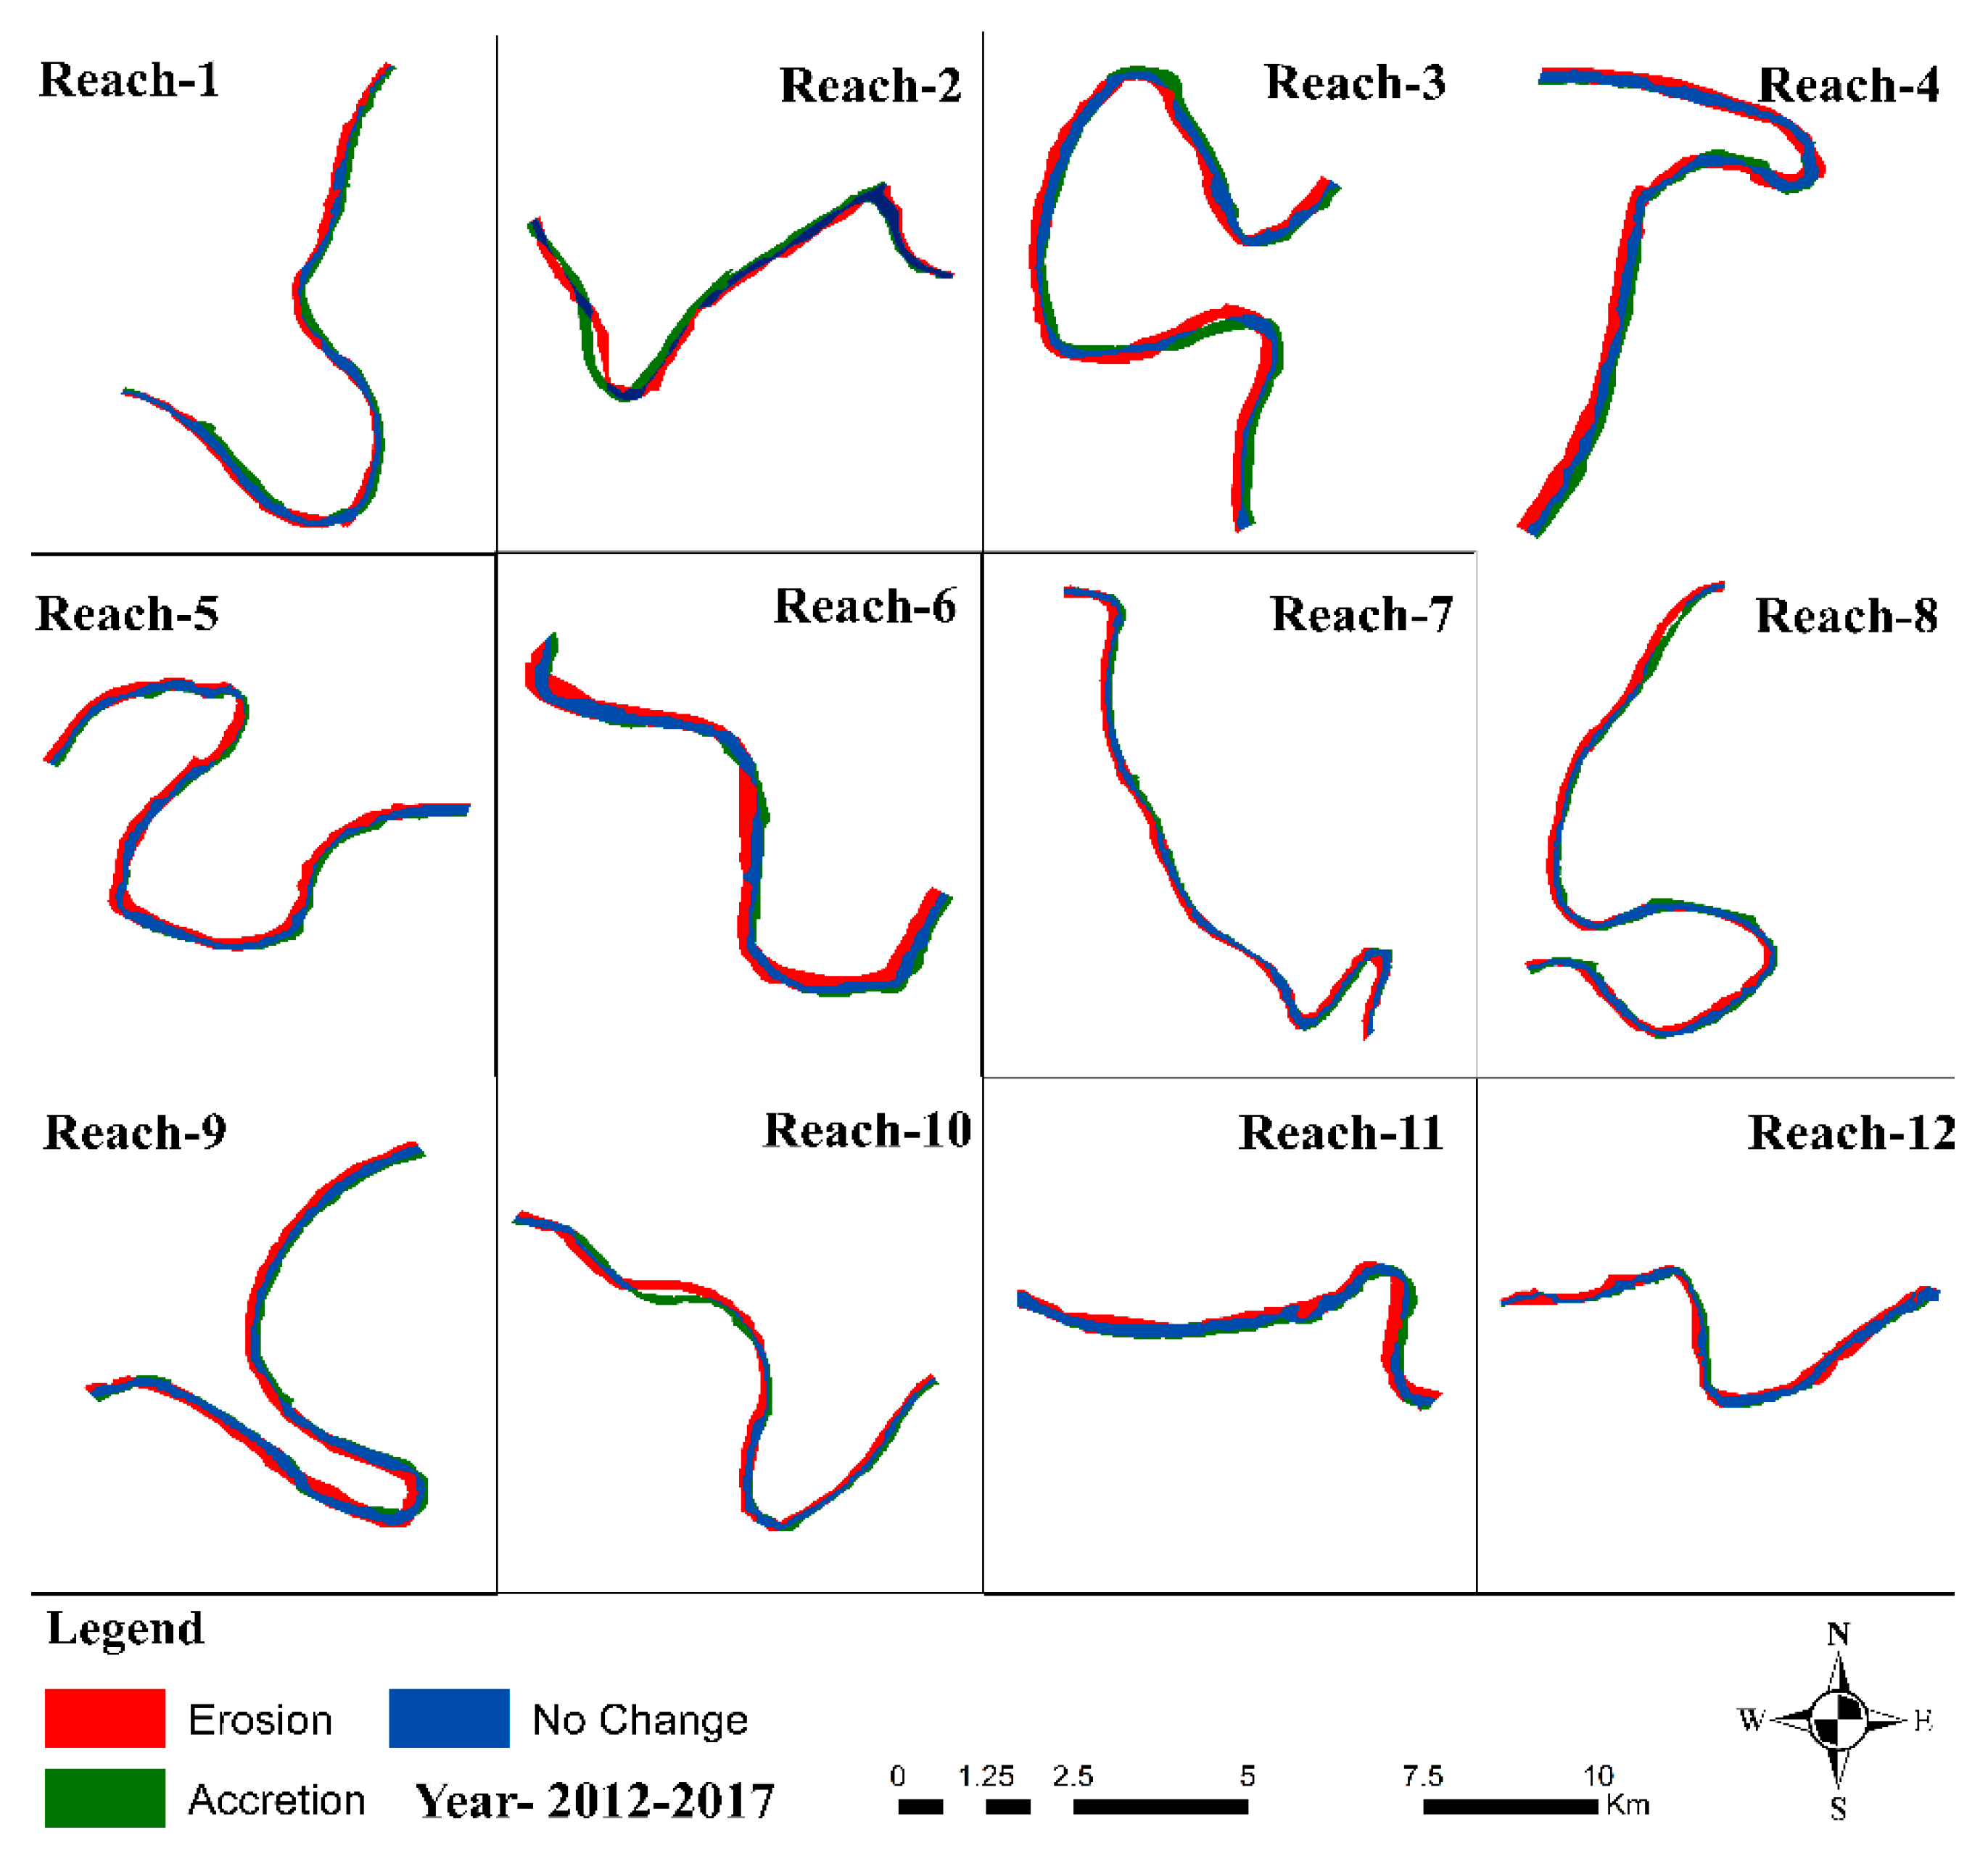
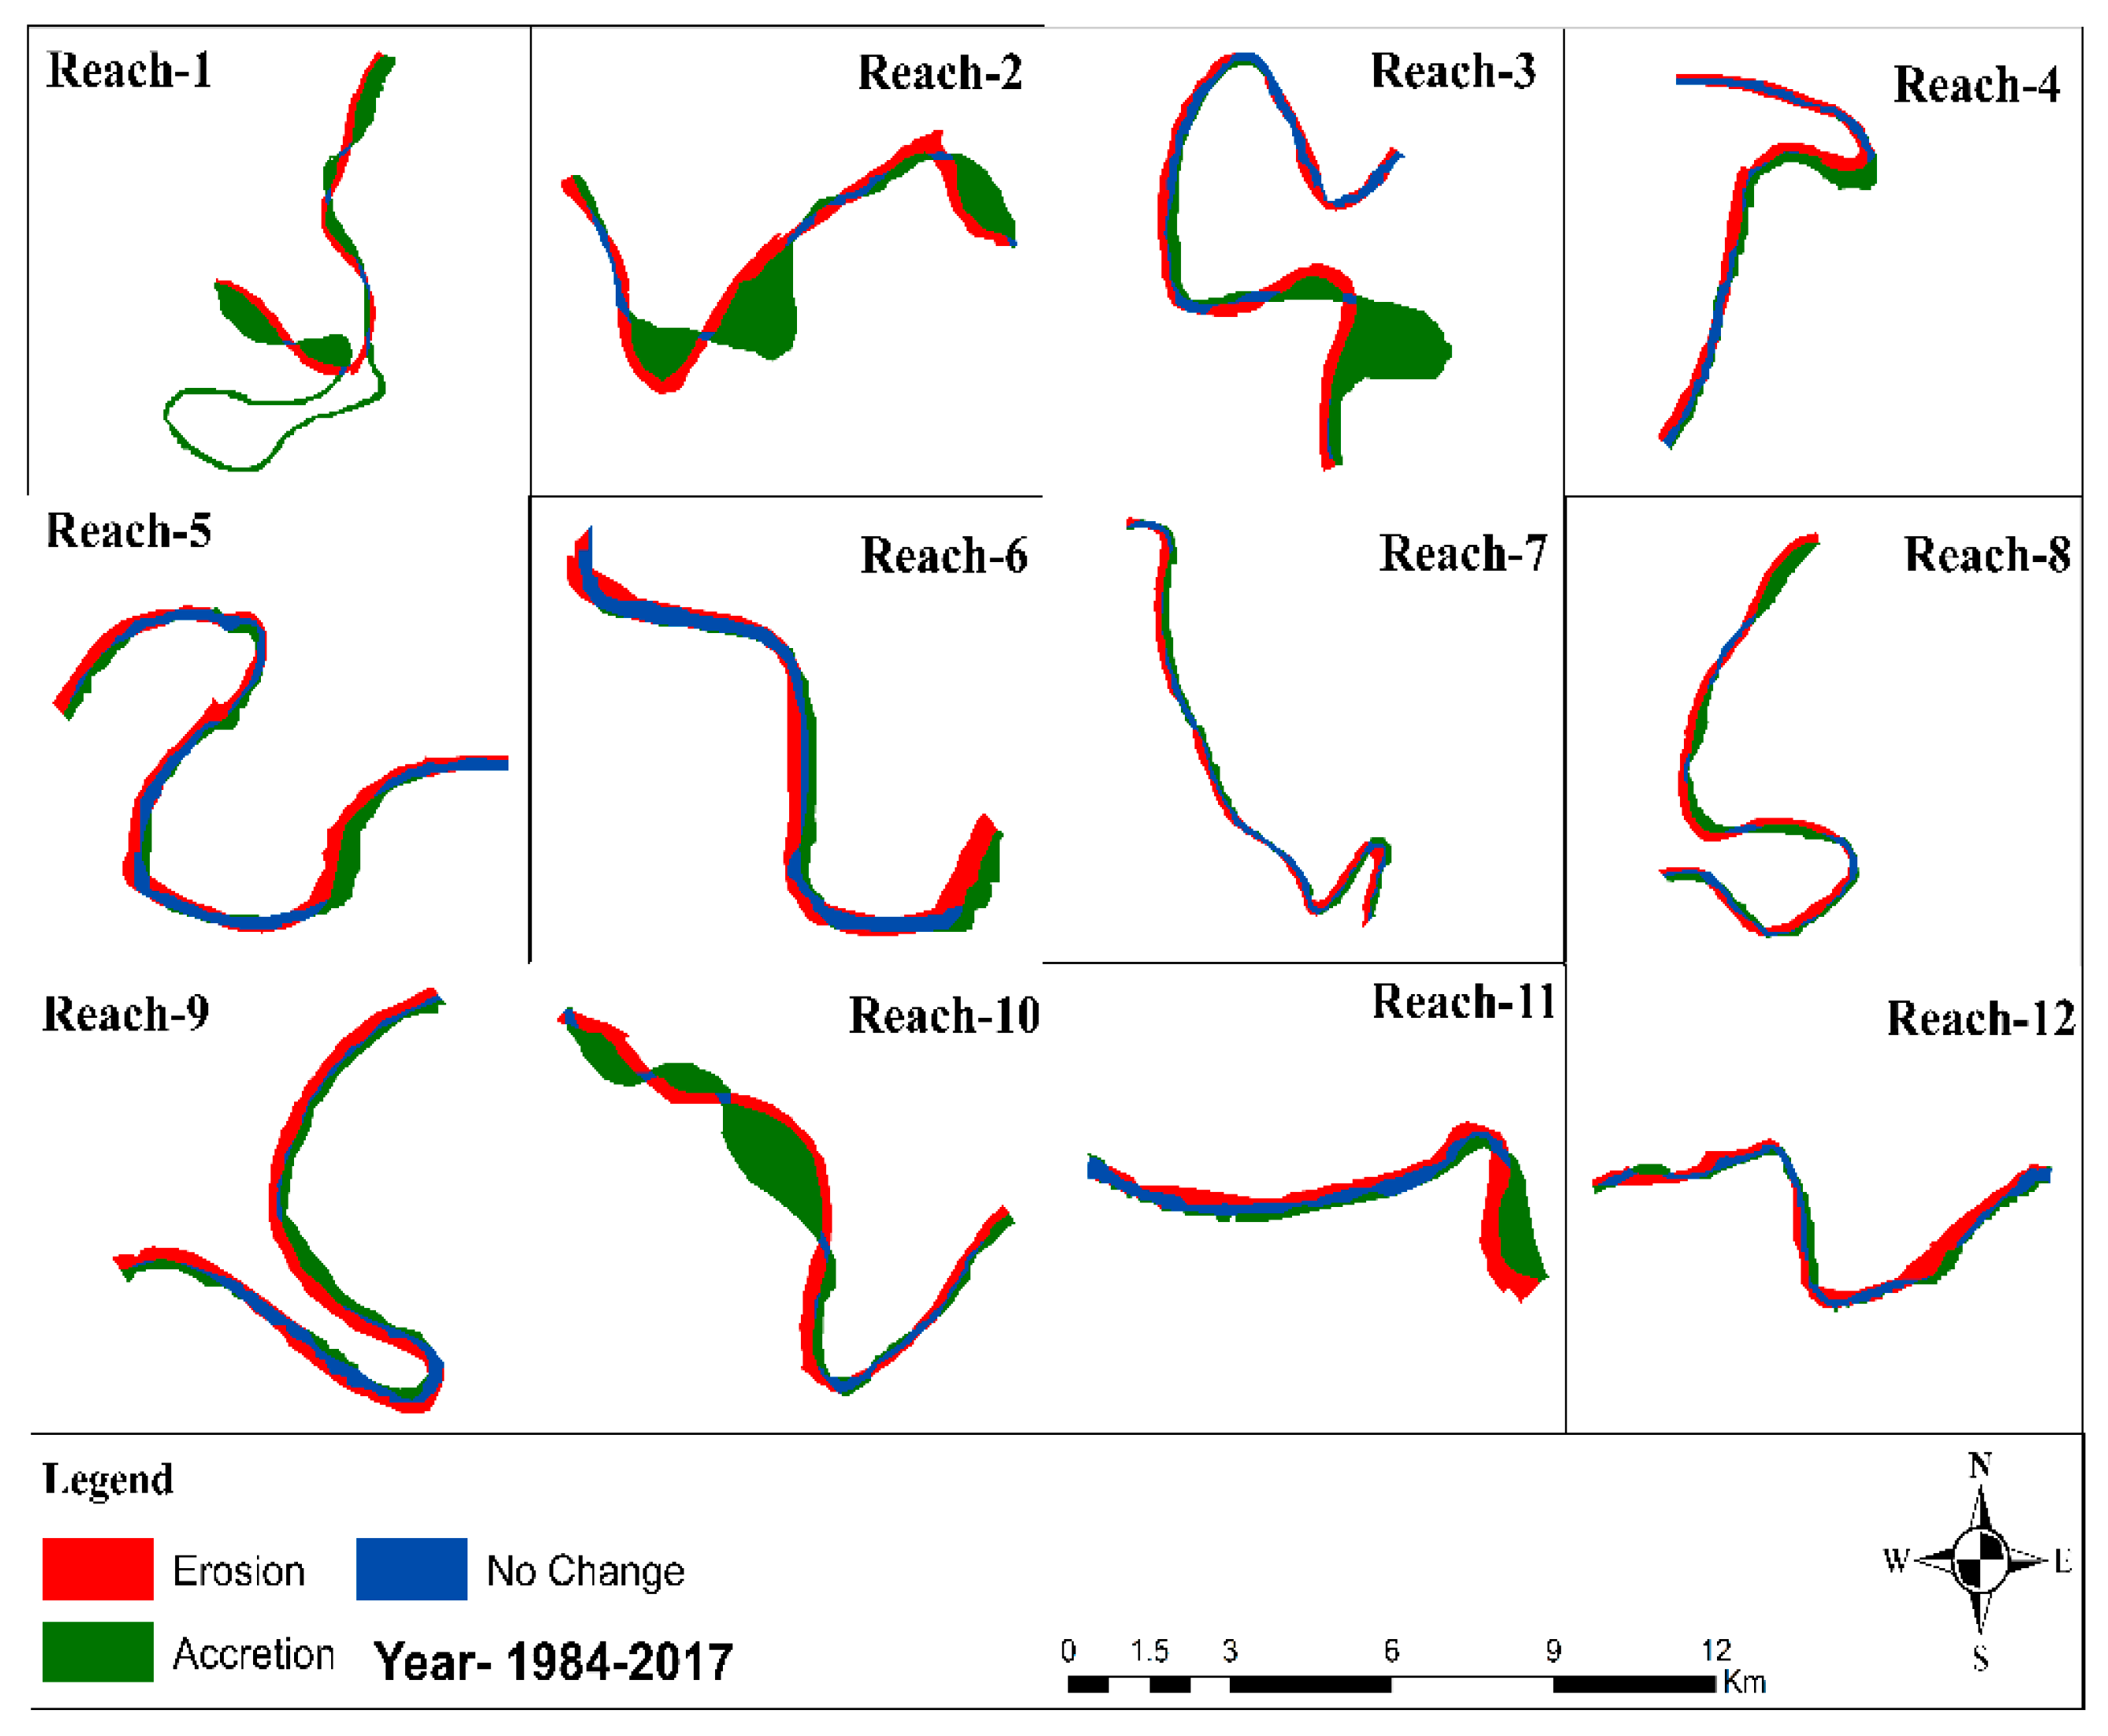
Spatio-temporal variability of erosion and accretion of the Barak River for almost all the meander loops for the different periods starting from 1984 to 2017 were measured. Meandering reaches were selected from reach-1 to reach-12 for the erosion, accretion, and unchanged channel changes of the Barak River (102 km and 33 years). Alluvial rivers are subject to meandering and channel shifting, leading to issues like oscillation, flooding, and avulsion, which directly affect the livelihood of the people near the river. As there is a variation in the channel’s dynamics, analysis is done separately. The blue color represents the active river channel, the red color represents the eroded river channel, and the green color represents the accreted channel. The images of each reach comprising five images per set from reach-1 to reach-12 are compared using the same scale.

3.1. Erosion, Accretion, and Unchanged Area (1984–1992)

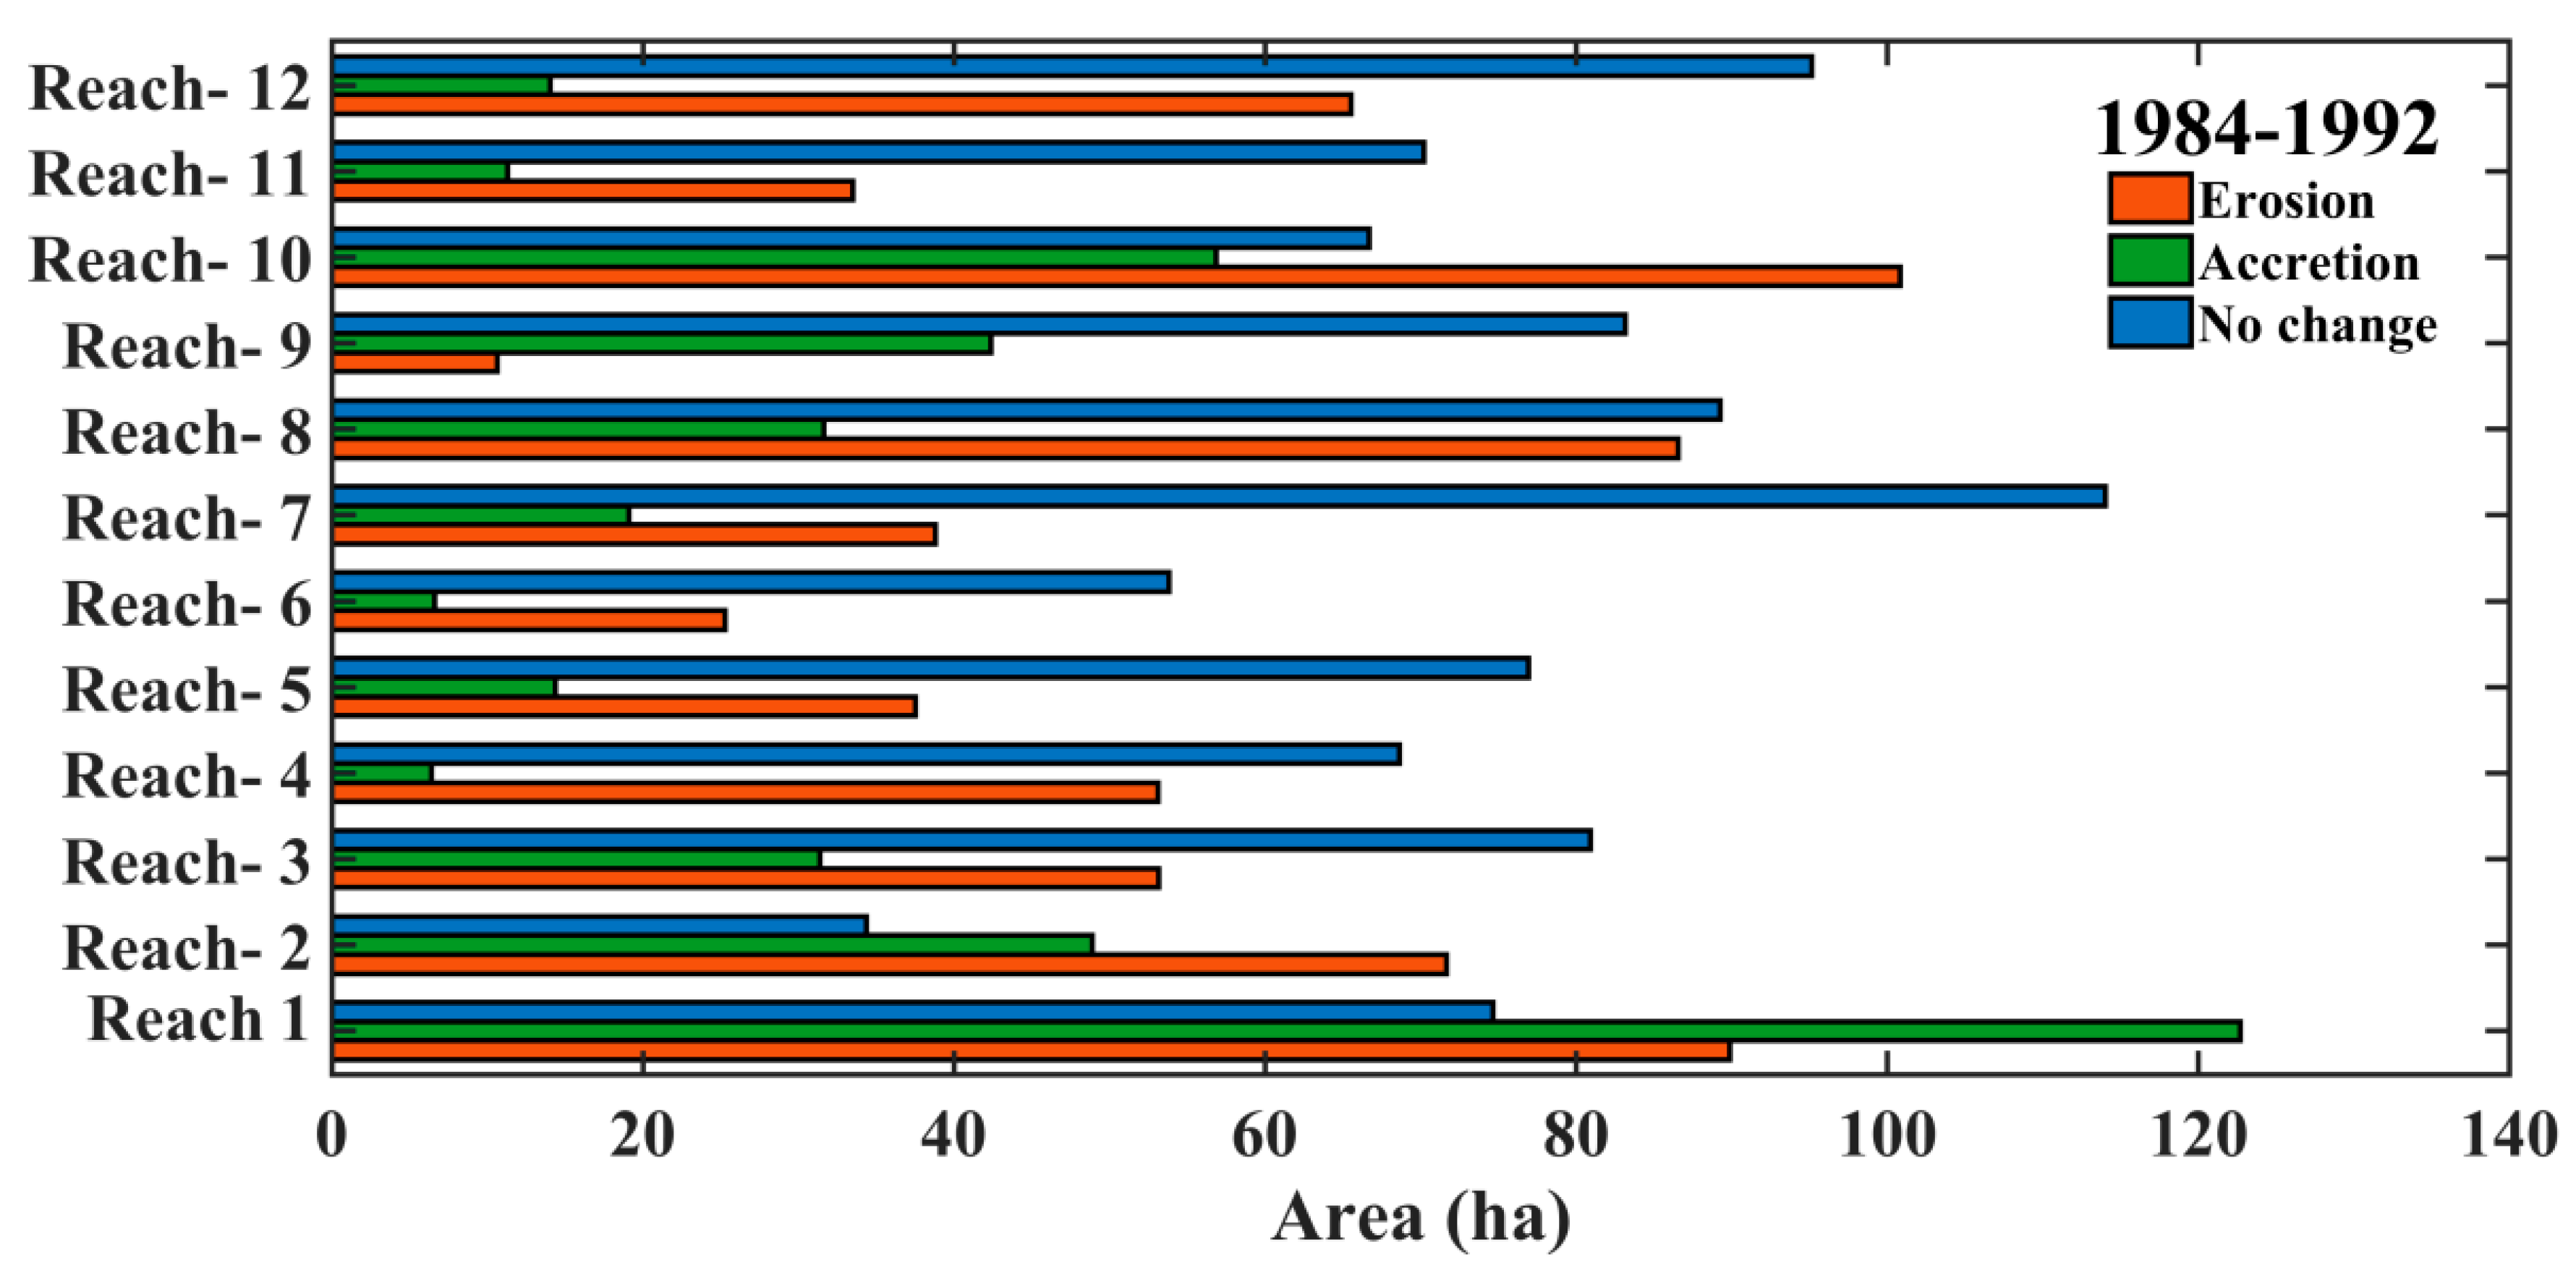
The river course has been taken from the 1984 Landsat MSS image and the 1992 Landsat TM image. To understand the historical morphology of the river dynamics, 12 reaches were selected, which mostly fall in the meandering sections of the river. A map of erosion, accretion, and unchanged area was prepared between 1984–1992 and is shown in Figure 5. We have overlaid the riverbanks for both years (1984–1992), as shown in Figure 6, to find the amount of erosion, accretion, and unchanged area for all the reaches included in the present study (reach-1 to reach-12). Table 2 has also been prepared from 1984–1992, in which we have tried to find the total amount of difference between erosion and accretion, which was found to be 260.82 ha. From our analysis, we find that during 1984–1992 the total amount of area that has come under erosion and accretion is 666.42 ha and 405.6 ha, respectively. In general, if we look at the overall scenario from 1984–1992, the area under erosion was more than that of the area under accretion.

3.2. Erosion, Accretion, and Unchanged Area (1992–2002)

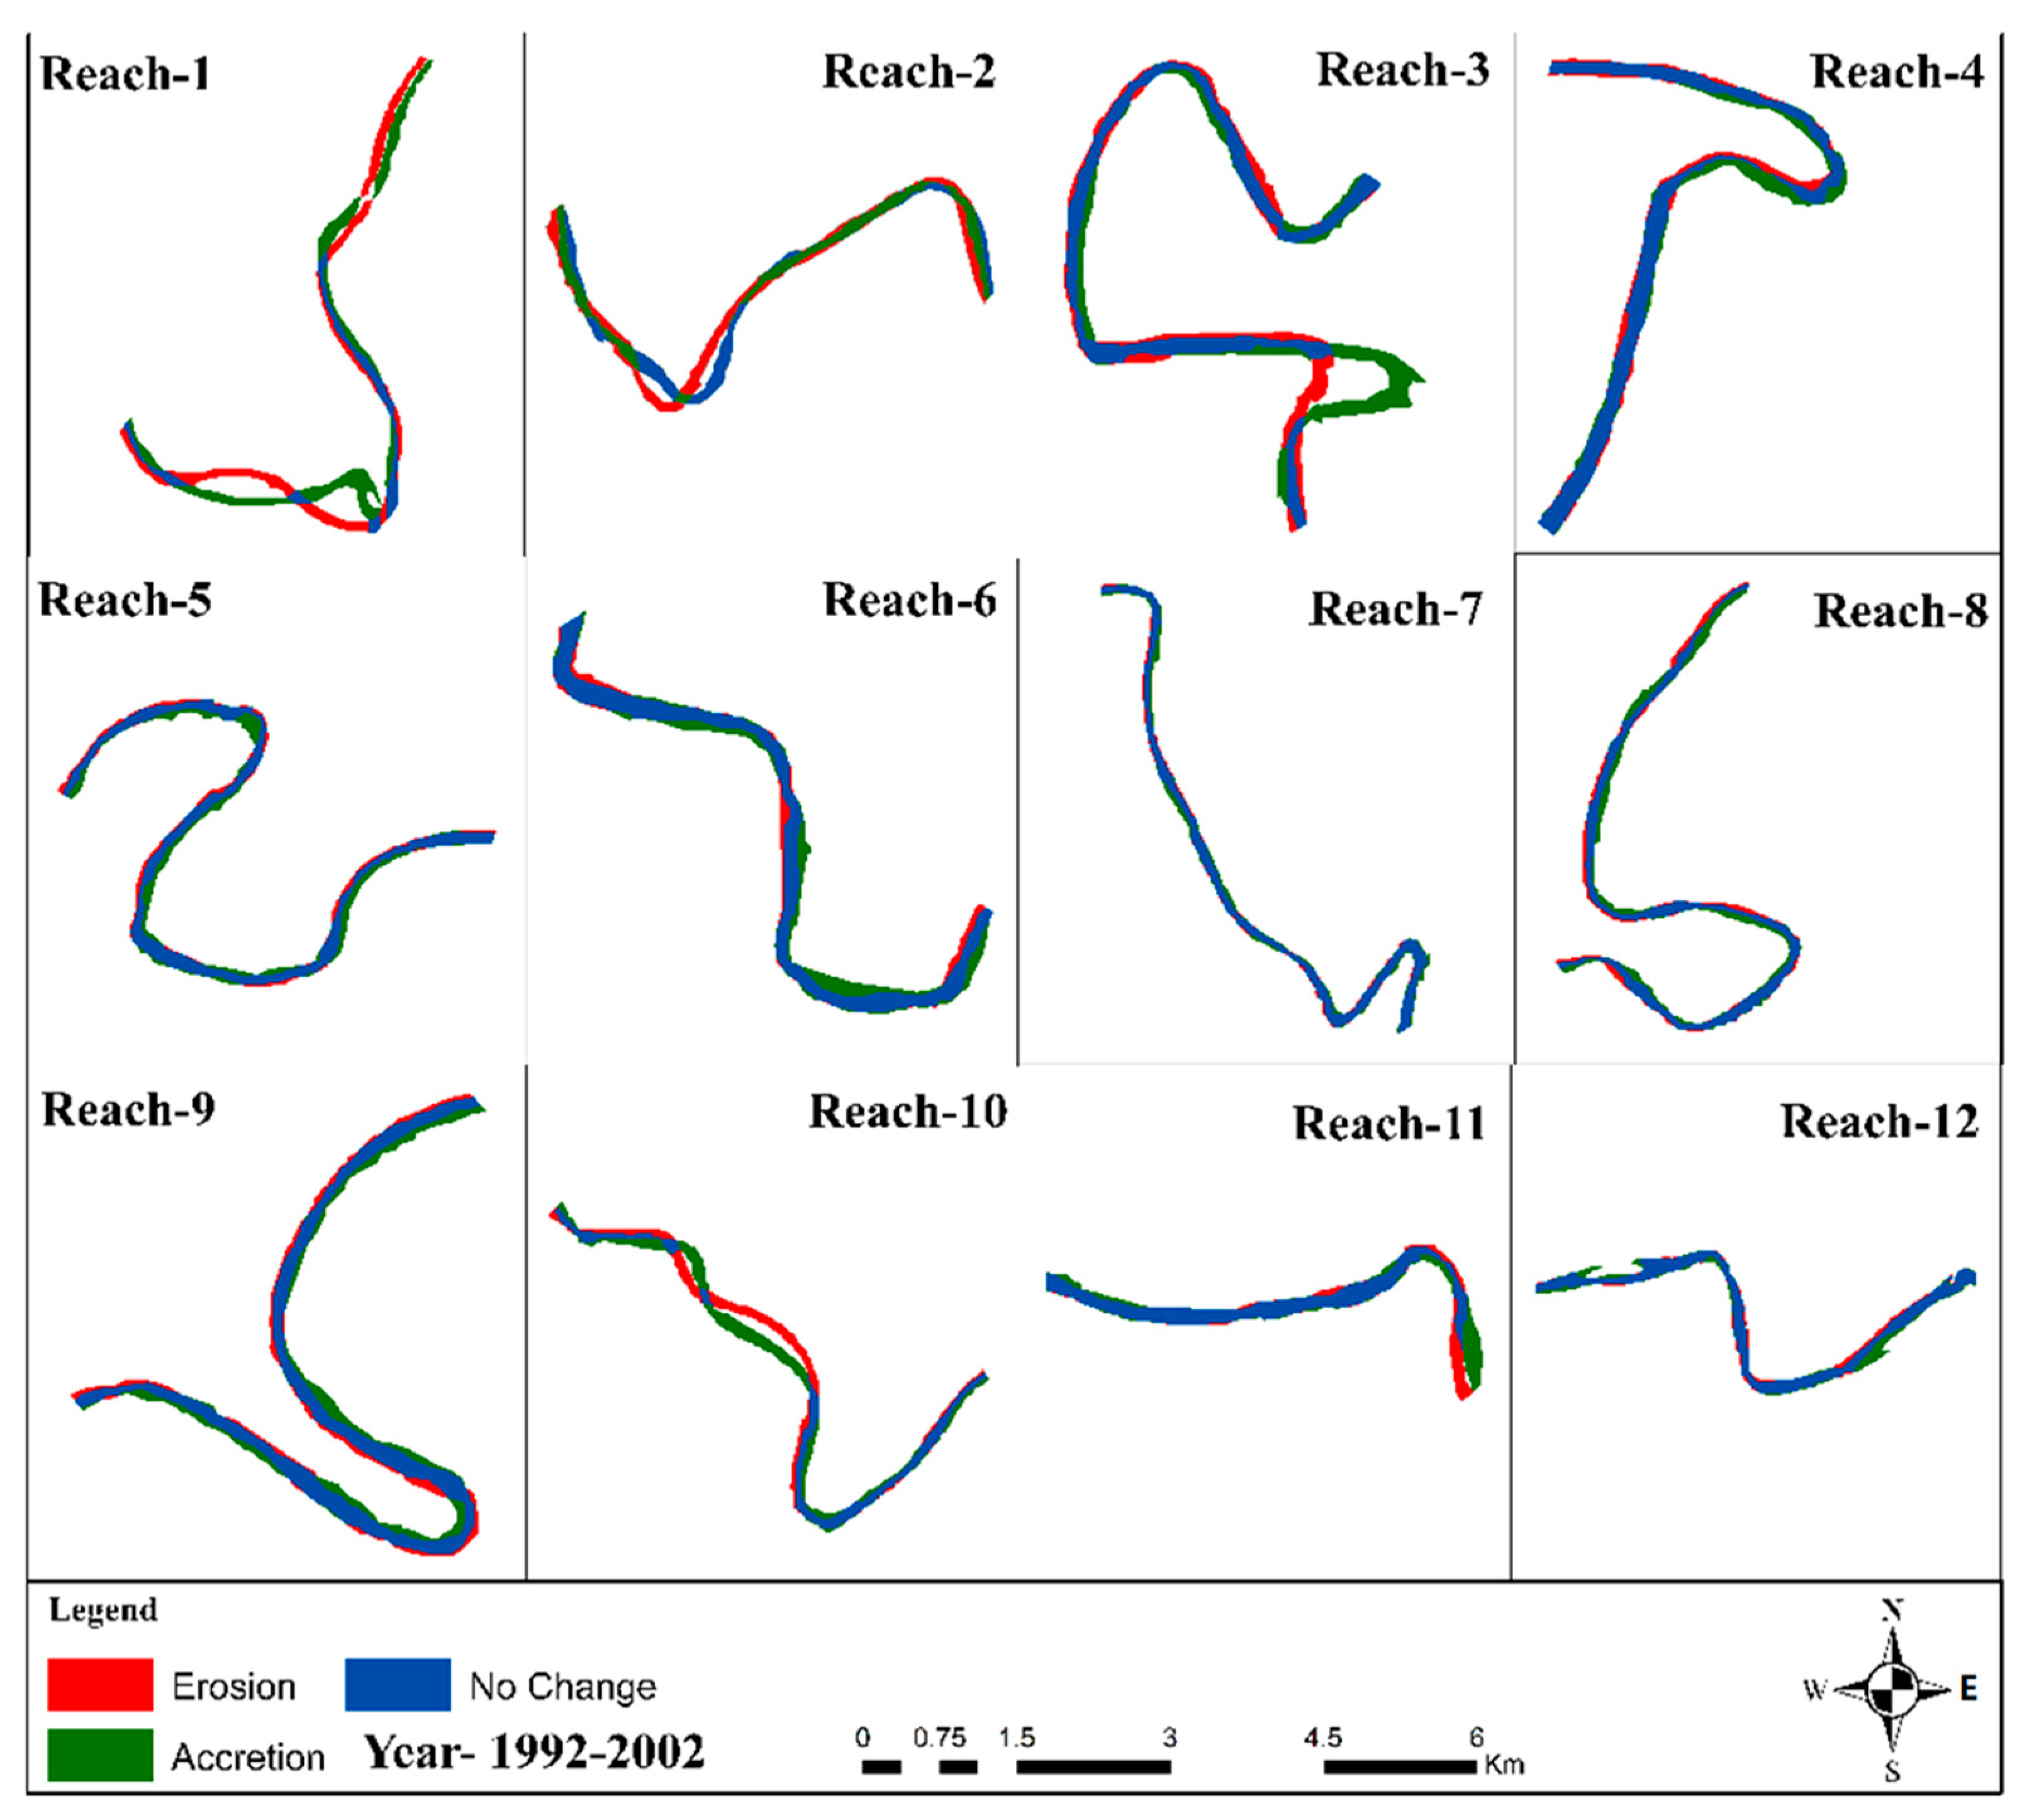
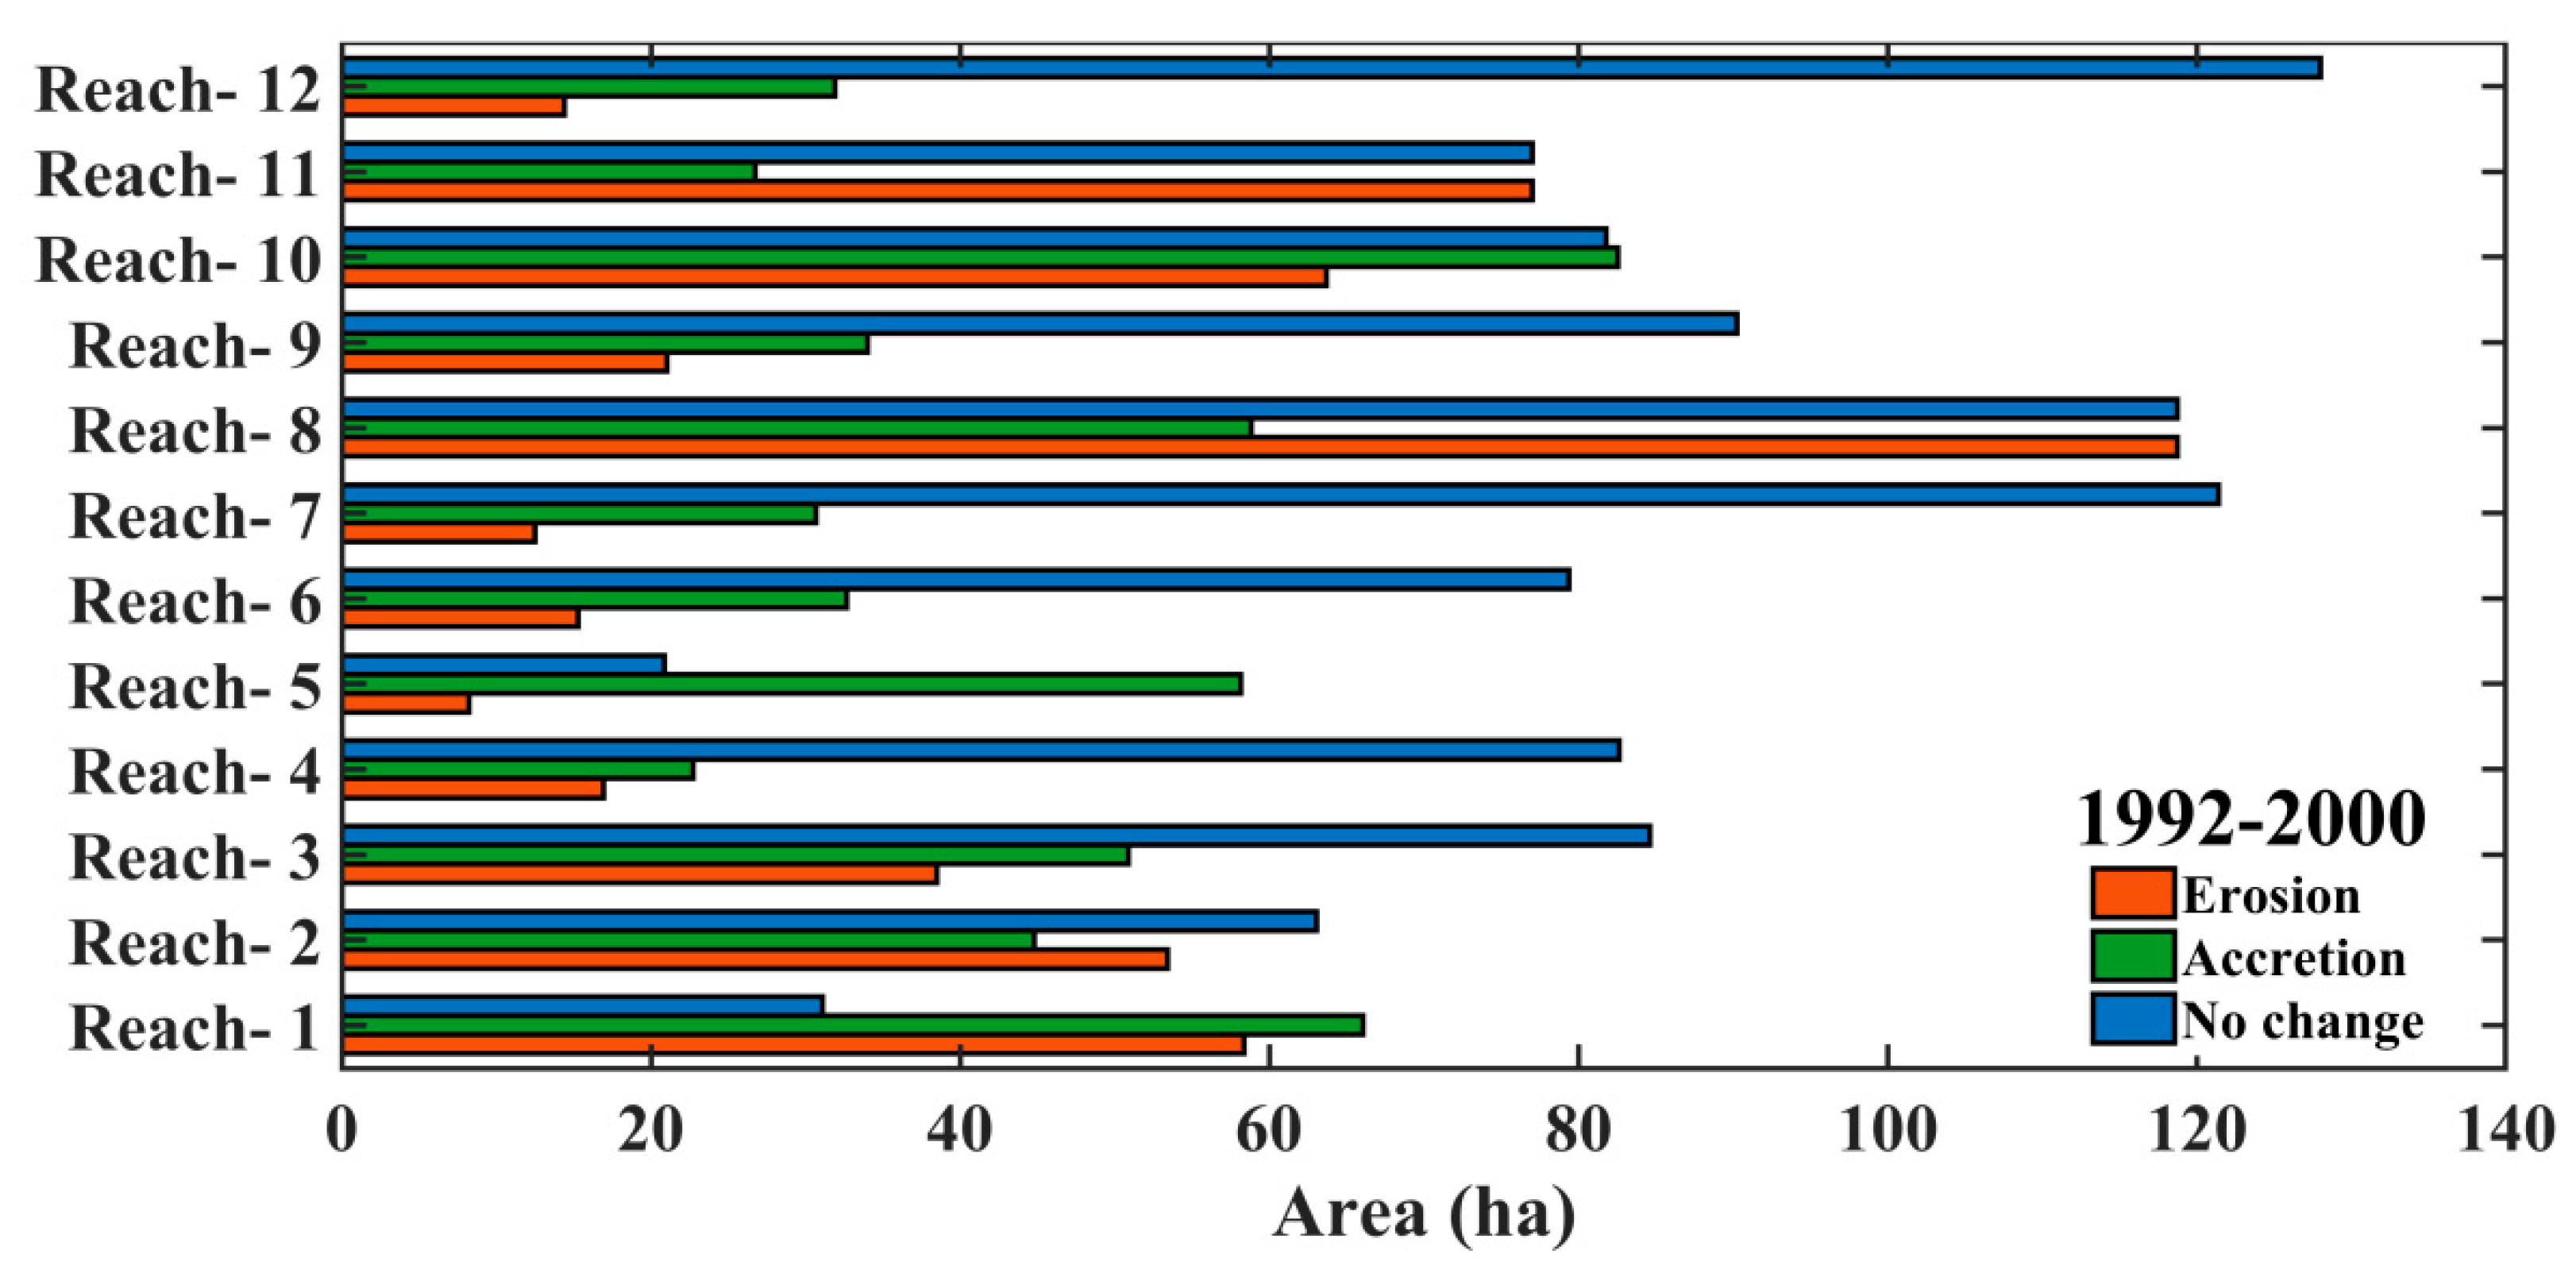
From 1992–2002, both the banks of the river were overlaid, which is shown in Figure 7, in order to detect the erosion and accretion of the Barak River. From reach-1 to reach-12 the amount of erosion, accretion, and no change has been illustrated in Figure 8. Table 2 has also been prepared from 1992–2002, in which we tried to find variations in the overall erosion and deposition. The overall erosional and depositional area from 1992 to 2002 is 498.01 ha and 539.88 ha, respectively. Table 2 also shows a 41.87 ha difference between erosion and deposition. From 1992 to 2002, deposition outpaced erosion overall.

3.3. Erosion, Accretion, and Unchanged Area (2002–2012)

A map of erosion, accretion, and unchanged area was prepared from 2002–2012, which is shown in Figure 9. The amount of erosion and accretion in hectares (Ha) has been calculated and is graphically represented in Figure 10. Table 2 also displays the variation in the overall amount of erosion and deposition. The total erosional and depositional area from 2002 to 2012 is 332.69 ha and 540.18 ha, respectively. Table 2 also shows a 207.49 ha difference between erosion and deposition. From 2002 to 2012, deposition outpaced erosion overall.

3.4. Erosion, Accretion, and Unchanged Area (2012–2017)

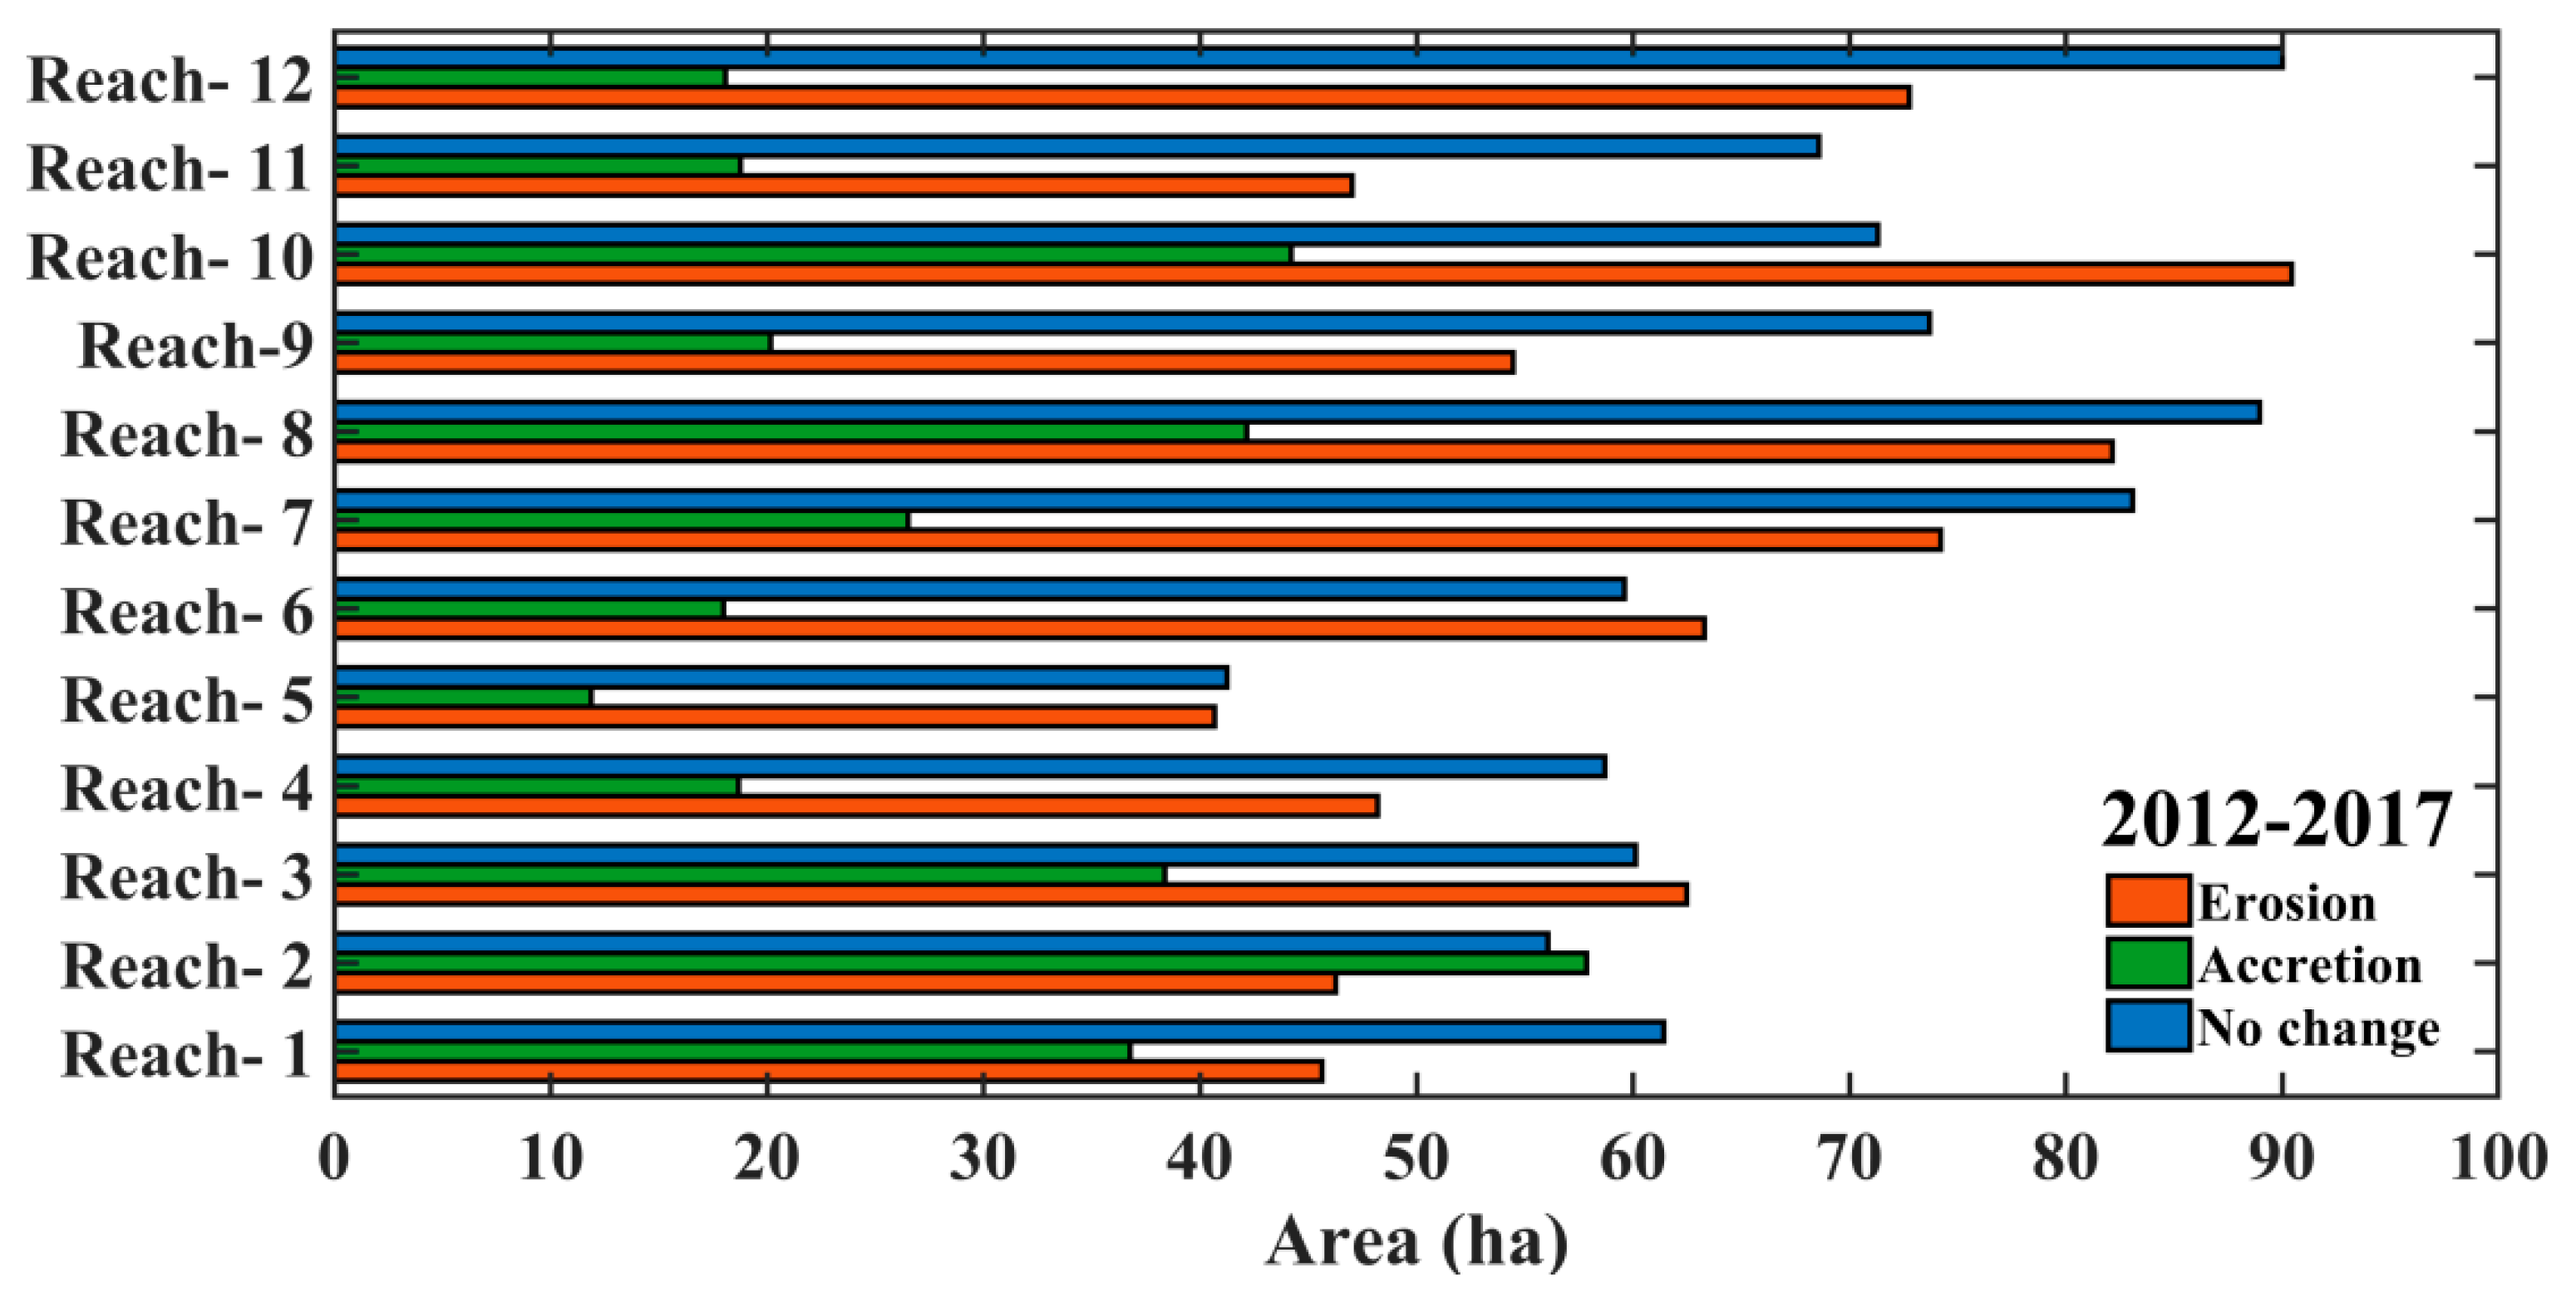
To prepare the map of erosion and accretion from 2012–2017, we overlapped the left and right banks of the river, shown in Figure 11. The amount of erosion and accretion in hectares (Ha) has been calculated and is graphically represented in Figure 12. Table 2 also displays the variation in the overall amount of erosion and deposition. Between 2012 and 2017, there was a total area lost to erosion and deposit of 727.56 ha and 351.32 ha, respectively. Table 2 demonstrates that the difference between erosion and deposition is 376.24 hectares. Overall, from 2012 to 2017, erosion outweighed depositing.

3.5. Erosion, Accretion, and Unchanged Area (1984–2017)

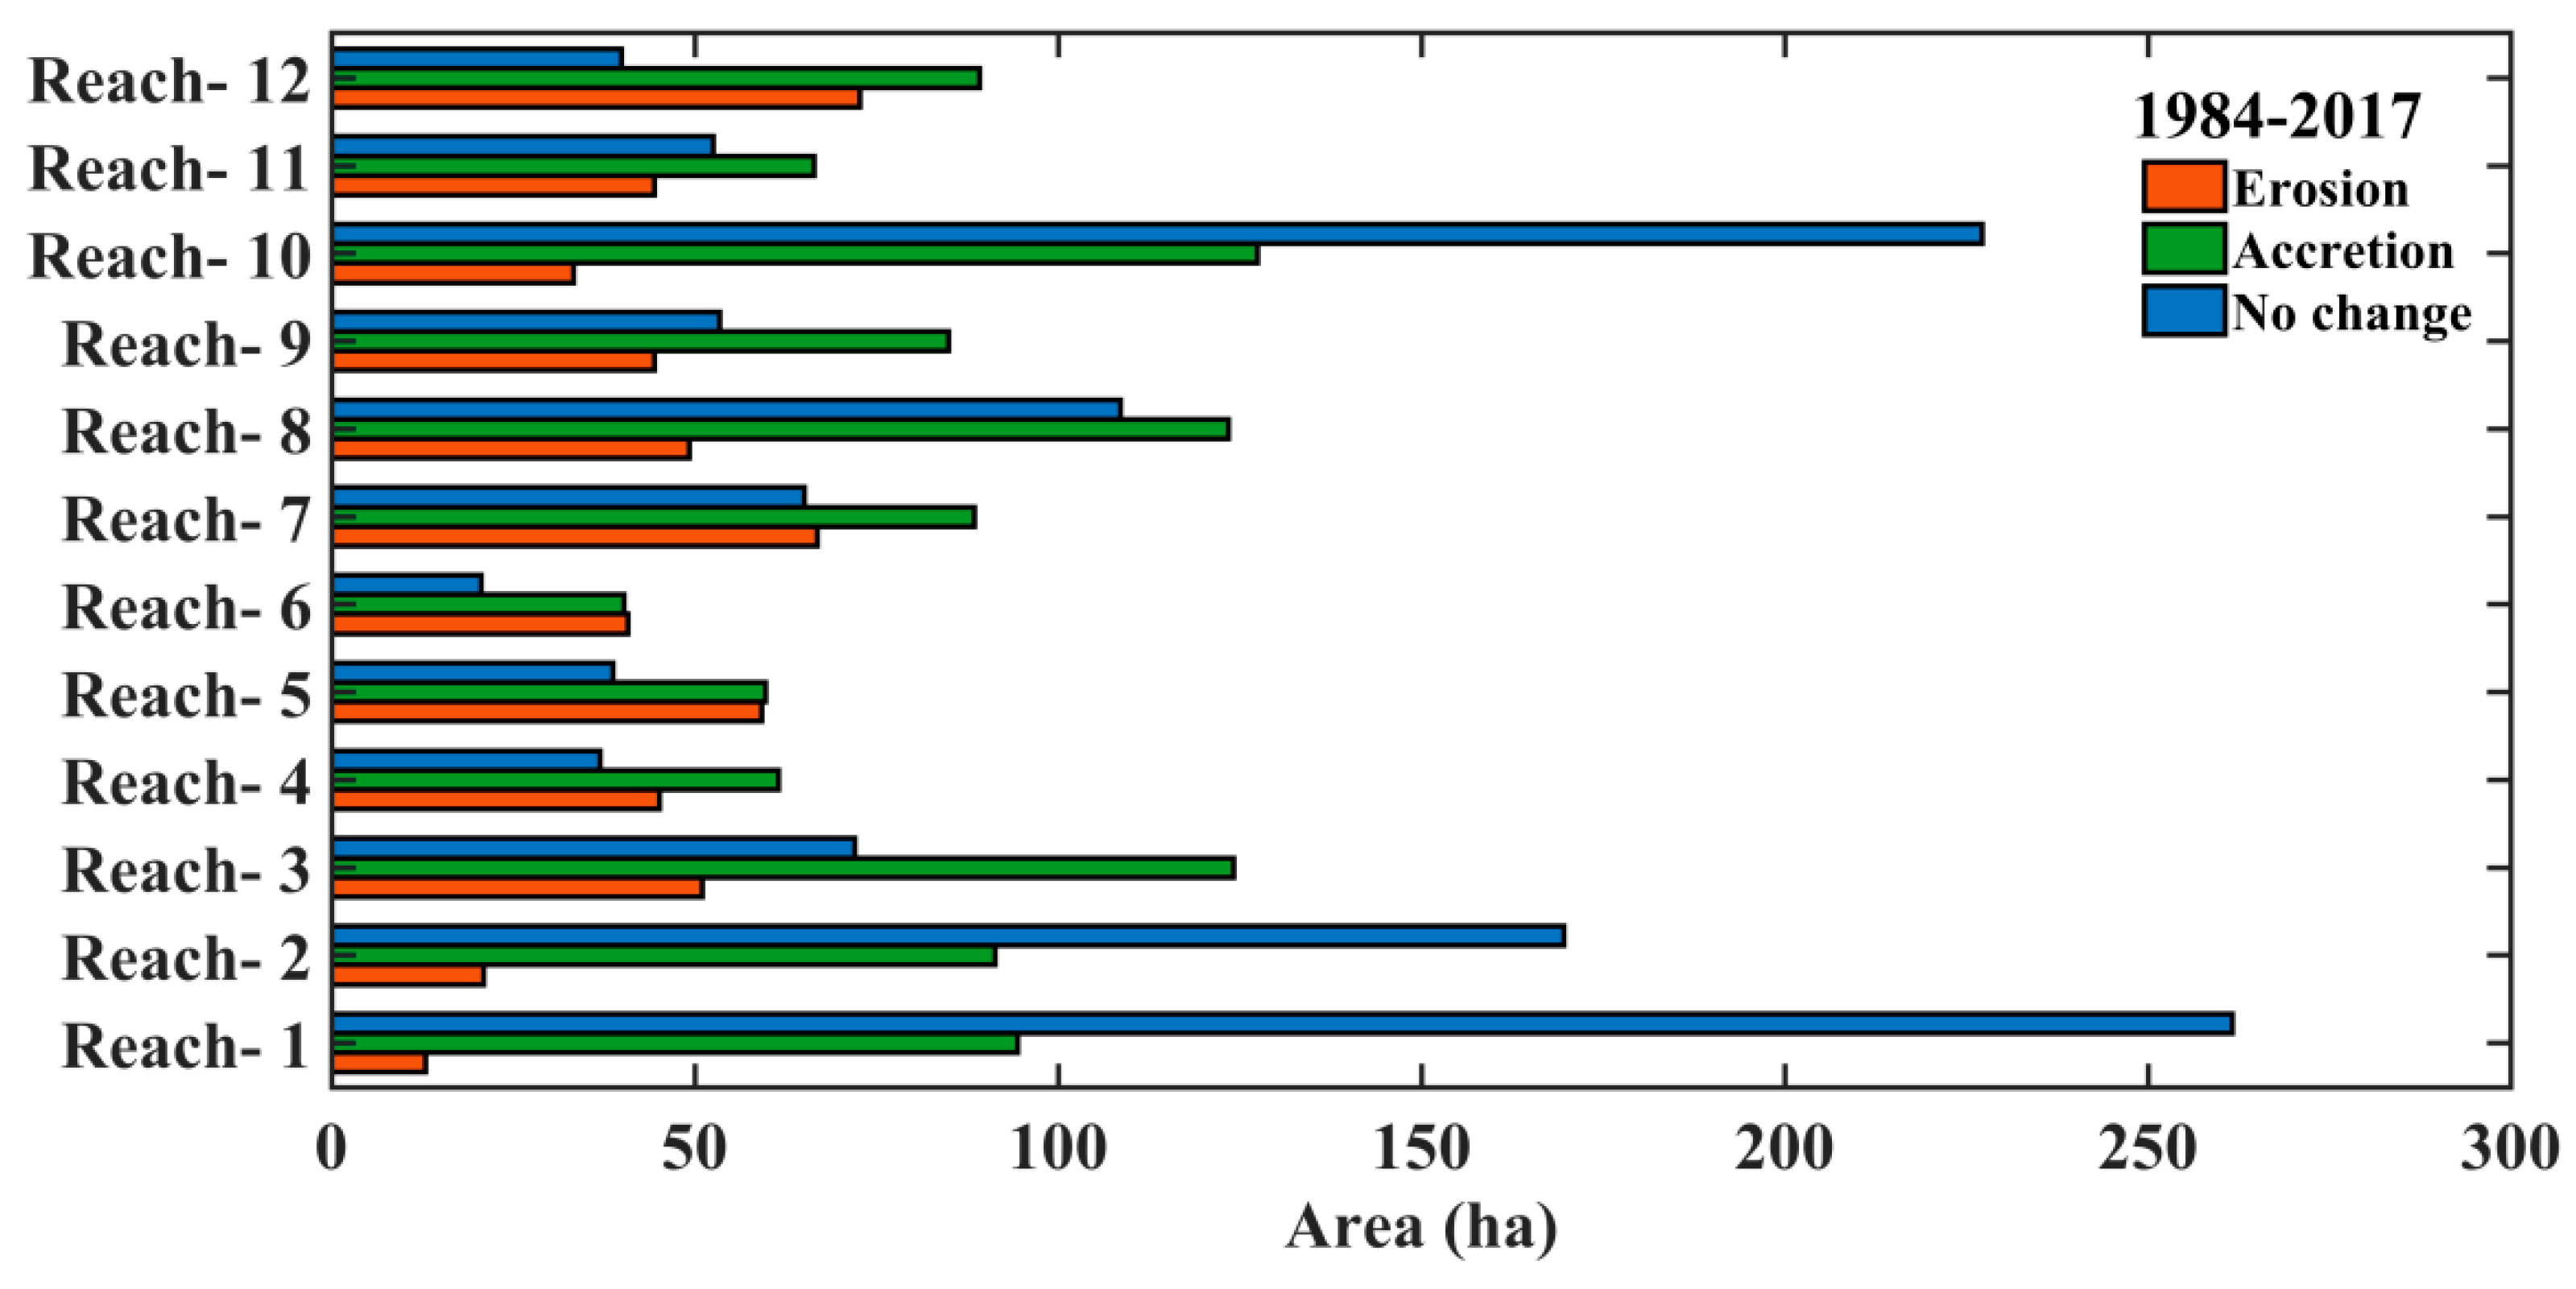
In order to prepare the map of erosion and accretion from 1984–2017, we overlapped both banks (the left bank and the right bank of the river), which is shown in Figure 13. The amount of erosion, accretion, and unchanged area in hectares (Ha) has been calculated from 1984–2017 and is graphically represented in Figure 14. Table 2 demonstrates where we tried to find the difference in erosion and accretion from 1984–2017. Overall, from 1984–2017, the area that came under erosion and accretion was 541.11 ha and 1054.21 ha, respectively. From 1984 to 2017, deposition outpaced erosion overall.

3.6. Spatio-Temporal Changes in the Land Use Land Cover (LULC)

The map prepared for the LULC change for the Barak River shows distinctive features for the period of 1984 to 2017. Changes were estimated for water, settlement, vegetation, and arable lands. The coverage factors that reduced the area are water and vegetation, with a change from 8.71% to 7.80% and 52.62% to 38.30%, respectively. Simultaneously, the settlement area and arable lands have increased from 5.62% to 16.09% and 32.68% to 37.73%, respectively. The changes are shown in Table 3. It is also observed that bank erosion tried to capture the areas near the settlement.

3.7. Slope Analysis

The slope is one of the most significant features that refers to the steepness of a line. It is an important structure that affects the stability of a river. Considering the longitudinal (downstream) profile of the Barak River, where it flows down a gentle to flat slope, velocity decreases, and deposition occurs. However, on the upstream side, water flowing over a steeper slope moves faster and causes more erosion. It is observed from Figure 5 that the major part of the Barak River flows down a gentle to flat slope, which is designated as an excellent category for the occurrence of deposition.

4. Discussion

The major issues prevalent on the alluvial plains of the Barak River, as shown in Table 2, are erosion and accretion, and their cumulative quantity is substantial and alarming. The dynamics of the river channel are constantly changing due to a variety of causes, including anthropogenic activity, sediment loads, water discharge, and climate change [52]. Flooding-related events can result in very dramatic and unexpected alterations to river channels. Due to the interaction of natural and artificial activity, riverbanks are linked to a variety of complicated morphological changes, such as erosion and deposition. Figure 6, Figure 8, Figure 10, Figure 12 and Figure 14 clearly represent the Barak River, highlighting its complex dynamics and meandering pattern as well as erosion and accretion as it flows in a downward direction.
It is a common phenomenon that both erosion and deposition occur on opposite banks of a river section. The degree of soil erosion is influenced by a variety of variables, including sediment types, erodibility, and susceptibility to flow turbulence [53,54]. It has been determined from the field investigation that the bank materials are primarily fine-grained non-cohesive sediments with a small fraction of silt and clay, which promotes excessive erosion. According to the reports, it has been discovered that fine-grained non-cohesive sediments have a limited ability to withstand erosion [55]. This could be one of the reasons behind the Barak River’s notoriously meandering course through its alluvial plain. It is also found from the field study that there is a thin layer of riparian vegetative cover, which actually provides resistance against bank failure. Some studies suggest that riparian vegetation cover is one of the prime practices to arrest bank erosion, specifically at the points where river migration occurs [56,57]. Ahmed and Fawzi (2011) reported that significant bank erosion occurs in the rivers where agricultural land is more predominant than riparian vegetation [48]. Overall, it can be concluded that any sort of vegetative cover in and around the riverbanks minimizes the risk of bank erosion. In addition to vegetative cover, intense and prolonged rainfall in a particular area may intensify the bank erosion process resulting in more erosion and deposition over the length of the river course. In the work of Debnath et al. (2017), it is also reported that bank erosion has increased with the increase of river discharge and flow velocity [54].
The selected study area comes under the sub-tropical region, where the warm and humid climate can be seen with rainfall that occurs most of the month and over the year. The average annual rainfall that normally happens over the year is 3000 mm. In the monsoon season, the study area, as well as the upstream portion of the study area, receives a high amount of rainfall, increasing river discharge. During this period, the velocity becomes very high, which results in bank erosion. In addition to these factors, another important factor is the carrying capacity of a river. If the carrying capacity of the river is less, the river is more susceptible to erosion; otherwise, there will be less bank erosion. It can be observed that during monsoon, the peak flow occurs, and the capacity of the river decreases, resulting in the overtopping of its side banks, resulting in intense bank erosion within that flood period. This type of bank erosion normally occurs in alluvial rivers. Other geological factors also influence bank erosion, such as faults, folds, lineaments, tectonic activity, bed load, and varied lithology in the stream. In the work of In the selected reach of the Barak River, the mean annual daily discharge is 322,832 m3s−1, which is recorded in the gauging site, Badarpur Ghat, which is considered the outflow section of the selected river reach, and the maximum annual discharge in the same section is 532,465 m3s−1.
In the literature, no work is found that relates the characteristics of the Barak River with other influencing parameters like earthquakes or the shifting of tectonic plates, which may be considered as the future scope of this work. This study conducted spatio-temporal analysis of land use land cover maps of the Barak River from 1984–2017. A three-kilometer buffer zone is considered on both sides of the river to highlight the changes, specifically in the growth of settlement and arable lands. Numerous studies have shown that human activity, such as intensive land-use practices, river dredging, sand mining, and irrigation canals, is to blame for the changing dynamics of the river [14,58,59,60,61,62]. A substantial volume of sediment is transferred from upstream to downstream of the Barak River due to erosion. Between 1984 and 2017, the numbers for the area under the settlement and the area that is arable land increased by 10.470 percent and 5.05 percent, respectively, in the alluvial plains of the Barak River. In the study of Majumdar and Pan (2014), it is found that erosion processes, such as the collapse of banks, are a result of three main factors: the volume of flow discharge, the velocity of flow, and river gradient. These three factors decide the ability of the bank material to erode [20]. From 1984–2017, the current analysis indicates a positive trend (Figure 15) in reaches 1, 2, 3, 4, 7, 8, 9, 10, 11, and 12. The figure shows that there was more deposition than erosion during that period.
Additionally, the bank erosion tries to engulf the village’s vicinities, which causes a substantial volume of sediment to be carried from upstream to downstream of the Barak River. Sometimes it is observed that hydraulic structures constructed in a river increase more stress on the thalweg or the side banks resulting in more erosion near the banks and deposition in the floodplain areas [63,64,65]. In the selected reach of the Barak River, no such structure can be found except for some water intakes, which are in use for the urban water supply and irrigation systems. The main concern in the alluvial part of the Barak River is a continuous process of erosion and deposition, resulting in frequent migration in different sections. Due to constant erosion and deposition of the bank material, the thalweg becomes shallower, thereby increasing the possibility of shifting the river in any direction, creating a low channel gradient and wider sections.

5. Conclusions and Future Scope

Detailed channel dynamics of the Barak River were examined to understand the occurrence of erosion, accretion, and unchanged areas along the twelve representative meandering reaches. The changes were estimated using geospatial techniques over a period of 33 years, starting from 1984 to 2017, based on the availability of satellite images. Along with erosion and deposition, the unchanged portions are also identified and reported in the maps. The utmost care has been taken during image and data processing to maintain accuracy. This study found that remote sensing and GIS techniques provide a framework for monitoring spatiotemporal variability of erosion, accretion, and unchanged areas in the Barak River. The valuable information on temporal changes in river channel processes of erosion and deposition may be used as references compared with other rivers of the same size. Barak River shows dynamic behavior in terms of erosion, accretion, and an unchanged area. When erosion, deposition, and unchanging area were compared reach-by-reach, it was discovered that reaches 1, 2, 3, 4, 7, 8, 9, 10, 11, and 12 had resulted in the dominance of deposition. However, erosion and deposition occur equally in reaches 5 and 6. Temporal analysis of land use/land cover reveals an increase of land area by 10.47% in the settlement, whereas only 5.05% of the arable area has increased from 1984 to 2017. It is observed that the major part of the Barak River flows as a gentle to flat slope, designated as an excellent category for the occurrence of deposition. A geological study is necessary for the Barak River to identify the geological structures, such as faults, folds, and their impact on the flow dynamics of the river. The present work will definitely help in taking different measures in respect of river training works, along with an in-depth understanding of the recent changes in the alluvial parts of the river. This study can develop proper scientific planning, resulting in more stable riverbanks in the settlement areas. Various data sets included in this investigation have differing spatial and positional accuracy levels. All the data sets were georeferenced to improve positional accuracy using control points, and the MSS data were resampled to improve spatial precision. We cannot achieve an accuracy of up to 1 m using Landsat data, but we have made improvements, and it is now less than 8 m. Despite this, the present study is helpful in areas where systematic inspections using other methods, such as field surveys, are lacking or impractical. It also saves a significant amount of time and money.

Author Contributions

B.S.S., K.A., W.A.: original design of the article, data analysis, writing of original draft, and validation of findings; investigation, conceptualization, methodology, K.A., W.A.: Data generation, writing and investigation, W.A., G.M. and M.F.: Further writing, formal analysis, validation, review, and editing; G.M., J.D. and M.F.: review—editing; W.A., J.D. and G.M.: final review. All authors have read and agreed to the published version of the manuscript.

Funding

The original work is funded by DST-SERB, Government of India (ECR/2017/000344).

Institutional Review Board Statement

Not applicable.

Informed Consent Statement

Not applicable.

Data Availability Statement

The data used and generated in this study shall be available from the first author upon reasonable request.

Acknowledgments

The authors sincerely thanks to DST-SERB Government of India for funding a part of this work. Field work and data generation was done in NIT Silchar where Wajahat Annayat and Kumar Ashwini worked together. Hence, authors also thankful to NIT Silchar for giving an oppotuity to carry out this work. Authors also thanks to other stakholders who are directly and indirectly connected to this research work.

Conflicts of Interest

The authors declare no conflict of interest.

References

  1. Esfahani, F.S.; Keshavarzi, A. Effect of different meander curvatures on spatial variation of coherent turbulent flow structure inside ingoing multi-bend river meanders. Stoch. Environ. Res. Risk Assess. 2011, 25, 913–928. [Google Scholar] [CrossRef]
  2. Annayat, W.; Sil, B.S. Predicting Meander migration of the Barak river by empirical and time sequence methods. In Water Security and Sustainability; Springer: Singapore, 2021; pp. 113–129. [Google Scholar]
  3. Annayat, W.; Ashwini, K.; Sil, B.S. Monitoring Land Use and Land Cover Analysis of the Barak Basin Using Geospatial Techniques. In Anthropogeomorphology; Springer: Cham, Switzerland, 2022; pp. 427–441. [Google Scholar]
  4. Annayat, W.; Ashwini, K.; Sil, B.S. Channel Migration Detection and Landuse/Landcover Changes for Barak River in Northeast India. J. Geol. Soc. India 2022, 98, 981–990. [Google Scholar] [CrossRef]
  5. Fayaz, M.; Meraj, G.; Khader, S.A.; Farooq, M. ARIMA and SPSS statistics based assessment of landslide occurrence in western Himalayas. Environ. Chall. 2022, 9, 100624. [Google Scholar] [CrossRef]
  6. Tomar, P.; Singh, S.K.; Kanga, S.; Meraj, G.; Kranjčić, N.; Đurin, B.; Pattanaik, A. GIS-Based Urban Flood Risk Assessment and Management—A Case Study of Delhi National Capital Territory (NCT), India. Sustainability 2021, 13, 12850. [Google Scholar] [CrossRef]
  7. Heitmuller, F.T.; Hudson, F.P.; Kesel, R.H. Overbank Sedimentation from the Historic AD 2011 Flood along the Lower Mississippi River, USA. Geology 2017, 45, 107–110. [Google Scholar] [CrossRef]
  8. Bordoloi, K.; Nikam, B.R.; Srivastav, S.K.; Sahariah, D. Assessment of Riverbank Erosion and Erosion Probability Using Geospatial Approach: A Case Study of the Subansiri River, Assam, India. Appl. Geomat. 2020, 12, 265–280. [Google Scholar] [CrossRef]
  9. Finotello, A.; Lanzoni, S.; Ghinassi, M.; Marani, M.; Rinaldo, A.; D’Alpaos, A. Field Migration Rates of Tidal Meanders Recapitulate Fluvial Morphodynamics. Proc. Natl. Acad. Sci. USA 2018, 115, 1463–1468. [Google Scholar] [CrossRef] [Green Version]
  10. Esfahani, F.S.; Keshavarzi, A. Dynamic mechanism of turbulent flow in meandering channels: Considerations for deflection angle. Stoch. Environ. Res. Risk Assess. 2013, 27, 1093–1114. [Google Scholar] [CrossRef]
  11. Florsheim, J.; Jeffrey, L.; Mount, F.; Chin, A. Bank Erosion as a Desirable Attribute of Rivers. BioScience 2008, 58, 519–529. [Google Scholar] [CrossRef] [Green Version]
  12. Best, J.L.; Ashworth, P.J.; Sarker, M.H.; Roden, J.E. The Brahmaputra-Jamuna River, Bangladesh. In Large Rivers: Geomorphology and Management; John Wiley & Sons, Ltd.: Hoboken, NJ, USA, 2007; pp. 395–430. [Google Scholar]
  13. De Rose, R.C.; Basher, L.R. Measurement of River Bank and Cliff Erosion from Sequential LIDAR and Historical Aerial Photography. Geomorphology 2011, 126, 132–147. [Google Scholar] [CrossRef]
  14. Zaimes, G.N.; Schultz, R.C.; Isenhart, T.M. Stream Bank Erosion Adjacent to Riparian Forest Buffers, Row-Crop Fields, and Continuously-Grazed Pastures along Bear Creek in Central Iowa. J. Soil Water Conserv. 2004, 59, 19–27. [Google Scholar]
  15. Mafi-Gholami, D.; Zenner, E.K.; Jaafari, A.; Bakhtyari, H.R.; Bui, D.T. Multi-hazards vulnerability assessment of southern coasts of Iran. J. Environ. Manag. 2019, 252, 109628. [Google Scholar] [CrossRef] [PubMed]
  16. Ielpi, A.; Lapôtre, M.G.; Gibling, M.R.; Boyce, C.K. The impact of vegetation on meandering rivers. Nat. Rev. Earth Environ. 2022, 3, 165–178. [Google Scholar] [CrossRef]
  17. Rather, M.A.; Meraj, G.; Farooq, M.; Shiekh, B.A.; Kumar, P.; Kanga, S.; Singh, S.K.; Sahu, N.; Tiwari, S.P. Identifying the Potential Dam Sites to Avert the Risk of Catastrophic Floods in the Jhelum Basin, Kashmir, NW Himalaya, India. Remote Sens. 2022, 14, 1538. [Google Scholar] [CrossRef]
  18. Wellmeyer, J.L.; Slattery, M.C.; Phillips, J.D. Quantifying Downstream Impacts of Impoundment on Flow Regime and Channel Planform, Lower Trinity River, Texas. Geomorphology 2005, 69, 1–13. [Google Scholar] [CrossRef]
  19. Santillán, D.; Cueto-Felgueroso, L.; Sordo-Ward, A.; Garrote, L. Influence of Erodible Beds on Shallow Water Hydrodynamics during Flood Events. Water 2020, 12, 3340. [Google Scholar] [CrossRef]
  20. Majumdar, S.; Pan, N.D. Spatio-Temporal Shift of Right Bank of the Gumti River, Amarpur Town, Tripura and Its Impact. In Landscape Ecology and Water Management; Springer: Berlin, Germany, 2014; pp. 221–232. [Google Scholar]
  21. Mosavi, A.; Sajedi-Hosseini, F.; Choubin, B.; Taromideh, F.; Rahi, G.; Dineva, A.A. Susceptibility mapping of soil water erosion using machine learning models. Water 2020, 12, 1995. [Google Scholar] [CrossRef]
  22. Alcántara-Ayala, I. Geomorphology, natural hazards, vulnerability and prevention of natural disasters in developing countries. Geomorphology 2002, 47, 107–124. [Google Scholar] [CrossRef]
  23. Liébault, F.S.; Cassel, L.M.; Talaska, N. Long Profile Responses of Alpine Braided Rivers in SE France. River Res. Appl. 2013, 29, 1253–1266. [Google Scholar] [CrossRef]
  24. Meraj, G.; Farooq, M.; Singh, S.K.; Islam, M.; Kanga, S. Modeling the sediment retention and ecosystem provisioning services in the Kashmir valley, India, Western Himalayas. Model. Earth Syst. Environ. 2022, 8, 3859–3884. [Google Scholar] [CrossRef]
  25. Mosavi, A.; Golshan, M.; Janizadeh, S.; Choubin, B.; Melesse, A.M.; Dineva, A.A. Ensemble models of GLM, FDA, MARS, and RF for flood and erosion susceptibility mapping: A priority assessment of sub-basins. Geocarto Int. 2022, 37, 2541–2560. [Google Scholar] [CrossRef]
  26. Fu, Z.; Jiang, J.; Gao, Y.; Krienke, B.; Wang, M.; Zhong, K.; Cao, Q.; Tian, Y.; Zhu, Y.; Cao, W.; et al. Wheat growth monitoring and yield estimation based on multi-rotor unmanned aerial vehicle. Remote Sens. 2020, 12, 508. [Google Scholar] [CrossRef] [Green Version]
  27. Shao, Z.; Tang, P.; Wang, Z.; Saleem, N.; Yam, S.; Sommai, C. BRRNet: A fully convolutional neural network for automatic building extraction from high-resolution remote sensing images. Remote Sens. 2020, 12, 1050. [Google Scholar] [CrossRef] [Green Version]
  28. Youdeowei, P.O. Bank Collapse and Erosion at the Upper Reaches of the Ekole Creek in the Niger Delta Area of Nigeria. Bull. Eng. Geol. Environ. 1997, 55, 167–172. [Google Scholar] [CrossRef]
  29. Yang, X.; Damen, M.C.J.; Zuidam, R.A.V. Satellite Remote Sensing and GIS for the Analysis of Channel Migration Changes in the Active Yellow River Delta, China. Int. J. Appl. Earth Obs. Geoinf. 1999, 1, 146–157. [Google Scholar] [CrossRef]
  30. Pati, J.K.; Lal, J.; Prakash, K.; Bhusan, R. Spatio-Temporal Shift of Western Bank of the Ganga River, Allahabad City and Its Implications. J. Indian Soc. Remote Sens. 2008, 36, 289–297. [Google Scholar] [CrossRef]
  31. Ollero, A. Channel Changes and Floodplain Management in the Meandering Middle Ebro River, Spain. Geomorphology 2010, 117, 247–260. [Google Scholar] [CrossRef]
  32. Sarkar, A.; Garg, R.D.; Sharma, N. RS-GIS Based Assessment of River Dynamics of Brahmaputra River in India. J. Water Resour. Prot. 2012, 4, 17423. [Google Scholar] [CrossRef] [Green Version]
  33. Mount, N.J.; Tate, N.J.; Sarker, M.H.; Thorne, C.R. Evolutionary, Multi-Scale Analysis of River Bank Line Retreat Using Continuous Wavelet Transforms: Jamuna River, Bangladesh. Geomorphology 2013, 183, 82–95. [Google Scholar] [CrossRef]
  34. Dhari, S.; Arya, D.S.; Murumkar, A.R. Application of Remote Sensing and GIS in Sinuosity and River Shifting Analysis of the Ganges River in Uttarakhand Plains. Appl. Geomat. 2015, 7, 13–21. [Google Scholar] [CrossRef]
  35. Magliulo, P.; Bozzi, F.; Pignone, M. Assessing the Planform Changes of the Tammaro River (Southern Italy) from 1870 to 1955 Using a GIS-Aided Historical Map Analysis. Environ. Earth Sci. 2016, 75, 355. [Google Scholar] [CrossRef]
  36. Yousefi, S.; Moradi, H.R.; Pourghasemi, H.R.; Khatami, R. Assessment of Floodplain Landuse and Channel Morphology within Meandering Reach of the Talar River in Iran Using GIS and Aerial Photographs. Geocarto Int. 2018, 33, 1367–1380. [Google Scholar] [CrossRef]
  37. Dewan, A.; Corner, R.; Saleem, A.; Rahman, M.; Haider, R.; Rahman, M.; Sarker, M.H. Assessing Channel Changes of the Ganges-Padma River System in Bangladesh Using Landsat and Hydrological Data. Geomorphology 2017, 276, 257–279. [Google Scholar] [CrossRef]
  38. Debnath, J.; Meraj, G.; Das Pan, N.; Chand, K.; Debbarma, S.; Sahariah, D.; Gualtieri, C.; Kanga, S.; Singh, S.K.; Farooq, M. Integrated remote sensing and field-based approach to assess the temporal evolution and future projection of meanders: A case study on River Manu in North-Eastern India. PLoS ONE 2022, 17, e0271190. [Google Scholar] [CrossRef] [PubMed]
  39. Annayat, W.; Sil, B.S. Assessing Channel Morphology and Prediction of Centerline Channel Migration of the Barak River Using Geospatial Techniques. Bull. Eng. Geol. Environ. 2020, 79, 5161–5183. [Google Scholar] [CrossRef]
  40. Annayat, W.; Sil, B.S. Changes in Morphometric Meander Parameters and Prediction of Meander Channel Migration for the Alluvial Part of the Barak River. J. Geol. Soc. India 2020, 96, 279–291. [Google Scholar] [CrossRef]
  41. Ghosh, M.K.; Kumar, L.; Roy, C. Monitoring the Coastline Change of Hatiya Island in Bangladesh Using Remote Sensing Techniques. ISPRS J. Photogramm. Remote Sens. 2015, 101, 137–144. [Google Scholar] [CrossRef]
  42. Yao, Z.; Xiao, J.; Ta, W.; Jia, X. Planform Channel Dynamics along the Ningxia–Inner Mongolia Reaches of the Yellow River from 1958 to 2008: Analysis Using Landsat Images and Topographic Maps. Environ. Earth Sci. 2013, 70, 97–106. [Google Scholar] [CrossRef]
  43. Langat, P.K.; Kumar, L.; Koech, R. Monitoring River Channel Dynamics Using Remote Sensing and GIS Techniques. Geomorphology 2019, 325, 92–102. [Google Scholar] [CrossRef]
  44. Pan, J.J.; Chang, C.I. Destriping of Landsat MSS images by filtering techniques. Photogramm. Eng. Remote Sens. 1992, 58, 1417. [Google Scholar]
  45. Gatto, L.W.; Campbell, M.V.; Ehlen, J.; Ryerson, C.C.; Hunter, L.E.; Tracy, B.T. A GIS System for Inferring Subsurface Geology and Material Properties: Proof of Concept. In Engineering Research and Development Center Hanover Nh; Cold Regions Research and Engineering Lab: Hanover, NH, USA, 2006. [Google Scholar]
  46. Debnath, J.; Sahariah, D.; Lahon, D.; Nath, N.; Chand, K.; Meraj, G.; Farooq, M.; Kumar, P.; Kanga, S.; Singh, S.K. Geospatial modeling to assess the past and future land use-land cover changes in the Brahmaputra Valley, NE India, for sustainable land resource management. Environ. Sci. Pollut. Res. 2022, 1–24. [Google Scholar] [CrossRef]
  47. Wagner, M.A. Reconstruction of a Tornado Disaster Employing Remote Sensing Techniques: A Case Study of the 1999 Moore, Oklahoma Tornado. Master’s Thesis, Arizona State University, Tempe, AZ, USA, 2011. [Google Scholar]
  48. Ahmed, A.A.; Fawzi, A. Meandering and Bank Erosion of the River Nile and Its Environmental Impact on the Area between Sohag and El-Minia, Egypt. Arab. J. Geosci. 2011, 4, 1–11. [Google Scholar] [CrossRef]
  49. Thakur, P.K.; Laha, C.; Aggarwal, S.P. River Bank Erosion Hazard Study of River Ganga, Upstream of Farakka Barrage Using Remote Sensing and GIS. Nat. Hazards 2012, 61, 967–987. [Google Scholar] [CrossRef]
  50. Henshaw, A.J.; Gurnell, A.M.; Bertoldi, W.; Drake, N.A. An Assessment of the Degree to Which Landsat TM Data Can Support the Assessment of Fluvial Dynamics, as Revealed by Changes in Vegetation Extent and Channel Position, along a Large River. Geomorphology 2013, 202, 74–85. [Google Scholar] [CrossRef]
  51. Wajahat, A.; Sundar, S.B. Estimation and Analysis of Possible Flood for the Silchar City-a Case Study. Disaster Adv. 2018, 11. [Google Scholar]
  52. Saleh, F.; Ducharne, A.; Flipo, N.; Oudin, L.; Ledoux, E. Impact of River Bed Morphology on Discharge and Water Levels Simulated by a 1D Saint–Venant Hydraulic Model at Regional Scale. J. Hydrol. 2013, 476, 169–177. [Google Scholar] [CrossRef]
  53. Bernini, A.; Bosino, A.; Botha, G.A.; Maerker, M. Evaluation of Gully Erosion Susceptibility Using a Maximum Entropy Model in the Upper Mkhomazi River Basin in South Africa. ISPRS Int. J. Geo-Inf. 2021, 10, 729. [Google Scholar] [CrossRef]
  54. Debnath, J.; Pan, N.D.; Ahmed, I.; Bhowmik, M. Channel Migration and Its Impact on Land Use/Land Cover Using RS and GIS: A Study on Khowai River of Tripura, North-East. Egypt. J. Remote Sens. Space Sci. 2017, 20, 197–210. [Google Scholar] [CrossRef]
  55. Li, Z.; Yu, G.A.; Brierley, G.J.; Wang, Z.; Jia, Y. Migration and cutoff of meanders in the hyperarid environment of the middle Tarim River, northwestern China. Geomorphology 2017, 276, 116–124. [Google Scholar] [CrossRef]
  56. Timár, G. Controls on Channel Sinuosity Changes: A Case Study of the Tisza River, the Great Hungarian Plain. Quat. Sci. Rev. 2003, 22, 2199–2207. [Google Scholar] [CrossRef] [Green Version]
  57. Engel, F.L.; Rhoads, B.L. Interaction among Mean Flow, Turbulence, Bed Morphology, Bank Failures and Channel Planform in an Evolving Compound Meander Loop. Geomorphology 2012, 163, 70–83. [Google Scholar] [CrossRef]
  58. Meraj, G.; Romshoo, S.A.; Yousuf, A.R.; Altaf, S.; Altaf, F. Assessing the influence of watershed characteristics on the flood vulnerability of Jhelum basin in Kashmir Himalaya. Nat. Hazards 2015, 77, 153–175. [Google Scholar] [CrossRef]
  59. Cama, M.; Schillaci, C.; Kropáček, J.; Hochschild, V.; Bosino, A.; Märker, M. A Probabilistic Assessment of Soil Erosion Susceptibility in a Head Catchment of the Jemma Basin, Ethiopian Highlands. Geosciences 2020, 10, 248. [Google Scholar] [CrossRef]
  60. James, L.A.; Lecce, S.A. Impacts of Land-Use and Land-Cover Change on River Systems. Treatise Geomorphol. 2013, 9, 768–793. [Google Scholar]
  61. Meraj, G.; Khan, T.; Romshoo, S.A.; Farooq, M.; Rohitashw, K.; Sheikh, B.A. An Integrated Geoinformatics and Hydrological Modelling-Based Approach for Effective Flood Management in the Jhelum Basin, NW Himalaya. Proceedings 2019, 7, 8. [Google Scholar]
  62. Gurnell, A.M.; Rinaldi, M.; Belletti, B.; Bizzi, S.; Blamauer, B.; Braca, G.; Buijse, A.; Bussettini, M.; Camenen, B.; Comiti, F. A Multi-Scale Hierarchical Framework for Developing Understanding of River Behaviour to Support River Management. Aquat. Sci. 2016, 78, 1–16. [Google Scholar] [CrossRef] [Green Version]
  63. Halder, A.; Mowla Chowdhury, R. Evaluation of the river Padma morphological transition in the central Bangladesh using GIS and remote sensing techniques. Int. J. River Basin Manag. 2021, 1–15. [Google Scholar] [CrossRef]
  64. Altaf, F.; Meraj, G.; Romshoo, S.A. Morphometric analysis to infer hydrological behaviour of Lidder watershed, Western Himalaya, India. Geogr. J. 2013, 2013, 178021. [Google Scholar] [CrossRef] [Green Version]
  65. Sajan, B.; Mishra, V.N.; Kanga, S.; Meraj, G.; Singh, S.K.; Kumar, P. Cellular Automata-Based Artificial Neural Network Model for Assessing Past, Present, and Future Land Use/Land Cover Dynamics. Agronomy 2022, 12, 2772. [Google Scholar] [CrossRef]
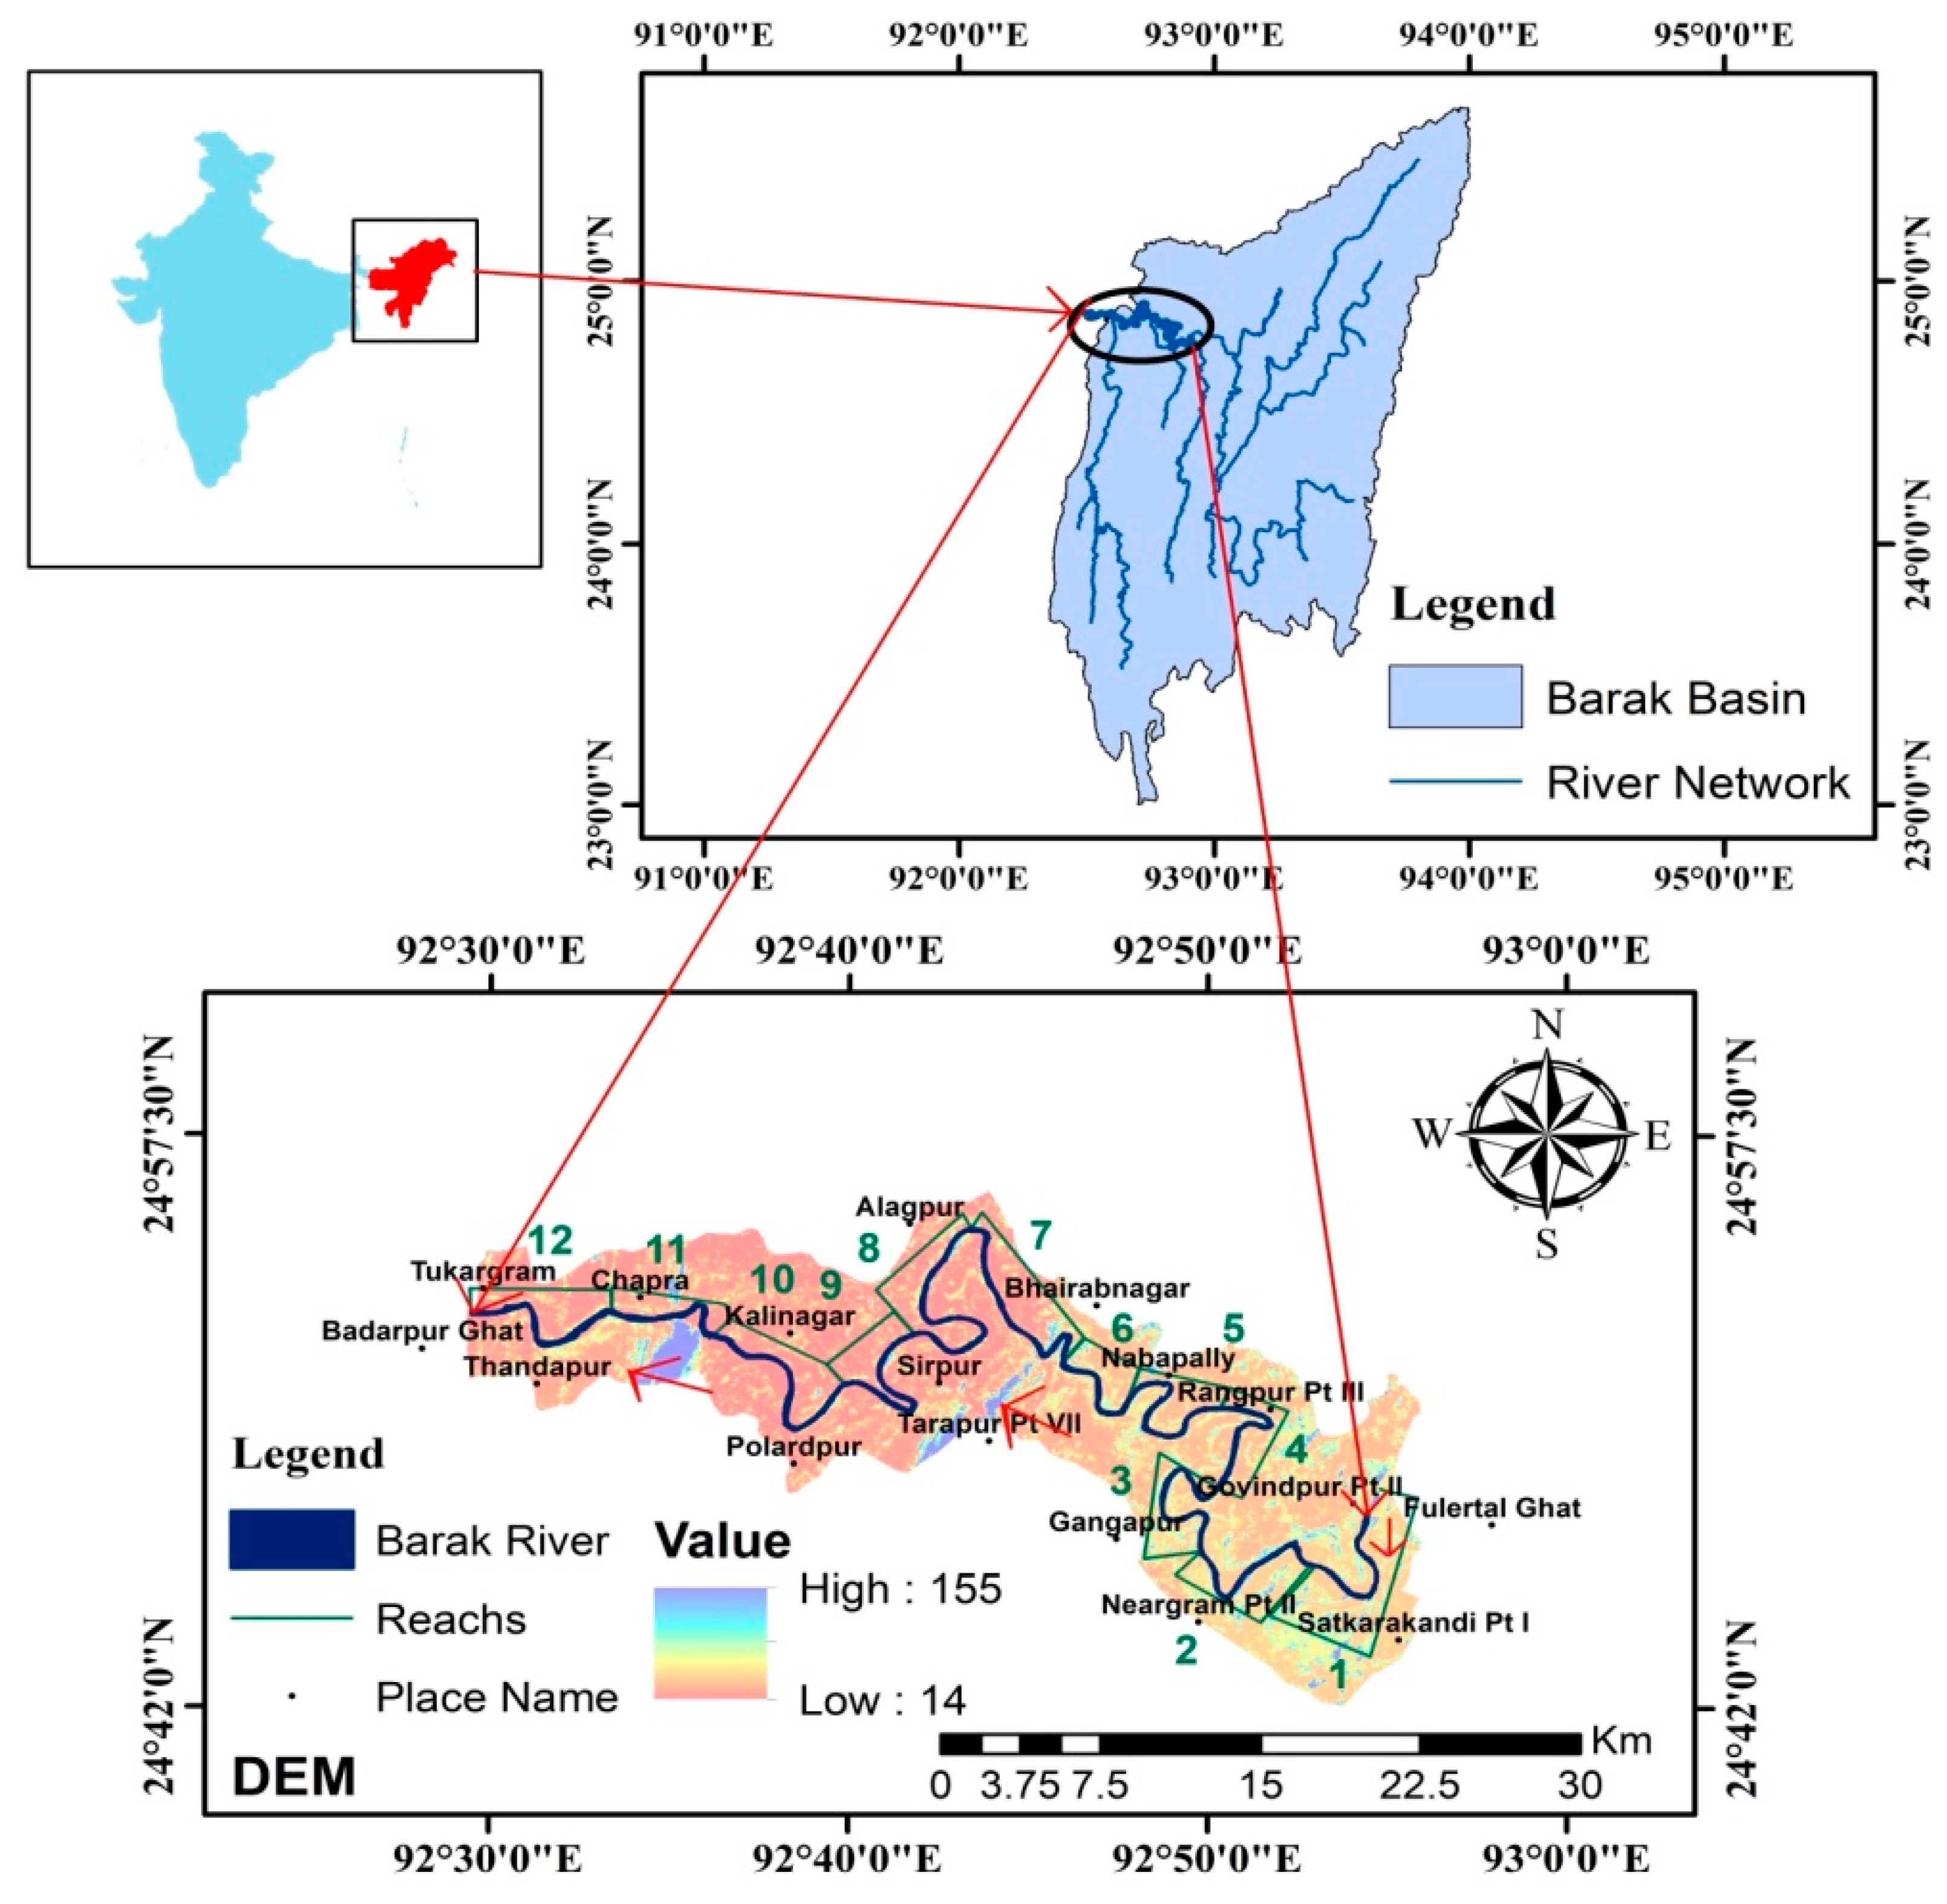
Figure 1. Location map of the study area showing 12 meandering reaches of the Barak River.
Conservation 03 00002 g001
Figure 2. Flowchart analysis of channel changes and dynamics of the Barak River.
Conservation 03 00002 g002
Figure 3. Landsat image of 1984 and 2017 (a,c). Land use land cover map of the Barak River of 1984 and 2017 (b,d).
Conservation 03 00002 g003
Figure 4. Settlement and arable lands of the Barak River.
Conservation 03 00002 g004
Figure 5. Map of erosion, accretion, and unchanged area between 1984 and 1992.
Conservation 03 00002 g005
Figure 6. Erosion, accretion, and unchanged area at various reaches (1–12) between 1984 and 1992.
Conservation 03 00002 g006
Figure 7. Erosion, accretion, and unchanged area 1992–2002.
Conservation 03 00002 g007
Figure 8. Erosion, accretion, and unchanged area at various reaches (1–12) between 1992 and 2002.
Conservation 03 00002 g008
Figure 9. Map of erosion, accretion, and unchanged area between 2002–2012.
Conservation 03 00002 g009
Figure 10. Erosion, accretion, and unchanged area at various reaches (1–12) between 2002–2012.
Conservation 03 00002 g010
Figure 11. Map of erosion, accretion, and unchanged area between 2012–2017.
Conservation 03 00002 g011
Figure 12. Erosion, accretion, and unchanged area at various reaches (1–12) between 2012–2017.
Conservation 03 00002 g012
Figure 13. Map of erosion, accretion, and unchanged area between 1984–2017.
Conservation 03 00002 g013
Figure 14. Erosion, accretion, and unchanged area at various reaches (1–12) between 1984–2017.
Conservation 03 00002 g014
Figure 15. Lateral erosion, accretion, and unchanged area at various reaches along the alluvial plains of the Barak River between 1984 and 2017.
Conservation 03 00002 g015
Table 1. List of Landsat satellite image information.
YearPath/RowAcquisition DateSatelliteSensorSource
1984136/4305/02/1984Landsat 1MSS
1992136/4309/01/1992Landsat 3TM
2002136/4305/02/2002Landsat 4ETMUnited States
2012136/4323/02/2012Landsat 5ETMGeological Survey
2017136/4318/12/2017Landsat 8OLI
Table 2. Total amount of erosion, deposition, and their difference from 1984–2017.
Year Area (ha)
ErosionAccretionDifference
1984–1992
1992–2002
2002–2012
2012–2017
1984–2017
666.42
498.01
332.69
727.56
541.11
405.6
539.88
540.187
351.32
1054.21
260.82
−41.87
−207.49
376.24
513.11
Table 3. LULC changes in (%) from 1984–2017.
Category20171984Difference
Area
(Km2)
%
Change
Area
(Km2)
%
Change
Area
(Km2)
%
Change
1Water36.087.8039.958.71−3.87−0.91
2Settlement73.7316.0925.795.6247.9410.47
3Vegetation175.5038.30242.7052.96−67.2−14.66
4Arable172.8937.73149.7832.6823.115.05
Total458.21100458.21100
Disclaimer/Publisher’s Note: The statements, opinions and data contained in all publications are solely those of the individual author(s) and contributor(s) and not of MDPI and/or the editor(s). MDPI and/or the editor(s) disclaim responsibility for any injury to people or property resulting from any ideas, methods, instructions or products referred to in the content.