
Assessing Landslide Susceptibility along India’s National Highway 58: A Comprehensive Approach Integrating Remote Sensing, GIS, and Logistic Regression Analysis
 , ,
, ,  , ,
, ,  ,
,  ,
,  ,
,  ,
,  and
and
Abstract
:1. Introduction
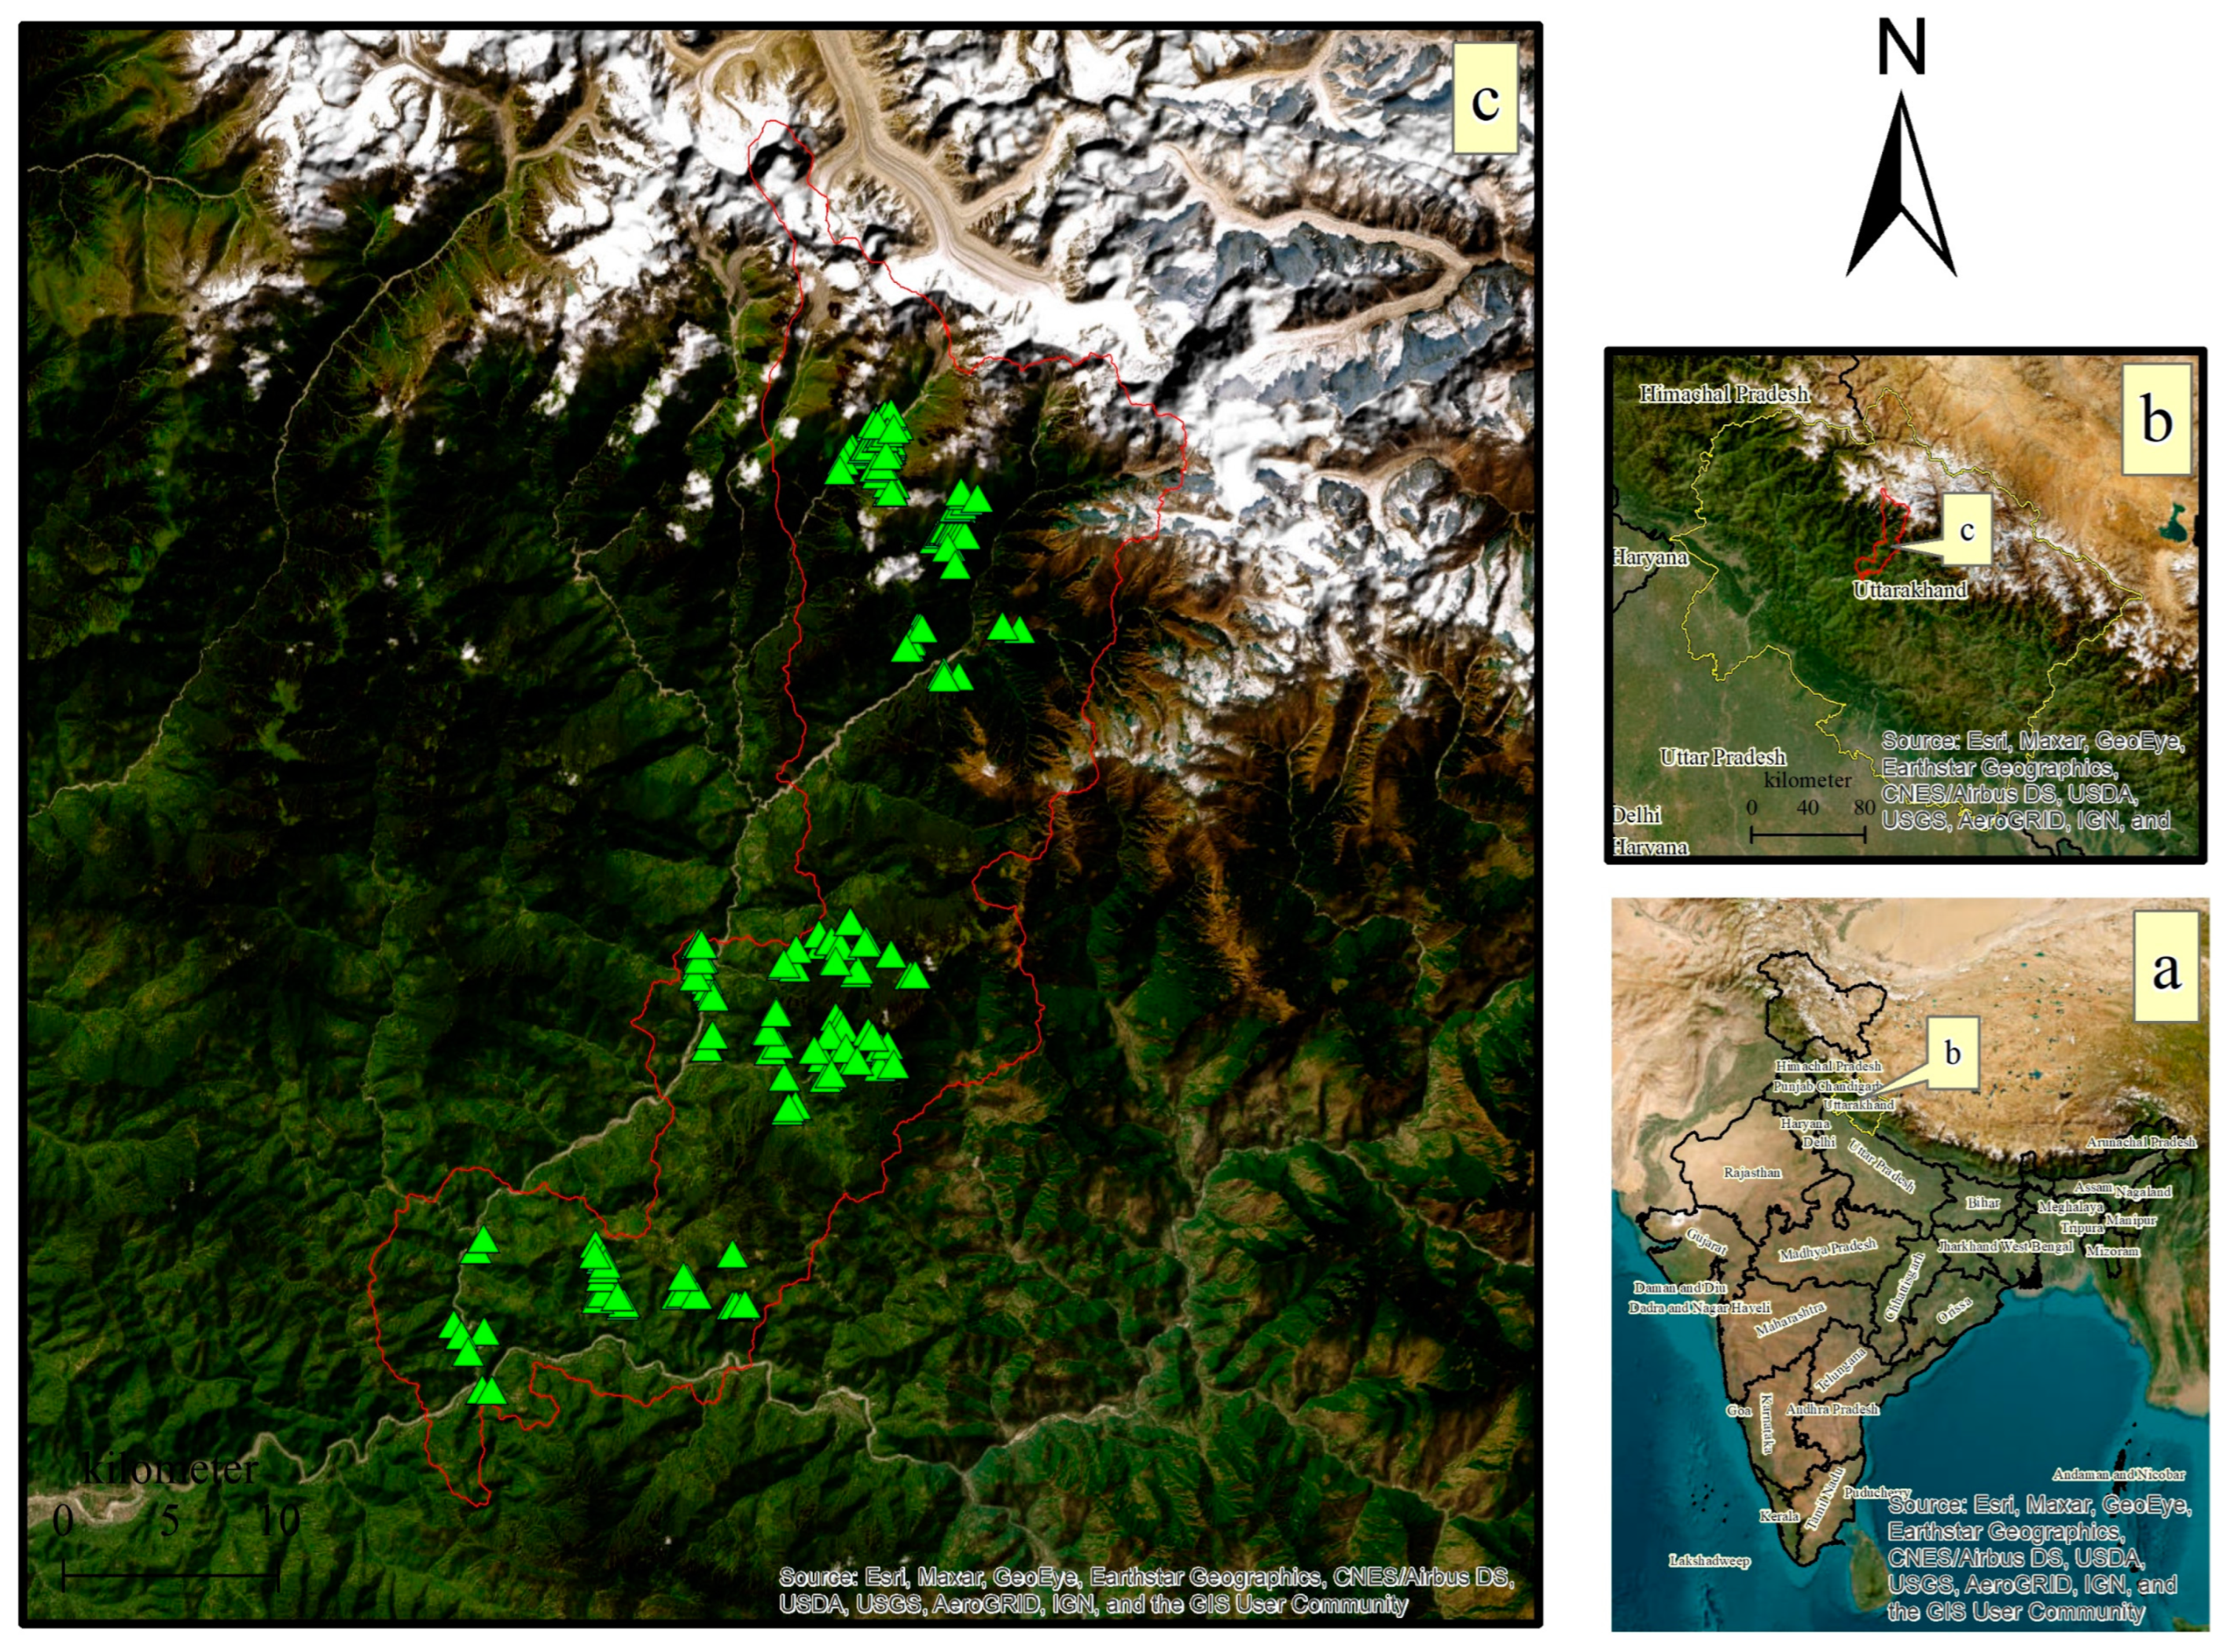
2. Study Area
3. Materials and Methods
3.1. Materials
3.2. Methods
 log it(p) = Ln(p/(1 − p)) = β0 + β1 X1 +⋯+ βn Xn
4. Result and Discussion
5. Conclusions
- The study leveraged a logistic regression technique to create a landslide susceptibility map at a regional scale, utilizing multiple data sources like satellite imagery, digital elevation models, and Google Earth’s GIS tool.
- The analysis demonstrated that landslides are predominantly influenced by inherent terrain conditions, encompassing moderate to steep slopes, high drainage density, ridges, and other landforms.
- Eleven independent variables were analyzed for their role in landslide occurrences, with four found to exert a positive influence on landslides.
- The resultant landslide susceptibility zonation (LSZ) map spotlighted high-susceptibility zones mainly in central regions, which are marked by specific features such as terraces and proximity to streams.
- The LSZ map underscored the negative implications of unplanned infrastructure on the Himalayan terrain, especially during the monsoon season.
- The receiver operating characteristic (ROC) curve technique confirmed the study’s accuracy, resulting in a commendable 92% prediction accuracy.
- The logistic regression model employed in this research is heralded as a beneficial tool for identifying landslide-prone regions.
- Emphasizing the integration of various independent variables and their synergies is crucial to creating an accurate landslide susceptibility map, which can aid in disaster prevention and planning.
- The insights from this study hold potential for application in other areas of India or globally, where geological and topographical parallels exist, validating the model’s transferability.
- Future extensions of this study could delve into the cost–benefit analysis of diverse landslide mitigation tactics, such as slope stabilization and land use planning, particularly along National Highway 58 and analogous vulnerable regions.
Author Contributions
Funding
Data Availability Statement
Conflicts of Interest
References
- UUNDRR. Sendai Framework for Disaster Risk Reduction 2015–2030; United Nations Office for Disaster Risk Reduction: Geneva, Switzerland, 2015; Available online: https://www.apec-epwg.org/media/2584/e1a8e2e1c1125430bcf585c521ca6bcb.pdf (accessed on 31 March 2021).
- Veerappan, R.; Negi, A.; Siddan, A. Landslide susceptibility mapping and comparison using frequency ratio and analytical hierarchy process in part of NH-58, Uttarakhand, India. In Advancing Culture of Living with Landslides: Volume 2 Advances in Landslide Science; Springer International Publishing: Berlin/Heidelberg, Germany, 2017; pp. 1081–1091. Available online: https://link.springer.com/chapter/10.1007/978-3-319-53498-5_123 (accessed on 31 March 2021).
- Saha, S.; Arabameri, A.; Saha, A.; Blaschke, T.; Ngo, P.T.T.; Nhu, V.H.; Band, S.S. Prediction of landslide susceptibility in Rudraprayag, India using novel ensemble of conditional probability and boosted regression tree-based on cross-validation method. Sci. Total. Environ. 2021, 764, 142928. [Google Scholar] [CrossRef] [PubMed]
- Malik, R.; Ghosh, S.; Dhar, S.; Singh, P.; Singh, I.M. GIS-Based Landslide Hazard Zonation Along National Highway-58, From Rishikesh to Joshimath, Uttarakhand, India. Int. J. Adv. Remote Sens. GIS Geogr. 2016, 4, 41–55. Available online: https://tinyurl.com/axmmpubb (accessed on 25 April 2023).
- Guri, P.K.; Champati Ray, P.K.; Patel, R.C. Spatial prediction of landslide susceptibility in parts of Garhwal Himalaya, India, using the weight of evidence modelling. Environ. Monit. Assess. 2015, 187, 324. Available online: https://link.springer.com/article/10.1007/s10661-015-4535-1 (accessed on 2 February 2023). [CrossRef]
- Mishra, V.; Jain, K. Satellite based assessment of artificial reservoir induced landslides in data scarce environment: A case study of Baglihar reservoir in India. J. Appl. Geophys. 2022, 205, 104754. [Google Scholar] [CrossRef]
- Sati, S.P.; Sharma, S.; Sundriyal, Y.P.; Rawat, D.; Riyal, M. Geo-environmental consequences of obstructing the Bhagirathi River, Uttarakhand Himalaya, India. Geomat. Nat. Hazards Risk 2020, 11, 887–905. [Google Scholar] [CrossRef]
- Mishra, V.; Jain, K. Detection and Monitoring of Very Slow Landslides in Vicinity of an Artificial Reservoir using Advanced Differential SAR Interferometry: A Case Study of Tehri Region, India. Authorea 2019. [Google Scholar] [CrossRef]
- Mishra, V.; Singh, C.; Jain, K. Monitoring of Artificial Reservoir Induced Landslides from Space: A Case Study of from India. ISPRS Int. Arch. Photogramm. Remote. Sens. Spat. Inf. Sci. 2022, XLIII-B3-2022, 1147–1152. [Google Scholar] [CrossRef]
- Anbalagan, R.; Kumar, R.; Lakshmanan, K.; Parida, S.; Neethu, S. Landslide hazard zonation mapping using frequency ratio and fuzzy logic approach, a case study of Lachung Valley, Sikkim. Geoenviron. Disasters 2015, 2, 6. [Google Scholar] [CrossRef]
- Anbalagan, R. Landslide hazard evaluation and zonation mapping in mountainous terrain. Eng. Geol. 1992, 32, 269–277. [Google Scholar] [CrossRef]
- Van Westen, C.J.; Van Asch, T.W.J.; Soeters, R. Landslide hazard and risk zonation—Why is it still so difficult? Bull. Eng. Geol. Environ. 2006, 65, 167–184. [Google Scholar] [CrossRef]
- Fayaz, M.; Meraj, G.; Khader, S.A.; Farooq, M.; Kanga, S.; Singh, S.K.; Kumar, P.; Sahu, N. Management of Landslides in a Rural–Urban Transition Zone Using Machine Learning Algorithms—A Case Study of a National Highway (NH-44), India, in the Rugged Himalayan Terrains. Land 2022, 11, 884. [Google Scholar] [CrossRef]
- Chowdhury, S. A review on landslide susceptibility mapping research in Bangladesh. Heliyon 2023, 9, e17972. [Google Scholar] [CrossRef]
- Dhungana, G.; Ghimire, R.; Poudel, R.; Kumal, S. Landslide susceptibility and risk analysis in Benighat Rural Municipality, Dhading, Nepal. Nat. Hazards Res. 2023, 3, 170–185. [Google Scholar] [CrossRef]
- Wang, D.; Hao, M.; Chen, S.; Meng, Z.; Jiang, D.; Ding, F. Assessment of landslide susceptibility and risk factors in China. Nat. Hazards 2021, 108, 3045–3059. [Google Scholar] [CrossRef]
- Shah, A.A.; Qadri, T.; Khwaja, S. Living with earthquake hazards in South and South East Asia. ASEAN J. Community Engag. 2018, 2, 15. [Google Scholar] [CrossRef]
- Talha Qadri, S.M.; Aminul Islam, M.; Shalaby, M.R.; Khattak, K.R.; Sajjad, S.H. Characterizing site response in the Attock Basin, Pakistan, using microtremor measurement analysis. Arab. J. Geosci. 2017, 10, 267. [Google Scholar] [CrossRef]
- Qadri, S.T.; Sajjad, S.H.; Sheikh, R.A.; Rehman, K.; Rafi, Z.; Nawaz, B.; Haider, W. Ambient noise measurements in Rawalpindi–Islamabad, twin cities of Pakistan: A step towards site response analysis to mitigate impact of natural hazard. Nat. Hazards 2015, 78, 1111–1123. [Google Scholar] [CrossRef]
- Ruff, M.; Czurda, K. Landslide susceptibility analysis with a heuristic approach in the Eastern Alps (Vorarlberg, Austria). Geomorphology 2008, 94, 314–324. [Google Scholar] [CrossRef]
- Bijukchhen, S.M.; Kayastha, P.; Dhital, M.R. A comparative evaluation of heuristic and bivariate statistical modelling for landslide susceptibility mappings in Ghurmi–Dhad Khola, east Nepal. Arab. J. Geosci. 2012, 6, 2727–2743. [Google Scholar] [CrossRef]
- Mani, S.; Saranaathan, S.E. Landslide hazard zonation mapping on meso-scale in SH-37 ghat section, Nadugani, Gudalur, the Nilgiris, India. Arab. J. Geosci. 2017, 10, 161. [Google Scholar] [CrossRef]
- Ayalew, L.; Yamagishi, H.; Marui, H.; Kanno, T. Landslides in Sado Island of Japan: Part II. GIS-based susceptibility mapping with comparisons of results from two methods and verifications. Eng. Geol. 2005, 81, 432–445. [Google Scholar] [CrossRef]
- Ayalew, L.; Yamagishi, H.; Ugawa, N. Landslide susceptibility mapping using GIS-based weighted linear combination, the case in Tsugawa area of Agano River, Niigata Prefecture, Japan. Landslides 2004, 1, 73–81. [Google Scholar] [CrossRef]
- Yalcin, A. GIS-based landslide susceptibility mapping using analytical hierarchy process and bivariate statistics in Ardesen (Turkey): Comparisons of results and confirmations. CATENA 2008, 72, 1–12. [Google Scholar] [CrossRef]
- Yilmaz, I. Landslide susceptibility mapping using frequency ratio, logistic regression, artificial neural networks and their comparison: A case study from Kat landslides (Tokat—Turkey). Comput. Geosci. 2009, 35, 1125–1138. [Google Scholar] [CrossRef]
- Umar, Z.; Pradhan, B.; Ahmad, A.; Jebur, M.N.; Tehrany, M.S. Earthquake induced landslide susceptibility mapping using an integrated ensemble frequency ratio and logistic regression models in West Sumatera Province, Indonesia. CATENA 2014, 118, 124–135. [Google Scholar] [CrossRef]
- Kumar, D.; Thakur, M.; Dubey, C.S.; Shukla, D.P. Landslide susceptibility mapping & prediction using Support Vector Machine for Mandakini River Basin, Garhwal Himalaya, India. Geomorphology 2017, 295, 115–125. [Google Scholar] [CrossRef]
- Sharma, S.; Mahajan, A.K. A comparative assessment of information value, frequency ratio and analytical hierarchy process models for landslide susceptibility mapping of a Himalayan watershed, India. Bull. Eng. Geol. Environ. 2019, 78, 2431–2448. [Google Scholar] [CrossRef]
- Guzzetti, F.; Reichenbach, P.; Cardinali, M.; Galli, M.; Ardizzone, F. Probabilistic landslide hazard assessment at the basin scale. Geomorphology 2005, 72, 272–299. [Google Scholar] [CrossRef]
- Champati Ray, P.K.; Dimri, S.; Lakhera, R.C.; Sati, S. Fuzzy-based method for landslide hazard assessment in active seismic zone of Himalaya. Landslides 2007, 4, 101–111. [Google Scholar] [CrossRef]
- Rozos, D.; Bathrellos, G.D.; Skillodimou, H.D. Comparison of the implementation of rock engineering system and analytic hierarchy process methods, upon landslide susceptibility mapping, using GIS: A case study from the Eastern Achaia County of Peloponnesus, Greece. Environ. Earth Sci. 2011, 63, 49–63. [Google Scholar] [CrossRef]
- Pourghasemi, H.R.; Pradhan, B.; Gokceoglu, C. Application of fuzzy logic and analytical hierarchy process (AHP) to landslide susceptibility mapping at Haraz watershed, Iran. Nat. Hazards 2012, 63, 965–996. [Google Scholar] [CrossRef]
- Feizizadeh, B.; Shadman Roodposhti, M.; Jankowski, P.; Blaschke, T. A GIS-based extended fuzzy multi-criteria evaluation for landslide susceptibility mapping. Comput. Geosci. 2014, 73, 208–221. [Google Scholar] [CrossRef] [PubMed]
- Kumar, R.; Anbalagan, R. Landslide susceptibility mapping using analytical hierarchy process (AHP) in Tehri reservoir rim region, Uttarakhand. J. Geol. Soc. India 2016, 87, 271–286. [Google Scholar] [CrossRef]
- Shahabi, H.; Hashim, M.; Ahmad, B.B. Remote sensing and GIS-based landslide susceptibility mapping using frequency ratio, logistic regression, and fuzzy logic methods at the central Zab basin, Iran. Environ. Earth Sci. 2015, 73, 8647–8668. [Google Scholar] [CrossRef]
- Wang, F.; Xu, P.; Wang, C.; Wang, N.; Jiang, N. Application of a GIS-Based Slope Unit Method for Landslide Susceptibility Mapping along the Longzi River, Southeastern Tibetan Plateau, China. ISPRS Int. J. Geo-Inf. 2017, 6, 172. [Google Scholar] [CrossRef]
- Armaş, I.; Vartolomei, F.; Stroia, F.; Braşoveanu, L. Landslide susceptibility deterministic approach using geographic information systems: Application to Breaza town, Romania. Nat. Hazards 2014, 70, 995–1017. [Google Scholar] [CrossRef]
- Sarkar, S.; Roy, A.K.; Raha, P. Deterministic approach for susceptibility assessment of shallow debris slide in the Darjeeling Himalayas, India. CATENA 2016, 142, 36–46. [Google Scholar] [CrossRef]
- Upadhyay, R.K.; Tripathi, G.; Đurin, B.; Šamanović, S.; Cetl, V.; Kishore, N.; Sharma, M.; Singh, S.K.; Kanga, S.; Wasim, M.; et al. Groundwater Potential Zone Mapping in the Ghaggar River Basin, North-West India, Using Integrated Remote Sensing and GIS Techniques. Water 2023, 15, 961. [Google Scholar] [CrossRef]
- Tripathi, G.; Shakya, A.; Upadhyay, R.K.; Singh, S.K.; Kanga, S.; Pandey, S.K. Landslide Susceptibility Mapping of Tehri Reservoir Region Using Geospatial Approach. In Climate Change Adaptation, Risk Management and Sustainable Practices in the Himalaya; Sharma, S., Kuniyal, J.C., Chand, P., Singh, P., Eds.; Springer: Cham, Switzerland, 2023; pp. 135–156. ISBN 978-3-031-24658-6. [Google Scholar]
- Lee, S.; Choi, J.; Min, K. Probabilistic landslide hazard mapping using GIS and remote sensing data at Boun, Korea. Int. J. Remote. Sens. 2004, 25, 2037–2052. [Google Scholar] [CrossRef]
- Arora, M.K.; Das Gupta, A.S.; Gupta, R.P. An artificial neural network approach for landslide hazard zonation in the Bhagirathi (Ganga) Valley, Himalayas. Int. J. Remote. Sens. 2004, 25, 559–572. [Google Scholar] [CrossRef]
- Chau, K.T.; Chan, J.E. Regional bias of landslide data in generating susceptibility maps using logistic regression: Case of Hong Kong Island. Landslides 2005, 2, 280–290. [Google Scholar] [CrossRef]
- Pradhan, B. A comparative study on the predictive ability of the decision tree, support vector machine and neuro-fuzzy models in landslide susceptibility mapping using GIS. Comput. Geosci. 2013, 51, 350–365. [Google Scholar] [CrossRef]
- Saha, A.K.; Gupta, R.P.; Arora, M.K. GIS-based Landslide Hazard Zonation in the Bhagirathi (Ganga) Valley, Himalayas. Int. J. Remote. Sens. 2002, 23, 357–369. [Google Scholar] [CrossRef]
- Tien Bui, D.; Pradhan, B.; Lofman, O.; Revhaug, I.; Dick, O.B. Spatial prediction of landslide hazards in Hoa Binh province (Vietnam): A comparative assessment of the efficacy of evidential belief functions and fuzzy logic models. CATENA 2012, 96, 28–40. [Google Scholar] [CrossRef]
- Tien Bui, D.; Tuan, T.A.; Hoang, N.-D.; Thanh, N.Q.; Nguyen, D.B.; Van Liem, N.; Pradhan, B. Spatial prediction of rainfall-induced landslides for the Lao Cai area (Vietnam) using a hybrid intelligent approach of least squares support vector machines inference model and artificial bee colony optimization. Landslides 2017, 14, 447–458. [Google Scholar] [CrossRef]
- Hong, H.; Liu, J.; Bui, D.T.; Pradhan, B.; Acharya, T.D.; Pham, B.T.; Zhu, A.-X.; Chen, W.; Ahmad, B.B. Landslide susceptibility mapping using J48 Decision Tree with AdaBoost, Bagging and Rotation Forest ensembles in the Guangchang area (China). CATENA 2018, 163, 399–413. [Google Scholar] [CrossRef]
- Petschko, H.; Brenning, A.; Bell, R.; Goetz, J.; Glade, T. Assessing the quality of landslide susceptibility maps–case study Lower Austria. Nat. Hazards Earth Syst. Sci. 2014, 14, 95–118. [Google Scholar] [CrossRef]
- Amani, M.; Ghorbanian, A.; Ahmadi, S.A.; Kakooei, M.; Moghimi, A.; Mirmazloumi, S.M.; Moghaddam, S.H.A.; Mahdavi, S.; Ghahremanloo, M.; Parsian, S.; et al. Google Earth Engine Cloud Computing Platform for Remote Sensing Big Data Applications: A Comprehensive Review. IEEE J. Sel. Top. Appl. Earth Obs. Remote. Sens. 2020, 13, 5326–5350. [Google Scholar] [CrossRef]
- Dahal, R.K.; Hasegawa, S.; Nonomura, A.; Yamanaka, M.; Masuda, T.; Nishino, K. GIS-based weights-of-evidence modelling of rainfall-induced landslides in small catchments for landslide susceptibility mapping. Environ. Geol. 2007, 54, 311–324. [Google Scholar] [CrossRef]
- Lee, C.F.; Li, J.; Xu, Z.W.; Dai, F.C. Assessment of landslide susceptibility on the natural terrain of Lantau Island, Hong Kong. Environ. Geol. 2001, 40, 381–391. [Google Scholar] [CrossRef]
- Siddque, T.; Pradhan, S.P. Stability and sensitivity analysis of Himalayan road cut debris slopes: An investigation along NH-58, India. Nat. Hazards 2018, 93, 577–600. [Google Scholar] [CrossRef]
- DeCelles, P.G.; Gehrels, G.E.; Quade, J.; Ojha, T.P. Eocene-early Miocene foreland basin development and the history of Himalayan thrusting, western and central Nepal. Tectonics 1998, 17, 741–765. [Google Scholar] [CrossRef]
- Grozavu, A.; Pleşcan, S.; Patriche, C.V.; Mărgărint, M.C.; Roşca, B. Landslide Susceptibility Assessment: GIS Application to a Complex Mountainous Environment. In The Carpathians: Integrating Nature and Society Towards Sustainability; Kozak, J., Ostapowicz, K., Bytnerowicz, A., Wyżga, B., Eds.; Environmental Science and Engineering; Springer: Berlin/Heidelberg, Germany, 2013; pp. 31–44. ISBN 978-3-642-12724-3. [Google Scholar]
- Upreti, B.N. An overview of the stratigraphy and tectonics of the Nepal Himalaya. J. Asian Earth Sci. 1999, 17, 577–606. [Google Scholar] [CrossRef]
- Ahmad, T.; Harris, N.; Bickle, M.; Chapman, H.; Bunbury, J.; Prince, C. Isotopic Constraints on the Structural Relationships between the Lesser Himalayan Series and the High Himalayan Crystalline Series, Garhwal Himalaya. Geol. Soc. Am. Bull. 2000, 112, 467–477. [Google Scholar] [CrossRef]
- Valdiya, K.S. Himalayan transverse faults and folds and their parallelism with subsurface structures of North Indian plains. Tectonophysics 1976, 32, 353–386. [Google Scholar] [CrossRef]
- Kundu, S.; Saha, A.K.; Sharma, D.C.; Pant, C.C. Remote Sensing and GIS Based Landslide Susceptibility Assessment using Binary Logistic Regression Model: A Case Study in the Ganeshganga Watershed, Himalayas. J. Indian Soc. Remote. Sens. 2013, 41, 697–709. [Google Scholar] [CrossRef]
- Mathew, J.; Babu, D.G.; Kundu, S.; Kumar, K.V.; Pant, C.C. Integrating intensity–duration-based rainfall threshold and antecedent rainfall-based probability estimate towards generating early warning for rainfall-induced landslides in parts of the Garhwal Himalaya, India. Landslides 2014, 11, 575–588. [Google Scholar] [CrossRef]
- Skrzypczak, I.; Kokoszka, W.; Zientek, D.; Tang, Y.; Kogut, J. Landslide Hazard Assessment Map as an Element Supporting Spatial Planning: The Flysch Carpathians Region Study. Remote. Sens. 2021, 13, 317. [Google Scholar] [CrossRef]
- Thakur, P.K.; Garg, V.; Nikam, B.R.; Aggarwal, S.P.; Aggarwal, S.; Singh, D. Snow, Glacier, and Glacier Lake Mapping and Monitoring Using Remote Sensing Data. In Water, Cryosphere, and Climate Change in the Himalayas; Taloor, A.K., Kotlia, B.S., Kumar, K., Eds.; Geography of the Physical Environment; Springer International Publishing: Cham, Switzerland, 2021; pp. 57–84. ISBN 978-3-030-67931-6. [Google Scholar]
- Saha, A.K.; Gupta, R.P.; Sarkar, I.; Arora, M.K.; Csaplovics, E. An approach for GIS-based statistical landslide susceptibility zonation?with a case study in the Himalayas. Landslides 2005, 2, 61–69. [Google Scholar] [CrossRef]
- Gupta, R.P.; Kanungo, D.P.; Arora, M.K.; Sarkar, S. Approaches for comparative evaluation of raster GIS-based landslide susceptibility zonation maps. Int. J. Appl. Earth Obs. Geoinf. 2008, 10, 330–341. [Google Scholar] [CrossRef]
- Dai, F.C.; Lee, C.F. Landslide characteristics and slope instability modeling using GIS, Lantau Island, Hong Kong. Geomorphology 2002, 42, 213–228. [Google Scholar] [CrossRef]
- Ohlmacher, G.C.; Davis, J.C. Using multiple logistic regression and GIS technology to predict landslide hazard in northeast Kansas, USA. Eng. Geol. 2003, 69, 331–343. [Google Scholar] [CrossRef]
- Davis, J.C.; Chung, C.-J.; Ohlmacher, G.C. Two models for evaluating landslide hazards. Comput. Geosci. 2006, 32, 1120–1127. [Google Scholar] [CrossRef]
- Lee, S.; Pradhan, B. Landslide hazard mapping at Selangor, Malaysia using frequency ratio and logistic regression models. Landslides 2006, 4, 33–41. [Google Scholar] [CrossRef]
- Nefeslioglu, H.A.; Gokceoglu, C.; Sonmez, H. An assessment on the use of logistic regression and artificial neural networks with different sampling strategies for the preparation of landslide susceptibility maps. Eng. Geol. 2008, 97, 171–191. [Google Scholar] [CrossRef]


| S. No. | Data Type | Product Used | Source | Software/Platforms |
|---|---|---|---|---|
| 1 | Digital Elevation Model (DEM) | Elevation, Aspect, Curvature, Slope, Flow Accumulation, Drainage Density | ALOS PALSAR DEM (12.5 m) | ArcGIS 10.7 |
| 2 | Multi-Spectral Data | Land Use and Land Cover | Sentinel-2 (10 m) | ERDAS Imagine 10.1 |
| 3 | Geology and Fault Lines | Geology and Distance from Fault | Geological Survey of India (1:50 k) | QGIS (12.4) |
| 4 | Geomorphology | Geomorphology | NRSC (1:50 k) | QGIS (12.4) |
| 5 | Road Network | Distance from Road | OpenStreetMap (1:1 k) | QGIS (12.4) |
| 6 | Training Data | Landslide Inventories | News Paper reports, Field observation | Google Earth Pro |
| Variables | Estimate | Std. Error | z Value | Pr(>|z|) |
|---|---|---|---|---|
| (Intercept) | −2.37 | 3.62 × 10⁻¹ | −6.562 | 5.31 × 10⁻¹¹ *** |
| Aspect | −7.13 × 10⁻⁴ | 4.88 × 10⁻⁴ | −1.461 | 0.14406 |
| Curvature | −5.53 × 10⁻² | 3.68 × 10⁻² | −1.503 | 0.13273 |
| Drainage Density | 1.10 | 3.78 × 10⁻¹ | 2.924 | 0.00346 ** |
| Elevation | −5.62 × 10⁻⁴ | 9.03 × 10⁻⁵ | −6.221 | 4.95 × 10⁻¹⁰ *** |
| Fault | −1.69 × 10⁻⁵ | 1.91 × 10⁻⁵ | −0.882 | 0.37768 |
| Flow Accumulation | −2.71 × 10⁻⁸ | 4.04 × 10⁻⁸ | −0.672 | 0.50153 |
| Geology | 7.98 × 10⁻⁸ | 2.73 × 10⁻⁸ | 2.92 | 0.00350 ** |
| Geomorphology | 1.76 × 10⁻⁸ | 4.92 × 10⁻⁹ | 3.568 | 0.00036 *** |
| LULC | −6.08 × 10⁻⁸ | 4.45 × 10⁻⁹ | −13.648 | <2 × 10⁻¹⁶ *** |
| Road Distance | −1.19 × 10⁻³ | 8.62 × 10⁻⁵ | −13.761 | <2 × 10⁻¹⁶ *** |
| Slope | 1.24 × 10⁻¹ | 4.18 × 10⁻³ | 29.546 | <2 × 10⁻¹⁶ *** |
| Observed | Predicted | ||
|---|---|---|---|
| Absence of Landslide (0) | Presence of Landslide (1) | Model Accuracy (%) | |
| Absence of landslide (0) | 1988 | 312 | 86.4 |
| Presence of landslide (1) | 276 | 2024 | 88.0 |
| Overall accuracy (%) | 87.2 | ||
Disclaimer/Publisher’s Note: The statements, opinions and data contained in all publications are solely those of the individual author(s) and contributor(s) and not of MDPI and/or the editor(s). MDPI and/or the editor(s) disclaim responsibility for any injury to people or property resulting from any ideas, methods, instructions or products referred to in the content. |
© 2023 by the authors. Licensee MDPI, Basel, Switzerland. This article is an open access article distributed under the terms and conditions of the Creative Commons Attribution (CC BY) license (https://creativecommons.org/licenses/by/4.0/).
Share and Cite
Sharma, M.; Upadhyay, R.K.; Tripathi, G.; Kishore, N.; Shakya, A.; Meraj, G.; Kanga, S.; Singh, S.K.; Kumar, P.; Johnson, B.A.; et al. Assessing Landslide Susceptibility along India’s National Highway 58: A Comprehensive Approach Integrating Remote Sensing, GIS, and Logistic Regression Analysis. Conservation 2023, 3, 444-459. https://doi.org/10.3390/conservation3030030
Sharma M, Upadhyay RK, Tripathi G, Kishore N, Shakya A, Meraj G, Kanga S, Singh SK, Kumar P, Johnson BA, et al. Assessing Landslide Susceptibility along India’s National Highway 58: A Comprehensive Approach Integrating Remote Sensing, GIS, and Logistic Regression Analysis. Conservation. 2023; 3(3):444-459. https://doi.org/10.3390/conservation3030030
Chicago/Turabian StyleSharma, Mukta, Ritambhara K. Upadhyay, Gaurav Tripathi, Naval Kishore, Achala Shakya, Gowhar Meraj, Shruti Kanga, Suraj Kumar Singh, Pankaj Kumar, Brian Alan Johnson, and et al. 2023. "Assessing Landslide Susceptibility along India’s National Highway 58: A Comprehensive Approach Integrating Remote Sensing, GIS, and Logistic Regression Analysis" Conservation 3, no. 3: 444-459. https://doi.org/10.3390/conservation3030030