Abstract
This study assesses the conservation effectiveness of 21 protected areas (PAs) in Northern Morocco, comprising 3 parks and 18 Sites of Ecological and Biological Interest (SBEIs), against five major landscape pressures (LSPs): deforestation, infrastructure extension, agricultural expansion, fires, and population growth. We propose a novel quantitative methodology using global remote sensing data and exploratory spatial data analysis (ESDA). Data were sourced from Global Forest Change (GFC), Global Land Analysis and Discovery (GLAD), Burned Area Product (MODIS Fire_CCI51), and World Population datasets. The combined impact of the five LSPs was measured using a cumulative effect index (CEI), calculated with the Shannon–Wiener formula at a 1 km2 scale. The CEI was analyzed alongside the distance to the PAs’ network using Moran’s index, identifying four spatial association types: high–high (HH), high–low (HL), low–low (LL), low–high (LH), and non-significant (NS) cells. This analysis defined four zones: inner zone (IZ), potential spillover effect zone (PSEZ), statistically non-significant zone (SNSZ), and non-potential effect zone (NPEZ). Conservation effectiveness was quantified using the conservation ratio (CR), which compared the prevalence of LL versus HL units within IZs and PSEZs. Four disturbance levels (very high, high, medium, and low) were assigned to CR values (0–25%, 25–50%, 50–75%, 75–100%), resulting in sixteen potential conservation effectiveness typologies. Initial findings indicated similar deforestation patterns between protected and unprotected zones, with wildfires causing over half of forest losses within PAs. Conservation effectiveness results categorized the 21 PAs into nine typologies, from high conservation to very high disturbance levels. A significant positive correlation (71%) between CRs in both zones underscored the uniform impact of LSPs, regardless of protection status. However, protected natural area zones in the parks category showed minimal disruption, attributed to their advanced protection status. Finally, we developed a methodological framework for potential application in other regions based on this case study.
1. Introduction
Protected areas (PAs) are the cornerstone of any strategy for conserving biodiversity and are an important focus of work under the Convention on Biological Diversity (CBD). Approximately 12.2% of land and 5.9% of territorial marine areas are under some form of legal protection. The global coverage of PAs has undergone a remarkable expansion, surpassing 50 million km2 over the past decade [1]. This escalating trend underscores the pivotal role of PAs as an essential tool to maintain intact biodiverse ecosystems. When appropriately planned and efficiently managed, PAs can assume a crucial function in addressing various drivers of biodiversity loss. Moreover, they have the potential to sustain numerous ecosystem services essential to human well-being, including support for sustainable livelihoods, health, food and water security, as well as involvement in climate change mitigation, adaptation, and disaster risk reduction [2].
In the western part of the Mediterranean region, Morocco stands out as the richest country in terms of global biodiversity. Thanks to its geographical location (a true crossroads between Europe and Africa and between the Mediterranean and the Atlantic), the diversity of its climate and habitats, and its paleontological history, this country exhibits a wide variety of ecosystems and animal and plant species. This remarkable biological richness holds high ecological value and socio-economic interest for the nation [3]. Nevertheless, significant threats originating from various human activities pose a serious challenge to this biodiversity, as is the case in many other countries around the world. Ecosystems are directly or indirectly affected by several anthropogenic activities (intensive agriculture, overgrazing, industry, urbanization, etc.) linked to the economic development and demographic growth experienced by the country. The repercussions of these diverse activities often contradict the goals of rational and sustainable management of natural resources, thereby jeopardizing the preservation of biological richness. In some extreme cases, adverse effects result in the irreversible disappearance of animal or plant species [4].
Morocco, having recognized the importance of its biodiversity wealth, did not fail to implement efforts on multiple fronts to preserve elements of its natural heritage. As early as the 1940s, programs were established to create national parks, and various actions were taken by the state and local communities to preserve the biodiversity and natural resources of the Moroccan territory. The Kingdom signed the CBD on 13 June 1992 and ratified it on 21 August 1995. Since then, it has expressed its international commitment to conserving and sustainably using biological diversity, as well as adopting and implementing measures to promote access to genetic resources and the fair and equitable sharing of benefits arising from their use. Over the years, the country has overseen the establishment of a system of PAs that encompass unique ecosystems representing its biological diversity [5]. Currently, efforts continue to strengthen and network all these spaces to enable them to fulfill their role in conserving natural resources for the benefit of sustainable local development [6].
The northern region of Morocco emerges as a noteworthy illustration where a rich natural heritage is confronted with increasing anthropogenic or natural disturbances. The region exhibits a complex socio-economic dynamic, characterized by a diversity of factors influencing its environment. Over recent years, these socio-economic dynamics have instigated significant alterations in the terrestrial landscape, encompassing the expansion of urban areas, shifts in agricultural practices, and frequent environmental degradation. The mounting demographic pressure and escalating development demands have spurred transformations in land use, making it delicate to balance the challenges of economic expansion and the preservation of natural resources. Specifically, the 2013 report on the environmental state of the Tangier-Tetouan region emphasized this same observation while identifying the major environmental challenges of the region. These challenges encompass issues such as soil erosion, deforestation, coastal development linked to urban expansion, and emissions contributing to atmospheric pollution and climate change [7].
Similarly, the 2009 report on urban mobility in the Tangier agglomeration highlights that the natural potential of the region remains fragile due to difficulties associated with the degradation of natural resources (water, forest, soil). The rugged terrain exacerbates soil erosion and accelerates dam siltation. Wildfires, overgrazing and cannabis cultivation contribute to increased pressure on forest cover through deforestation, while the coastline is particularly affected by dual pressures from urbanization and tourist development [8].
In an earlier study, we shed light on the drivers of deforestation from 2001 to 2020 in the Tangier-Tetouan-Al Hoceima (TTA) region, a northern Moroccan area distinguished by the country’s highest deforestation rate [9]. Through an extensive review of the existing literature and employing Geist and Lambin’s deforestation framework (2002), we identified five key causes: infrastructure extension, agricultural expansion, logging, and wildfires as direct causes, and demographic factor as an indirect cause [10]. The used data were sourced from diverse databases, including Global Forest Change (GFC), Global Land Analysis and Discovery (GLAD), Burned Area Product (MODIS Fire_CCI51), World Population, Forest Proximate People (FPP), and National Forest Inventory (NFI). The main results indicated that wildfires were the primary driver of deforestation in the region, accounting for a percentage of 35.2%, followed by agricultural expansion (30.6%), logging (13.2%), and infrastructure extension (10.1%). The remaining 10.9% of losses were attributed to other disturbances, such as illegal extraction, pests, and dieback. Additionally, considering the complex dynamics in the region’s terrestrial landscape in recent years, we concluded our analysis by providing a comprehensive description of the spatial patterns of five major landscape pressures (LSP): deforestation, infrastructure expansion, agricultural expansion, fires, and demographic growth [9].
It is quite evident that during the present study, our initial focus was to capitalize on the results of our previous research to explore the factors contributing to deforestation within the region’s PA network, along with an examination of the primary LSP at play. It should be noted that in the realm of biodiversity management, the TTA region currently possesses a network of 21 PAs covering a total terrestrial area of 2270 km2 [11]. Additionally, previous research on this network has mainly focused on individual studies that highlight the ecological potential as well as the human and natural threats these areas encounter. Hence, there is a significant lack of comprehensive assessment of the efficacy of PAs in the region. Our ultimate objective was to fill this gap by evaluating the conservation effectiveness of this network against the aforementioned major anthropogenic pressures, employing a novel methodology based on exploratory spatial data analysis (ESDA) methods. Specifically, the Shannon–Wiener index [12] was calculated at a scale of 1 km2 as an indicator of the cumulative effect of the five aforementioned LSPs, and subsequently subjected to a bivariate analysis with the nearest distance to the PAs’ network using the Moran’s index [13]. The analyses performed facilitated the automatic zoning of the 21 PAs and enabled their classification based on conservation effectiveness typologies. The main hypothesis tested in our research was whether conservation effectiveness against identified anthropogenic pressures increased progressively toward the interior of the PAs.
Finally, it is important to emphasize that evaluating PAs’ effectiveness remain a challenging task at the global level [14,15]. Assessments have been conducted on only 18% of the total area covered globally by PAs, significantly below the 60% target set by Parties to the CBD [16]. Despite the development of various assessment tools and approaches worldwide, this limitation is partly due to the challenge of devising appropriate methods for the cases under examination [17,18]. Hence, there is a continued necessity for further guidance on the use of assessment approaches, including clarification of their nature, application, improvement, and alignment with global targets related to PAs [19]. For this reason, we concluded our research by developing a methodological guide for evaluating the conservation effectiveness of PAs based on our case study. The objective was twofold: to enrich the range of approaches and tools developed globally, as well as to provide researchers and specialists in the field with a methodological guide for potential applications in other regions of the world.
2. Materials and Methods
2.1. Study Area
Our research focused on the network of protected areas (PAs) in the Tangier-Tetouan-Al Hoceima (TTA) region, located in Northwestern Morocco, between longitudes 6°14′36.27″–3°48′11.90″ W and latitudes 34°30′33.72″–35°55′20.68″ N. The Master Plan for Protected Areas validated in 1996 constitutes the foundational document and strategic tool for the conservation and sustainable development of Morocco’s vital national biodiversity, encompassing its biological, ecological, and cultural dimensions [20]. In the TTA region, this plan identified 21 PAs encompassing marine, coastal, continental, and wetland areas. Spanning a total land area of around 2270 km2, this network comprises 2 national parks (NPs), Al Hoceima and Talassemtane, a proposed natural park (Bouhachem), and 18 Sites of Ecological and Biological Interest (SBEIs). To enhance clarity in presenting the results, we opted to categorize these PAs into three groups: parks, continental SBEIs, and coastal SBEIs. Figure 1 depicts the spatial distribution of these 21 PAs based on their designated categories.
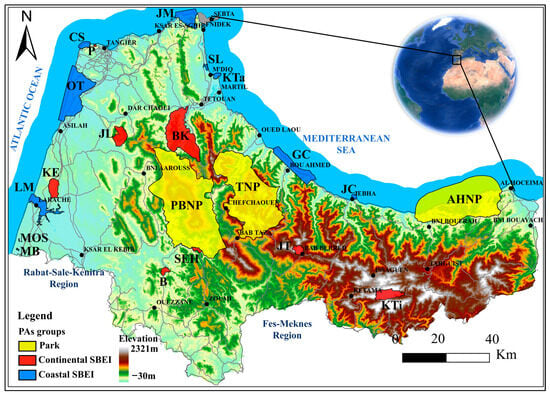
Figure 1.
Spatial distribution of PAs in the TTA region. PA names have been encoded as indicated in Table 1.
- Parks
This group comprises the El Hoceima and Talassemtane National Parks, along with the proposed Bouhachem Natural Park. Established in 2004, El Hoceima NP sits on the Mediterranean coast, around 150 km east of the Strait of Gibraltar. Encompassing a terrestrial area of 282 km2, it hosts diverse habitats of significant biological value and some of the best-preserved natural spaces in the Mediterranean. With 40 km of coastline, the park, situated on the Bokkoyas limestone massif, boasts stunning landscapes and ecosystems rich in characteristic vegetation and notable animal species [21]. Spanning 596 km2, Talassemtane NP covers the eastern end of the limestone ridge shaping most of the Rif mountain range. This area showcases some of the Kingdom’s most beautiful natural sights, where stone and tree, rock and forest, vast panoramas, and deep gorges blend to create an exceptional landscape. The park is home to Morocco’s sole fir forests, the last vestiges of a globally unique ecosystem now under severe threat. It hosts over 239 plant species, including numerous endemics like the Atlas cedar (Cedrus atlantica) and black pine (Pinus nigra). Providing refuge to over 37 mammal species, notably the Barbary macaque sheltering in its caves, and boasting over 117 bird species, including impressive ones like the bearded vulture and golden eagle [3].
The “Jbel Bouhachem” mountain holds significant natural, historical, cultural and religious heritage value. Its territory encompasses a dozen natural habitats of very high ecological worth, including cork oak forests, evergreen oak forests, tauzin oak forests, natural pine forests with Maghreb maritime pine and cedar groves, and wadis with Portuguese laurel. In addition to these natural wonders, numerous peat bogs are found within its expanse. The sanctuary of Moulay Abdeslam, located in the rural commune of Tazrout, is particularly renowned for attracting numerous pilgrimages every year. Designated as an SBEI in 1995, the “Jbel Bouhachem” is presently being developed as a natural park covering 818 km2 across the provinces of Tetouan, Larache, and Chefchaouen [7,22].
- Continental SBEIs
The TTA region has 8 continental SBEIs distributed across almost all of its provinces and prefectures, namely: Koudiat Tidighine, Jbel Tizirane, Souk El Had, Brikcha, Ben Karrich, Jbel Lahbib, Perdicaris, and Khmiss Essahel. Covering various natural environments, these sites harbor highly interesting biological and scenic diversity. For example, the Perdicaris site consists of a north-facing slope overlooking the Strait of Gibraltar. It is characterized by lush natural vegetation including evergreen oak, cork oak, and kermes oak, along with artificial stands of pinyon pine and Eucalyptus globulus, representing the oldest plantations in Morocco (1918). This site also holds significant faunal interest due to transcontinental bird migrations between Europe and Africa through the strait [23]. Additionally, the Brikcha SBEI is a well-preserved ecosystem with cork oak, holm oak, and evergreen oak, hosting a highly diversified and species-rich flora and fauna. It is one of the very few climax communities of Quercus coccifera in Morocco. Koudiat Tidighine represents the highest mountain in the Rif (2450 m), containing one of the finest Moroccan cedar forests, representing a well-preserved ecosystem rich in biodiversity. The Jbel Tizirane site is dominated by a cedar vegetation with Quercus pyrenaica present lower down, accompanied by a floral assemblage consisting of numerous Rifian and Andalusian endemics [3].
- Coastal SBEIs
This group consists of 10 SBEIs distributed along the Mediterranean and Atlantic coasts. From east to west, the Mediterranean coastline contains 5 SBEIs: Jebha Circus, Ghomara coast, Koudiet Taifour, Smir lagoon, and Jbel Moussa. From north to south, the Atlantic coastline also includes 5 SBEIs: Cape Spartel, Larache Marshes, Oued Tahadart, Merja Oulad Skhar, and Merja Bargha. Given the diversity of environments occupied by these sites covering coastal marine and terrestrial areas, lagoons, estuaries, and all adjacent systems, these sites exhibit a remarkable ecological diversity [7]. For instance, the Jbel Moussa SBEI hosts some of the most significant natural and scenic riches in Morocco, demonstrating a distinctive forest and floral dynamic. Its territory encompasses diverse habitats and biotopes, including oak forests, pine groves, scrublands, open marine areas, capes, bays, coastal and inland cliffs, islands, and beaches [3]. The site also holds significant ornithological value as it hosts the breeding of the griffon vulture, a rare bird species in Morocco [24]. Moreover, the Oued Tahadart SBEI comprises a vast complex of wetland areas, encompassing estuarine zones, coastal waters and associated beaches, alluvial plains, low hills and plateaus, dam reservoirs, temporary salt lakes, temporary freshwater marshes, and more. This ecosystem, fueled by tides and precipitation, holds significant hydrological value by replenishing the local aquifer. Designated as a Ramsar site, Oued Tahadart holds global significance as it hosts the last known population of great bustard in Morocco and Africa [25]. The Jebha circus is one of the most picturesque sites on the Moroccan Mediterranean coast. It represents a remarkable geomorphological structure, with an amphitheater form limited by high cliffs and connected to the sea northwards. This site is among rarest locations worldwide exhibiting an outcrop of the earth’s mantle [26].
Finally, it is important to emphasize that the National Study of PAs compared the SBEIs based on several criteria essentially related to ecological representativeness, biodiversity, forest, heritage, socio-economic values, area, disturbances, and threats. The aim is to prioritize these SBEIs in order to identify intervention priorities according to the urgency of the situation (priority 1, priority 2, and priority 3) [27]. Table 1 summarizes the basic information pertaining to the PAs of the study area.

Table 1.
Basic information on the PAs of the TTA region identified by the Master Plan for Protected Areas in 1995.
2.2. Methods and Data Sources
In this study, we focused on three primary aspects related to the network of PAs in the TTA region: analyzing deforestation drivers, examining landscape pressures (LSPs), and assessing conservation effectiveness. While the methodologies for the first and second aspects were sufficiently detailed in our previous study on deforestation drivers in the region [9], we briefly recapitulate these approaches in this section. However, the methodological approach for evaluating conservation effectiveness is explained in greater detail.
In all study aspects, we utilized data from various global and local sources (Table 2), including the Global Land Cover and Land Use Change (GLCLUC) platform. This platform offers a comprehensive dataset on changes in forest extent, cropland, built-up lands, and other land cover types from 2000 to 2020 [28]. The dataset, validated for high accuracy, is a valuable resource for studying the Earth’s changing landscape and understanding the consequences of land cover and land use changes on ecosystem goods and services, climate, land management, water cycle, and biodiversity [29,30,31,32,33]. Local data, such as PAs’ boundaries and the national forest inventory (NFI) databases [27,34], were also integrated. All datasets were projected to a uniform local coordinate system for analysis.
Table 2.
Sources and details of used data.
2.2.1. Analysis of Deforestation Drivers
Through an extensive literature review and adopting the classification proposed by Geist and Lambin [10], five key factors driving deforestation in the TTA region were identified: infrastructure extension, agricultural expansion, logging, and wildfires as direct causes, and demographic factor as an indirect cause. For assessing deforestation, the Global Forest Cover Change (GFC) dataset (version 1.10) was used to extract forest loss layers from 2001 to 2020 [35], with deforestation rates calculated based on tree cover in 2000 [41]. Infrastructure extension was generated using the Built-up Lands Extent and Change (2000–2020) [28] and the water gain layer from the Global Surface Water Dynamics (1999–2020) datasets [36], while agricultural expansion was obtained from the Cropland Extent and Change (2000–2019) data [37]. Logging activities were identified using reforestation layers from the NFI, analyzed through Google Earth Pro high-resolution historical imagery. Wildfire data were sourced from the MODIS Fire_CCI51 Burned Area Product [38]. The demographic factor was examined using data from both the “Gridded Population of the World”, Version 4 (GPWv4): Population Density, 284 Revision 11 [39], and the “Forest Proximate People” (FPP) 1.0 dataset, estimating the population living in or within 1 km of forests for the year 2019 [40].
The analyses were performed at a dual scale: at the pixel level and on the 1 km2 grid. At the pixel level, the study evaluated the contributions of the four direct deforestation factors within PAs, using the GFC dataset and systematic checks through high-resolution historical images from Google Earth Pro software (version 7.3.6.9796). The 1 km2 grid was used to apply exploratory spatial data analysis (ESDA) techniques, including the bivariate Moran’s index, to explore spatial relationships between deforestation and the five selected factors within PAs.
2.2.2. Analysis of Landscape Pressures
In this section, we identified five primary LSPs: deforestation, infrastructure extension, agricultural expansion, wildfires, and demographic pressure. By adopting the 1 km2 grid, we applied the local Moran’s index [42] to pinpoint clusters of these pressures corresponding to spatial units categorized as high–high (HH), indicating entities where the studied variable presented a high value in a neighborhood that resembled it (positive spatial autocorrelation and high index value) [43]. Subsequently, the outcomes of the univariate analyses were superimposed to generate a composite map illustrating the spatial patterns. A total of thirty LSP configurations were discerned, categorized into two groups: simple clusters comprising cells (HH) representing a single LSP, and mixed clusters consisting of combinations of two, three, four, or five LSP clusters [9]. These results were then overlaid with the boundaries of PAs to delineate the existing spatial patterns.
2.2.3. Assessing PAs’ Conservation Effectiveness
The conservation effectiveness of PAs reflects their ability (individually and collectively) to preserve genetic, specific, and ecosystem diversity over the long term. The effectiveness of a PAs’ network is in turn determined by the effectiveness of its individual components and by how they relate to each other (in total extent, location, connectivity, and representativeness). Individual PA’s effectiveness arises from a set of intertwined factors including both decisions taken at the time of establishment (design, location, and connectivity to other sites), as well as subsequent management decisions [44].
In recent years, methods for assessing the effectiveness of PAs have experienced a surge, reflecting growing attention to evidence-based conservation practices. As outlined by [45], these methods can be classified according to the types of data used: qualitative, opinion-based, quantitative, and mixed approaches. Qualitative methods include subjective assessments and descriptive analysis, often based on expert opinions, case studies, and narrative accounts. Opinion-based methods involve expert surveys and stakeholder consultations to gather professional insights and community perspectives. Quantitative techniques involve the use of numerical data and statistical analysis. Examples include ecological monitoring, remote sensing, population surveys, and ecosystem services, as well as the use of quantitative indicators to assess conservation outcomes. Mixed methods can provide a more comprehensive understanding of PAs’ effectiveness by combining the strengths of both qualitative and quantitative approaches.
The method proposed in our study can be classified as a quantitative evaluation method, since it was essentially based on data from global spatial remote sensing platforms and their processing through ESDA techniques. Operationally, the process of evaluating the effectiveness of PAs in the region involved several steps which included identifying the principal pressures affecting these areas and computing the cumulative effect index, conducting bivariate analyses between this index and the nearest distance to the network of PAs, delineating PAs’ zoning and calculating conservation ratios, classifying PAs, and defining conservation typologies.
- Cumulative Effect Index
The term “cumulative effect”, frequently employed, fundamentally refers to the sum of synergistic, antagonistic, and additive effects of multiple anthropogenic or natural pressures on the focal environmental aspect [46]. Assessing the cumulative effects of human pressures on ecosystems can be approached in diverse ways, shaped by the particular research or assessment objectives, the scales of the analysis, and the availability of data [47]. In our study, we calculated the cumulative effect index (CEI) of five major LSPs (deforestation, infrastructure extension, agricultural expansion, wildfires, and population growth) at a 1 km2 scale, by using the Shannon–Wiener index [12] designated as H’. Used in biological studies as a measure of diversity and as a measure of entropy, H’ is formulated as follows:
where s is the total number of LSPs (=5), i is one through s LSPs, and is the value of the LSP (i) at the 1 km2 scale. Considering that the variables for deforestation, infrastructure extension, agricultural expansion, and wildfires correspond to surface areas, while population growth reflects changes in population density, all measurements were standardized to address any discrepancies in units. Furthermore, as the Shannon–Wiener index is most suitable for uncorrelated or weakly correlated variables, the correlation between these five factors was assessed using the bivariate Moran’s index.
- Bivariate Analysis
In addition to investigating the spatial correlation among the five pressures, a bivariate analysis was primarily used to evaluate how the distance between spatial units and the nearest PA in the network influenced the observed value of the CEI. It is worth noting that in all analyses, each spatial unit was represented by its centroid, and the NNJoin tool in QGIS was used to determine the nearest distance to PA. This tool facilitated the joining of two vector layers based on nearest-neighbor relationships, resulting in a new vector layer with the same geometry type and coordinate reference system as the input layer, while incorporating two fields containing the name of the nearest PA in the network and the corresponding computed value of the nearest distance [48]. The bivariate analysis was conducted by using the bivariate local Moran statistic (Ixy) proposed by Anselin to reveal the spatial relation typologies between two variables (X and Y) in considered spatial units. This index measures the spatial correlation between the two studied variables by applying the following formula [49]:
where number of spatial units (=16,666); locations of spatial units; are the values of the variables (CEI) and (nearest distance to PAs’ network) in the units , respectively; are the averages of the variables , respectively; are the elements of the binary matrix of spatial interactions reflecting the proximity relations between units i and j, defined according to the adopted neighborhood rules (“Queen” type contiguity scheme of order 1); is the sum of the elements of the symmetric matrix of spatial weights; and correspond to the variances of X and Y. respectively.
The bivariate Moran test was performed by using GeoDa 1.8 software and examined the relationship between the first variable X value (CEI) at observation i and the spatially lagged second variable Y value (nearest distance to PA) at observation j, and identifies five categories [43]:
- -
- Spatial units with high CEI values surrounded by spatial units with high nearest distance to PAs’ network values; we refer to these units as HH associations;
- -
- Spatial units with high CEI values surrounded by spatial units with low nearest distance to PAs’ network values, i.e., HL associations;
- -
- Spatial units with low CEI values surrounded by spatial units with low nearest distance to PA’s network values, i.e., LL associations;
- -
- Spatial units with low CEI values surrounded by spatial units with high nearest distance to PAs network values, i.e., LH associations;
- -
- Units with non-significant (NS) values (units whose values and the values of their neighbors are close to the average of the total sample).
- PAs’ Zoning and Conservation Ratios
The Moran’s bivariate correlation between the observed value of the CEI and the nearest distance to PAs’ network allowed us to identify the zoning for each PA, comprising four zones gradually differentiating as we moved from the center of the PA outward, and differing based on individualized bivariate spatial association categories. These zones were named as follows: the inner zone (IZ), the potential spillover effect zone (PSEZ), the statistically non-significant zone (SNSZ), and the non-potential effect zone (NPEZ). We focused on the first two zones for the conservation effectiveness analysis, since direct or spillover effects are the most documented effects in research on the effectiveness of PAs worldwide [50,51,52]. Therefore, the conservation effectiveness in both zones was evaluated through the computation of a conservation ratio determined by the count of significant spatial associations of types LL and HL. This ratio, reflecting the level of disturbance and consequently the efficacy of each PA within the overall network against the five major pressures identified, was computed as follows:
where CR represents the conservation ratio expressed as a percentage, while N(LL) and N(LH) are the numbers of the identified LL and LH units, respectively.
Furthermore, it is important to note that since park categories have protected natural areas (PNAs) within the inner zones subjected to stricter conservation regulations, additional prospection was conducted by calculating conservation ratios for the protected natural area zones (PNAZs) to assess their actual level of preservation.
- Classifying PAs and defining conservation typologies
In light of the findings from the previous step, each PA was characterized by its two conservation ratios computed in the IZ and SPEZ. To establish conservation typologies, four categories representing disturbance levels (very high, high, medium, and low) were assigned to four equal intervals of conservation ratio values (0 to 25, 25 to 50, 50 to 75, 75 to 100%). The conservation typologies of the 21 PAs of the region are summarized in a graph and a table.
In the final step of our analysis, we investigated the correlation between the conservation ratios observed in the SPEZs and their corresponding IZs. Our objective was to assess whether SPEZs exerted a protective effect on the associated IZs. In other words, we tested the hypothesis that higher levels of disturbance SPEZs would correspond to lower levels of disturbance within IZs. For this purpose, we assessed the correlation using the Pearson test, following the verification of data normality for both variables. Last, based on our case study, a practical methodological guide for PAs’ conservation effectiveness assessment is proposed for potential applications in other regions. Figure 2 summarizes the complete workflow of our study.
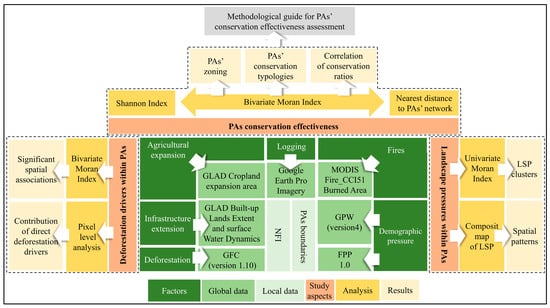
Figure 2.
Workflow of the study.
3. Results
3.1. Analysis of Deforestation Drivers
The pixel-based analyses conducted revealed that within the total gross deforested area estimated at 368.65 km2 in the region, 27.3% of deforestation occurred within PAs, equivalent to 100.5 km2. Figure 3a presents an overview of the annual changes in deforested areas within the region, focusing specifically on comparisons between protected and unprotected areas from 2001 to 2020. Our findings revealed a general increasing trend in deforested areas over the period, accompanied by notable fluctuations. Notably, the patterns of total deforestation and deforestation within both protected and unprotected areas exhibited similar trajectories over time. This was further evidenced by the nearly parallel linear trend lines representing the progression of deforested areas in protected and unprotected zones.
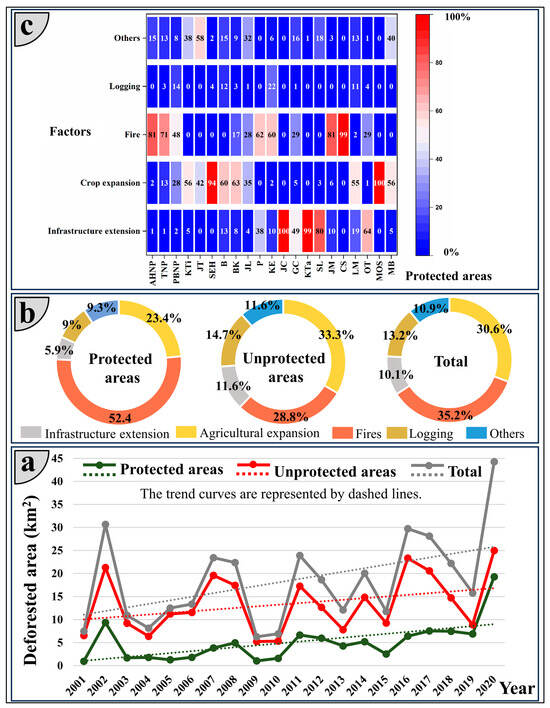
Figure 3.
(a) Yearly changes in deforested areas in km2 between 2001 and 2020 in protected and unprotected areas; (b) Direct deforestation drivers: comparative analysis of percentage contribution in protected versus unprotected areas; and (c) percentage contribution of direct deforestation drivers in the 21 PAs of the TTA region.
In terms of direct causes of deforestation, the study identified fires and agricultural expansion as the primary factors driving deforestation in both protected and unprotected areas. Agricultural expansion was slightly more dominant in unprotected areas, accounting for 33.3%, while fires were the leading cause in PAs, responsible for over half of deforestation at 52.4%. Furthermore, logging and infrastructure extension were less significant in PAs compared to unprotected areas (Figure 3b). Additional insights into these findings are provided in Figure 3c, which showcases a heatmap illustrating the proportion of losses observed in 21 PAs of the region associated with deforestation factors. Our analysis concluded that fires constituted the primary cause of forest loss in six PAs (AHNP, TNP, P, KE, JM, and CS) at percentages exceeding 60%. Furthermore, the expansion of agricultural lands and infrastructure emerged as the major causes of deforestation in four PAs each (SEH, B, BK, and MOS for agricultural expansion, and JC, KT, SL, and OT for infrastructure extension). In the remaining PAs (PBNP, KT, JT, JLGC, LM, and MB), we observed the predominance of at least two factors contributing to deforestation. Once again, we highlight the minimal contribution of logging to deforestation in all PAs.
The findings from the bivariate analysis of deforestation conducted at the 1 km2 scale, which considered both direct and indirect causes, are reported in Table 3. Overall, PAs concentrated approximately 20% of the significant spatial associations reported in the region. Additionally, the data validated the significant role of fires in deforestation within PAs, representing 29% of such associations across the region and spanning an area of 228 km2. The linkage between fires and deforestation was predominantly evident at the park category level (TNP and PBNP). Furthermore, agricultural expansion exhibited significant associations covering 219 km2, contributing to approximately 24% of the total. This association between deforestation and agricultural expansion was particularly pronounced at PBNP and the continental SBEI of BK. In contrast to pixel-based analyses, the bivariate analysis at the 1 km2 scale uncovered a notable spatial correlation between deforestation and logging, accounting for 20% and encompassing an area of 101 km2, with more than half of this area located within PBNP. This relatively significant correlation was entirely expected, given the evident spatial linkage between the two variables. While other factors such as fires, infrastructure expansion, and agricultural expansion may occur outside of forests, logging can only take place within forests and consistently leads to deforestation. Lastly, significant associations between deforestation and the three variables—infrastructure expansion, FPP, and population density variation—recorded relatively lower percentages, not exceeding 10%. Lastly, it should be mentioned that in five PAs (KTi, SHE, B, GC and MOS), no statistically significant spatial association was identified between deforestation and the six variables.
Table 3.
Statistics by PAs of significant spatial associations of type HH between deforestation and six variables reported in km2.
3.2. Analysis of Landscape Pressures
The spatial distribution of statistically significant clusters of the major LSP is depicted in Figure 4a, revealing variability in their spatial patterns both within the region and across PAs. Indeed, the results of the univariate analysis at a 1 km2 scale indicated that approximately 15% of clusters were located within protected zones, covering a total area of around 723 km2. Additionally, Figure 4b outlines the spatial patterns observed in different categories of PAs within the study area, along with their respective sizes. An initial examination of the results indicated that spatial patterns differed regardless of the type of PA, and the size of LSP clusters tended to increase with the size of the PAs. Notably, larger pressure clusters (≥30 km2) were predominantly found within park categories. The continental SBEI of BK stood out as a unique case, with cluster areas similar to those in parks. Conversely, the continental SBEI of KE and the coastal SBEIs of OT and LM had medium-sized areas reaching up to 20 km2, while other PAs generally had smaller extents, typically below 10 km2.
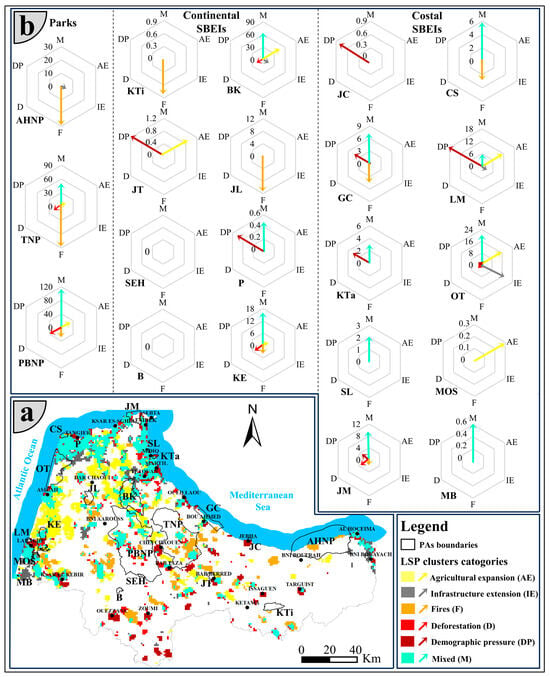
Figure 4.
Results of the five-LSP analysis in PAs within the TTA region: (a) spatial distribution of the six categories of LSP clusters; and (b) LSP patterns and their areas in km2 across 21 PAs by categories.
The observed variability in spatial patterns of LSPs reflected the diverse dynamics experienced by the network of PAs in the region. Overall, four main spatial patterns were discernible. The first pattern included two continental SBEIs of SEH and B, where no LSP clusters were identified. The second pattern revealed a single predominant pressure in certain PAs: fires in AHNP, KTi, and JL; demographic pressure in the coastal SBEI of JC; agricultural expansion in the coastal SBEI of MOS; and mixed pressures in the coastal SBEIs of SL and MB. The third pattern involved two pressures, evident in the two continental SBEIs of JT and P and the two coastal SBEIs of KTa and CS. Lastly, the fourth pattern encompassed the remaining PAs, exhibiting multiple types of LSP (TNP, PBNP, BK, KE, GC, LM, OT, and JM).
3.3. PAs’ Conservation Effectiveness Assessment
3.3.1. Cumulative Effect Index
To avoid significant redundancies in the calculation of the cumulative effect among the five LSPs, a preliminary step involved testing the correlation between these pressures using the bivariate Moran’s index. The results are summarized in a triangular heatmap in Figure 5a, showing minimal correlations between the pressures, none exceeding 0.3 in all cases. The highest correlation was found between population growth and infrastructure expansion, with a value of 0.28. Deforestation showed weaker correlations with fires, agricultural expansion, and infrastructure extension, measured at 0.21, 0.18, and 0.08, respectively. Other correlations were very weak, with some even displaying negative values (e.g., fires with infrastructure extension, population growth with agricultural expansion, or fires).
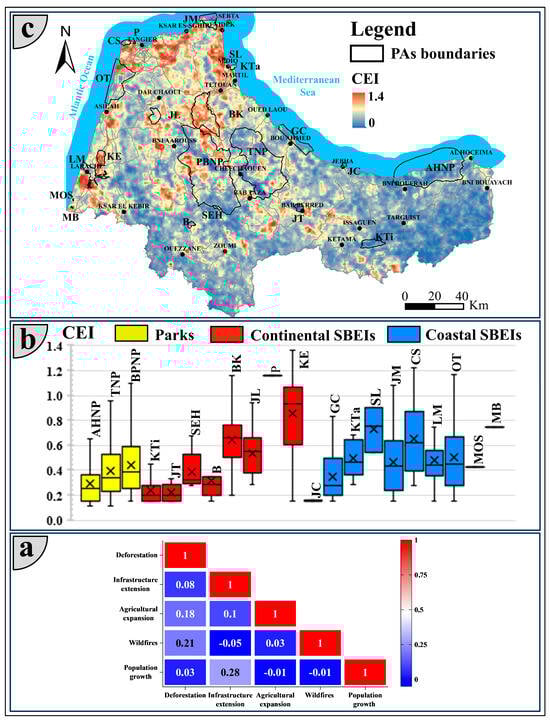
Figure 5.
(a) Triangular heatmap of bivariate correlation Moran’s I between five major LSPs in the TTA region; (b) box plot by PA for cumulative effect index (CEI); and (c) map of the spatial distribution of the CEI calculated by IDW interpolation.
Approximately 14% of the 16,666 observations of the CEI in the TTA region were recorded in PAs, totaling 2357 observations. The majority of these observations were in parks, which had the largest areas, accounting for about 73%. Table 4 presents a summary of the descriptive statistics of these observations, while Figure 5b shows the corresponding box plot diagram. The mean values of the CEI ranged from 0.16 to 1.16, with the coastal SBEI (JC) reporting the minimum value and the continental SBEI (P) reporting the maximum value. The median values of the two continental SBEIs (P and KE) were higher than those of the other boxes, indicating superior index values in these two PAs. The variability in the index was not influenced by the category or size of the PAs. The dispersion of values in the park category was less significant compared to smaller SBEIs like the continental SBEI (KE) and coastal SBEIs of CS, JM, OT, and SL. Most PAs had asymmetric data distributions.
Table 4.
Descriptive statistics of the cumulative effect index (CEI) for the 21 PAs in the TTA Region.
Figure 5c displays the spatial distribution of the CEI calculated through an IDW interpolation. The map indicates that the highest values of the index were concentrated in specific coastal and mountainous areas. Notably, coastal axes connecting, respectively, urban centers like Tetouan, Mdiq-Fnideq, Tangier, Assilah, and Larache showed significant values due to recent demographic and urban changes, while in the mountain landscapes of the provinces of Larache, Tetouan, Chefchaouen, and Al Hoceima, the index reached significant values due to the combined impact of fires, agricultural expansion, and deforestation. Furthermore, the map indicates that the network of PAs in the region was similarly affected by these dynamics, depending on whether they were part of the urban or mountain system.
3.3.2. Bivariate Analysis and PAs’ Zoning
The distribution of the five types of spatial association resulting from the bivariate Moran test between the CEI and the nearest distance to the PAS network is depicted in Figure 6a. Non-significant cells (NS) were the most dominant, totaling 6897, accounting for 41%, followed by HL and LH cells, which accounted for very close shares of 18% and 17%, respectively, with 3043 and 2797 units in each category. The associations LL and HH had lower numbers, with 2404 and 1529 units, respectively, making up 14% and 9% of the total. In terms of statistical significance, Figure 6b highlights the predominance of the very highly significant category (p = 0.001), which included approximately 31% of cells, totaling 5231 units primarily located within PAs. Furthermore, as shown in the scatterplot in Figure 6c, the correlation between the two variables under study was moderately negative. This suggests that generally, as the distance from the PAs’ network increases, the CEI tends to decrease, and conversely.
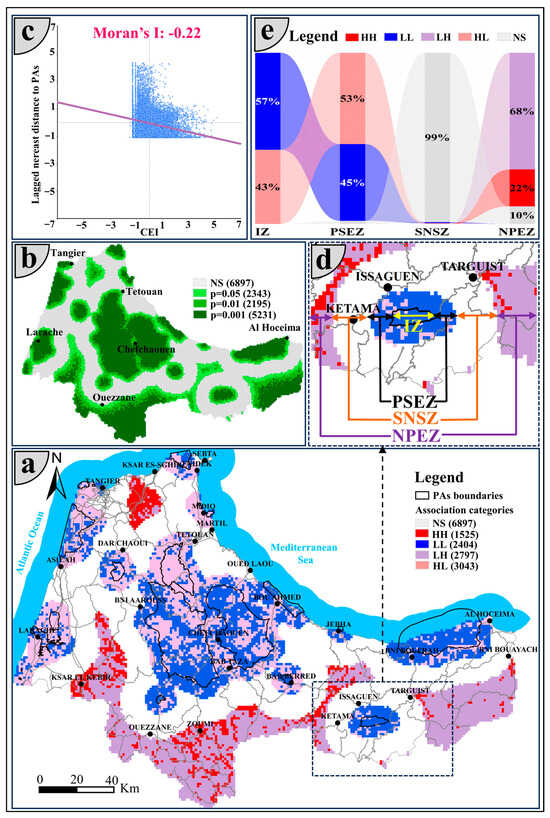
Figure 6.
Results of the bivariate Moran’s I analysis between the CEI and nearest distance to PAs: (a) Spatial distribution map of five spatial association categories (NS, HH, LL, LH, and HL); (b) Statistical significance map; (c) Moran scatterplot; (d) Visualization of four zone categories within a PA: inner zone (IZ), potential spillover effect zone (PSEZ), statistically non-significant zone (SNSZ), and non-potential effect zone (NPEZ); and (e) Percentage evolution of the five categories of spatial associations in the PAs’ network according to zoning.
Figure 6d,e display a zoom-in on the zoning of a specific PA and the percentage evolution in the five categories of spatial associations across the entire network of PAs based on this zoning. In inner zones (IZs), where the nearest distance to PAs was zero, there were 2357 observations of the CEI. In these zones, only spatial associations of types LL and HL were found, making up 57% and 43% of the total, respectively. These zones also included protected natural area zones (PNAZs) with 123 observations. In the potential spillover effect zones (PSEZs) within a radius of 0 to 5 km and comprising 3658 observations, the dominance of the previous categories continued, with a decrease in LL units and an increase in HL units, accounting for 45% and 53% (1668 and 1990 units), respectively. Regarding the statistical non-significance zones (SNSZs), it extended from 5 to 15 km and contained the largest number of evaluated units, 6405. As its name suggests, this zone consisted of 99% statistically non-significant cells. Finally, the non-potential effect zones (NPEZs) located beyond 15 km contained a total of 4104 observations. In these zones, we observed a predominance of 68% of LH units, followed by HH and NS units at lower percentages of 22% and 10%, respectively.
3.3.3. Conservation Effectiveness Typologies
The analysis of the evolution of the number of various types of spatial associations, specifically the LL and HL categories, helped in developing an initial understanding of the conservation status of each PA. Figure 7a illustrates this progression based on zoning across the 21 PAs in the region, categorized according to their types. The disparity between the LL and HL units in the IZ and PSEZ offers insights into the conservation level of each PA, with a larger positive gap indicating a tendency towards conservation and a larger negative gap suggesting a tendency to degrade. Consequently, three primary groups of PAs were identified using this criterion. The first group comprised seven PAs, including parks (AHNP and PBNP), continental SBEIs (SEH, KTi, B), and coastal SBEIs (JC and GC), where the positive gap between the number of LL and HL units in both IZ and PSEZ suggested a conservation trend in these zones. In contrast, the second group consisting of 12 PAs, namely, the continental SBEIs (BK, P, JL, and KE) and the coastal SBEIs (KTa, MOS, MB, JM, LM, Sl, OT, and CS), was characterized by negative gaps indicating a trend of degradation in these zones. The third group, consisting of two PAs (TNP and continental SBEI of JT), showed a different scenario with a positive gap in the IZ and a negative gap in the PSEZ. This suggested a conservation trend in the former zone and a degradation trend in the latter. Furthermore, it was noted that the PNAZ of the parks exhibited better preservation, as there were notable positive differences in the numbers of LL and HL units found in these regions. Moving away from the IZ and PSEZ, the number of LL and HL units tended to decrease in the SNSZ, as the variable related to the nearest distance to PAs showed average values. The NPEZ was distinguished by the presence of categories HH and LH, which were significant especially in the two parks (AHNP and PBNP) and the two continental SBEIs (B and KTi).
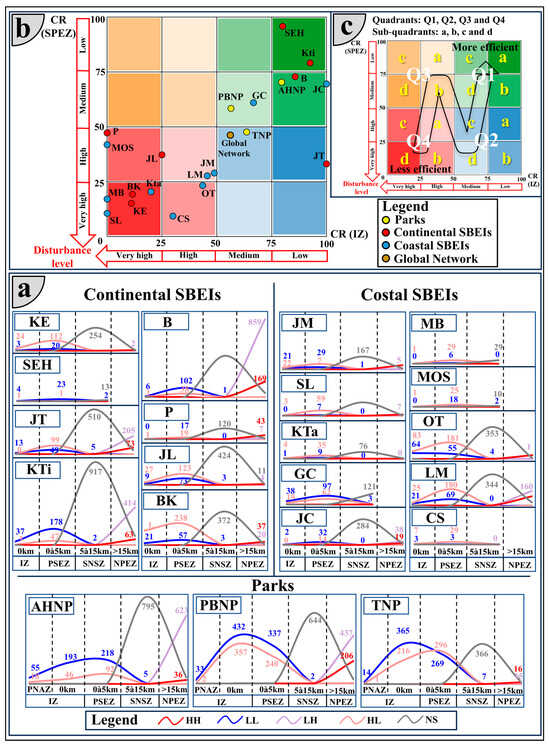
Figure 7.
(a) Variation in the number of five significant spatial associations categories (NS, HH, LL, LH, and HL) according to the zoning of the 21 PAs; (b) Diagram of conservation effectiveness typologies; and (c) Visualization of the escalating conservation effectiveness of PAs across quadrants and sub-quadrants.
For a better classification of the conservation levels, we computed two conservation ratios (CRs) for the IZ and PSEZ across 21 PAs in the region and the global network. Figure 7b and Table 5 outline the typologies of conservation effectiveness identified, while Figure 7c depicts a visual representation of its escalating gradient. In the diagram showing 16 potential typologies, 9 typologies were identified across quadrants Q1, Q2, and Q4, with no typologies found in quadrant Q3 in the region. The conservation effectiveness of these typologies increased according to the letter “N” (in the order of Q4, Q3, Q2, and Q1 for quadrant, and from d, c, b to a within sub-quadrants). Quadrant Q1 contained the most preserved PAs, including the continental SBEIs of SEH and KTi belonging to the typology Q1.a with low disturbance levels for the IZ and SPEZ. Following them were PAs AHNP, B, and JC in typology Q1.b with low and moderate disturbance levels for the IZ and SPEZ. In third place were the PAs GC and PBNP belonging to typology Q1.d with moderate disturbance levels for the two zones. In quadrant Q2, there were two typologies, Q2.a and Q2.c, which related to the continental SBEI of JT and TNP. Q2.a represented low and high levels of disturbance in the IZ and SPEZ, while Q2.c represented moderate and high levels of disturbance in both zones. The largest number of PAs, totaling 12, were located in quadrant Q4. The two coastal SBEIs LM and JM were classified under typology Q4.a with high levels of disturbance. Following them were two other coastal SBEIs, CS and OT, which were categorized under typology Q4.b, indicating high and very high disturbance levels for the IZ and SPEZ. Additionally, three PAs (P, JL, and MOS) fell under typology Q4.c, representing very high and high disturbance levels for the two zones. The five PAs KE, BK, SL, MB, KTa were the most degraded with very high disturbance levels, falling under typology Q4.d. Lastly, the global network’s representation on the typologies’ diagram revealed a Q2.c type typology with moderate and high disturbance levels for the IZ and SPEZ. Additionally, our examination of the same diagram indicated that parks were typically better preserved than SBEIs and also revealed a significant positive correlation between the conservation ratios measured in IZs and SPEZs, once again highlighting the dominance of the Q1 and Q4 quadrant typologies in the region. Indeed, after confirming the normal distribution of the data using a Shapiro–Wilk test adapted for small sample sizes, the Pearson test evaluated the positive correlation at 71% with a significance level of 0.01.
Table 5.
Summary of conservation effectiveness typologies in the TTA Region.
4. Discussion
4.1. Analysis of Deforestation Drivers
The study of the evolution of deforested areas between 2001 and 2020 revealed similar patterns of the phenomenon in both protected and unprotected zones, resulting in perfectly parallel trend lines. This observation may indicate, firstly, that the factors influencing deforestation in the region exert a uniform impact on both types of zones, and secondly, that the general trends of the phenomenon transcend differences in protection status. Investigations into the direct drivers of deforestation reinforced this finding, attributing the largest share (over 60%) to fires and agricultural expansion as key factors in driving deforestation in both protected and unprotected areas. In our previous study on the drivers of deforestation in the TTA region, we highlighted the role played by the duality of fires and agricultural expansion as the determining factors responsible for slightly over 65% of forest losses [9]. Indeed, the TTA region stood out as the leader in the country for both the number and size of forest fires, holding the largest portion of such incidents nationwide. This trend was attributable to the biophysical and anthropogenic specificities of the area, including the presence of highly flammable forest species on rugged terrain and intense human land transformation resulting from the use of fire as a practice to clear land for cultivation [53]. Wildfires not only impact plant life but also have serious adverse effects on wildlife. They can cause immediate deaths among animal populations and result in long-lasting indirect effects, such as heightened stress levels and the destruction of habitats, territories, shelters, and food supplies. The reduction in vital species in forest ecosystems, including invertebrates, pollinators, and decomposers, can greatly hinder the recovery of forests. Nonetheless, despite the ongoing impact of both fires and agricultural expansion on deforestation in PAs, it is crucial to note that fires were found to have a more substantial influence in protected zones, accounting for more than half of the forest losses, whereas the impact of agricultural expansion was reduced. This finding underscores the significance of a protected status in mitigating agricultural expansion, especially when compared to the impact of fires. The greater controllability of agricultural land extension, as opposed to the unpredictable nature of wildfire outbreaks and evolution, emerges as a key element in this context. For instance, a recent study by Castro et al. (2022) revealed that approximately half of the forest losses recorded in Talassemtane National Park (TNP) between 2003 and 2018 were caused by fires. The research was based on a comparison between GFC data and MODIS wildfire data from Andela’s Global Fire Atlas (GFA), a new global tool used to identify fire locations and progression [54]. Regarding the contribution of the remaining factors, we noted that their impact was diminished within PAs, not exceeding 25%. Specifically, the influence of logging and infrastructure extension was less pronounced in these zones, reflecting the administration’s conservationist approach and its commitment to preserving the ecological integrity of PAs. This was achieved by limiting logging activities and restricting the approval for infrastructure projects in protected zones.
At a global scale, several studies have focused on evaluating the effectiveness of PAs against deforestation by adopting various approaches and data sources. Thus, Shah et al. (2021) estimated the effectiveness of PAs established between 2000 and 2012 in 81 countries in avoiding forest loss [55], using high-resolution data on forest cover in 2000 and annual forest cover loss between 2000 and 2012 from Hansen et al. (2013) [35]. The study considered underlying deforestation threats by employing a combination of matching methods and cross-sectional regressions. It then assessed which demographic, agricultural, economic, and governance factors were most strongly associated with national PA effectiveness using machine learning methods. It was concluded that national PAs established between 2000 and 2012 reduced deforestation in those areas by 72%, preventing the loss of 86,062 km2 of forest. The effectiveness of national PAs varied depending on the level of protection as classified by the International Union for Conservation of Nature (IUCN) categories. Strictly defined PAs reduced forest loss by 81% compared to what would have occurred without protection, while less strictly defined PAs reduced forest loss by 67%. The results of estimating PA effectiveness (corresponding to the reduction in forest loss as a percentage of new PAs with forested area in 2000) for the 81 selected countries, grouped by income and region, varied between a minimum value of −6.41% and a maximum value of 13.2% [55]. In the case of Morocco, the effectiveness was estimated at −1.39%, indicating a low level of effectiveness against deforestation, which aligns with our results. The research also highlighted that countries with lower agricultural activity were most strongly associated with greater country-level PA effectiveness, a conclusion that effectively supports the findings of our study, which focused on an area characterized by rugged terrain and a persistent need for agricultural land. Consequently, forest loss in this region is closely linked to the expansion of agricultural lands, frequently accompanied by the use of fires by local communities. These practices often ignore the protected status of the lands and compromise the effectiveness of the regional network of PAs in curbing deforestation.
Moreover, numerous other studies have been conducted to evaluate the impact of (PAs) on global deforestation, employing remote sensing, crowdsourced data, and global datasets [56,57,58,59,60,61]. These studies have examined the trends of forest loss within PAs over various time periods, considering different levels of protection. Key findings have uncovered disparities in effectiveness across continents and in relation to strict protection measures. Although certain regions have successfully preserved forests within PAs, others have encountered impediments. Some outcomes have shown an inverse relationship between deforestation rates and levels of protection, especially noticeable in Latin America and Africa. Variations in protection efficacy among regions and categories underscore the necessity for customized strategies and focused evaluations of PA threats. This underlines the need for localized analyses to enhance understanding of deforestation drivers. Such analyses should employ context-specific methodologies for more thorough assessments, offering valuable insights to policymakers and environmental advocates dedicated to safeguarding forest ecosystems [62]. This further validates the significance of our research, which extends the findings of our earlier investigations on deforestation in Northern Morocco [9,41]. Analogous to many regions worldwide, it highlights a scenario where establishing PAs alone is insufficient to address the complex problem of deforestation.
Notably, the effectiveness of PAs in curbing deforestation presents a multifaceted challenge contingent upon various determinants. Firstly, the level of protection conferred upon PAs emerges as a pivotal factor. More stringent protection statuses typically demonstrate greater efficacy in mitigating deforestation rates compared to less restrictive management categories. Secondly, proficient management practices, including comprehensive planning, tracking and resolving land tenure, vigilant monitoring, sufficient financial resourcing, and active engagement of non-governmental organizations (NGOs) and local communities, can enhance the protective impact of PAs. Thirdly, the scale and delineation clarity of PAs constitute additional influential factors, with larger PAs and those characterized by distinct boundaries often exhibiting heightened effectiveness. Furthermore, the responsiveness to illicit activities within PAs, including the probability of detection and severity of penalties, significantly influences their capacity to prevent deforestation. Lastly, the transcending of protection status by general deforestation trends suggests the need for holistic and integrated approaches to sustainable land-use planning, community involvement, and regulatory enforcement to effectively counteract the underlying drivers of deforestation [62,63,64,65].We note that all these conditions represent potential solutions that intervention efforts and strategies should target to enhance the effectiveness of the network of PAs in Northern Morocco in reducing deforestation.
4.2. Analysis of Landscape Pressures
The examination of LSPs on a regional level, especially within PAs, revealed various spatial patterns that reflect the range of dynamics in the area. These patterns fell into four categories: two PAs with no LSP (continental SBEIs of SEH and B), seven PAs dominated by a single LSP (AHNP, KTi, JL, JC, MOS, SL and MB), four PAs with two main LSPs (JT, P, KTa and CS), and eight PAs facing multiple types of LSPs (TNP, PBNP, BK, KE, GC, LM, OT, and JM). Several strategic or research studies conducted at the national, regional, or even local scales corroborate the findings of our work. Indeed, the continental SBEIs of SEH and B were highlighted as exceptional ecological environments that have been largely unaffected by significant human activities. These locations are known for their well-preserved oak ecosystems (cork oak, holm oak, zène oak, and kermes oak). They also boast diverse plant and animal populations and a high level of species diversity. The continental SBEIs of SEH and B are renowned as the only Moroccan climax sites for kermes oak [3,23,27]. In a study conducted by Ghoaut et al. (2021), the main obstacles to effective environmental governance of Al Hoceima National Park (AHNP) were examined. The assessment of the park’s land area identified issues with waste management, floods, wildfires, and landslides as significant environmental challenges that required targeted intervention efforts to enhance the park’s effectiveness [66]. The continental SBEI of Koudiat Tidighine (KTi) includes the tallest mountain in the Rif region, standing at 2450 m. It also contains a high-quality Moroccan cedar forest with a varied mix of plant species such as zène oak and green oak. This area represents a relatively intact ecosystem, with very localized disturbances such as firewood harvesting and deforestation for cannabis cultivation. In contrast, the continental SBEI of Jbel Lahbib (JL) faces significant human-induced pressures, with the woodland area extensively impacted by fires, deforestation, and carbonization [23,27].
Additionally, the research findings suggest that environmental concerns in the Jebha circus (JC) are primarily influenced by demographic pressures. A study by Mateo-Ramírez et al. in 2021, focusing on the ecosystems and marine resources of the Alboran Sea, supports this idea by highlighting that the main risks to the area include the expansion of housing developments and urban pollution from the port and town of Jebha, which significantly contaminates nearby ecosystems. Other threats include the absence of proper waste management facilities, littering with items like bottles, tires, and ghost nets, as well as overfishing and illegal fishing [26]. In a recent study by Falah et al. (2021), the impact of agricultural practices on wetlands in the Loukkos region was investigated using mapping techniques to analyze changes in irrigated areas. The results showed that 34% of wetlands, including two Ramsar Sites, were negatively affected. The main causes of this decline were the conversion of natural habitats into agricultural land, excessive water consumption for irrigation, and urban development. The research specifically noted that 82% of wetlands in Marja Ouled Sakhar (MOS) were influenced by irrigated areas [67]. Although this study highlighted a lesser impact of agricultural land expansion on Merja Bargha (MB), Benhoussa et al. (2023) mentioned in their work on the Merjas complex of the Ramsar site (Marsh, and Rmel plateau coast) that the main threats to MB were vegetation clearance, sometimes generalized to all vegetation in Merja, as well as pollution and eutrophication related to the use of fertilizers and pesticides in neighboring agricultural lands [68]. Regarding the Smir Lagoon (SL), numerous research studies have shed light on its ecological capabilities and the human-induced challenges it faces [69,70,71]. These investigations have highlighted that in recent decades, the site has undergone changes due to modern infrastructure projects, such as the construction of a dam and a marina. These changes have led to a significant reduction in the lagoon’s size, modifications in its water flow patterns, and the disappearance of various plant and animal species. The increasing urban sprawl, which continues to replace natural landscapes with coastal housing developments, has generated negative effects on biodiversity, leading to the deterioration of habitats and imperiling the persistence of the site.
Furthermore, the Master Plan for Protected Areas [27] highlighted that the cedar forest of Jbel Tizirane (JT), which covers the majority of the SBEI, was fairly well-preserved and thrived under very favorable conditions. Despite the site facing minimal threats and having a highly diversified ecosystem, the plan recommended granting it nature reserve status in the future because of its ecological importance and the threats posed by nearby activities like cannabis cultivation, fire risks, and increasing demand for wood. Located in close proximity to the urban area of Tangier, the Perdicaris SBEI (P) represents a green space surrounded by an urban perimeter. It is evident that the natural features of the site are being impacted by uncontrolled population growth and urban development [27]. Similarly, the SBEI of Koudiat Taifour (KTa) has undergone a landscape and functional transformation in the last decades, primarily due to the surge in the construction of urban developments for tourism. This extensive development of tourism infrastructure, which has significantly impacted the environment, poses a continued threat in the future due to its high economic significance. The LSP patterns observed at the SBEI of Cap Spartel (CS) were not significantly different from those of P and KTa, except for the predominance of wildfires due to recurrent fire incidents in recent years [26].
As part of a project aimed at involving young people and civil society in enhancing resilience to climate change in Talassemtane National Park (TNP) and the proposed Bouhachem National Park (PBNP), young volunteers conducted comprehensive assessments of environmental issues in the two PAs through on-site surveys. The resulting efforts led to the development of a community-driven strategy for climate change resilience in both areas. Shedding light on the ecological, ecotourism, and cultural potentials of the two territories, the final report also emphasized the diversity of anthropogenic pressures they face. Deforestation and intentionally set fires to convert forest land into agricultural land for cannabis monoculture were identified as the primary concerns [72]. The continental SBEI of Ben Karrich (BK) showcases beautiful landscapes characteristic of the Rif mountain range. It is bordered to the north and east by two main roads connecting Tangier and Chefchaouen to Tetouan, and to the south and east by the Numidian mountain range. The area is experiencing significant environmental changes due to human activities such as uncontrolled urbanization, expansion of agriculture, unsustainable land management practices, and pollution. These human influences have had a notable impact on the forest vegetation, resulting in the degradation of tetracline and cork oak formations, with cociferae now limited to specific scrubland areas. The Khmiss Essahel SBEI (KE) was primarily selected for the presence of peatlands with Royal Osmunda and Genista anglica. These wetlands, currently under significant threat, are situated within a degraded cork oak forest. Nevertheless, its presence still protects this type of habitat, characterized by a high biological concentration, thereby endowing the site with substantial pedagogical and scientific value. Due to its proximity to the major urban centers of Larache and Tangier, the overall territory of the SBEI experiences diverse anthropogenic pressures [27].
Ghomara Coast (GC) was proposed as an SBEI under the framework of the Master Plan for Protected Areas [27] due to its specific artisanal fishing practices along the Mediterranean Moroccan coasts, as well as the area’s landscape quality and heritage value. The primary socio-economic activities in GC include artisanal fishing, supported by the growing tourism sector and related recreational activities. Primary threats to the terrestrial environment arise from the expansion of the regional road network (e.g., the Mediterranean bypass), the construction of residential or recreational complexes, and the development of coastal tourism infrastructure. These activities lead to alterations in the coastal morphology and an increase in the discharge of wastewater and litter [26]. Located near Larache, along the Loukkos River downstream from the dam, the Larache marshes (LM) are a significant wetland area in Morocco listed as a Ramsar site. Wetlands are home to a variety of aquatic and semi-aquatic plants, providing habitat for numerous water bird species. The primary activities in the surrounding area include farming, raising livestock, producing salt, and tourism. However, these activities are also responsible for issues such as eutrophication, diverting water upstream, and dredging certain areas for agricultural expansion. The shift towards agricultural activities often comes at the expense of natural ecosystems resulting in habitat transformation and loss. Such transformation typically leads to changes in hydrological functions and water quality within the ecosystem, causing habitat fragmentation and population disjunction [27,73]. Further north, on the Atlantic side of the Tingitan Peninsula, there is another vast wetland area with similar ecological potential and spatial dynamics. This area is the coastal SBEI of Oued Taheddart (OT), which is also recognized as a Ramsar site. A study by Rifai et al. (2018) utilized remote sensing techniques to analyze the impact of land use changes on the natural habitats of the site from 1978 to 2013. The findings revealed significant changes in land cover despite the site’s conservation status. There were decreases in natural habitats such as forests, estuarine vegetation, and sand dunes, along with increases in urban areas and bare soil. Human activities have disrupted many ecological corridors, reducing connections between biodiversity reservoirs in the wetland area [74]. Last, the coastal SBEI of Jbel Moussa (JM) stands as the northernmost designated protected natural area in Morocco, acknowledged as an Important Bird and Biodiversity Area (IBBA). It serves as a significant migration hotspot for the passage of migrating seabirds between the Atlantic Ocean and the Mediterranean Sea. As indicated by several bibliographic investigations, the primary pressures compromising the terrestrial natural resources of the site include urbanization, deforestation, various tourism-related activities, and housing expansion [7,75].
4.3. PAs’ Conservation Effectiveness Assessment
Assessing PAs conservation effectiveness is a challenging task that involves a diverse array of methodologies. The selection of these methodologies depends on the specific context, particularly the data and tools used. Leverington et al. (2010) conducted a comprehensive review and identified over 70 different methodologies used globally to assess the effectiveness of PAs [76]. Globally, these approaches were categorized by Rodríguez-Rodríguez and Martínez-Vega (2022) into three main groups: qualitative opinion-based methods, quantitative methods, and mixed methods. Qualitative methods typically use primary data from surveys or interviews to PA managers or other stakeholders. They allow for rapid, cost-effective assessments although their accuracy and precision are improvable [45]. They are the largely prevailing PA assessment/evaluation methods, especially in developing countries [76]. On the other hand, quantitative methods use statistical data from primary or secondary sources including on-site biodiversity monitoring, official statistics and remote sensing. They usually provide high accuracy and precision, especially if carried out according to standardized data collection protocols. Mixed methods combine quantitative, objective data with subjective, qualitative data from surveys or interviews [45].
According to the comprehensive study by Rodríguez-Rodríguez and Martínez-Vega (2022), the two most widely used qualitative methods are the Rapid Assessment and Prioritization of Protected Areas Management (RAPPAM) methodology and the Management Effectiveness Tracking Tool (METT) [45,77,78]. The RAPPAM methodology is a comprehensive tool designed to evaluate the overall management effectiveness of PAs within a specific country or region. This methodology enables a rapid assessment of the PA network, providing insights into the strengths and weaknesses of management practices, threats, vulnerabilities, and degradation levels. By conducting a broad-level assessment, RAPPAM helps identify areas of high ecological and social importance, assess urgency and conservation priorities, and develop recommendations for policy interventions to enhance the effectiveness of PA management. The methodology involves five key steps: determining the assessment scope, assessing existing information, administering a rapid assessment questionnaire, analyzing findings, and identifying next steps and recommendations. Through interactive workshops involving PA managers, policymakers, and stakeholders, RAPPAM facilitates a collaborative approach to evaluating PAs, analyzing results, and setting priorities for improvement [79]. For instance, Ervin (2003a) implemented the RAPPAM methodology to evaluate and prioritize management efforts within PAs across four countries (Bhutan, China, Russia, and South Africa). Through structured interviews and field assessments, RAPPAM identified key threats such as poaching, alien plants, tourism, logging, and encroachment, as well as management issues including funding, staffing, research and monitoring, resource inventories, and community relations. These findings served to inform policy initiatives and enhance the effectiveness of PA management practices in the four countries [77].
The MEET methodology is a rapid assessment based on a scorecard questionnaire. The scorecard includes all six elements of management identified in the IUCN World Commission on Protected Areas (WCPA) framework (context, planning, inputs, process, outputs, and outcomes) but has an emphasis on context, planning, inputs, and process. It is basic and simple to use and provides a mechanism for monitoring progress towards more effective management over time. It is used to enable park managers and donors to identify needs, constraints, and priority actions to improve the effectiveness of PA management [80]. For example, a recent study conducted by Namsrai et al. (2019) used METT to assess management effectiveness and identify common threats of PAs across different natural zones and administrative areas in Mongolia. The results of this evaluation indicated that the main threats faced by PAs in this area were the degradation of ecosystems, environmental pollution, and habitat fragmentation, resulting from overexploitation and inappropriate use of natural resources. All six PAs examined had clear management goals and decision-making systems; however, their management effectiveness scores differed significantly. This research suggested that the administrative features of individual PA influenced management effectiveness, and problems in the efficient implementation of management still needed to be resolved [81].
Regarding quantitative evaluation methods, particularly those based on remote sensing, Gohr et al. (2022) analyzed 44 peer-reviewed scientific papers that utilized remote sensing data to examine the effectiveness of PAs and concluded that a globally standardized framework did not currently exist in the field. Results showed that very few studies to date had a wide or global geographical focus; instead, most quantified the effectiveness of PAs by focusing on local-scale case studies and single indicators, such as forest cover change. Furthermore, landscape indicators were used in 42 studies, with the primary focus being on Land Use and Land Cover Change (LUCC) analysis. Vegetation or explicit forest cover change was the main indicator used to assess the effectiveness of PAs [82]. In another bibliometric analysis on remote sensing applications in monitoring PAs, Duan et al. (2020) examined 4546 academic publications from the Web of Science database spanning from 1991 to 2018. The research revealed a growing trend in the annual publication count related to the field. Key topics included change detection, biodiversity conservation, and the impacts of climate change. The most commonly used satellites and sensors were Landsat, MODIS, and LiDAR. The study identified remote sensing monitoring methods that predominantly included classification, time-series analysis, model methods, object-oriented methods, visual analysis, and direct comparison methods. Among these, classification was the most common method, accounting for 11.57% of the total publications, followed by time-series analysis at 6.34%, and modeling methods at 3.50% [83]. Mixed methods combine the strengths of qualitative and quantitative approaches. The System for the Integrated Assessment of Protected Areas (SIAPA) method, created by Rodríguez-Rodríguez and Martínez-Vega (2013), is a prime example of this blend as it combines quantitative indicators with qualitative assessments to establish a comprehensive evaluation framework [84]. The quantitative aspect involves gathering and analyzing objective data such as biodiversity metrics, land use statistics, and environmental quality indicators. In contrast, the qualitative aspect involves collecting subjective data through surveys, interviews, and consultations with stakeholders to capture various viewpoints on conservation effectiveness, management practices, and socio-economic impacts. By merging these two types of data, SIAPA offers a holistic understanding of PAs, facilitating informed decision-making and adaptive management.
Moreover, the bibliometric studies conducted by Martínez-Vega and Rodríguez-Rodríguez (2022) and Duan et al. (2020) highlighted a notable gap in research (at least during their study periods) regarding the effectiveness of PAs and the application of remote sensing techniques for monitoring these spaces in North Africa, particularly in Morocco [83,85]. Consequently, this study represents the first investigation of this topic in the region and introduces a novel approach based on remote sensing data processed through ESDA methods, thereby categorizing it within the second category of quantitative methodologies. By applying this approach to the PA network in northern Morocco, we evaluated its conservation effectiveness against five key LSPs: deforestation, infrastructure extension, agricultural expansion, wildfires, and population growth. Additionally, this method facilitated an understanding of the spatial patterns in landscape dynamics affecting this network. Our results indicated that most of the PAs in the region, totaling 19, exhibited conservation effectiveness typologies distributed across quadrants Q1 and Q4. Specifically, seven PAs, representing one-third of the total, fell within quadrant Q1, characterized by medium and low disturbance levels in both the IZ and PSEZ. Conversely, quadrant Q4 encompassed nearly half of the total number of PAs (12), characterized by high and very high disturbance levels in both zones. The dominance of Q1 and Q4 quadrant typologies could be attributed to the significant positive correlation between the conservation ratios calculated in both zones. In other words, the LSPs impacted both zones similarly: high index values of the CEI in IZs were associated with high values of the same index in PSEZs and vice versa. This finding underscores that LSPs in the area generally affect the territory regardless of its protection status.
However, an exception was noted in the case of the continental SBEI of Jbel Tizirane (JT) classified in typology Q2.a, where despite significant disturbance in the PSEZ, the IZ remained relatively undisturbed. This result was expected due to the mountainous characteristics of the SBEI, which act as a physical barrier against the intense anthropogenic pressures observed in the surrounding areas, such as the expansion of agricultural land for cannabis cultivation, fires, and population growth in neighboring localities [27]. The findings also indicated minimal disruption within protected natural area zones (PNAZs) in parks. The success of conservation in these zones is largely attributed to the advanced protection status they receive against various anthropogenic pressures. It is important to note that the variability in conservation effectiveness typologies of the region’s PAs, ranging from those with relatively high conservation levels to those with very high disturbance levels, allows the global network to be classified into a median typology (Q2.c). This suggests a general shift towards increased disturbance levels if appropriate measures are not taken in the future, particularly in the most disturbed PAs.
Finally, we found it beneficial to develop a methodological framework for the approach used in our case study that could be applied in other regions (Figure 8). Overall, the suggested approach comprises six main steps:
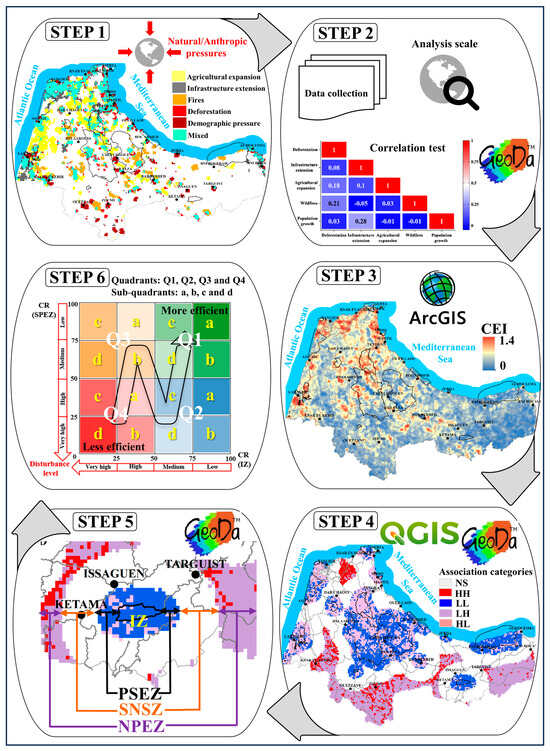
Figure 8.
Methodological framework for the PAs’ conservation effectiveness assessment: Step1: identification of major pressures; step 2: data collection and preliminary analyses; step 3: calculation of the cumulative effect index (CEI); step 4: bivariate analysis; step 5: zoning identification; and step 6: diagram of conservation effectiveness typologies.
- Step 1: Identification of major pressures
This crucial phase is essential for various qualitative, quantitative, and mixed assessment methodologies. It involves documenting all natural or human-induced pressures affecting the PAs under study by reviewing the literature or conducting field surveys. Pressures refer to forces, activities, or events that have negatively impacted the integrity of the protected area, such as reducing biodiversity, hindering regeneration, or depleting natural resources. These pressures can be legal or illegal and may result from direct or indirect impacts of activities [79]. Examples of pressures relevant to PA assessments include logging, land-use conversion, mining, grazing, dam construction, hunting, the collection of non-timber forest products, tourism and recreation, and waste disposal.
- Step 2: Data Collection and Preliminary Analyses
This step involves collecting data on the pressures identified from various sources at local, regional, or global levels. Initially, the focus is on determining an appropriate analysis scale based on the data resolution (1 km2 in our case). Following this, it is crucial to examine the relationship between variables to prevent redundant calculations when strong correlations exist. This validation process can be carried out using different statistical tests and software tools, such as the local bivariate Moran’s index calculated with GeoDa 1.8 in our case.
- Step 3: Calculation of the Cumulative Effect Index (CEI)
The CEI is a robust quantitative measure that evaluates the combined impact of various LSPs at a specific spatial scale. By consolidating different environmental stressors into a single metric, the CEI enables a holistic evaluation that can guide more effective management and mitigation strategies. Widely used in environmental science studies, the CEI has proven to be a versatile tool for evaluating the combined impact of human activities on both terrestrial and marine ecosystems. It has been used to measure the impacts of deforestation, urbanization, and agricultural expansion in terrestrial ecosystems, as well as fishing, pollution, and coastal development in marine environments [47,86,87,88]. By utilizing the CEI, researchers and policymakers can pinpoint areas with high cumulative impact and prioritize them for conservation efforts. The CEI was calculated using different formulas and applied under various designations. In our case, we chose to use the Shannon–Wiener index to calculate the CEI.
- Step 4: Bivariate analysis
The goal of the bivariate analysis is to investigate how the CEI changes in relation to the distance to protected zones. In this study, the nearest distance from each spatial unit represented by its centroid to the network of protected areas was calculated using the NNJoin tool in QGIS. Next, the bivariate Moran’s index was used to examine the spatial relationship between the CEI and the nearest distance using GeoDa 1.8. This analysis also helped describe the spatial distribution of the five association categories (HH, LL, HL, LH, and NS).
- Step 5: Zoning identification
Numerous studies have underscored the significant role of zoning in managing ecological and functional diversities within designated areas. While effective internal zoning facilitates tailored conservation actions by recognizing and accommodating the specific ecological characteristics and functional needs of different zones, external zoning is equally essential to examine potential spillover effects through the inclusion of buffer zones [88,89,90]. Through the bivariate Moran analysis between the CEI and the nearest distance to protected zones conducted using GeoDa 1.8 software, our approach offers the advantage of establishing an automatic zoning of PAs distinguishing four zones: IZ, PSEZ, SNSZ, and NPEZ. Each zone is characterized by the prevalence of specific categories of spatial association.
- Step 6: Diagram of conservation effectiveness typologies
The concept of PAs’ conservation effectiveness encompasses a wide array of definitions, each reflecting different priorities, contexts, and objectives. Various organizations and frameworks emphasize different aspects, including biodiversity preservation, cultural heritage, ecosystem services, and the sustainable use of natural resources. For instance, Gohr et al. (2022) conducted a qualitative and quantitative analysis of 44 peer-reviewed scientific papers that utilized remote sensing data. Based on the diverse range of existing definitions, they proposed a comprehensive understanding of the effectiveness of PAs, which included mitigating biodiversity and habitat loss, providing ecosystem services that enhance human well-being, and exerting a sustainable impact on the surrounding areas by serving as flagship regions [82]. Equally, this definition calls for subsequent research to define remotely sensed indicators depicting the socio-ecological effectiveness of PAs. In this context, the definition considered in our study pertained to the ability of the region’s network of PAs, particularly in central and peripheral zones, to withstand major pressures that could disrupt its ecological, ecotouristic, scientific, and social functions. To measure this capacity, we used a quantitative indicator designated as the conservation ratio (CR), which involved the number of LL and HL units in both the IZ and PSEZ. According to our concept, a PA is more effective when it tends to individualize more LL units compared to HL units within its IZ and PSEZ. It is important to emphasize that our method is advantageous because the measured capacity reflects an evaluation within the framework of the overall network. In other words, if any potential interactions exist between the different PAs, they will be accurately captured in the count of LL and HL units, and consequently in the values of the CRs. This approach therefore allows for the inclusion of potential mutual effects in the evaluation of conservation effectiveness. The calculation of internal and external CRs allows for the classification of each PA within the conservation typologies’ diagram, comprising a total of 16 typologies. The N-rule facilitates the classification of all studied PAs based on their level of conservation. We emphasize here the utility of the established typology diagram in monitoring the individual performance of each PA as well as the global network against the anthropogenic pressures under consideration. Hence, this diagram could be used in the future as a tool for managers to track the disturbance trajectories in protected zones based on the evolution of the influencing factors. Moreover, the approach is quite flexible in response to changes in contexts. If new threats to PAs emerge and their spatial scale information is accessible, incorporating them into the assessment process would be as simple as integrating their factors into the CEI calculation.
5. Conclusions
In northern Morocco, the TTA region’s network of protected areas (PAs) spans terrestrial and marine zones, playing vital roles in ecological preservation, ecotourism, and scientific domains. These PAs support biodiversity by providing habitats for numerous endemic and threatened species and offer essential ecosystem services like water purification, soil stabilization, and carbon sequestration, crucial for mitigating climate change and land degradation. Furthermore, they enhance ecotourism by educating visitors about ecological processes, benefiting local economies, and promoting environmental awareness. Scientifically, these areas serve as living laboratories for studying ecological interactions, climatic impacts, and developing conservation strategies.
However, at a regional or even national level, Moroccan PAs are not immune to various natural and anthropogenic pressures that threaten their integrity and functionality. In response to these challenges, the country has aligned its conservation efforts with international commitments, such as the Convention on Biological Diversity (CBD), Ramsar, and the Convention on International Trade in Endangered Species of Wild Fauna and Flora (CITES.) The Master Plan for Protected Areas, implemented since 1995, has led to significant conservation initiatives, including management and development plans for PAs, wildlife restoration, and the establishment of new national parks. Recently, the “Forests of Morocco 2020–2030” strategy has marked a significant advancement in PA governance, focusing on classifying priority sites into designated PA categories to ensure the protection and sustainability of Morocco’s natural ecosystems.
This study investigated the essential natural resources and challenges facing PAs in northern Morocco, providing valuable insights to guide conservation efforts for the region’s ecosystems. The innovative methodology introduced in this research utilized remote sensing data analyzed through exploratory spatial data analysis techniques, categorizing it as a quantitative approach to assess the conservation effectiveness of PAs. Applying this method in the network of PAs in northern Morocco could establish a model for comparable assessments worldwide.
Author Contributions
Conceptualization, H.B., A.G. and A.M.; methodology, H.B. and A.G.; software, H.B.; validation, A.M. and R.S.; formal analysis, Z.A., Y.M. and R.S.; investigation, H.B., A.G. and A.M.; resources, H.B. and A.G.; data curation, Z.A., Y.M. and R.S.; writing—original draft preparation, H.B. and A.G.; writing—review and editing, H.B., Y.M., A.G., R.S. and A.M.; supervision, A.M., A.G. and R.S. All authors have read and agreed to the published version of the manuscript.
Funding
This research received no external funding.
Data Availability Statement
The data presented in this study are available on request from the corresponding author.
Acknowledgments
We wish to express our thanks to the Regional Directorate of the National Agency for Waters and Forests of Tetouan for the supervision of this study.
Conflicts of Interest
The authors declare no conflicts of interest.
References
- Ervin, J. Making Protected Areas Relevant: A Guide to Integrating Protected Areas into Wider Landscapes, Seascapes, and Sectoral Plans and Strategies; Secretariat of the Convention on Biological Diversity: Montreal, QC, Canada, 2010. [Google Scholar]
- UNDP (United Nations Development Programme). Creating a Nature Positive Future: The Contribution of Protected Areas and Other Effective Area-Based Conservation Measures; UNDP: New York, NY, USA, 2021. [Google Scholar]
- Benabid, A. Flore et Écosystèmes du Maroc: Évaluation et Préservation de la Biodiversité; Ibis Presses: Paris, France, 2000; ISBN 978-2-910728-13-7. [Google Scholar]
- ONEM Observatoire National de l’Environnement du Maroc-Ministère de L’Aménagement du Territoire, de L’Urbanisme, de L’Habitat et de L’Environnement Departement de l’Environnement: Etude Nationale sur la Biodiversité-Rapport de Synthèse. Available online: https://inau.ac.ma/binau/index.php?lvl=notice_display&id=786 (accessed on 3 February 2024).
- MEMEE (Ministère de l’Énergie, des Mines, de l’Eau et de l’Environnement). Stratégie et Plan d’Action National de la Biodiversité; MEMEE: Rabat, Morocco, 2014. [Google Scholar]
- ANEF Gestion de la Biodiversité. Agence Nationale des Eaux et Forêts-Quartier Administratif, Rabat—Chellah. Available online: http://www.eauxetforets.gov.ma/Biodiversite/GestionBiodiversite/Pages/Gestion-Biodiversite.aspx (accessed on 4 February 2024).
- MEMEE. État et Avenir de l’Environnement de la Région Tanger—Tétouan: SYNTHÈSE POUR LES DÉCIDEURS: 2013; Ministère de l’Energie, des Mines, de l’Eau et de l’Environnement-Département de l’Environnement: Rabat, Morocco; Observatoire Régional de l’Environnement et du Développement Durable de la Région Tanger-Tétouan: Tanger, Morocco, 2013. [Google Scholar]
- Tellier, J.L.; Debbi, F. La Mobilite Urbaine dans L’Agglomeration de Tanger: Evolutions dt Perspectives; Sophia Antipolis Regional Activity Center: Sophia Antipolis, France, 2009. [Google Scholar]
- Boubekraoui, H.; Maouni, Y.; Ghallab, A.; Draoui, M.; Maouni, A. Deforestation Drivers in Northern Morocco: An Exploratory Spatial Data Analysis. Environ. Res. Commun. 2024, 6, 071005. [Google Scholar] [CrossRef]
- Geist, H.J.; Lambin, E.F. Proximate Causes and Underlying Driving Forces of Tropical Deforestation. BioScience 2002, 52, 143. [Google Scholar] [CrossRef]
- HCP (Haut-Commissariat au Plan). Les Objectifs de Développement Durable Rapport Régional Tanger-Tétouan-Al Hoceima; HCP: Rabat, Morocco, 2022; p. 180. [Google Scholar]
- Shannon, C.E. A Mathematical Theory of Communication. Bell Syst. Tech. J. 1948, 27, 379–423. [Google Scholar] [CrossRef]
- Anselin, L.; Getis, A. Spatial Statistical Analysis and Geographic Information Systems. Ann. Reg. Sci. 1992, 26, 19–33. [Google Scholar] [CrossRef]
- Bacon, E.; Gannon, P.; Stephen, S.; Seyoum-Edjigu, E.; Schmidt, M.; Lang, B.; Sandwith, T.; Xin, J.; Arora, S.; Adham, K.N.; et al. Aichi Biodiversity Target 11 in the Like-Minded Megadiverse Countries. J. Nat. Conserv. 2019, 51, 125723. [Google Scholar] [CrossRef]
- Geldmann, J.; Manica, A.; Burgess, N.D.; Coad, L.; Balmford, A. A Global-Level Assessment of the Effectiveness of Protected Areas at Resisting Anthropogenic Pressures. Proc. Natl. Acad. Sci. USA 2019, 116, 23209–23215. [Google Scholar] [CrossRef]
- UNEP-WCMC; UNEP; IUCN. Protected Planet Report 2020; The UN Environment Programme: Nairobi, Kenya, 2021; Available online: https://www.unep.org/resources/protected-planet-report-2020 (accessed on 10 February 2024).
- Coad, L.; Leverington, F.; Knights, K.; Geldmann, J.; Eassom, A.; Kapos, V.; Kingston, N.; De Lima, M.; Zamora, C.; Cuardros, I.; et al. Measuring Impact of Protected Area Management Interventions: Current and Future Use of the Global Database of Protected Area Management Effectiveness. Philos. Trans. R. Soc. B 2015, 370, 20140281. [Google Scholar] [CrossRef] [PubMed]
- Geldmann, J.; Deguignet, M.; Balmford, A.; Burgess, N.D.; Dudley, N.; Hockings, M.; Kingston, N.; Klimmek, H.; Lewis, A.H.; Rahbek, C.; et al. Essential Indicators for Measuring Site-based Conservation Effectiveness in the Post-2020 Global Biodiversity Framework. Conserv. Lett. 2021, 14, e12792. [Google Scholar] [CrossRef]
- Chen, H.; Zhang, T.; Costanza, R.; Kubiszewski, I. Review of the Approaches for Assessing Protected Areas’ Effectiveness. Environ. Impact Assess. Rev. 2023, 98, 106929. [Google Scholar] [CrossRef]
- HCEFLCD (Haut-Commissariat aux Eaux et Forêts et à la Lutte Contre la Désertification). Cadrage à L’horizon 2020 du Plan Directeur des Aires Protégées au Maroc; Deutsche Gesellschaft für Internationale Zusammenarbeit (GIZ) GmbH: Rabat, Morocco, 2012. [Google Scholar]
- UICN-Med—SEO/BirdLife. Faune et Flore du Parc National D’Al Hoceima; IUCN, International Union for Conservation of Nature and Natural Resources: Gland, Switzerland, 2012; ISBN 978-2-8317-1436-3. [Google Scholar]
- Alami, N. Création Participative Du Parc Naturel de Bouhachem (Maroc)-. Forêt Méditerranéenne 2011, 32, 435–436. [Google Scholar]
- CEIBM Centre d’Echange d’Information sur la Biodiversité du MAROC-Convention sur la Diversité Biologique: Espaces Protégés. Available online: https://ma.chm-cbd.net/fr/biodiversity/espaces-proteges (accessed on 10 February 2024).
- Khamlichi, R.E.; Amezian, M.; Haoua, M.K.E.; Bergier, P. La importancia del Yebel Musa, Marruecos, en la conservación de especies amenazadas de Buitres durante sus movimientos por el área del Estrecho de Gibraltar. Go-South Bull. 2015, 12, 61–77. [Google Scholar]
- Qninba, A. Les Changements Récents Dans La Composition Du Peuplement d’oiseaux d’eau Nicheurs Du Bas Tahaddart (Nord-Ouest Du Maroc). In Sustainable Management of Mediterrean Coastal Fresh and Transitional Water Bodies: A Socio-Economic … [Electronic Resource]: Proceedings …—(Proceedings e Report; 49); Firenze University Press: Firenze, Italy, 2009; pp. 1000–1009. [Google Scholar] [CrossRef]
- Mateo-Ramírez, Á.; Marina, P.; Moreno, D.; Alcántara Valero, A.F.; Aguilar, R.; Báez, J.C.; Bárcenas, P.; Baro, J.; Caballero-Herrera, J.A.; Camiñas, J.A.; et al. Marine Protected Areas and Key Biodiversity Areas of the Alboran Sea and Adjacent Areas. In Alboran Sea—Ecosystems and Marine Resources; Báez, J.C., Vázquez, J.-T., Camiñas, J.A., Malouli Idrissi, M., Eds.; Springer International Publishing: Cham, Switzerland, 2021; pp. 819–923. ISBN 978-3-030-65515-0. [Google Scholar]
- AEFCS & BCEOM-SECA (Administration des Eaux et Forêts et de la Conservation des Sols & BCEOM-SECA). Etude Des Aires Protégées Du Maroc; AEFCS & BCEOM-SECA: Rabat, Morocco, 1995; Volume 19. [Google Scholar]
- Potapov, P.; Hansen, M.C.; Pickens, A.; Hernandez-Serna, A.; Tyukavina, A.; Turubanova, S.; Zalles, V.; Li, X.; Khan, A.; Stolle, F.; et al. The Global 2000–2020 Land Cover and Land Use Change Dataset Derived from the Landsat Archive: First Results. Front. Remote Sens. 2022, 3, 856903. [Google Scholar] [CrossRef]
- Assede, E.S.P.; Orou, H.; Biaou, S.S.H.; Geldenhuys, C.J.; Ahononga, F.C.; Chirwa, P.W. Understanding Drivers of Land Use and Land Cover Change in Africa: A Review. Curr. Landsc. Ecol. Rep. 2023, 8, 62–72. [Google Scholar] [CrossRef]
- García-Álvarez, D.; Lara Hinojosa, J.; Jurado Pérez, F.J.; Quintero Villaraso, J. Global General Land Use Cover Datasets with a Time Series of Maps. In Land Use Cover Datasets and Validation Tools; García-Álvarez, D., Camacho Olmedo, M.T., Paegelow, M., Mas, J.F., Eds.; Springer International Publishing: Cham, Switzerland, 2022; pp. 287–311. ISBN 978-3-030-90997-0. [Google Scholar]
- Vale, M.M.; Lima-Ribeiro, M.S.; Rocha, T.C. Global Land-Use and Land-Cover Data: Historical, Current and Future Scenarios. Biodivers. Inform. 2021, 16, 28–38. [Google Scholar]
- Winkler, K.; Fuchs, R.; Rounsevell, M.; Herold, M. Global Land Use Changes Are Four Times Greater than Previously Estimated. Nat. Commun. 2021, 12, 2501. [Google Scholar] [CrossRef] [PubMed]
- Witjes, M.; Parente, L.; Van Diemen, C.J.; Hengl, T.; Landa, M.; Brodský, L.; Halounova, L.; Križan, J.; Antonić, L.; Ilie, C.M.; et al. A Spatiotemporal Ensemble Machine Learning Framework for Generating Land Use/Land Cover Time-Series Maps for Europe (2000–2019) Based on LUCAS, CORINE and GLAD Landsat. PeerJ 2022, 10, e13573. [Google Scholar] [CrossRef]
- HCEFLCD Base de Données Cartographiques de l’Inventaire Forestier National, Rapport Interne. Haut-Commissariat Aux Eaux et Forêts et à La Lutte Contre La Désertification; HCEFLCD: Rabat, Morocco, 2004. [Google Scholar]
- Hansen, M.C.; Potapov, P.V.; Moore, R.; Hancher, M.; Turubanova, S.A.; Tyukavina, A.; Thau, D.; Stehman, S.V.; Goetz, S.J.; Loveland, T.R.; et al. High-Resolution Global Maps of 21st-Century Forest Cover Change. Science 2013, 342, 850–853. [Google Scholar] [CrossRef] [PubMed]
- Pickens, A.H.; Hansen, M.C.; Hancher, M.; Stehman, S.V.; Tyukavina, A.; Potapov, P.; Marroquin, B.; Sherani, Z. Mapping and Sampling to Characterize Global Inland Water Dynamics from 1999 to 2018 with Full Landsat Time-Series. Remote Sens. Environ. 2020, 243, 111792. [Google Scholar] [CrossRef]
- Potapov, P.; Turubanova, S.; Hansen, M.C.; Tyukavina, A.; Zalles, V.; Khan, A.; Song, X.-P.; Pickens, A.; Shen, Q.; Cortez, J. Global Maps of Cropland Extent and Change Show Accelerated Cropland Expansion in the Twenty-First Century. Nat. Food 2021, 3, 19–28. [Google Scholar] [CrossRef] [PubMed]
- Chuvieco, E.; Pettinari, M.L.; Lizundia-Loiola, J.; Storm, T.; Padilla Parellada, M. ESA Fire Climate Change Initiative (Fire_cci): MODIS Fire_cci Burned Area Pixel Product, version 5.1; Centre for Environmental Data Analysis: Chilton, UK, 2018. [Google Scholar]
- Center For International Earth Science Information Network-CIESIN-Columbia University. Gridded Population of the World, Version 4 (GPWv4): Population Density, Revision 11; NASA Socioeconomic Data and Applications Center (SEDAC): Palisades, NY, USA, 2017. [Google Scholar]
- Newton, P.; Kinzer, A.T.; Miller, D.C.; Oldekop, J.A.; Agrawal, A. The Number and Spatial Distribution of Forest-Proximate People Globally. One Earth 2020, 3, 363–370. [Google Scholar] [CrossRef]
- Boubekraoui, H.; Maouni, Y.; Ghallab, A.; Draoui, M.; Maouni, A. Spatio-Temporal Analysis and Identification of Deforestation Hotspots in the Moroccan Western Rif. Trees For. People 2023, 12, 100388. [Google Scholar] [CrossRef]
- Anselin, L. Local Indicators of Spatial Association—LISA. Geogr. Anal. 1995, 27, 93–115. [Google Scholar] [CrossRef]
- Oliveau, S. Autocorrélation Spatiale: Leçons Du Changement d’échelle. L’Espace Géographique 2010, 39, 51–64. [Google Scholar] [CrossRef]
- Rodrigues, A.S.L.; Cazalis, V. The Multifaceted Challenge of Evaluating Protected Area Effectiveness. Nat. Commun. 2020, 11, 5147. [Google Scholar] [CrossRef] [PubMed]
- Rodríguez-Rodríguez, D.; Martínez-Vega, J. Protected Area Effectiveness: What Is It and How to Assess It? In Effectiveness of Protected Areas in Conserving Biodiversity; Strategies for Sustainability; Springer International Publishing: Cham, Switzerland, 2022; pp. 31–36. ISBN 978-3-030-94296-0. [Google Scholar]
- Crain, C.M.; Kroeker, K.; Halpern, B.S. Interactive and Cumulative Effects of Multiple Human Stressors in Marine Systems. Ecol. Lett. 2008, 11, 1304–1315. [Google Scholar] [CrossRef] [PubMed]
- Korpinen, S.; Laamanen, L.; Bergström, L.; Nurmi, M.; Andersen, J.H.; Haapaniemi, J.; Harvey, E.T.; Murray, C.J.; Peterlin, M.; Kallenbach, E.; et al. Combined Effects of Human Pressures on Europe’s Marine Ecosystems. Ambio 2021, 50, 1325–1336. [Google Scholar] [CrossRef]
- QGIS NNJoin—QGIS Python Plugins Repository. Available online: https://plugins.qgis.org/plugins/NNJoin/ (accessed on 17 February 2024).
- Anselin, L.; Syabri, I.; Kho, Y. GeoDa: An Introduction to Spatial Data Analysis. In Handbook of Applied Spatial Analysis; Fischer, M.M., Getis, A., Eds.; Springer: Berlin/Heidelberg, Germany, 2006; pp. 73–89. ISBN 978-3-642-03646-0. [Google Scholar]
- Black, B.; Anthony, B.P. Counterfactual Assessment of Protected Area Avoided Deforestation in Cambodia: Trends in Effectiveness, Spillover Effects and the Influence of Establishment Date. Glob. Ecol. Conserv. 2022, 38, e02228. [Google Scholar] [CrossRef]
- Shen, Y.; Liu, G.; Zhou, W.; Liu, Y.; Cheng, H.; Su, X. Protected Areas Have Remarkable Spillover Effects on Forest Conservation on the Qinghai-Tibet Plateau. Divers. Distrib. 2022, 28, 2944–2955. [Google Scholar] [CrossRef]
- Xia, H.; Li, H.; Prishchepov, A.V. Assessing Forest Conservation Outcomes of a Nature Reserve in a Subtropical Forest Ecosystem: Effectiveness, Spillover Effects, and Insights for Spatial Conservation Prioritization. Biol. Conserv. 2023, 285, 110254. [Google Scholar] [CrossRef]
- Boubekraoui, H.; Maouni, Y.; Ghallab, A.; Draoui, M.; Maouni, A. Wildfires Risk Assessment Using Hotspot Analysis and Results Application to Wildfires Strategic Response in the Region of Tangier-Tetouan-Al Hoceima, Morocco. Fire 2023, 6, 314. [Google Scholar] [CrossRef]
- Castro, I.; Stan, A.B.; Taiqui, L.; Schiefer, E.; Ghallab, A.; Derak, M.; Fulé, P.Z. Detecting Fire-Caused Forest Loss in a Moroccan Protected Area. Fire 2022, 5, 51. [Google Scholar] [CrossRef]
- Shah, P.; Baylis, K.; Busch, J.; Engelmann, J. What Determines the Effectiveness of National Protected Area Networks? Environ. Res. Lett. 2021, 16, 074017. [Google Scholar] [CrossRef]
- Fritz, S.; Laso Bayas, J.C.; See, L.; Schepaschenko, D.; Hofhansl, F.; Jung, M.; Dürauer, M.; Georgieva, I.; Danylo, O.; Lesiv, M.; et al. A Continental Assessment of the Drivers of Tropical Deforestation With a Focus on Protected Areas. Front. Conserv. Sci. 2022, 3, 830248. [Google Scholar] [CrossRef]
- Heino, M.; Kummu, M.; Makkonen, M.; Mulligan, M.; Verburg, P.H.; Jalava, M.; Räsänen, T.A. Forest Loss in Protected Areas and Intact Forest Landscapes: A Global Analysis. PLoS ONE 2015, 10, e0138918. [Google Scholar] [CrossRef]
- Leberger, R.; Rosa, I.M.D.; Guerra, C.A.; Wolf, F.; Pereira, H.M. Global Patterns of Forest Loss across IUCN Categories of Protected Areas. Biol. Conserv. 2020, 241, 108299. [Google Scholar] [CrossRef]
- Wade, C.M.; Austin, K.G.; Cajka, J.; Lapidus, D.; Everett, K.H.; Galperin, D.; Maynard, R.; Sobel, A. What Is Threatening Forests in Protected Areas? A Global Assessment of Deforestation in Protected Areas, 2001–2018. Forests 2020, 11, 539. [Google Scholar] [CrossRef]
- Wolf, C.; Levi, T.; Ripple, W.J.; Zárrate-Charry, D.A.; Betts, M.G. A Forest Loss Report Card for the World’s Protected Areas. Nat. Ecol. Evol. 2021, 5, 520–529. [Google Scholar] [CrossRef]
- Yang, H.; Viña, A.; Winkler, J.A.; Chung, M.G.; Huang, Q.; Dou, Y.; McShea, W.J.; Songer, M.; Zhang, J.; Liu, J. A Global Assessment of the Impact of Individual Protected Areas on Preventing Forest Loss. Sci. Total Environ. 2021, 777, 145995. [Google Scholar] [CrossRef]
- Clark, S.; Bolt, K.; Campbell, A. Protected Areas: An Effective Tool to Reduce Emissions from Deforestation and Forest Degradation in Developing Countries? Working Paper; UNEP World Conservation Monitoring Centre: Cambridge, UK, 2008. [Google Scholar]
- Garrett, R.D.; Levy, S.; Carlson, K.M.; Gardner, T.A.; Godar, J.; Clapp, J.; Dauvergne, P.; Heilmayr, R.; Le Polain De Waroux, Y.; Ayre, B.; et al. Criteria for Effective Zero-Deforestation Commitments. Glob. Environ. Chang. 2019, 54, 135–147. [Google Scholar] [CrossRef]
- Nolte, C.; Agrawal, A.; Barreto, P. Setting Priorities to Avoid Deforestation in Amazon Protected Areas: Are We Choosing the Right Indicators? Environ. Res. Lett. 2013, 8, 015039. [Google Scholar] [CrossRef]
- Nolte, C.; Agrawal, A.; Silvius, K.M.; Soares-Filho, B.S. Governance Regime and Location Influence Avoided Deforestation Success of Protected Areas in the Brazilian Amazon. Proc. Natl. Acad. Sci. USA 2013, 110, 4956–4961. [Google Scholar] [CrossRef]
- Ghouat, N.; Redouan, F.Z.; Merzouki, A. Environmental Governance Deficiency of Protected Areas in Morocco. Case of Al Hoceima National Park. Environ. Eng. Manag. J. 2021, 20, 1773–1785. [Google Scholar] [CrossRef]
- Falah, S.; Dakki, M.; Mansouri, I. Mapping Analysis of the Wetland Loss in Loukkos (Morocco) under Agricultural Managements. Bulg. J. Agric. Sci. 2021, 27, 186–193. [Google Scholar]
- Benhoussa, A.; Qninba, A.; Achakar, M.; Himmi, O. Fiche Descriptive sur les Zones Humides Ramsar (FDR); Catégories Approuvées dans la Recommandation 4.7 Modifiée par la Résolution VIII.13 de la Conférence des Parties Contractantes; Bureau de la Convention de Ramsar: Gland, Switzerland, 2023. [Google Scholar]
- Chaouti, A.; Bayed, A. Effets d’une Perturbation Anthropique Sur Les Conditions Hydrologiques de La Langune de Smir (Nord-Ouest, Maroc). Rev. Sci. L’Eau 2005, 18, 181–197. [Google Scholar] [CrossRef][Green Version]
- Hajib, S.; Bayed, A. Aménagement et Gestion de la Zone Humide de Restinga Smir: Une Responsabilité Collective. 2005. Available online: http://www.abhatoo.net.ma/maalama-textuelle/developpement-economique-et-social/developpement-economique/environnement/ecologie/amenagement-et-gestion-de-la-zone-humide-de-restinga-smir-une-responsabilite-collective (accessed on 2 April 2024).
- El Agbani, M.A.; Qninba, A.; Amezian, M.; Cuzin, F.; Dakki, M. Valeurs Ornithologiques Du Complexe Des Marais de Smir (Nord Du Maroc) et Impact Des Aménagements Hydrauliques Sur L’Avifaune. Bull. L’Institut Sci. Rabat Sect. Sci. Vie 2009, 31, 103–110. [Google Scholar]
- Agouzoul, H. Stratégie Participative Locale Pour La Résilience Aux Changements Climatiques Des Territoires Du Parc National de Talassemtane (PNTLS) et Du Projet Du Parc Naturel de Bouhachem (PPNB)-Construire Avec La Nature: Pour Créer Localement de La Prospérité Partagée et Durable et Renfoncer La Résilience Des Écosystèmes Naturels Dans Un Monde Changeant et Incertain. 2021. Available online: https://assated.com/wp-content/uploads/2018/12/Strat%C3%A9gie-CC-des-parcs-naturels-de-Talassemtane-et-Bouhachem-VF-022021.pdf (accessed on 3 April 2024).
- Hamoumi, R.E.; Himmi, O. Distribution et état des lieux des peuplements d’Amphibiens dans le complexe de zones humides du bas Loukkos (Larache, Maroc). Bull. L’Institut Sci. Rabat Sect. Sci. Vie 2010, 32, 95–100. [Google Scholar]
- Rifai, N.; Khattabi, A.; Moukrim, S.; Arahou, M.; Rhazi, L. Évaluation de la dynamique de l’occupation du sol dans la zone humide Ramsar de Tahaddart (Nord-ouest du Maroc). Rev. D’Écologie (Terre Vie) 2018, 73, 142–152. [Google Scholar] [CrossRef]
- HCEFLCD SPA/RAC—ONU Environnement/PAM & HCEFLCD. L’Aire Protégée de Jbel Moussa: Une Perle Dans le Détroit de Gibraltar; Aghnaj, A., Bazairi, H., Limam, A., Eds.; SPA/RAC. Projet MedMPA Network; Programme des Nations Unies pour l’Environnement: Tunis, Tunisia, 2019; 38p. [Google Scholar]
- Leverington, F.; Costa, K.L.; Pavese, H.; Lisle, A.; Hockings, M. A Global Analysis of Protected Area Management Effectiveness. Environ. Manag. 2010, 46, 685–698. [Google Scholar] [CrossRef] [PubMed]
- Ervin, J. Rapid Assessment of Protected Area Management Effectiveness in Four Countries. BioScience 2003, 53, 833–841. [Google Scholar] [CrossRef]
- Stolton, S.; Hockings, M.; Dudley, N.; MacKinnon, K.; Whitten, T.; Leverington, F. Management Effectiveness Tracking Tool-Reporting Progress at Protected Area Sites, 2nd ed.; WWF International: Gland, Switzerland, 2007. [Google Scholar]
- Ervin, J. WWF: Rapid Assessment and Prioritization of Protected Area Management (RAPPAM) Methodology; WWF International: Gland, Switzerland, 2003. [Google Scholar]
- Leverington, F.; Kettner, A.; Nolte, C.; Marr, M.; Stolton, S.; Pavese, H.; Stoll-Kleemann, S.; Hockings, M. Protected Area Management Effectiveness Assessments in Europe; Bundesamt für Naturschutz (BfN): Bonn, Germany, 2010. [Google Scholar]
- Namsrai, O.; Ochir, A.; Baast, O.; Van Genderen, J.L.; Muhar, A.; Erdeni, S.; Wang, J.; Davaasuren, D.; Chonokhuu, S. Evaluating the Management Effectiveness of Protected Areas in Mongolia Using the Management Effectiveness Tracking Tool. Environ. Manag. 2019, 63, 249–259. [Google Scholar] [CrossRef]
- Gohr, C.; Von Wehrden, H.; May, F.; Ibisch, P.L. Remotely Sensed Effectiveness Assessments of Protected Areas Lack a Common Framework: A Review. Ecosphere 2022, 13, e4053. [Google Scholar] [CrossRef]
- Duan, P.; Wang, Y.; Yin, P. Remote Sensing Applications in Monitoring of Protected Areas: A Bibliometric Analysis. Remote Sens. 2020, 12, 772. [Google Scholar] [CrossRef]
- Rodríguez-Rodríguez, D.; Martínez-Vega, J. Results of the Implementation of the System for the Integrated Assessment of Protected Areas (SIAPA) to the Protected Areas of the Autonomous Region of Madrid (Spain). Ecol. Indic. 2013, 34, 210–220. [Google Scholar] [CrossRef]
- Martínez-Vega, J.; Rodríguez-Rodríguez, D. Protected Area Effectiveness in the Scientific Literature: A Decade-Long Bibliometric Analysis. Land 2022, 11, 924. [Google Scholar] [CrossRef]
- Cao, Y.; Wang, S.; Tian, G.; Dong, N.; Lei, Y. Coupling Biodiversity and Human Pressures to Indicate Conservation Priorities for Threatened Waterfowl Species: A Case in the Henan Yellow River Wetland National Nature Reserve. Land 2023, 12, 1250. [Google Scholar] [CrossRef]
- Cegielska, K.; Kukulska-Kozieł, A.; Salata, T.; Piotrowski, P.; Szylar, M. Shannon Entropy as a Peri-Urban Landscape Metric: Concentration of Anthropogenic Land Cover Element. J. Spat. Sci. 2019, 64, 469–489. [Google Scholar] [CrossRef]
- Wang, S.; Yao, W.; Ma, Y.; Shang, E.; Zhang, S.; Chen, F.; Zeng, Y. Optimizing Natural Boundary Definition and Functional Zoning in Protected Areas: An Integrated Framework Encompassing Species, Landscapes and Ecosystems. Glob. Ecol. Conserv. 2024, 49, e02781. [Google Scholar] [CrossRef]
- Feng, Y.; Wang, Y.; Su, H.; Pan, J.; Sun, Y.; Zhu, J.; Fang, J.; Tang, Z. Assessing the Effectiveness of Global Protected Areas Based on the Difference in Differences Model. Ecol. Indic. 2021, 130, 108078. [Google Scholar] [CrossRef]
- Rivarola, M.D.; Dein, J.; Simberloff, D.; Herrero, H.V. Assessing Protected Area Zoning Effectiveness With Remote Sensing Data: The Case of Nahuel Huapi National Park, Argentina. Front. Remote Sens. 2022, 3, 901463. [Google Scholar] [CrossRef]


Disclaimer/Publisher’s Note: The statements, opinions and data contained in all publications are solely those of the individual author(s) and contributor(s) and not of MDPI and/or the editor(s). MDPI and/or the editor(s) disclaim responsibility for any injury to people or property resulting from any ideas, methods, instructions or products referred to in the content. |
© 2024 by the authors. Licensee MDPI, Basel, Switzerland. This article is an open access article distributed under the terms and conditions of the Creative Commons Attribution (CC BY) license (https://creativecommons.org/licenses/by/4.0/).