Article

Estimating the Potential of Electric Vehicles for Travelling to Work and Education in Melbourne, Victoria

Department of Engineering, La Trobe University, Melbourne, VIC 3086, Australia
*
Author to whom correspondence should be addressed.
Future Transp. 2021, 1(3), 737-746; https://doi.org/10.3390/futuretransp1030040
Submission received: 31 August 2021 / Revised: 26 October 2021 / Accepted: 22 November 2021 / Published: 1 December 2021

Abstract

:
This paper aims to estimate the potential of electric vehicles (EVs) in Melbourne, Victoria, using the Victorian Integrated Survey of Travel and Activity (VISTA) data. The investigation of whether EVs with different all-electric ranges (AERs) can replace car travel to work and education is the focus of this paper. The results showed that EVs would be able to replace most car travel to work (68.5% to 97.1%) and car travel to education (71.9% to 96.9%), with AERs increasing from 40 km to 100 km, assuming car drivers are willing to use an EV. It is estimated that the average operating cost savings per person would be up to AUD 3.12 and AUD 2.79 each day, regarding travel to work and education, respectively. Considering both travel to work and education, EVs could replace up to 33.8 million kilometres of car travel, consuming around 7.6 GWh and resulting in a reduction in carbon dioxide (CO2) emissions of about 610 tons each day.

1. Introduction

The most widely used type of vehicles that are driven on Victorian roads are internal combustion engine vehicles (ICEVs). These vehicles have engines that use petrol, diesel, and gas as fuel to generate power. While ICEVs are an affordable option for most Victorians, they bring many negative impacts, which directly affect the environment. ICEVs, while running, release harmful gases, such as carbon dioxide (CO2), which is one of the main culprits in the worldwide issue of climate change/global warming [1]. It is estimated that 20% of the state’s total emissions come from the transport sector, which produces roughly 22.3 million tons of CO2 each year. Looking at the transport sector in Victoria, 89.8% of the transport emissions come from road transportation, 55.9% of which come from cars [2]. The majority of the air pollution and greenhouse gases are caused by modern-day ICEVs [3]. With Victoria looking towards a more environmentally friendly and sustainable future, electric vehicles (EVs), especially those charged with renewable sources, such as solar panels, seem to be a suitable option to replace the majority of ICEVs on the roads in Victoria. The Victorian government aims to support the uptake of EVs by rolling out a zero-emissions vehicle subsidy to residents. The programs that will support the switch to EVs are backed by AUD 100 million by the government to ensure the long-term vision of having half of all light-duty vehicles sold being zero-emissions vehicles by the year 2030 [4].
EVs refer to those that are primarily driven by batteries. The main types of EVs are hybrid electric vehicles (HEVs), plug-in hybrid electric vehicles (PHEVs), and battery electric vehicles (BEVs). HEVs refer to cars that have an internal combustion engine and a battery, use both power sources to run, and do not need to be plugged in to charge, whereas PHEVs use a very similar system, but can be plugged in to charge the batteries. BEVs are purely driven by batteries and need to be charged to operate. EVs offer a range of benefits when being compared to mainstream ICEVs, such as the reduced amount of greenhouse gases, low running costs, and low-noise operation [5,6,7]. EVs can also help improve a nation’s energy security through reduced reliance on imported oil [8]. Although EVs bring many positive benefits, the uptake of this new technology has been rather slow. There are factors contributing to this reason, such as high purchase price, range anxiety, charging infrastructure, maintenance of batteries, hassle of charging batteries on a daily basis, malfunctions, and lack of knowledge [9,10,11,12]. EVs generally have a higher purchase price compared to ICE vehicles, and this is mainly due to the cost of the batteries they use to operate. The bigger the batteries are, the more expensive the EVs become. Battery size also directly relates to the range that the vehicle can travel, along with other factors. Without a fully developed infrastructure for charging EVs, many people have worries about how and where the vehicles can be charged, and there is anxiety surrounding the limited distance the vehicles can operate before having to be plugged in [9].
The transition to EVs is a process that needs many considerations, such as developing sufficient charging infrastructure and upgrading the electrical network to meet the demands of renewable energy, to maximise the chances of EVs becoming an environmentally friendly option in Victoria [13,14,15]. With many individuals wanting to charge their EVs in the comfort of their own homes, there will be an increase in energy demand [16,17]. There are three main types of EV chargers that are based on the amount of power they can provide. Level 1 chargers are those that plug directly into a power point; they are able to charge the battery gradually, but are unable to perform a full charge overnight. Level 2 chargers are dedicated and offer more power, and are able to fully charge an EV battery overnight. Level 3 chargers are referred to as fast chargers and offer fast charging speeds, allowing some EVs to be fully charged within 10 to 15 min. Several studies have examined the impact of EV uptake on electricity demand in Victoria, and estimated that the impact on electricity demand would be under a 10% increase in 2033 [18,19]. The main method of energy production for Australia is through the burning of fossil fuels. The impact of this process harms the environment and makes up almost 30% of Australia’s greenhouse gas emissions [20]. Australia currently attains only 6% of its energy use from renewable energy sources [21]. Thus, to fully maximise the potential of EVs, the use of energy from renewable sources would be needed.
To promote the uptake of EVs, policymakers and manufacturers would need to know the potential markets for EVs, and the potential impacts on emissions and energy demand concerning EVs’ all-electric range (AER). At the same time, consumers would need to know if EVs can accommodate their essential travels, such as travel to/from work and education, and potential cost savings. Much of the previous EV research has focused on daily travel patterns using two main approaches, including the direct use of observed travel activities and modelling of travel activities [22]. The former approach can represent daily travel patterns, but policy analyses need to be conducted via scenarios. The latter approach can also present daily travel patterns and model the impacts of policies directly, but is more complex, with higher data requirements. There have been many investigations into the potential of EVs with the direct use of observed travel patterns from GPS tracking data [5,23], and household travel survey and census journey-to-work data [22,24,25]; for example, Khan and Kockelman [5] analysed the 1-year GPS data of 255 households with electric vehicles in Seattle, US, and found that an EV that had a travel range of 100 miles, or roughly 160 km, could replace 50% of household trips if the household owned one vehicle and 80% of the trips if the household owned more than one vehicle. Their analysis also showed the benefits of EVs regarding operating costs. In New South Wales (NSW), Rafique and Town [25] examined journey-to-work census data and found that the commuting distance of nearly 90% of commuters who drove was under 40 km. This meant that, with this low range, which was travelled daily, almost 90% of the commuters who drove could be replaced with already available EVs, and they would have sufficient time to charge for the following day’s use. It is worth noting that if other influencing factors, such as concerns about battery maintenance or daily charging, were considered, the percentage of car travel that could be replaced by EVs would be lower. Through this study, it was also found that even if the EVs were not charged by using renewable energy, there would still be a substantial reduction in CO2 emissions. Although much research has investigated the potential of EVs using household travel survey data, little is understood about the potential of EVs in replacing educational car travel. In the Australian context, to the best of our knowledge, no research has simultaneously investigated the potential impacts of EVs in replacing commuting and educational car trips, which are the two main types of essential daily travel.
This paper aims to explore the potential of using EVs for travelling to work and education in Melbourne. Using the Victorian Integrated Survey of Travel and Activity (VISTA), it estimates the proportions of existing car travel to work and education that could be replaced by EVs with different AERs. Following this, it estimates the total car distance travelled that could be replaced by EVs, and the associated impacts on electricity demand, CO2 emission reduction, and operation cost savings.

2. Materials and Methods

2.1. Data

The data that were used for the study were directly sourced from VISTA 2012–2018. VISTA is the main ongoing household travel survey, informing transport and land-use planning decisions in Victoria and is widely used in travel behaviour research [26]. The VISTA 2012–2018 data included information about all trips undertaken by all members of approximately 25,000 households, including trip origin and destination, travel mode, departure and arrival time, weekday/weekend, duration, purpose, destination type, and distance. Households’ demographic and socioeconomic information was also included.

2.2. Method

Using the information about travel mode and trip purpose, car trips as a driver to work and education were selected. Since most work and educational trips occurred on weekdays according to the VISTA data, this paper focused on car travel on weekdays only. The distributions of car driver trips to work and education by driving distances were then computed. Using these distributions, the percentages of existing car driver trips to work and education that can potentially be replaced by EVs were calculated, subject to EVs’ AER. Total driving distances of the associated existing car driver trips being replaced by EVs were also computed. The analysis was conducted for each local government area (LGA), i.e., local council, and then aggregated for Greater Melbourne.
Based on the driving distances to be replaced by EVs, the impacts on emissions and operating costs were derived. The average rate of carbon dioxide equivalent, CO2(eq), for ICEVs ( E M I C E V in kg CO2(eq)/km) was calculated as follows:
E M I C E V = E C I C E V × E M f u e l
where E C I C E V is the average rate of fuel consumption of ICEVs (l/km) and E M f u e l is the average rate of emissions from burning fuel (kg CO2(eq)/l).
The average rate of indirect emissions for EVs ( E M E V in kg CO2(eq)/km) was calculated using the following equation:
E M E V = E C E V E f f c h a r g e × E M e l e c t r i c i t y
where E C E V is the average rate of energy consumption of EVs (kWh/km), E f f c h a r g e is the EV charging efficiency factor and E M e l e c t r i c i t y is the average rate of indirect emissions from using electricity (kg CO2(eq)/kWh).
The average rates of operating costs for ICEVs ( O C I C E V in AUD/km) and EVs ( O C E V in AUD/km) were then computed as follows:
O C I C E V = E C I C E V × C f u e l
O C E V = E C E V E f f c h a r g e × C e l e c t r i c i t y
where C f u e l is the average fuel cost (AUD/l) and C e l e c t r i c i t y is the average electricity cost (AUD/kWh).

2.3. Assumptions

The following assumptions were adopted for the analysis:
  • All car driver trips to work and education were by passenger cars. This is a reasonable assumption since passenger cars represent nearly 80% of the vehicle fleet and 70% of total kilometres travelled in Australia [27].
  • Car travel back home from work and education was made by the same travel mode and distance. This assumption is reasonable given only car driver trips were considered.
  • EVs charge at home. Thus, an EV with an AER of 50 km can cover work/education trips (two ways) as long as the distance of travel to work/education is 25 km or below.
The following parameters were assumed for the analysis:
  • E C I C E V was 0.111 l/km based on passenger cars obtained from Australian Bureau of Statistics [27].
  • E C E V was 0.193 kWh/km based on the average energy consumption from an international database [28].
  • E f f c h a r g e was 0.857 based on the average efficiency of level 1 and level 2 EV charging infrastructure [29].
  • E M f u e l was 2.348 kg CO2(eq)/l based on passenger cars obtained from Australian Transport Assessment and Planning Guidelines [30].
  • E M e l e c t r i c i t y was 1.08 kg CO2(eq)/kWh based on indirect emissions from using electricity generated in Victoria [31].
  • C f u e l was 1.448 AUD/l based on Australian Transport Assessment and Planning Guidelines [30].
  • C e l e c t r i c i t y was 0.273 AUD/kWh based on the average residential electricity price in Victoria [32].

3. Results

3.1. Travel to Work and Education Mode Shares

Table 1 shows the number of weekday trips to work and education by travel mode in Greater Melbourne. There is a large number of travel-to-work trips taken as vehicle drivers. Almost 70% of all travel-to-work trips are taken as vehicle drivers, which is equal to more than 1,070,000 trips. On the contrary, when considering travel-to-education trips, it is shown that vehicle driver trips make up below 7% of the total trips, equating to below 45,000 trips. The travel to education (all levels of education) by vehicle drivers is not as dominant when compared to travel to work, but a greater number of trips can be observed for the vehicle passenger mode. This mode makes up nearly 55% of all travel-to-education trips. This could be due to several reasons, such as carpooling or being dropped off by a parent. For this study, only the trips recorded for vehicle drivers are to be considered, as aforementioned. Amongst travel to work and education, there is a total of more than 1,100,000 car driver trips. As there is such a large number of trips being taken by vehicle drivers, it is suitable to continue investigating the potential of EVs in replacing these trips.

3.2. Potential of EVs in Replacing Car Travel to Work and Education

Figure 1 illustrates the distribution of driving distances to work and education in Greater Melbourne. Most of the trips are between 0 and 50 km, with a small number of trips being greater than 50 km. There was a total of 97.1% travel-to-work trips and 96.9% travel-to-education trips that were between 0 and 50 km. For both travel to work and education, the trip range of 5–10 km has the most trips recorded, representing 23.1% of the trips to education and 20.7% of the trips to work. It can be observed that there is an increase in trips from the 0–5 km range to the 5–10 km range, and then there is a steady decline in trips in the greater ranges. Both travel to work and education follow similar distributions of driving distances.
Figure 2 shows the percentages of car driver trips to work and education that can be fully replaced by EVs with different AERs. A high percentage of trips between travel to work and education can be replaced by EVs, even those with low AERs. For an AER of 40 km, there are 68.5% of trips to work and 71.9% of trips to education that can be replaced by EVs. As the AER range increases, the percentage of trips that can be replaced by EVs also increases. It is evident that about 95% of travel to work and education trips can be replaced by EVs with an AER of 90 km. This suggests the significant potential of full EVs or BEVs for travelling to work and education.

3.3. Impacts of EVs on Replacing Car Travel to Work and Education

Table 2 summarises the impacts of EVs on replacing car travel to work and education in Greater Melbourne. The reduction in CO2 and savings from the cost of operation of EVs are the two main benefits of switching to EVs. Regarding car travel to work, EVs with an AER of 40 km can replace 14.5 million kilometres of car travel, which consumes 3.3 GWh, and equates to a CO2 reduction of 262 tons and operating cost savings of AUD 1.45 million per day. As the AER increases, the benefits from EVs tend to increase linearly. With an AER of 100 km, 32.6 million kilometres of car travel to work can be replaced by EVs, consuming 7.3 GWh, and leading to a reduction of 587 tons of CO2 and operating cost savings of AUD 3.2 million per day. Taking into account the number of commuters who drove to work and could switch to EVs, the average operating cost savings are AUD 1.97 per person per day and AUD 3.12 per person per day for AERs of 40 km and 100 km, respectively.
The impacts of EVs on replacing car travel to education are significantly lower compared to travel to work, due to the shorter car distance travelled that can be replaced. When the AER is 40 km, EVs would replace nearly 0.6 million kilometres of car travel to education, consuming 0.13 GWh, and reducing the CO2 by 10 tons and operating costs by AUD 0.05 million per day. When the AER reaches 100 km, these figures would be approximately doubled. Considering the number of travellers who drove to education and could switch to EVs, the average operating cost savings are AUD 1.77 per person per day and AUD 2.79 per person per day for AERs of 40 km and 100 km, respectively.
Overall, across all the AERs, there are substantial CO2 reductions and operational cost savings, especially for travel to work. Travel to work does offer more benefits, as there are more trips recorded and, thus, more kilometres travelled compared to travel to education, regarding vehicle driver mode. Incorporating both travel to work and education, EVs could replace up to 33.8 million kilometres of car travel, which equates to an electricity demand of around 7.6 GWh, a CO2 reduction of about 610 tons, and an operating cost saving of approximately AUD 3.4 million per any given weekday.

3.4. Spatial Analysis

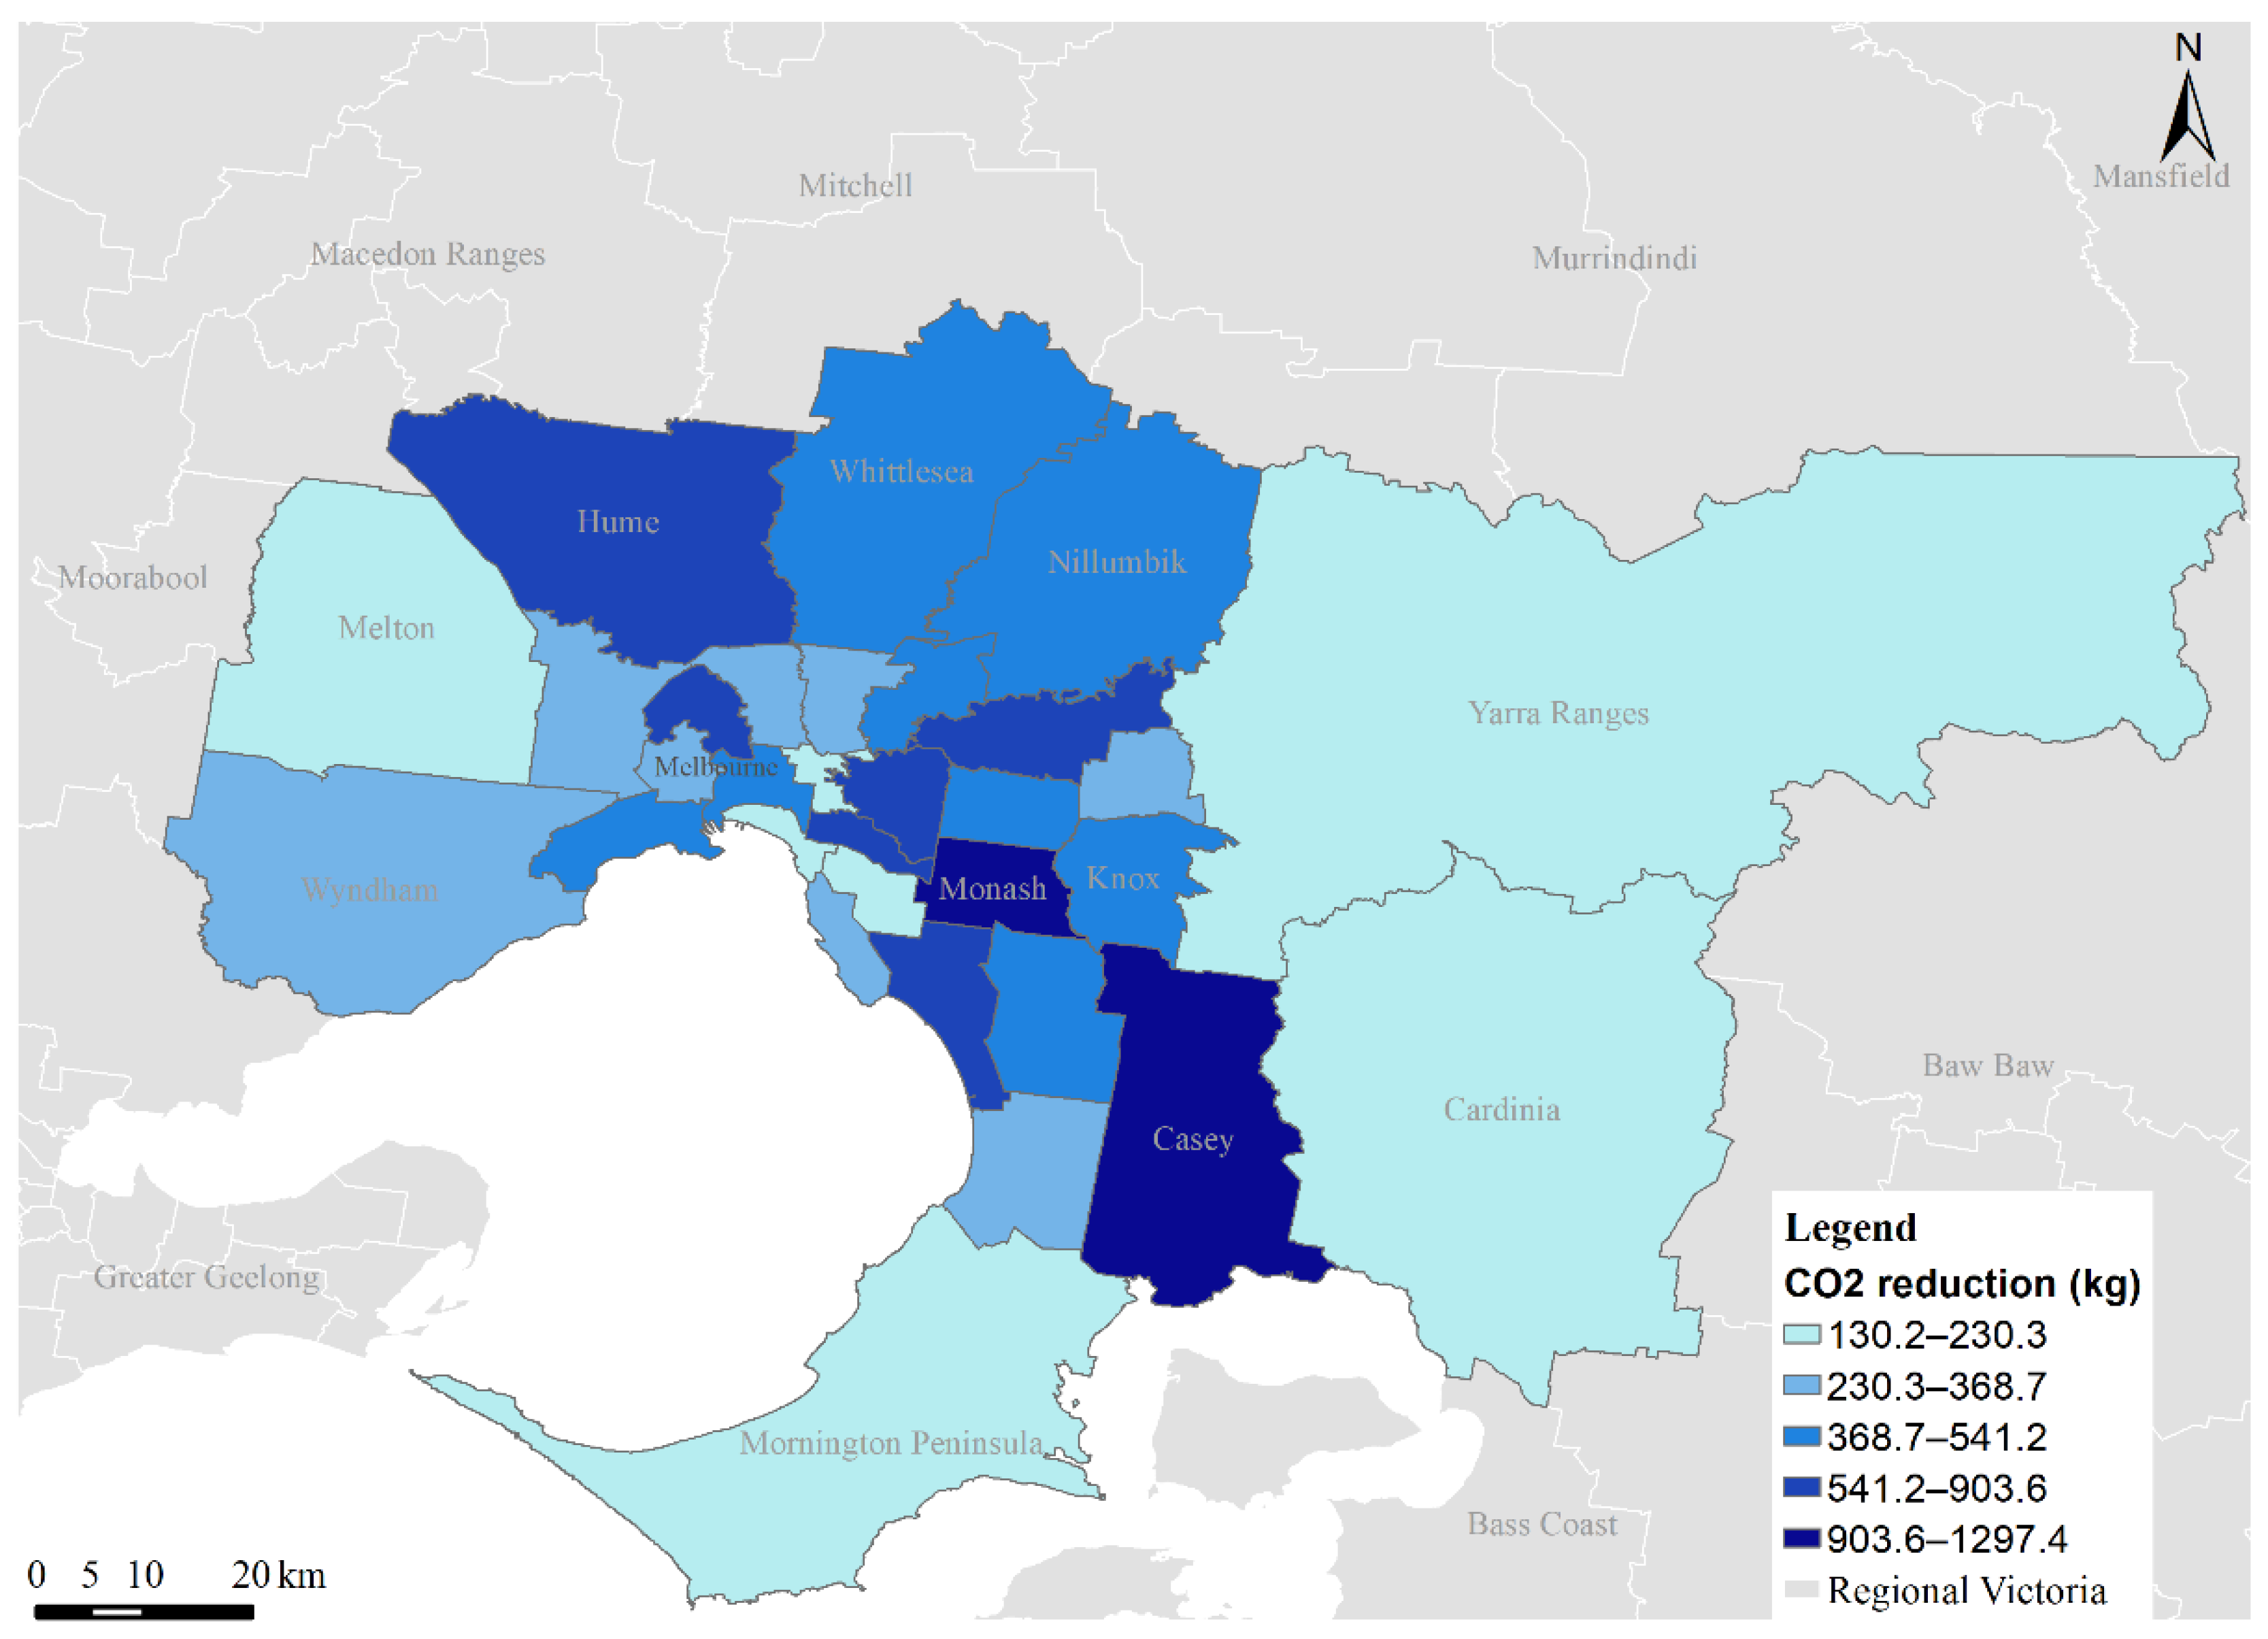
Figure 3 and Figure 4 show heatmaps of the CO2 reductions by LGAs in Greater Melbourne, from EVs replacing car driver trips for travel to work and education, respectively. A typical AER of 50 km is selected for demonstration, since the patterns are similar for other AERs. For travel to education, there are more CO2 reductions in the middle LGAs, especially in the southeast, whereas, for travel to work, greater CO2 reductions come from the outer LGAs. Figure 4 shows that Casey would have the highest reduction in CO2 from EVs replacing car travel to education, followed by Monash. Figure 3 shows a similar result, with Casey having the greatest amount of CO2 reduction from EVs replacing car travel to work. This is then followed by Whittlesea. Comparing both heatmaps, Casey would have the highest reduction in CO2 when EVs are used for travel to work and education.

4. Discussion and Conclusions

This paper has investigated the potential use of EVs in Melbourne using VISTA 2012–2018 data. The results showed that EVs, even with an AER as low as 40 km, would be able to replace most car travel to work and education. It was estimated that the proportion of car travel to work that can be replaced by EVs increases from 68.5% to 97.1% when the AER increases from 40 km to 100 km. Similarly, the proportion of car travel to education that can be replaced by EVs increases from 71.9% to 96.9% when the AER varies between 40 km and 100 km.
With the replacement of the current car travel to work and education with EVs, the benefits to both the environment and users were evident in the results of the paper. The CO2 reductions from EVs replacing both car travel to work and education are substantial. Regarding travel to work, as the AER increases from 40 km to 100 km, the reduction in CO2 emissions rises from 262 tons to 587 tons per day. Regarding travel to education, the reduction in CO2 emissions increases from 10 tons to 22 tons per day. Together, the reduction in CO2 emissions would be up to almost 610 tons per day, which equates to approximately 0.2 million tons per year. Considering that the transport sector produces roughly 22.3 million tons of carbon dioxide (CO2) per year [2], the overall potential CO2 reduction would be approximately 1%. However, it is worth noting that only 21.2% of electricity generation in Victoria is from renewable sources [33]. Thus, the environmental impact would be enlarged if EVs are charged from electricity with renewable sources, such as solar panels. Many houses throughout Victoria make use of solar panels that are installed on the roofs of homes. An online survey, involving more than 1000 people, recorded that 30% of the participants have solar panels installed, and 65% have intentions of installing them [34]. There are government incentives that are currently in place to help Victorians get solar panels installed on their homes. The average annual consumption of a consumer in Victoria is 3865 kWh per year [32]. Thus, a modern solar panel system should be able to cover daily household consumption needs with the extra demand of charging an EV. The use of EVs and renewable energy in combination would lead to a larger reduction in the amount of CO2 entering the atmosphere.
On average, it was estimated that the operating cost saving per commuter increased from AUD 1.97 to AUD 3.12 each day when the AERs increased from 40 km to 100 km. In addition, the saving per person while travelling to education would increase from AUD 1.77 to AUD 2.79 each day when the AER increased from 40 km to 100 km. These are significant cost savings, which could be improved with more efficient EVs and lower electricity prices (especially with renewable sources, such as households’ solar panels). The results also suggested that using EVs for travel to work and education would significantly affect electricity demand. It was estimated that EVs would require up to 7.6 GWh each day for charging, which is approximately 5–6% of the current electricity generation in Victoria [33]. Therefore, adequate EV charging infrastructure would need to be developed in places such as work and educational facilities, to assist in charging events that are performed away from home. This would also be facilitated by utilising renewable energy, such as solar panels, to charge EVs at home.
In summary, this paper has shown that EVs have the ability to replace the majority of car travel to work and education, while benefitting the environment and users in Greater Melbourne, Victoria. While most model parameters were assumed using current data, it should be acknowledged that the benefits would be larger in the future, given the improved charging efficiency and reduced energy consumption of EVs, and potentially lower indirect emissions from electricity generation in Victoria. Similarly, if EVs can charge at stations, at work, or at school, in addition to charging at home, there would be more benefits. A limitation of this paper was that the potential congestion effects of replacing conventional car travel by EVs, offsetting environmental impacts, were not considered. Another limitation is that the analysis considered car travel to education as drivers, which represented a small proportion of all educational car travel. Thus, the potential of EVs for overall car travel to education, including driver and passenger trips, should be further explored in future research. Since this paper only focused on the two main types of essential travel, future research should further explore the potential of EVs for replacing overall daily car travel, not just travel to work and education, considering the total car distance travelled each day. The proposed approach was built on observed daily travel patterns, which can be extracted from household travel survey data that are readily available in many cities and regions, to estimate the driving distance that can potentially be replaced by EVs. The emission and cost analyses were based on emission, energy consumption, and operating cost rates, without complex activity-based modelling. As such, the proposed approach in this paper can also be applied to other cities and regions to explore the potential benefits of EVs.

Author Contributions

Conceptualisation, M.G. and L.T.T.; methodology, M.G. and L.T.T.; validation, L.T.T.; formal analysis, M.G. and L.T.T.; writing—original draft preparation, M.G.; writing—review and editing, L.T.T.; visualisation, M.G.; supervision, L.T.T. All authors have read and agreed to the published version of the manuscript.

Funding

This research received no external funding.

Data Availability Statement

The data presented in this study are available on request from the corresponding author.

Acknowledgments

The authors would like to thank Adam Buttigieg for some preliminary investigations.

Conflicts of Interest

The authors declare no conflict of interest.

References

  1. Leach, F.; Kalghatgi, G.; Stone, R.; Miles, P. The scope for improving the efficiency and environmental impact of internal combustion engines. Transp. Eng. 2020, 1, 100005. [Google Scholar] [CrossRef]
  2. DELWP. Zero Emissions Vehicles: Part of Our Transition to a Net Zero Emissions Economy; Department of Environment, Land, Water and Planning: Melbourne, Australia, 2020. [Google Scholar]
  3. Fiori, C.; Ahn, K.; Rakha, H.A. Power-based electric vehicle energy consumption model: Model development and validation. Appl. Energy 2016, 168, 257–268. [Google Scholar] [CrossRef]
  4. DELWP. Victoria’s Zero Emissions Vehicle Roadmap; Department of Environment, Land, Water and Planning: Melbourne, Australia, 2021. [Google Scholar]
  5. Khan, M.; Kockelman, K.M. Predicting the market potential of plug-in electric vehicles using multiday GPS data. Energy Policy 2012, 46, 225–233. [Google Scholar] [CrossRef] [Green Version]
  6. Ustun, T.S.; Zayegh, A.; Ozansoy, C. Electric vehicle potential in Australia: Its impact on smartgrids. IEEE Ind. Electron. Mag. 2013, 7, 15–25. [Google Scholar] [CrossRef]
  7. Breetz, H.L.; Salon, D. Do electric vehicles need subsidies? Ownership costs for conventional, hybrid, and electric vehicles in 14 U.S. cities. Energy Policy 2018, 120, 238–249. [Google Scholar] [CrossRef]
  8. Li, Y.; Chang, Y. Road transport electrification and energy security in the Association of Southeast Asian Nations: Quantitative analysis and policy implications. Energy Policy 2019, 129, 805–815. [Google Scholar] [CrossRef]
  9. Gardner, J.; Quezada, G.; Paevere, P. Social Study on Attitudes, Drivers and Barriers to the Uptake of Electric Vehicles; Commonwealth Scientific and Industrial Research Organisation (CSIRO): Clayton South, Australia, 2011. [Google Scholar]
  10. Matthews, L.; Lynes, J.; Riemer, M.; Del Matto, T.; Cloet, N. Do we have a car for you? Encouraging the uptake of electric vehicles at point of sale. Energy Policy 2017, 100, 79–88. [Google Scholar] [CrossRef]
  11. Patil, M.; Majumdar, B.B.; Sahu, P.K.; Truong, L.T. Evaluation of Prospective Users’ Choice Decision toward Electric Two-Wheelers Using a Stated Preference Survey: An Indian Perspective. Sustainability 2021, 13, 3035. [Google Scholar] [CrossRef]
  12. Nicholson, A. Intelligent Transportation Engineering: What is Needed? In Proceedings of the IPENZ Transportation Group 2018 Conference, Queenstown, New Zealand, 21–23 March 2018. [Google Scholar]
  13. Rorke, J.; Inbakaran, C. Potential Early Adopters of Electric Vehicles in Victoria. In Proceedings of the 32nd Australasian Transport Research Forum (ATRF), Auckland, New Zealand, 29 September–1 October 2009. [Google Scholar]
  14. Taylor, M.A.; Pudney, P.; Zito, R.; Holyoak, N.; Albrecht, A.; Raicu, R. Planning for Electric Vehicles in Australia—Can We Match Environmental Requirements, Technology and Travel Demands; World Transport Research Society: Montréal, QC, Canada, 2009. [Google Scholar]
  15. Un-Noor, F.; Padmanaban, S.; Mihet-Popa, L.; Mollah, M.N.; Hossain, E. A comprehensive study of key electric vehicle (EV) components, technologies, challenges, impacts, and future direction of development. Energies 2017, 10, 1217. [Google Scholar] [CrossRef] [Green Version]
  16. Falahi, M.; Chou, H.-M.; Ehsani, M.; Xie, L.; Butler-Purry, K.L. Potential power quality benefits of electric vehicles. IEEE Trans. Sustain. Energy 2013, 4, 1016–1023. [Google Scholar]
  17. Yong, J.Y.; Ramachandaramurthy, V.K.; Tan, K.M.; Mithulananthan, N. A review on the state-of-the-art technologies of electric vehicle, its impacts and prospects. Renew. Sustain. Energy Rev. 2015, 49, 365–385. [Google Scholar] [CrossRef]
  18. Khoo, Y.B.; Wang, C.-H.; Paevere, P.; Higgins, A. Statistical modeling of Electric Vehicle electricity consumption in the Victorian EV Trial, Australia. Transp. Res. Part. D Transp. Environ. 2014, 32, 263–277. [Google Scholar] [CrossRef]
  19. Paevere, P.; Higgins, A.; Ren, Z.; Horn, M.; Grozev, G.; McNamara, C. Spatio-temporal modelling of electric vehicle charging demand and impacts on peak household electrical load. Sustain. Sci. 2014, 9, 61–76. [Google Scholar] [CrossRef]
  20. Yusaf, T.; Goh, S.; Borserio, J. Potential of renewable energy alternatives in Australia. Renew. Sustain. Energy Rev. 2011, 15, 2214–2221. [Google Scholar] [CrossRef]
  21. Li, H.X.; Edwards, D.J.; Hosseini, M.R.; Costin, G.P. A review on renewable energy transition in Australia: An updated depiction. J. Clean. Prod. 2020, 242, 118475. [Google Scholar] [CrossRef]
  22. Daina, N.; Sivakumar, A.; Polak, J.W. Modelling electric vehicles use: A survey on the methods. Renew. Sustain. Energy Rev. 2017, 68, 447–460. [Google Scholar] [CrossRef] [Green Version]
  23. Björnsson, L.-H.; Karlsson, S. Plug-in hybrid electric vehicles: How individual movement patterns affect battery requirements, the potential to replace conventional fuels, and economic viability. Appl. Energy 2015, 143, 336–347. [Google Scholar] [CrossRef] [Green Version]
  24. Kang, J.E.; Recker, W.W. An activity-based assessment of the potential impacts of plug-in hybrid electric vehicles on energy and emissions using 1-day travel data. Transp. Res. Part. D Transp. Environ. 2009, 14, 541–556. [Google Scholar] [CrossRef]
  25. Rafique, S.; Town, G.E. Potential for electric vehicle adoption in Australia. Int. J. Sustain. Transp. 2019, 13, 245–254. [Google Scholar] [CrossRef]
  26. Truong, L.T.; De Gruyter, C.; Currie, G.; Delbosc, A. Estimating the trip generation impacts of autonomous vehicles on car travel in Victoria, Australia. Transportation 2017, 44, 1279–1292. [Google Scholar] [CrossRef]
  27. ABS. Survey of Motor Vehicle Use, Australia; Australian Bureau of Statistics: Canberra, Australia, 2020. [Google Scholar]
  28. EV Database. Compare Electric Vehicles. Available online: https://ev-database.org/ (accessed on 20 July 2021).
  29. Sears, J.; Roberts, D.; Glitman, K. A comparison of electric vehicle Level 1 and Level 2 charging efficiency. In Proceedings of the 2014 IEEE Conference on Technologies for Sustainability (SusTech), Portland, OR, USA, 24–26 July 2014; pp. 255–258. [Google Scholar]
  30. ATAP. Australian Transport Assessment and Planning Guidelines. Available online: https://www.atap.gov.au/ (accessed on 20 July 2021).
  31. DEE. National Greenhouse Accounts Factors; Department of the Environment and Energy: Canberra, Australia, 2017. [Google Scholar]
  32. AEMC. Residential Electricity Price Trends 2020; Australian Energy Market Commission: Sydney, Australia, 2020. [Google Scholar]
  33. DISER. Australian Energy Statistics: Australian Electricity Generation, by Fuel Type, Physical Units; Department of the Industry, Science, Energy and Resources: Canberra, Australia, 2020. [Google Scholar]
  34. Zander, K.K. Unrealised opportunities for residential solar panels in Australia. Energy Policy 2020, 142, 111508. [Google Scholar] [CrossRef]
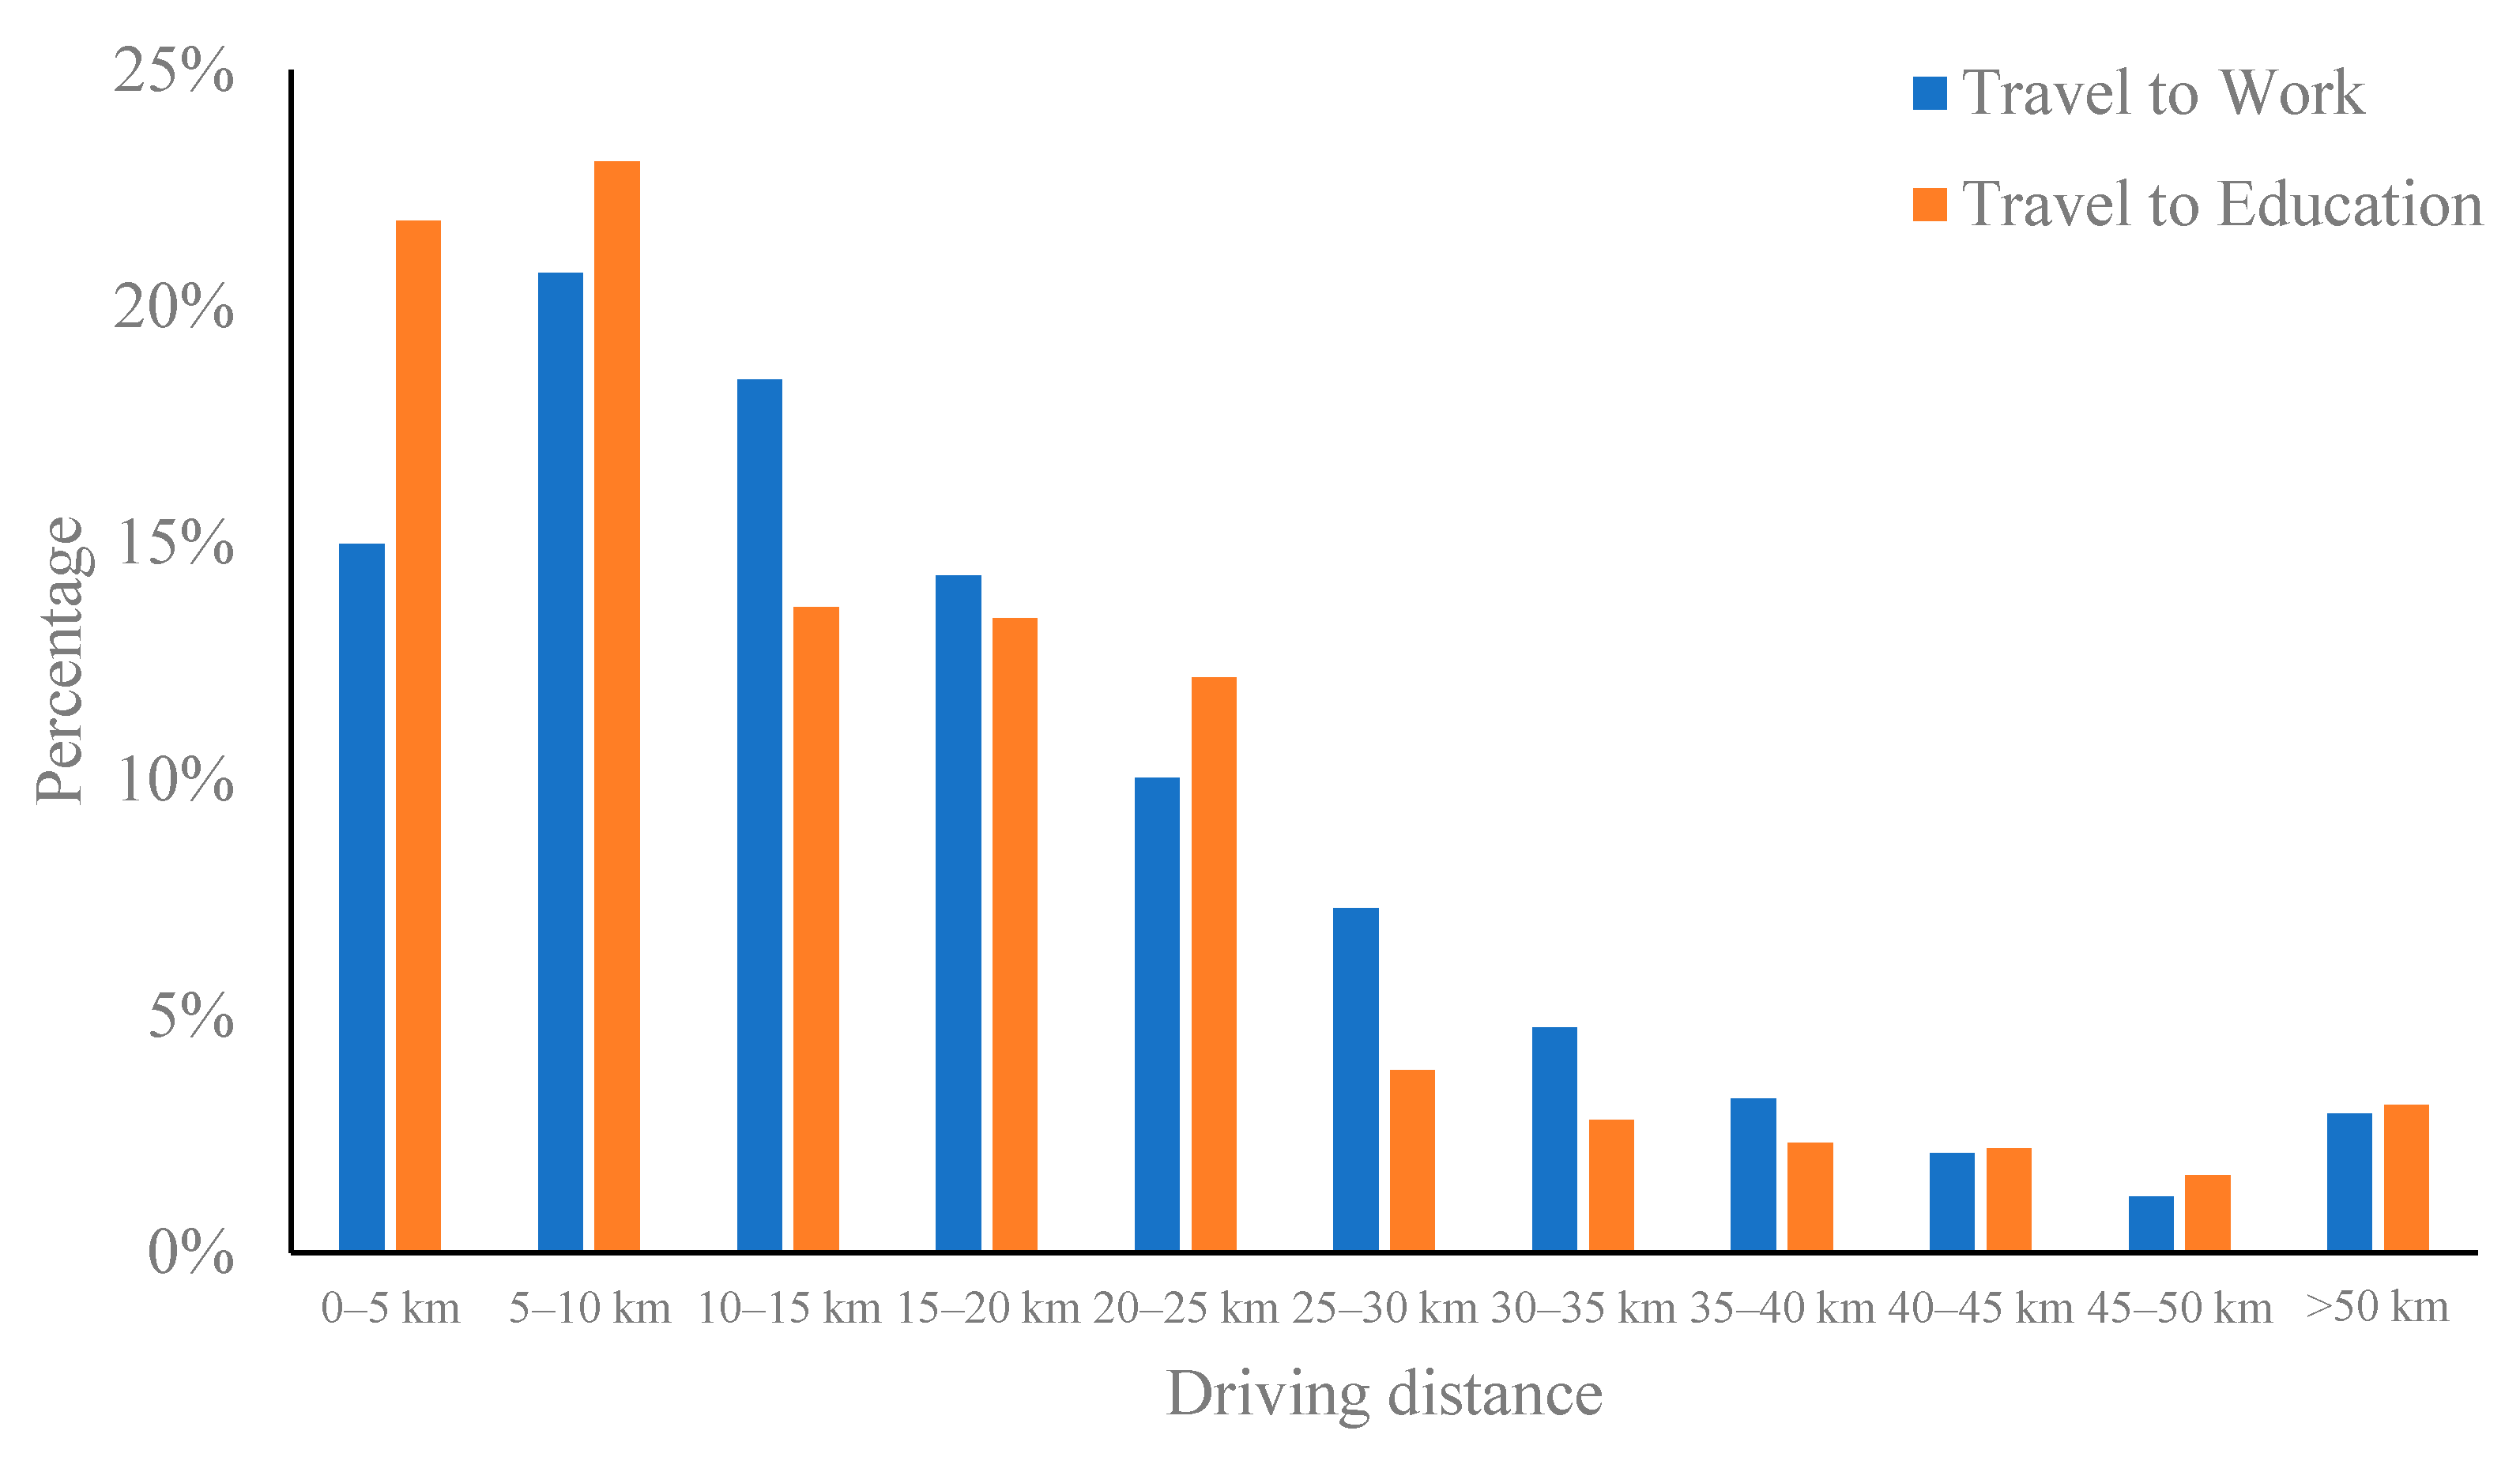
Figure 1. Distribution of car travel distance to work and education (weekday).
Futuretransp 01 00040 g001
Figure 2. Proportion of car travel to work and education that can be replaced by EVs with different AERs (weekday).
Futuretransp 01 00040 g002
Figure 3. CO2 emission reductions from replacing car travel to work with EVs in LGAs (AER 50 km).
Futuretransp 01 00040 g003
Figure 4. CO2 emission reductions from replacing car travel to education with EVs in LGAs (AER 50 km).
Futuretransp 01 00040 g004
Table 1. Travel to work and education trips by mode (weekday).
Travel ModeTravel to WorkTravel to Education
n%n%
Cycling41,1172.7%19,9112.9%
Walking41,8912.7%105,08115.5%
Train232,35415.1%59,0488.7%
Tram51,8053.4%16,9922.5%
Bus21,1481.4%56,9588.4%
Vehicle Driver1,070,71669.7%44,7036.6%
Vehicle Passenger65,9344.3%371,24254.9%
Other12,0410.8%27140.4%
Total1,537,005 676,650
Table 2. Emission, operating cost, and energy impacts of EVs on replacing car travel to work and education (weekday).
All-Electric Range (AER)
40 km50 km60 km70 km80 km90 km100 km
Travel to Work
Distance (km)14,541,69619,349,28523,619,84626,905,93129,514,28331,411,46632,600,441
Energy consumption (kWh)3,266,3674,346,2515,305,5086,043,6316,629,5217,055,6687,322,736
CO2 reduction (kg)261,808348,363425,250484,413531,373565,530586,936
Operating cost saving (AUD)1,445,8661,923,8802,348,4972,675,2302,934,5753,123,2103,241,429
Travel to Education
Distance (km)570,912811,218905,097986,7671,063,5121,145,7501,214,443
Energy consumption (kWh)128,239182,217203,304221,648238,887257,359272,789
CO2 reduction (kg)10,27914,60516,29517,76619,14720,62821,865
Operating cost saving (AUD)56,76580,65989,99398,113105,744113,921120,751
Total
Distance (km)15,112,60720,160,50324,524,94327,892,69830,577,79432,557,21633,814,884
Energy consumption (kWh)3,394,6054,528,4685,508,8126,265,2796,868,4087,313,0277,595,525
CO2 reduction (kg)272,086362,968441,546502,178550,521586,158608,801
Operating cost saving (AUD)1,502,6312,004,5392,438,4902,773,3433,040,3193,237,1313,362,180
Publisher’s Note: MDPI stays neutral with regard to jurisdictional claims in published maps and institutional affiliations.