Abstract
How safe will Automated Vehicles (AVs) be? It depends on technologies, vehicles, other road users, and infrastructures. The only certainty is that automated vehicles will not solve all road safety issues. As the penetration of AVs might be much more sudden than road infrastructure modification, the infrastructure revision process should start immediately by then, and road authorities must be ready in turn. This paper presents an approach based on road safety inspections to quantify and compare the expected safety levels for a road section with different combinations of Automated and Conventional Vehicles (CVs). Developed in the framework of the EC project CoEXist, the proposed approach allows for identifying the possible safety issues that may arise when introducing AVs. All safety issues are judged in terms of risk, which is the product of the exposure, the likelihood of the crash, and the severity of the possible consequences. All these aspects are analyzed in different scenarios considering different AV penetration levels and driving logic. The results show a potential risk decrease according to the higher penetration of AVs. Nevertheless, the analysis highlights that safety issues may arise with the introduction of specific AVs’ driving logics.
1. Introduction
Hitherto, the automobile has been at the center of the social and the economic development of most countries.The benefits the mass market of cars has provided to society are varied and range from industrialization to accessibility to land use. However, the drawbacks are just as numerous, specially regarding the consumption of resources and the environment, as well as road traffic injuries. Road traffic injuries are defined as “fatal or non-fatal injuries incurred as a result of a road traffic crash”. Road traffic injuries are currently recognized as a major public health concern across the world, accounting for mortality and impairments following trauma. The latest estimates from the World Health Association [1] show that about 1.35 million people die as a result of road traffic injuries every year: more than the deadliest natural disaster, which makes road crashes one of the leading causes of health loss. According to WHO data [1], in 2016, road traffic injuries accounted for 2.5% of all global deaths and road traffic injuries are the leading cause of death for children and young adults aged 5–29 years. It is also well-known that more than 90% of crashes are related to driver behavior.
When presenting the potential road safety benefits of vehicle automation most non-expert people tend to make a naïve simplification: today more than 90% of crashes are caused by human errors; if 100% of the vehicles were automated, we would have 90% less crashes. Although worded differently, this sentence has been used many times in different contexts, including being used by then US Secretary of Transportation Anthony Renard Foxx at the annual Automated Vehicle Symposium in 2016 (held in San Francisco on 18–21 July 2016). Even if the introduction of AVs will undoubtedly improve many aspects of road safety, as also proven by some recent research both considering low levels [2] and high levels of automation [3,4], the aforementioned sentence is questionable for several reasons: it does not consider technology mistakes which automated vehicles will make, it does not account for the remarkable human ability to “invent” solutions when under pressure, which considerably limits the number of crashes concerning near misses, and it does not account for any role for infrastructure in causing crashes. Today, the latter often takes place because there is a human (the driver), who always ultimately takes the blame, but this will no longer be possible with automated vehicles. Moreover, it is necessary to investigate how automated vehicles (AVs) will interact with conventional vehicles (CVs) and vulnerable road users, and which will be the road features that will affect road safety in this transition period. The research of Sinha et al. [5] highlights that the safety benefits of AVs are not proportional to AV penetration, and the full-scale benefits of AVs can only be achieved at 100% AV penetration, underscoring that the interaction between AVs and CVs could be a critical issue. The relationship between human drivers and AVs may induce changes in drivers’ behavior [6], which may consequently increase the number of crashes or change the type of expected crashes, as identified by Petrović et al. [7]. In their research, they found that the “rear-end” collision type appears more often in traffic accidents involving AVs and CVs. The topic of the evolution of road safety as a consequence of the introduction of AVs is extremely important and there are many studies nowadays trying to analyze possible future scenarios, both in terms of road infrastructure modifications [8,9,10] and policies and management [11,12]. Nevertheless, the problem of AV safety is not often addressed as a “system” problem but more as a technology issue. No matter how good the technology will be, the system will always play a role. Trying to foresee which will be the main issues for a specific site considering the interaction and coexistence of AVs and CVs may be a key factor in dealing with changing mobility. The coexistence of AVs and CVs (and also between different levels of AVs) is something that must be considered, both because it is not possible to change the entire vehicle fleet in a few days and because some people will prefer to continue using CVs for various reasons, as discussed in the research from Yoo and Managi [13].
This paper responds to this need for identifying possible infrastructure-related issues, quantifying the role of road infrastructures on road traffic crashes, and indicating how it will evolve with differently behaving automated vehicles. The paper introduces in Section 2 the background of the CoEXist project and how it addressed uncertainties in the behavior of future automated vehicles and the background of the Road Safety Inspection practice. The methodology is presented in Section 3 and its application to one use case in Section 4. Section 5 draws the conclusions.
2. Background
2.1. The CoEXist European Project
The European Commission financed CoEXist, a Horizon 2020 project (May 2017–April 2020), intending to prepare for the transition phase during which automated and conventional vehicles will coexist on cities’ roads. It bridges the gap between AV technology, transportation, and infrastructure planning by strengthening the capacities of urban road authorities and cities to plan for the effective deployment of AVs. The mission of CoEXist is to systematically increase the capacity of road authorities and other urban mobility stakeholders to prepare for the transition toward a shared road network with an increasing number of automated vehicles, using the same road network as conventional vehicles. CoEXist aims at enabling mobility stakeholders to become “AV-ready”. CoEXist developed a specific framework and both microscopic and macroscopic traffic models considering the introduction of automated vehicles. The tools developed within the CoEXist framework were tested by road authorities in the four project cities of Helmond (NL), Milton Keynes (UK), Gothenburg (SE), and Stuttgart (DE) to assess the “AV-readiness” of their locally designed use cases. CoEXist developed two safety assessment methods that applied to the same use cases allowed to define the expected impact of AV introduction on road safety. The first approach focuses on the analysis of driving functions. Scenarios that are affected potentially by the respective driving function are identified. Conflict situations that are potentially addressed by each driving function are identified and a qualitative four-level assessment of the impacts of each driving function on road safety is conducted (see [14] for reference). The second approach is here presented, and it is based on the consolidated methodology used for road safety inspections.
2.2. Driving Behavior and Penetration Rates According to CoEXist
Automated vehicles will behave differently from human drivers and differently from each other. These behaviors are also expected to evolve with evolving technology and changing infrastructures. As such, predicting impacts on traffic throughput and safety (just to mention the two most important impacts) requires the definition of possible behaviors. CoEXist defined four behaviors [15] representing the limits of the potential behaviors. On one hand, there is the Rail-Safe behavior (today in use for shuttles and people movers), which defines the driving cycle of the vehicle as a function of the infrastructure characteristics and the presence of other road users and which needs to consider preventively any possible threat to ensure absence of involvement in any crashes unless some major failure occurs. The Cautious behavior does not anticipate and prevent the wrongdoing of other road users, as does the Rail-Safe, but it can never be at fault in any crash as it always provides gaps wide enough for everyone to brake before any collision may occur. On the other hand, there is the Normal behavior, which mimics the human driver, only with improved sensing capabilities; and then there is the All-Knowing, which is even more aggressive than the human and uses minimal gaps under the assumption that either through Artificial Intelligence, or Communication, or both, the automated vehicle always has perfect knowledge of the other vehicles and people’s behavior, which will allow it to exploit the smallest of spaces favorably. Such behaviors are not realistic. They only represent the extremes, either in favor of safety, by reducing performance, or by increasing performance and relying on communication and artificial intelligence for safety.
CoEXist implemented such behaviors in PTV Vissim and VISUM simulation packages (all but the Rail-Safe, for which a much different approach to vehicle decision making was required) and used the updated software to simulate scenarios in the project use cases. The simulated scenarios considered different penetration rates of different automated vehicle driving logics [15]. The purpose of the carried-out road safety inspections was to evaluate how these four different driving logics and the penetration level of vehicles with these logics will affect road safety, considering the current road infrastructure configuration.
2.3. Road Safety Inspections
A road safety inspection (RSI) of the roads in operation should be undertaken to identify road safety-related features and prevent crashes. According to the European Directive on road infrastructure safety management [16], RSI responds to the safety implications of changing conditions on the road network. The road environment is dynamic; it is not fixed over its lifetime. Roadside features are added or removed, materials composing the road deteriorate and are replaced, and new developments are built on the roadside altering access conditions and modifying traffic flows. Changes also occur to our understanding of road safety and road design standards; for example, deepening knowledge of human factors in road design moved safety analysis from the crashed car’s final location backward to the location where the first wrong stimuli from the road environment were provided to the driver, provoking an operational mistake. RSIs allow us to account for these changing dynamics in the relationship between crashes and crash contributing factors. Finally, certain engineering designs that would have been considered safe in the past are no longer conceivable. The inspection is intended to be a fresh, independent visual survey of the road.
The complete RSI process is composed of three different stages [17]. An initial desktop study based on the road traffic crash analysis and data about road and traffic characteristics is necessary, depending on data availability. The second step is the site visit. It is essential to carry out a site visit always considering the point of view of different road users (‘role play’). The primary purpose of the site visit is to identify any environment and traffic deficiencies that may contribute to the risk of road traffic crashes. A final step of data processing follows. During this phase all the information collected is put together, processed, and analyzed to obtain a list of problems and possible dangers that could lead to crashes.
Even when road traffic crash data analysis does not show relevant results, sometimes due to the absence of crashes occurring at that site, it does not mean that the road is safe. The objective of the road safety inspection is specifically to identify those dangerous elements that could lead to crashes, even if they have not occurred before. The RSI method most widely used internationally is the Road Assessment Programme (RAP) [18,19,20,21,22], but different RSI procedures are used worldwide [23,24,25]. RSI normally is concluded by providing recommendations for improvements based on the best international practices and standards.
The RSI procedures assess the infrastructure safety based on driving performance assessments. The introduction of different vehicles with different capacities needs, even more, the RSI procedure to review road infrastructure characteristics and how they will influence road safety at different levels of penetration and with different driving behaviors of AVs.
This paper reports on the procedure developed within CoEXist and how it was used to quantify expected crash risks for different automated vehicle behaviors on existing road infrastructures.
3. Materials and Methods
To evaluate the possible changes in road safety levels derived from the introduction of automated vehicles, a systematic procedure has been followed. The proposed methodology gives a quantitative output of road traffic crash risks for different scenarios, to understand to what extent road safety will be affected by gradually replacing the human driver with automation. Specific issues that could arise with the introduction of AVs will be identified through the application of the methodology. The identification of such issues may help road authorities implement adequate countermeasures to let the road be “automation-ready”. This methodology, based on road safety inspections, follows CoEXist’s scope to further develop validated and recognized road safety evaluation techniques to allow innovative considerations of automated driving effects.
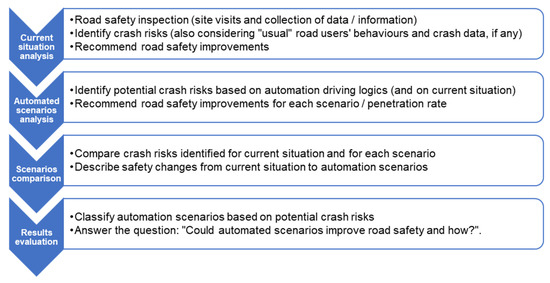
The procedure has been divided into four steps: analysis of the current situation, analysis of the future situation (i.e., with the introduction of AVs), comparison between the different scenarios, and discussions and analysis of the results. Figure 1 describes these four steps, including the main activities performed.
Figure 1.
Steps of the safety assessment inspection-based approach [14].
At first, an RSI of the chosen site must be carried out. The RSI aims to identify the current safety deficiency, how it will be influenced by the introduction of AVs, and finally to understand which deficiencies could arise with the introduction of AVs. Then, the risk for each safety issue identified by the road safety inspection will be calculated for each scenario. After estimating the risk values, a comparison is made between the final risk value of each scenario and that of the current situation of the specific use case by calculating the percentage variation in the risk due to the introduction of automated vehicles. The scenario comparison highlights which scenarios could lead to road safety reductions and thus allows for preventive intervention to avoid safety issues related to that scenario. The risk evaluation and the scenarios’ composition are discussed as follows. The assumption is made that all AV sensors work well and can scan the infrastructure for potential problems. Thus, errors of AVs are not considered, nor faults in the technologies used by AVs. It has been assumed that AVs will have no malfunctions, as they know exactly the right path to follow and they behave following the laws of the road.
3.1. Risk Evaluation
The proposed methodology quantifies the risk of each scenario to compare different scenarios of the same use case. It is important to notice that this quantification derives anyway from a qualitative evaluation; thus, if the differences in the scenarios’ base conditions are strong, the comparison will greatly reduce its effectiveness. For this reason, the comparison has been conducted only between scenarios of the same site and not between the results of different sites. Therefore, the procedure will help to identify the change in road safety of a single site but does not allow for determination of whether a site is riskier than another.
To obtain a quantification of the risk for each scenario, the risk of each maneuver that could lead to a crash has been considered. The estimation of a crash risk [R] for a specific issue can be derived by the combination of three key factors:
- Danger [D]: The likelihood that a crash can happen because of the analyzed road issue.
- Vulnerability [V]: Risk of injury if a crash occurred due to the analyzed road issue.
- Exposure [E]: Amount of road users exposed to the analyzed road issue.
The resulting (general) formula for risk assessment is shown in Equation (1).
R = D × V × E
The risk assessment involves a subjective evaluation of the likely frequency and likely severity of crashes. To reduce to a minimum the subjective judgment of the inspector, the risk assessment process must be carried out systematically. This will produce comparable quantitative risk values for each different issue at a particular site. In order to provide some references to inspectors, the evaluation of the likelihood of a crash occurring (i.e., the frequency with which the hazard will cause or contribute to a crash) can be established using Table 1, in which the values assigned to each likelihood level are indicated.

Table 1.
Assumed numerical values for each level of crash frequency [14].
The severity of a hazard is established based on a subjective assessment of the most likely outcome occurring if the hazard caused or contributed to a crash. Any type of crash has the potential to result in death, so it is important to consider the most typical or realistic outcome rather than the worst possible outcome (because the worst one is always catastrophic). Table 2 can be used to assess the crash severity that a hazard could cause, and it includes the weights that have been assigned to each severity level.
Table 2.
Assumed numerical values for each level of crash severity [14].
Despite the judgments of the inspector being qualitative and that the intervals proposed in Table 1 and Table 2 are defined based on the authors’ experience on a 0–1 level scale, the proposed values are suitable for the purpose of this work, which is to compare how the risk of a specific issue (and a specific use case) may vary by changing the scenarios.
For each issue identified during the road safety inspection, a value of likelihood, a weight of severity, and exposure have been assigned and multiplied to obtain the risk value. It has been assumed, for the purpose of the comparison of different scenarios, that the total number of road users who travel the road (who represent the exposure) is constant. For this reason, if all the road users are exposed to the same issue, the value of the exposure will be 1; otherwise, it will be the percentage (in decimal value) of road users exposed to that specific issue. The sum of the risk values of all problems identified represents the final risk of the analyzed scenario (RS).
where:
final scenario risk value for the scenario “x”;
total number of issues identified in the scenario “x”;
likelihood of a crash occurrence for the issue “i” of scenario “x”;
weight of severity of an occurred crash for the issue “i” of scenario “x”;
ratio between the number of road users exposed to issue “i” of scenario “x”; and the total number of users considered as the reference for the analyzed site (exposure).
All these values may change in different scenarios, because three different conditions may arise:
- an issue found in the current scenario (without AVs) will still be a problem for AVs also, but the likelihood of a crash and the weight of severity may change;
- an issue present in the current scenario may not be a problem for AVs but will continue to be a problem for CVs, so that exposure and likelihood of a crash may change;
- new issues may arise due to the introduction of AVs.
3.2. Automated Vehicles Scenarios
The RSI allows for identifying the issues of the current scenario (i.e., with no AVs). Starting from those issues, the inspectors must foresee which other issues may arise with the introduction of AVs and how the current issues will be modified. This has been conducted considering the AVs’ driving logic and penetration level in each scenario identified in the CoEXist project. In PTV Vissim and VISUM simulations, the Rail-Safe behavior has not been directly considered; thus, it has not been included in the methodology. Moreover, some assumptions have been made while considering the behavioral aspects of different AVs’ driving logics and their influence on CVs. These assumptions have been summarized in Table 3.
Table 3.
Assumptions for different behavior between AVs of different driving logic and CVs.
The assumptions made underline the importance of considering the behavior of all the vehicles which can potentially be involved in a crash, even more so because the goal of the research is to understand the influence on road safety by the introduction of AVs at different penetration rates. During this process, CVs and AVs must coexist. Consequently, when assessing whether a maneuver is risky both for an AV and a CV, both the main vehicle, i.e., the “acting” vehicle, and the second vehicle (or vehicles), which is (are) the “reacting” vehicle(s), must be considered. To clarify this concept, an example is provided. In the example, a sudden lane change maneuver is considered. A sudden lane change maneuver may occur close to an intersection and can be due to the distraction of the driver who realizes too late the need to change lanes or because of high traffic on the adjacent lane that forces the driver to wait until the last moment to move. Such a maneuver can lead to abrupt braking by other drivers approaching the junction and can cause a rear-end or lateral collision. In this example, the risky maneuver will not be taken by the AV; however, in mixed traffic conditions, it can be possible that a human driver decides to make the maneuver, and then it must be considered how the other vehicles will react, whether they are AVs or CVs. In this specific example, a slow Cautious vehicle may increase the likelihood of the driver deciding to make the risky maneuver (the driver assumes that the AV will automatically reduce the speed or stop). If the driver decides to move suddenly in front of the approaching Cautious AV, because of the new reduced distance between the two vehicles, the Cautious AV suddenly brakes. Assuming that the AV is followed by another CV, driving very closely because of the low speed of the AV, a rear-end collision may occur. The example highlights that the possible consequence of a risky maneuver must be considered for each combination of acting and reacting road users. Each scenario is a combination of different mixes of AVs and CVs, driving logics, and penetration rates. The traffic distribution for each scenario is the one considered in the CoEXist project [14] and represents the different penetration rates of the AVs for a given road facility. Table 4 provides an example of the scenarios considered for Use Case 3, which represent an intersection of an urban arterial. The percentage in the AV driving logic column indicates the rate between the number of AVs with that driving logic and the total number of AVs (not CVs). The three types of driving logics presented in Table 3 are distributed within the different scenarios based on the AV’s penetration rate and technologies advance at different stages (it can be assumed that the greater the scenario, the further in the future it takes place). Considering the example of Use Case 3 (Table 4), in each scenario a maximum of two different driving logics have been considered, with the following composition:
Table 4.
Scenarios of Use Case 3, DL = driving logic.
- -
- Cautious and Normal driving logics;
- -
- Normal and All-knowing driving logics;
- -
- only All-knowing driving logic.
4. Application of the Methodology to Use Case 3
The results obtained by applying the described methodology to Use Case 3 of the Co-EXist project are presented and the summary of the identified risky maneuvers and their evaluation are provided. More information can be found in the CoEXist deliverable 4.3 [26], where the results of Use Case 1 and Use Case 4 are also available (Use Case 2 was not analyzed with this procedure). Use Case 1 consists of an area with shared space characteristics in connection to Kungstorget in central Gothenburg. In Use Case 1, additional efforts were made to assess the interaction between AVs, CVs, and vulnerable road users, such as pedestrians and cyclists. Use Case 4 focuses on the evaluation of the impact of automated vehicles on the transitional road section from the interurban highway between Eindhoven and Helmond to the arterial road that enters Helmond.
4.1. Use Case Description
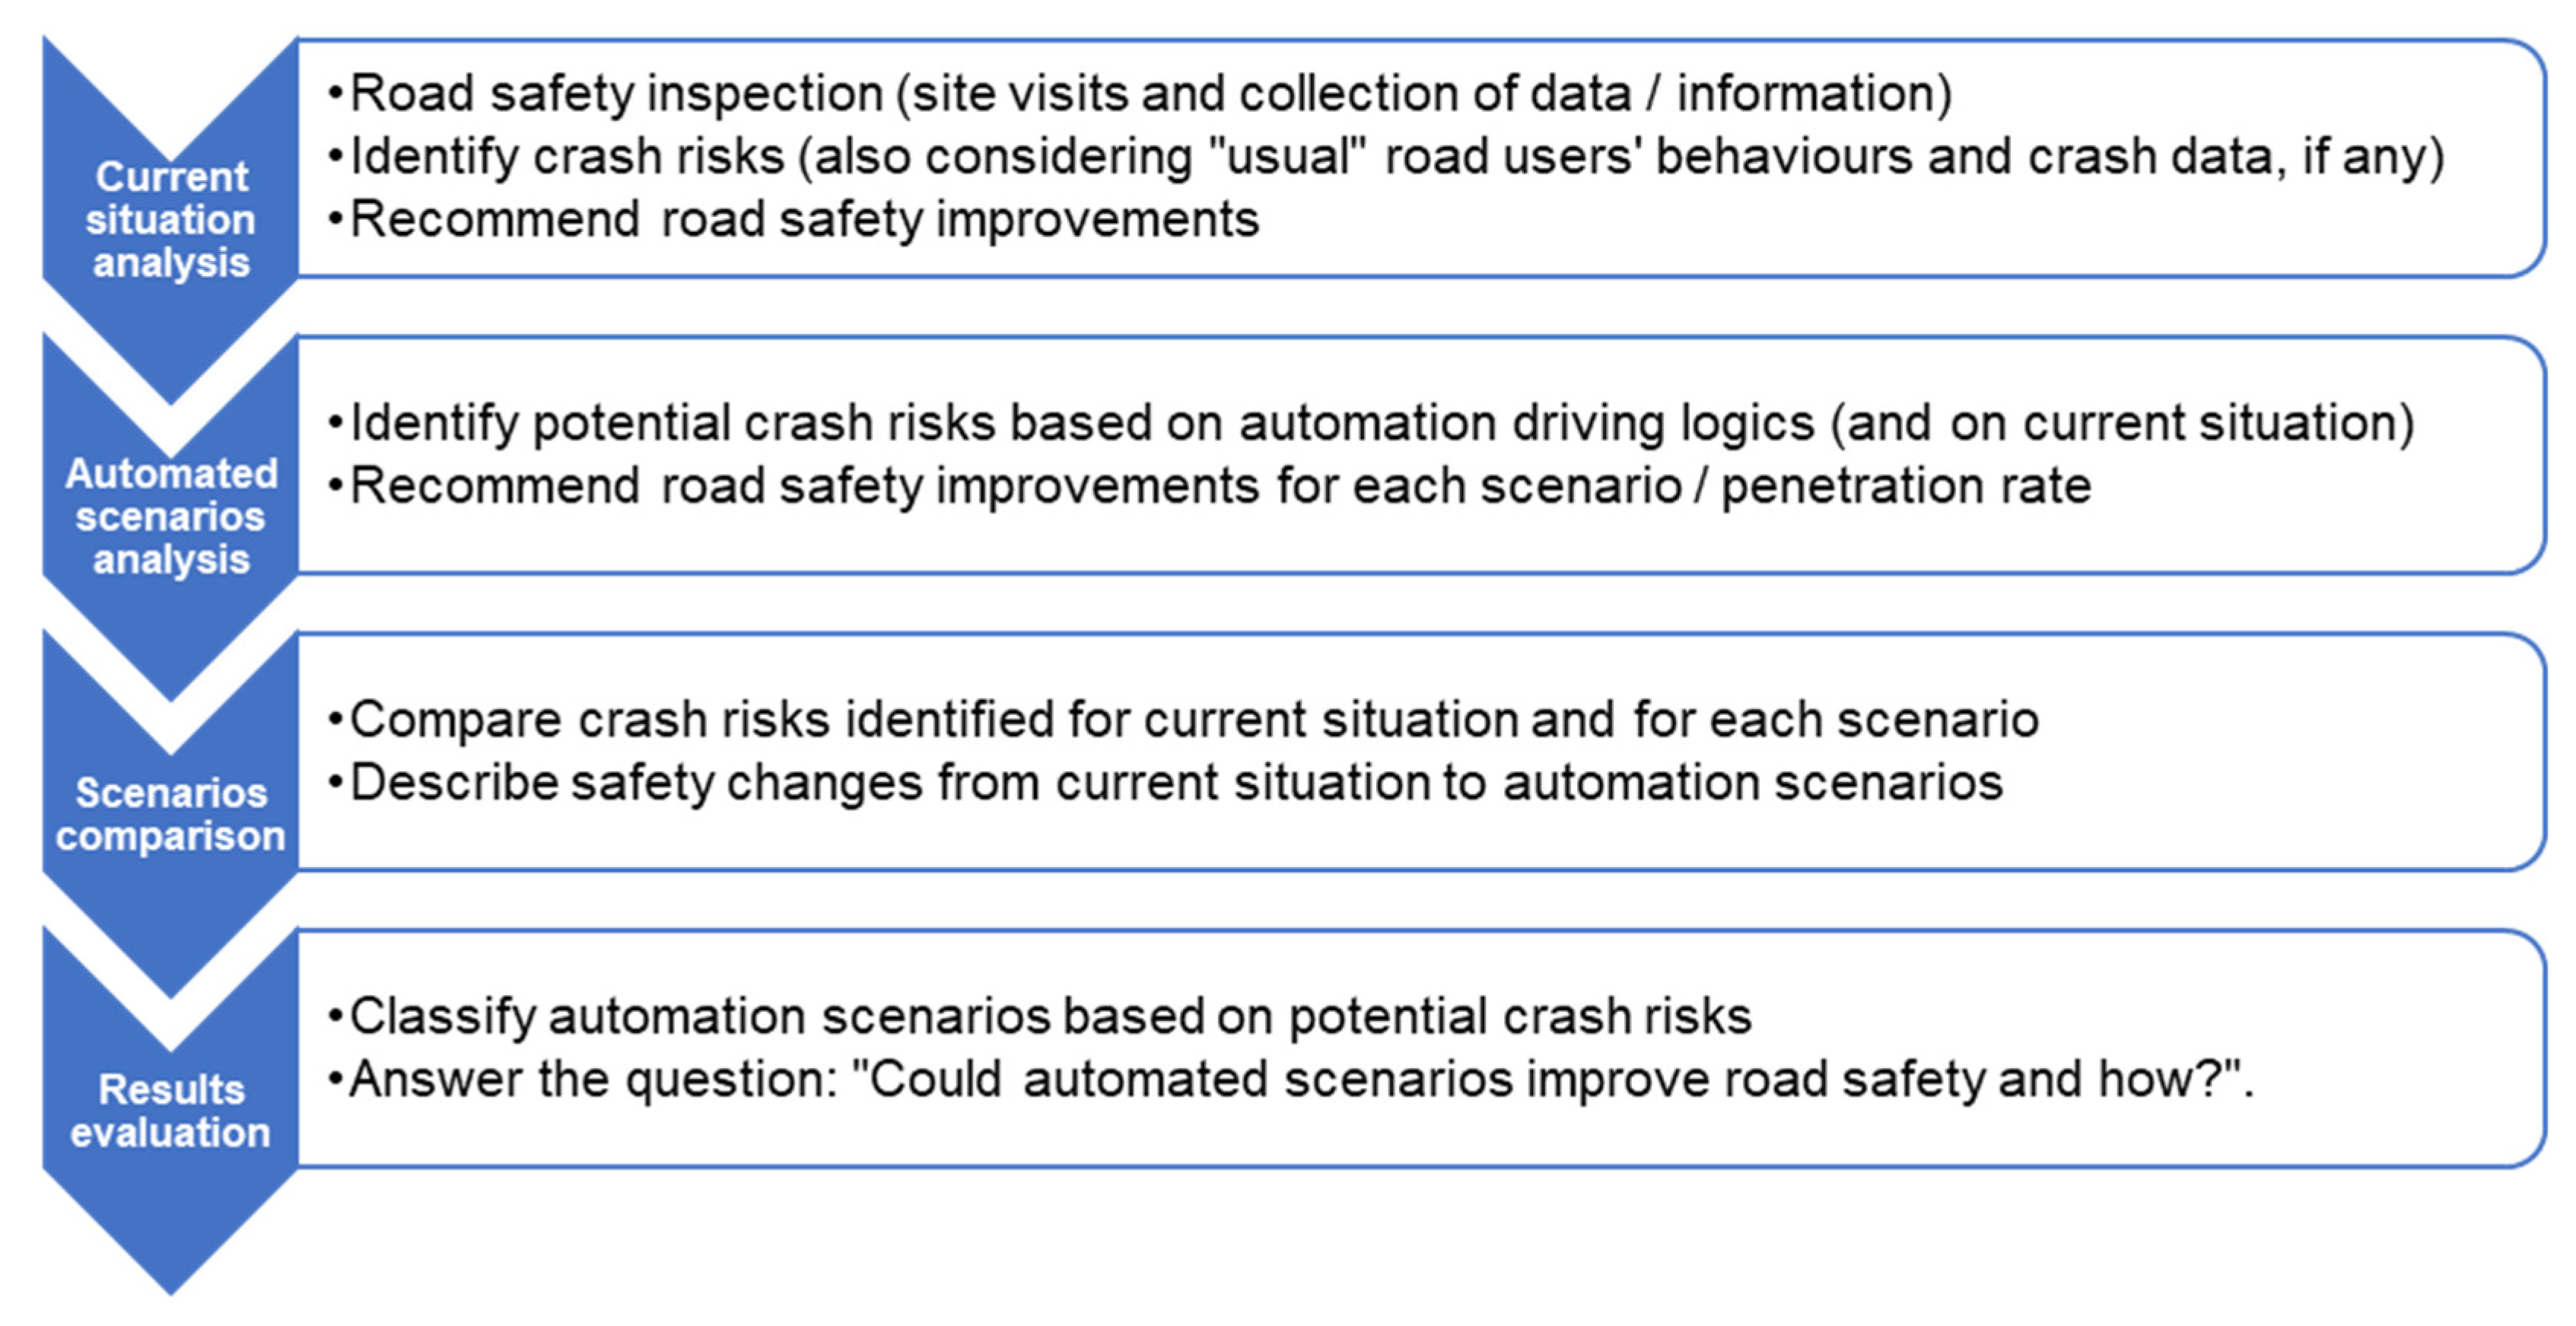
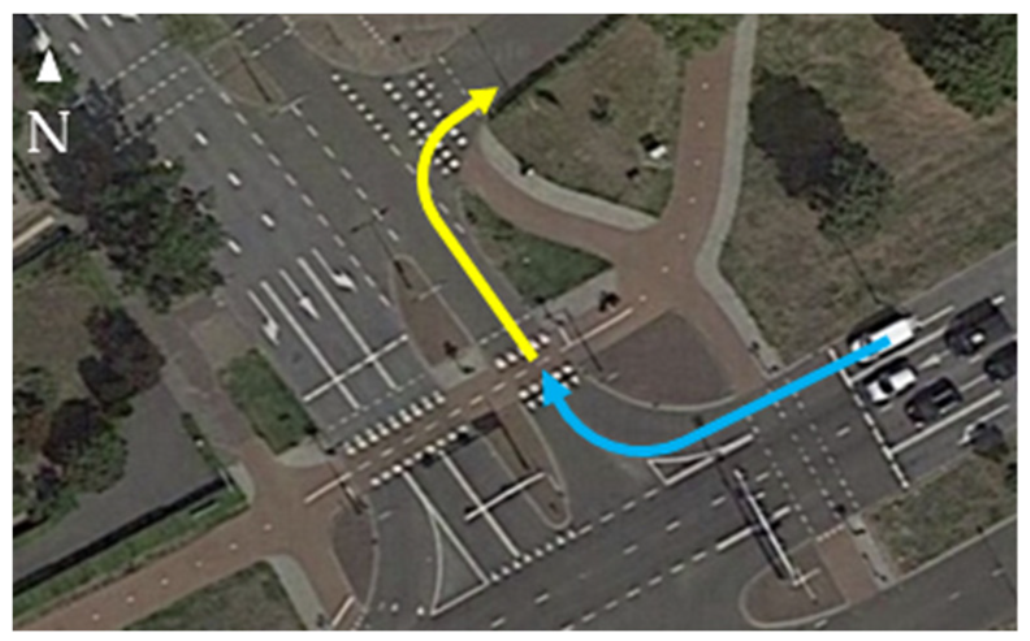
Use Case 3 consists of a signalized intersection with pedestrians and cyclists’ reserved paths, as represented in Figure 2. This intersection is located on an important arterial (N270) that runs through the city of Helmond, Netherland, from east to west and vice versa. In addition, it is located on the west side of the city, and it is one of the first at-grade intersections in the eastbound direction where pedestrians and cyclists can cross the road. The road is classified as an urban road and there are houses and commercial activities around the intersection. The conflicts between vehicles and vulnerable road users at the intersection are controlled by traffic signals and, since pedestrians have a green phase exclusively dedicated to them, there are no secondary conflicts between vehicles and vulnerable road users, whereas the maneuvers required to get access to the surrounding areas are not regulated by signals. No crashes have been recorded at the intersection during the period 2015–2019. The percentage of AVs in future scenarios has been considered equally distributed in all directions.
Figure 2.
The analyzed intersection in Helmond (source: Google Earth–Immagini © 2022, Aerodata International Surveys, GeoContent, Maxar Technologies, Dati cartografici © 2022).
4.2. Safety Issues Identified
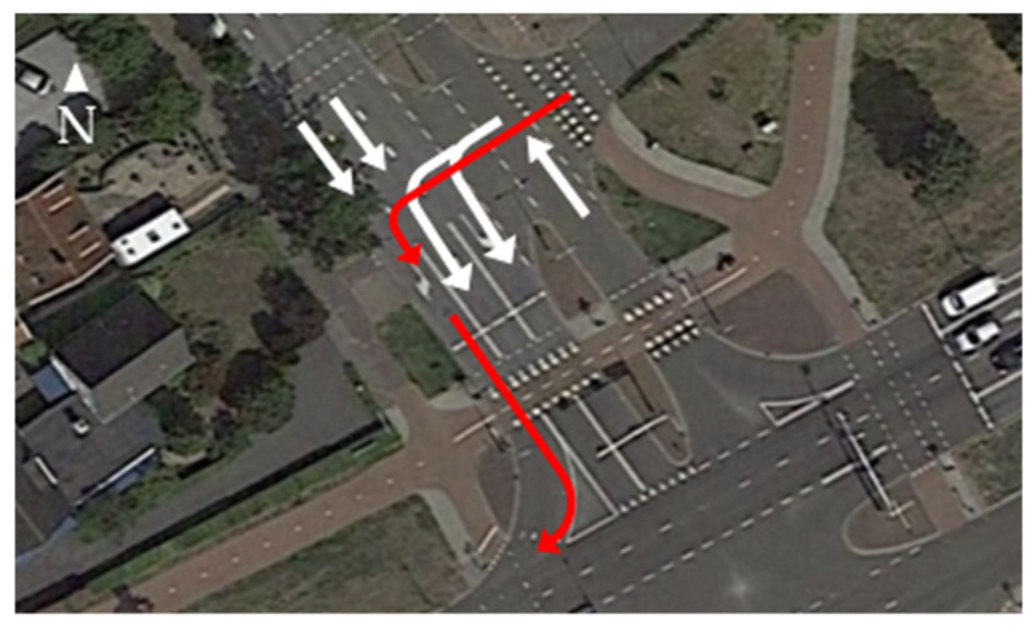
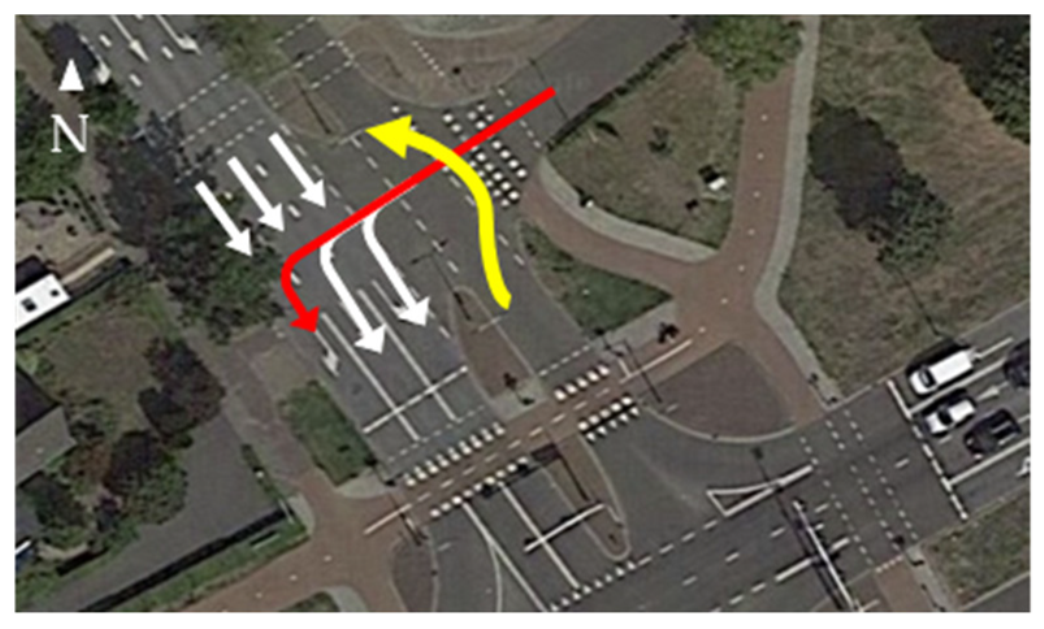
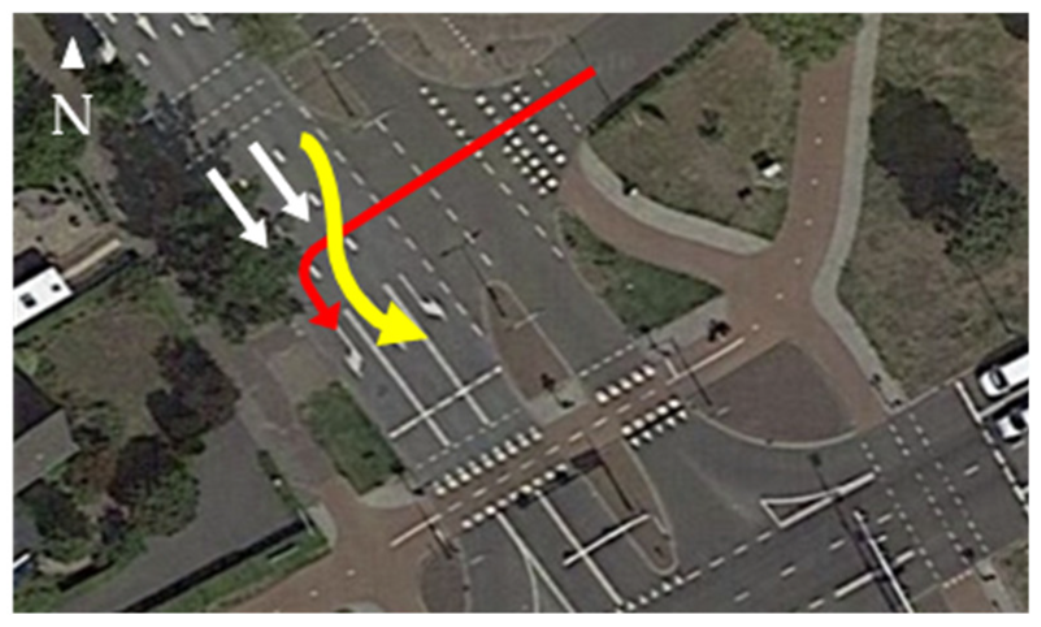
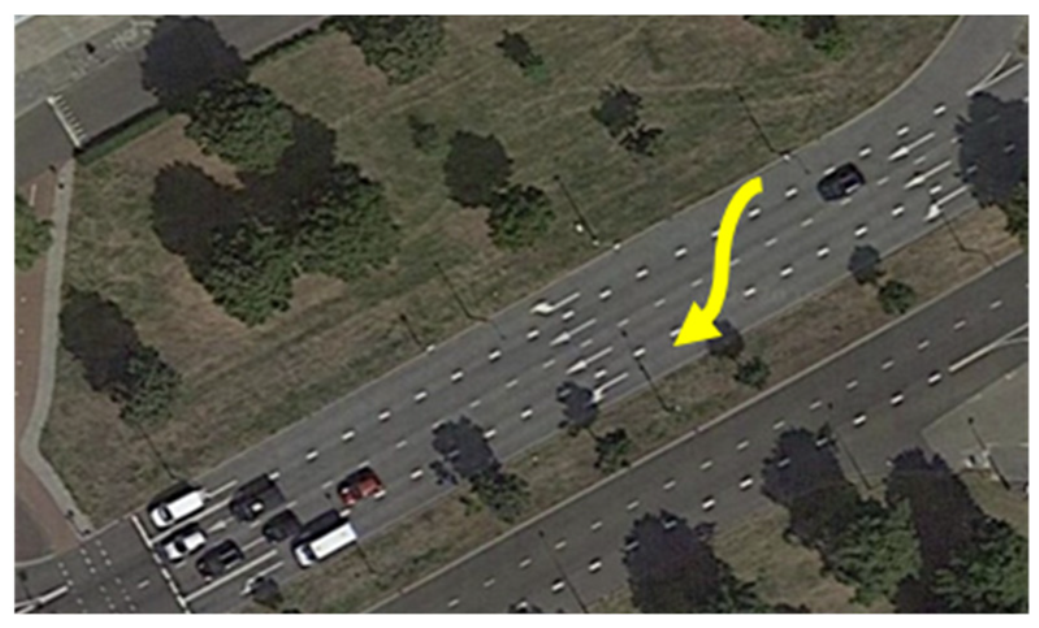
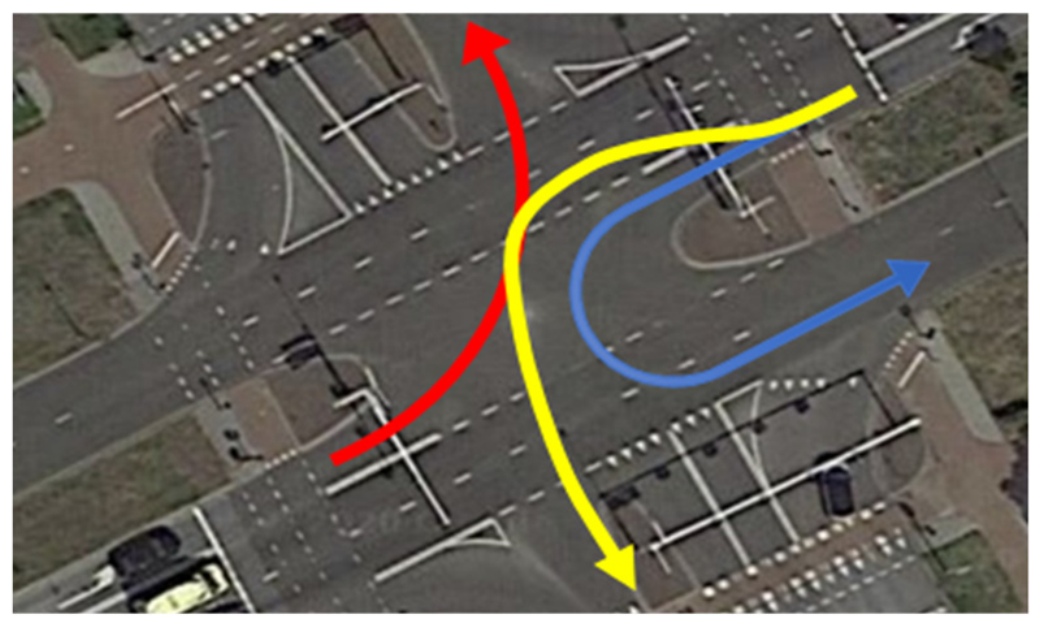
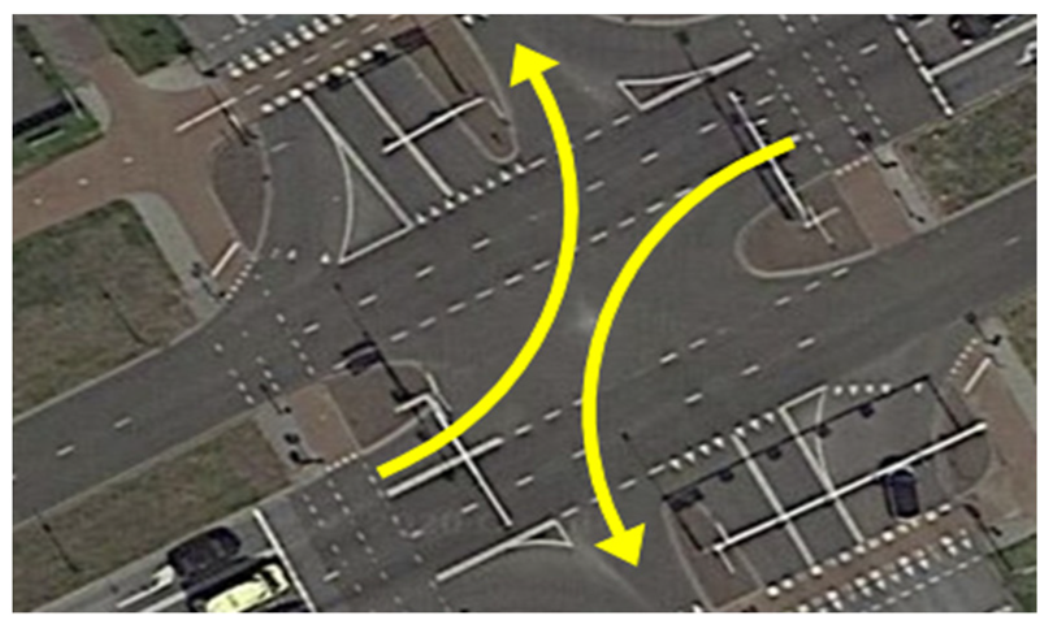
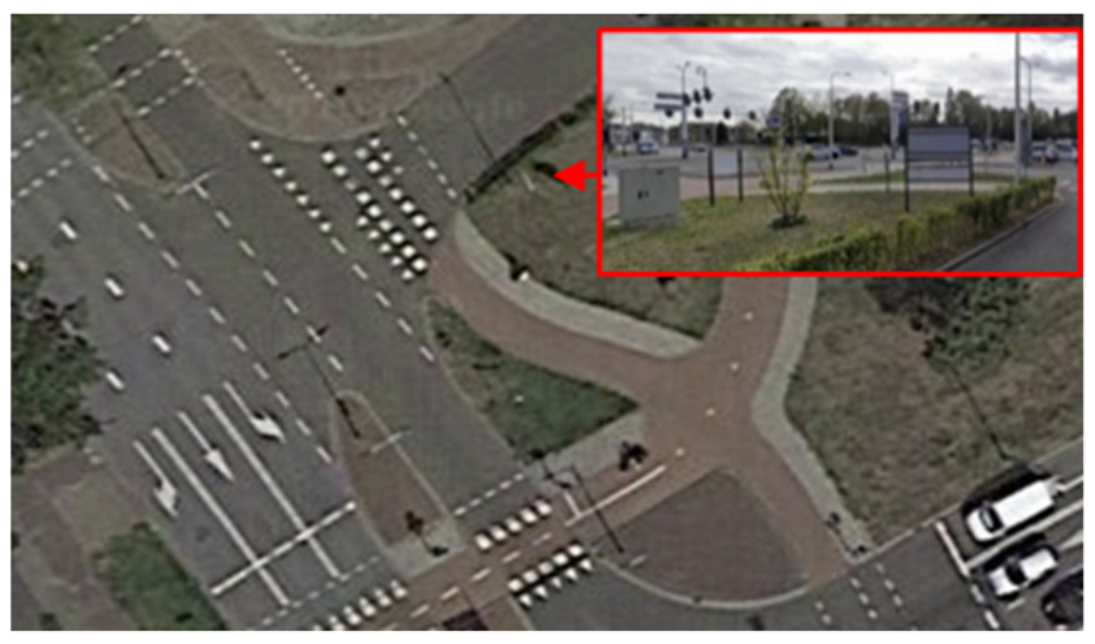
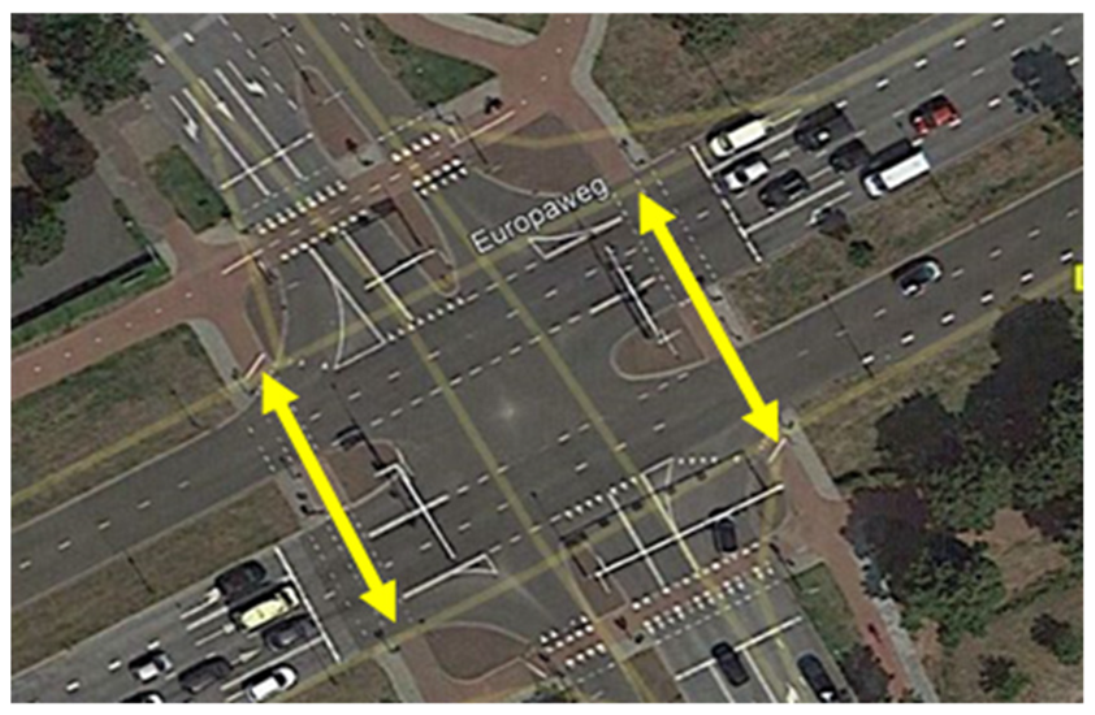
The analyzed use case is representative of urban signalized intersections and the configuration of their surroundings. The coordination of traffic lights on all four legs of the intersection avoids the main traffic conflicts even though some issues arise from the inspection. Those issues can be grouped into three main categories. The first category concerns issues arrising due to the presence of driveways close to the intersection, since vehicles exiting or entering the driveways could conflict with vehicles approaching or exiting the intersection. The second category concerns issues concerning the intersection maneuvers, such as lane changing or possible U-turn maneuvers. Finally, the last category concerns issues related to vulnerable road users (VRUs), particularly the duration of the green phase and the conflicts with motorized and non-motorized vehicles in proximity of the driveways. The lists and descriptions of the identified issues for each category are provided in Table 5, Table 6 and Table 7. In the tables, the possible hazardous maneuvers are described and some pictures are provided as examples. The hazardous maneuvers may occur in all other situations that have the same configuration and this must be considered while making the evaluation. All these types of maneuvers must be then evaluated considering how an AV will deal with them.
Table 5.
Identified issues of category “S” (road signs, from [26]).
Table 6.
Identified issues of category “A” (alignment, from [26]).
Table 7.
Identified issues of category “V” (vulnerable road users, from [26]).
4.3. Risk Calculation and Scenarios Comparison
Following the risk calculation procedure, presented in the methodology, the value of the likelihood (D), the weight of severity (V), and the exposure (E) have been assigned for each risky maneuver, and the risk (R) has been calculated. For scenario 0, that is the current scenario, D and V have been estimated by the inspectors considering the observed crash of the last four years occurring at the intersection, considering the possible crash occurrence at a similar site from the literature, and by the analysis of the site, considering the time-to-collision (TTC) as a surrogate safety measure. Future scenarios (1 to 6) have only been estimated considering how the different driving logics may interact with CVs.
Table 8 shows the values assigned and the obtained results. The represented scenario is scenario 0 (i.e., the current scenario); thus, only CVs are present, with an exposure E = 1.
Table 8.
Identified problems and risk evaluation, Use Case 3.
The riskiest maneuvers identified are those potentially involving pedestrians, because of the higher severity. Looking at the likelihood, the probability of occurrence is always 0.4, except for the A.1 maneuver, because it has been judged that in this configuration, many changes of lanes are likely because every possible turning is provided with a turning lane. During the inspection, it has been observed that such lane changes are often made close to the last part of the turning lane.
After the risk calculation for scenario 0, the risk has also been evaluated for future scenarios. In Table 9, Table 10, Table 11, Table 12, Table 13 and Table 14, the identified values of D, V, E, and R for scenarios 1 to 6 are presented. The assignment of the likelihood value (D) was based on the consideration presented in Table 3.
Table 9.
Risk evaluation for scenario 1, Use Case 3.
Table 10.
Risk evaluation for scenario 2, Use Case 3.
Table 11.
Risk evaluation for scenario 3, Use Case 3.
Table 12.
Risk evaluation for scenario 4, Use Case 3.
Table 13.
Risk evaluation for scenario 5, Use Case 3.
Table 14.
Risk evaluation for scenario 6, Use Case 3.
Table 9 and Table 10 represent scenarios 1 and 2. In both cases, the CVs are 75% of the total traffic at the intersection. The automated vehicles in the scenarios are composed of two different driving logics: in Scenario 1, the driving logic is Cautious for 20% of AVs and Normal for 5%; in Scenario 2, the percentages are inverted. Looking at the results of these two tables, it appears that while the likelihood (D) of crashes that are completely related to CVs is still the same, the likelihood related to AVs varies according to the driving logic. Cautious vehicles seem to have the worst impact on road safety than Normal vehicles, even if the Cautious driving logic takes large margins to avoid any collision. This is not due to incorrect behavior by the AV, but to the mixed traffic, because CVs may find some difficulties understanding how Cautious AVs behave. Consequently, the likelihood of a crash may increase, mostly where rear-end collisions are possible, because of unexpected sudden braking by Cautious AVs. Furthermore, it can be observed that some types of maneuvers which can lead to crashes will not be present with the introduction of AVs (S.3, VU.1, VU.2). This type of maneuver involves motorized and non-motorized road users (i.e., cyclists or pedestrians). If all AV sensors work well and can scan the infrastructure for potential problems, AVs will react correctly to the presence of cyclists or pedestrians, eliminating all potential driver deficiencies.
A detailed analysis of all the behaviors associated with each maneuver for each vehicle type is provided in CoEXist deliverable 4.3 [26].
Scenario 3 considers a reduction in the number of CVs (50%) and an increase in the number of AVs (10% Cautious and 40% Normal). The results of this scenario are presented in Table 11. A general reduction in the risk can be observed.
In scenarios 4, 5, and 6, the All-knowing driving logic is introduced. All-knowing vehicles are considered to react quickly to all situations and are more “aggressive” by taking low safety margins from the point of view of the human driver (however, they act only in safe conditions). The introduction of All-knowing vehicles leads to a general reduction in the likelihood of all the analyzed maneuvers. For example, sudden braking is still possible but reduced because All-knowing vehicles have higher capabilities to predict the behavior of the other cars and they, as stated, may take low margins. For example, a Cautious vehicle must maintain a high distance from the preceding vehicle; if that distance is not present, it will brake with a fast reduction in its speed. All-knowing vehicles allow for maintaining a lower distance and if that distance is not respected, they will lightly brake or also decelerate without making an emergency stop, but gradually braking.
The results of scenarios 4, 5, and 6 are presented respectively in Table 12, Table 13 and Table 14. The results are similar to the ones in the previous scenarios. The introduction of AVs and the consequent reduction in CVs improve the general safety of the site considered.
Looking at such disaggregated results may help to identify specific issues that can be solved or reduced by the introduction of specific countermeasures.
Considering the All-knowing vehicles, the crossing maneuver is more likely to happen because they can clearly judge the situation and decide to act even with safety margins that can be hardly understood by a human driver. This may induce the human driver to quickly react to a perceived danger (a car in its lane), increasing the risk of wrong and dangerous manoeuvres. A driver may suddenly brake even if danger is only perceived, rather than the danger being real.
These results suggest that in mixed traffic, a high difference in vehicle behaviors is not recommended. A gradual modification of traffic composition may instead help move from CVs to a full AVs scenario.
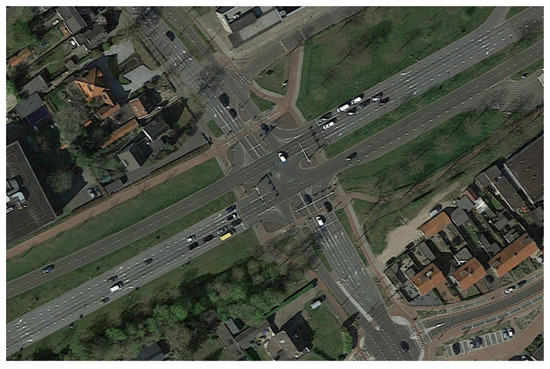
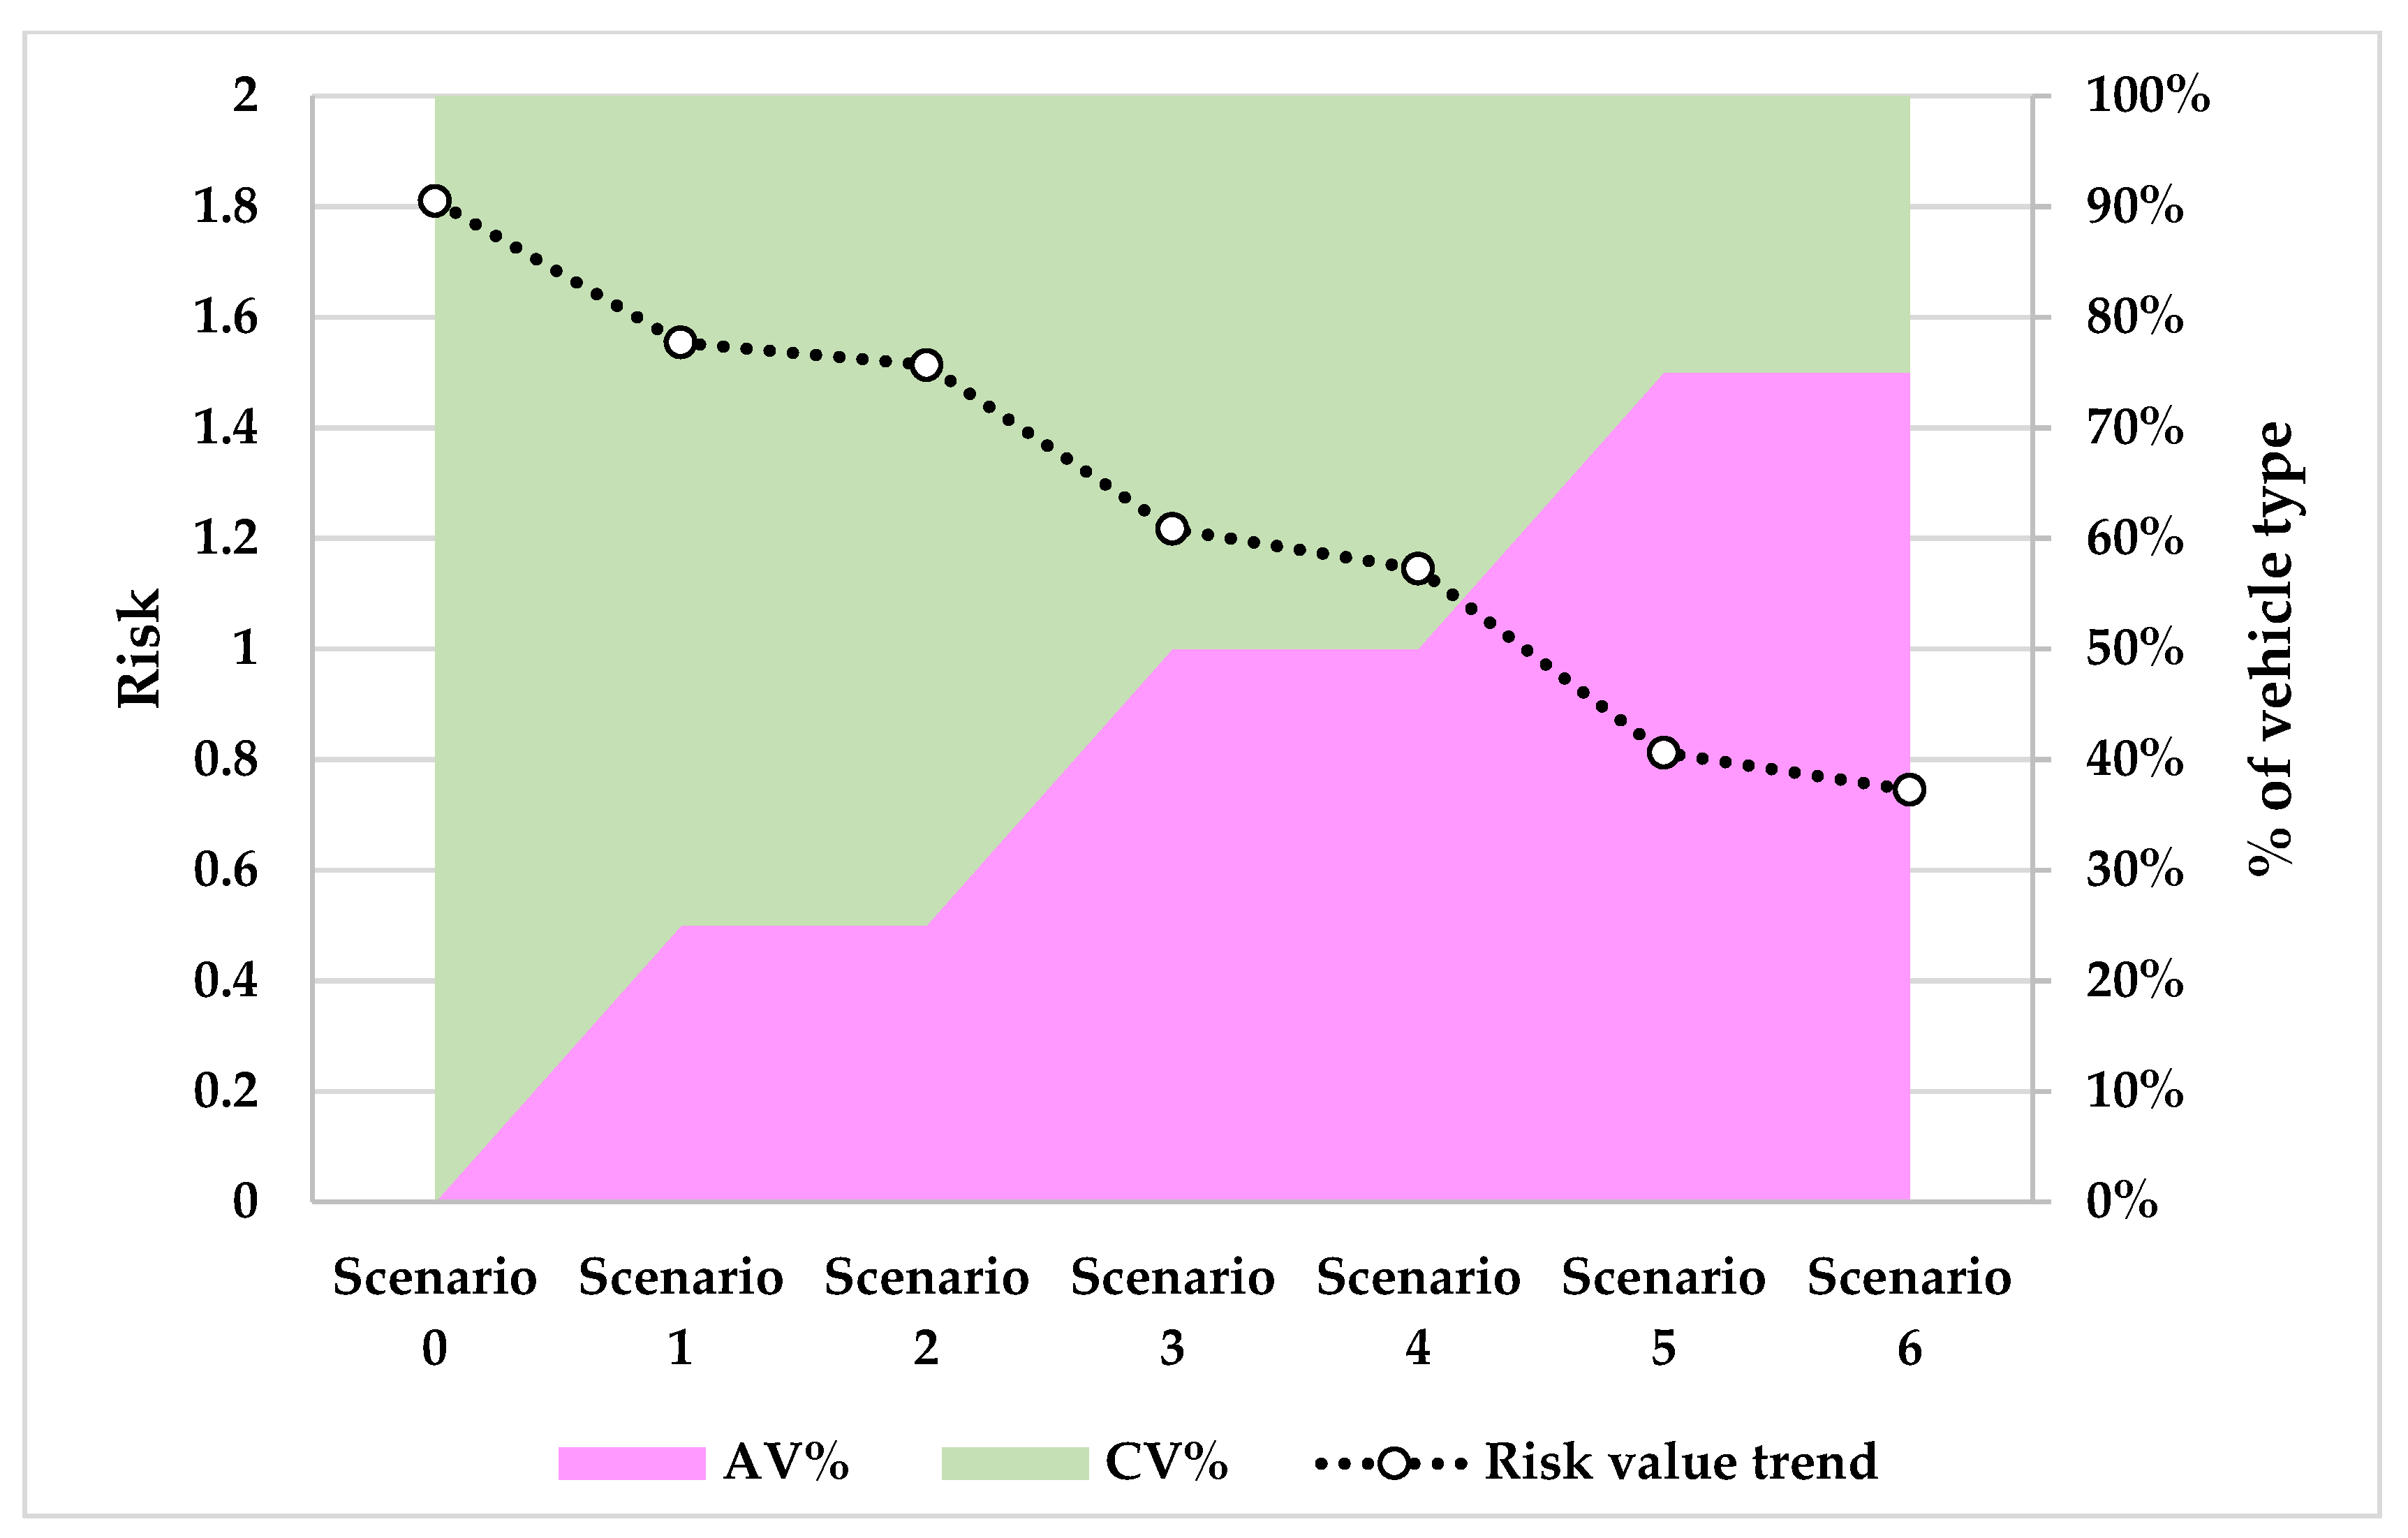
The results of all the scenarios have been summarised in Figure 3. The graph shows the trend in risk for Use Case 3. The graph clearly shows that with the introduction of AVs, the overall safety conditions will improve. The increase in safety is due mainly to the percentage of AVs in the traffic (as can be observed looking at the risk trend between scenarios 0 and 1, 2 and 3, and 4 and 5 in Figure 3), but also to the different driving logics. The advanced driving logic has a generally positive impact on road safety, as can be observed from the risk value of scenarios 1 and 2, 3 and 4, and 5 and 6 (for each couple of scenarios, the traffic percentage is the same but the percentage of vehicles with different driving logics is varied).
Figure 3.
Use Case 3—site risk evolution based on different scenarios.
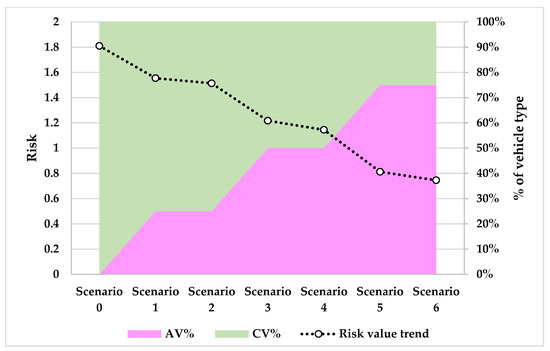
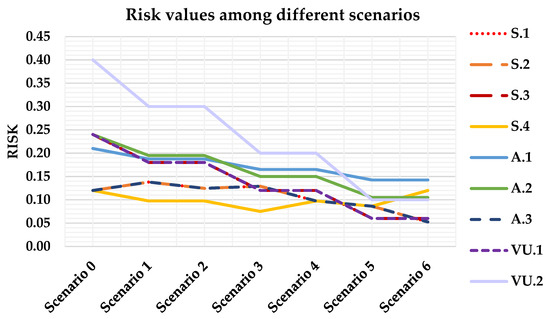
However, for some specific issues, a different driving logic may slightly increase the likelihood of a crash. This can be observed from the results presented in Figure 4. By looking at the graph in the figure it is possible to observe that the risk of issue A.3 (left-turn maneuver) increases in Scenario 1 compared to that of Scenario 0, because of a higher number of Cautious AVs in the traffic, which improves the number of possible hazardous overtakes and rear-end collisions. The same issue also demonstrates a slight increase between Scenario 2 and 3 for the same reason. Issue S.4 (access near the intersection, car interrupting its maneuver transversally in the lane because of oncoming vehicles) shows instead an increase in the risk value, passing from Scenario 3 to 4 and from 5 to 6. This is due to the great increase of All-knowing vehicles in the traffic, whose maneuvers may surprise the drivers. For these reasons, even if the global safety of the intersection may increase, all the possible situations should be considered, the possible issues identified, and the specific countermeasures taken to reduce the risk of an increased number of accidents. Cautious and All-knowing driving logics, which demonstrate a major negative impact on road safety (even if slight), represent opposite extremes In any case, they are still far from CV behavior (i.e., human driver behavior), which proves that drivers are still a crucial part of the road safety managing process during coexistence. Besides, the influence of automated vehicles on drivers’ behavior must always be accounted for and when necessary, infrastructure modifications should be implemented to facilitate the coexistence of both these types of vehicles.
Figure 4.
Use Case 3—Risk values of each identified issue for each scenario (AR.1 issue was not present in Scenario 0).
5. Discussion and Conclusions
Automated vehicles have the potential to revolutionize road transport, making it potentially even more attractive than today. Given that road accidents are one of the main current causes of death worldwide, the introduction of automated vehicles must result in a reduction of such fatalities. However, the evaluation of safety impacts must be addressed not only as a technology issue, but as a “system” issue. No matter how good the technology will be, the system will always play a role.
This paper introduces an approach, based on road safety inspection techniques, to investigate the safety impact of road vehicle automation. Trying to foresee the possible safety issues coming from the introduction of AVs could help make infrastructure AV-ready. Relying on RSI means having the possibility to investigate the specific condition of a site; on the other hand, it relies considerably on the inspector’s judgment. However, many countries, and especially Europe [27], are now stressing the importance of on-site visual examinations. Therefore, it will be crucial to provide some guidelines for inspectors that must also analyze the possible impact of the introduction of AVs.
The proposed methodology is therefore a pioneer in this sense because it identifies through RSI procedures the risk level of a road facility (e.g., intersection, road segment), accounting for the exposure, the likelihood of a crash, and the possible outcome of the crash (i.e., the severity) for each risky maneuver identified through the facility. The methodology accounts not only for the current road issues but also tries to foresee any possible future issues due to the introduction of AVs. A comparison between different future scenarios and the current scenario is then made to assess potential safety improvements or deteriorations. The methodology has been applied to the CoEXist project use cases, one of which is presented as an example (Use Case 3). The results show a general risk decrease according to the higher penetration of AVs, which is in line with many other results from other studies, both considering the penetration level and the technological advances [2,3,4]. The analysis highlights that some safety issues may arise with the introduction of specific AV driving logics. Those issues are mainly related to the interaction between AVs and CVs and their different approaches to complex situations, where the road configuration plays a predominant role. For example, Sinha et al. [5] found that the presence of mixed traffic may reduce the TTC between vehicles. This is confirmed by Petrović et al. [7], who underline that the number of rear-end crashes increases with the introduction of AVs. Similar results have also been found in the other two Use Cases analyzed in the CoEXist project [26]. In this example, those situations are clearly explained by looking at Issue S.4 (access near the intersection, car interrupts its maneuver transversally in the lane because of oncoming vehicles), which shows a minimum risk in Scenario 3, and then the risk rising again. This is due to the great increase in All-knowing vehicles in the traffic, whose maneuvers may surprise the drivers because they are expected to drive in a more “risky” way than a conventional driver. This driving is not risky for the AV but appears so to the driver, who cannot behave within those strict safety margins.
Some limitations of the proposed methodology must also be underlined. The first is that some assumptions have been made to foresee and schematize the behavior of AVs and qualitative evaluations have been made to quantify the influence of such behaviors. Therefore, the process may be sensitive to subjective scores from different inspectors. This is a limitation of many procedures based on RSI, which can be overcome by providing inspectors with adequate training and guidelines, as demonstrated by considering the use of different road safety analysis procedures based on RSI [28,29]. The definition of specific criteria and guidelines accounting for different conditions could be of great interest for future developments. Secondly, the procedure allows comparison of different scenarios at the same location, but not for comparing the risk among different locations, which could be the objective of further research too, considering also that with an increase in knowledge about AVs, more precise and realistic assumptions could be made. Despite the mentioned limitations, the proposed methodology and its application show how it is essential to evaluate the risks related to the introduction of AVs, and that a first qualitative evaluation is possible throughout the implementation of RSIs. Such evaluations can be decisive in identifying some site-specific related issues.
Author Contributions
Conceptualization, A.P., A.A. and P.T.; methodology, A.P., P.T. and A.T.; validation, A.A. and E.M.; formal analysis, A.A.; investigation, A.P., P.T. and A.T.; data curation, A.P. and P.T.; writing—original draft preparation, A.P.; writing—review and editing, A.A.; visualization, A.P., P.T. and A.T.; supervision, A.A. and E.M.; project administration, A.A.; funding acquisition, A.A., A.T. and E.M. All authors have read and agreed to the published version of the manuscript.
Funding
This research was part of the CoEXist project, which was funded by the European Union’s Horizon 2020 research and innovation program under grant agreement No. 723201.
Institutional Review Board Statement
Not applicable.
Informed Consent Statement
Not applicable.
Data Availability Statement
Not applicable.
Conflicts of Interest
The authors declare no conflict of interest.
References
- WHO. Global Status Report on Road Safety 2018; WHO: Geneva, Switzerland, 2019. [Google Scholar]
- Rahman, M.S.; Abdel-Aty, M.; Lee, J.; Rahman, M.H. Safety benefits of arterials’ crash risk under connected and automated vehicles. Transp. Res. Part C Emerg. Technol. 2019, 100, 354–371. [Google Scholar] [CrossRef]
- Karbasi, A.; O’Hern, S. Investigating the Impact of Connected and Automated Vehicles on Signalized and Unsignalized Intersections Safety in Mixed Traffic. Futur. Transp. 2022, 2, 24–40. [Google Scholar] [CrossRef]
- Utriainen, R.; Pöllänen, M. The Needed Features of Connected and Automated Vehicles to Prevent Passenger Car Crashes Caused by Driving Errors. Futur. Transp. 2021, 1, 370–386. [Google Scholar] [CrossRef]
- Sinha, A.; Chand, S.; Wijayaratna, K.P.; Virdi, N.; Dixit, V. Comprehensive safety assessment in mixed fleets with connected and automated vehicles: A crash severity and rate evaluation of conventional vehicles. Accid. Anal. Prev. 2020, 142, 105567. [Google Scholar] [CrossRef] [PubMed]
- Li, T.; Wang, L.; Liu, J.; Yuan, J.; Liu, P. Sharing the Roads: Robot Drivers (Vs. Human Drivers) Might Provoke Greater Driving Anger When They Perform Identical Annoying Driving Behaviors. Int. J. Hum.-Comput. Interact. 2021, 38, 309–323. [Google Scholar] [CrossRef]
- Petrović, D.; Mijailović, R.; Pešić, D. Traffic Accidents with Autonomous Vehicles: Type of Collisions, Manoeuvres and Errors of Conventional Vehicles’ Drivers. Transp. Res. Procedia 2020, 45, 161–168. [Google Scholar] [CrossRef]
- Deluka Tibljaš, A.; Giuffrè, T.; Surdonja, S.; Trubia, S. Introduction of Autonomous Vehicles: Roundabouts Design and Safety Performance Evaluation. Sustainability 2018, 10, 1060. [Google Scholar] [CrossRef] [Green Version]
- Giuffrè, T.; Canale, A.; Severino, A.; Trubia, S. Automated Vehicles: A Review of Road Safety Implications as a Driver of Change. In Proceedings of the 27th CARSP Conference, Toronto, ON, Canada, 18–21 June 2017. [Google Scholar]
- Manivasakan, H.; Kalra, R.; O’Hern, S.; Fang, Y.; Xi, Y.; Zheng, N. Infrastructure requirement for autonomous vehicle integration for future urban and suburban roads—Current practice and a case study of Melbourne, Australia. Transp. Res. Part A Policy Pract. 2021, 152, 36–53. [Google Scholar] [CrossRef]
- Lee, S.; Jeong, E.; Oh, M.; Oh, C. Driving aggressiveness management policy to enhance the performance of mixed traffic conditions in automated driving environments. Transp. Res. Part A Policy Pract. 2019, 121, 136–146. [Google Scholar] [CrossRef]
- Strauba, E.R.; Schaeferb, K.E. It takes two to Tango: Automated vehicles and human beings do the dance of driving—Four social considerations for policy. Transp. Res. Part A Policy Pract. 2019, 122, 173–183. [Google Scholar] [CrossRef]
- Yoo, S.; Managi, S. To fully automate or not? Investigating demands and willingness to pay for autonomous vehicles based on automation levels. IATSS Res. 2021, 45, 459–468. [Google Scholar] [CrossRef]
- Pereira, I.; Fléchon, C.; Johansson, F.; Olstam, J.; Dahl, A.; Tiberi, P.; Paliotto, A.; Tripodi, A. Tools for Assessing the Traffic Impacts of Automated Vehicles. CoExist Project, Deliverable 3.3. 2019. Available online: https://www.h2020-coexist.eu/wp-content/uploads/2020/05/D3.3-Tools-for-assessing-the-traffic-impacts-of-automated-vehicles-final.pdf (accessed on 1 August 2021).
- Olstam, J.; Johansson, F.; Alessandrini, A.; Sukennik, P.; Lohmiller, J.; Friedrich, M. An Approach for Handling Uncertainties Related to Behaviour and Vehicle Mixes in Traffic Simulation Experiments with Automated Vehicles. J. Adv. Transp. 2020, 2020, 8850591. [Google Scholar] [CrossRef]
- European Parliament; Council of European Union. Directive 2008/96 EC of the European Parliament and of the Council of 19 November 2008 on Road Infrastructure Safety Management; Official Journal of the European Union: Strasbourg, France, 2008; pp. 59–67. [Google Scholar]
- PIARC. Road Safety Inspections Guidelines for Safety Checks of Existing Roads; PIARC: Puteaux, France, 2012. [Google Scholar]
- Lawson, S. Crash Rate—Star Rating Comparisons. Review of Available Evidence. iRAP/EuroRAP Working Paper 504.2. Available online: http://www.irap.net/en/about-irap-3/research-and-technical-papers?download=40:crash-rate-star-rating-comparison-paper (accessed on 26 January 2021).
- EuroRAP. Crash Rate—Star Rating Comparison. Review of Available Evidence, May 2011. iRAP/EuroRAP Working Paper 504.2. 2011. Available online: https://www.eurorap.org/wp-content/uploads/2015/04/iRAP-EuroRAP-Crash-rate-Star-Rating-comparison-504.2-20110420.pdf (accessed on 26 January 2021).
- SWOV. The EuroRAP RPS Method as a Safety Instrument; SWOV: Leidschendam, The Netherlands, 2011. [Google Scholar]
- AusRAP; Australian Automobile Association; ARRB. Comparing Risk Maps and Star Ratings; AusRAP Technical Working Paper. 2008. Available online: https://www.semanticscholar.org/paper/Comparing-risk-maps-and-star-ratings-McInerney-Harkness/b22c68f0cff18f559a87ab380d7b9d7090df0a4a (accessed on 26 January 2021).
- Harwood, D.W.; Bauer, K.M.; Glimore, D.K.; Souleyrette, R.; Hans, Z.N. Validation of U.S. Road Assessment Program Star Rating Protocol: Application to Safety Management of U.S. Roads. Transp. Res. Rec. J. Transp. Res. Board 2010, 2147, 33–41. [Google Scholar] [CrossRef]
- Aravas, N.; UNECE. Road Safety Audit and Road Safety Inspection on the TEM network. Int. J. Numer. Methods Eng. 2018, 24, 1395–1416. [Google Scholar] [CrossRef]
- Transport Infrastructure Ireland (TII). Road Safety Inspection. 2017. Volume AM-STY-06044. Available online: https://www.tii.ie/technical-services/safety/road-safety/road-safety-inspection/ (accessed on 10 February 2021).
- Cafiso, S.; la Cava, G.; Montella, A. Safety Index for Evaluation of Two-lane Rural Highways, Transportation Research Record: Journal of the Transportation Research Board; No. 2019; Transportation Research Board of the National Academies: Washington, DC, USA, 2007; pp. 136–145. [Google Scholar] [CrossRef]
- Olstam, J.; Johansson, F.; Liu, C.; Pereira, I.; Fléchon, C.; van den Bosch, F.; Anvar, A.; Miles, J.; Sonnleitner, J.; Tiberi, P.; et al. Technical Report on the Application of the Tools for Assessing Traffic Impacts of Automated Vehicles. CoEXist Project, Deliverable 4.3. 2020. Available online: https://www.h2020-coexist.eu/wp-content/uploads/2020/05/D4.3_Technical-report-on-the-application-of-the-tool-for-assessing-traffic-final.pdf (accessed on 13 November 2021).
- European Parliament; Council of European Union. Directive (EU) 2019/1936 of the European Parliament and of the Council of 23 October 2019. 2019. Volume L 305. Available online: https://eur-lex.europa.eu/legal-content/EN/TXT/?uri=CELEX%3A32019L1936 (accessed on 12 April 2020).
- Domenichini, L.; Paliotto, A.; Meocci, M.; Branzi, V. Application and Evaluation of a Non-Accident-Based Approach to Road Safety Analysis Based on Infrastructure-Related Human Factors. Sustainability 2022, 14, 662. [Google Scholar] [CrossRef]
- Cafiso, S.; Pappalardo, G.; Kiec, M. Innovative Methods for Improving the Effectiveness of Road Safety Inspection. In Proceedings of the VI International Symposium of Transport and Communications, New Horizons, Doboj, Bosnia and Herzegovina, 17–18 November 2017. [Google Scholar]


Publisher’s Note: MDPI stays neutral with regard to jurisdictional claims in published maps and institutional affiliations. |
© 2022 by the authors. Licensee MDPI, Basel, Switzerland. This article is an open access article distributed under the terms and conditions of the Creative Commons Attribution (CC BY) license (https://creativecommons.org/licenses/by/4.0/).