Article

Using Online Videos to Improve Attitudes toward Shared Autonomous Vehicles: Age and Video Type Differences

Psychology Department, College of Behavioral, Social and Health Sciences, Clemson University, Clemson, SC 29634, USA
*
Author to whom correspondence should be addressed.
Future Transp. 2024, 4(1), 299-320; https://doi.org/10.3390/futuretransp4010016
Submission received: 16 December 2023 / Revised: 5 March 2024 / Accepted: 12 March 2024 / Published: 20 March 2024

Abstract

:
Future adoption of shared automated vehicles (SAVs) should lead to several societal benefits, but both automated vehicles (AVs) and ridesharing must overcome their barriers to acceptance. Previous research has investigated age differences in ridesharing usage and factors influencing the acceptability and acceptance of AVs. Further complicating our understanding of SAV acceptance, much of the public lack accurate knowledge and/or actual experience regarding AVs. In this study, we employed a 3 (age group) × 4 (video condition) longitudinal mixed experimental design to investigate age differences in anticipated SAV acceptance after viewing different types of introductory videos related to AVs (educational, experiential, or both) or currently available ridesharing provided by transportation network companies (control). Younger, middle-aged, and older adults were randomly assigned to watch (1) an educational video about SAV technologies and potential benefits, (2) an experiential video showing an SAV navigating traffic, (3) both the experiential and educational videos or (4) a control video explaining how current ridesharing services work. Attitudes toward SAVs (intent to use, trust/reliability, perceived usefulness, perceived ease of use, safety, desire for control, cost, authority, media, and social influence) were measured before and after viewing the video(s). Significant differences in how SAV attitudes changed were found between the educational and experiential video conditions relative to the control video and between different age groups. Findings suggest that educational and/or experiential videos delivered in an online format can have modest but significant improvements to their viewers’ attitudes toward SAVs—particularly those of older adults.

1. Introduction

Autonomous vehicles (AVs) have promise and potential to bring a host of benefits to their users and positive externalities to transportation networks and society at large (e.g., increases in access to mobility, improvements in safety and comfort, reductions in traffic congestion and related greenhouse gas emissions, etc.), so long as they are deployed in a way that is sustainable. It is expected that SAE level 4 [1] AVs will improve riders’ comfort during transit and allow those who were once burdened with the safety-critical dynamic driving task to focus on other productive tasks or relaxing activities [2]. To realize any potential benefits of AVs, prospective riders must be informed and aware of their utility, have their uncertainties about the operation of novel AV technologies and services clarified, and find the reliability of AVs acceptable before actually experiencing a ride in them. To this end, the multifaceted factors influencing the acceptance of AVs have been widely studied e.g., [3,4,5,6]. Nordhoff and colleagues’ [6] review-based analysis of this literature displays the multideterminant nature of attitudes toward AVs. Nordhoff et al. found that published research on AV acceptance broke down into seven main classes listed here in descending order by percentage: Socio-demographics (28%), domain-specific system evaluation (22%; i.e., performance and effort expectancy, safety, facilitating conditions, and service and vehicle characteristics), travel behavior (15%), personality (14%), moral-normative system evaluation (12%; i.e., perceived benefits and risks), exposure to AVs (6%), and symbolic-affective system evaluation (4%; hedonic motivation and social influence).
Travel needs and an individual’s ability to meet them vary across the lifespan [7,8], and the acceptability of a transportation mode often varies by and within the age cohort [9,10]. Perhaps unsurprisingly, younger individuals and those who have a high level of comfort with new technologies and identify as early adopters of them also tend to hold positive attitudes regarding emergent transportation innovations like AVs [5,11]. While some market segments may not require much enticement to adopt AVs, others might turn to AVs to support their community mobility and address unmet travel needs, such as those with disabilities or older adults with age-related declines that limit their viable transportation options [12,13,14]. There remains significant reticence about AV technology among many people with disabilities [15] and older adults [16], even though their quality of life might stand to benefit greatly from the adoption of AV technology once it becomes available. Older adults may especially benefit from this technology, as they are more likely to experience increased unmet travel needs as they age [8].
Precisely this phenomenon was witnessed in a preliminary study that simulated the impacts of personally owned AVs’ on future travel behavior. Harb and colleagues [17] provided households with an allotment of hours of a chauffeur service and instructed them to use it as if it were a completely autonomous vehicle. The most notable increase in vehicle miles traveled (VMT) came from an older woman who used the chauffeur service to more than triple the amount she drove in a week (117 miles vs. 516), citing the novelty and the ability to satisfy her latent demand for longer trips than she felt comfortable driving herself. Harb and colleagues’ preliminary study results and the results that followed from the full experiment [18] strongly suggest that many of the potential safety, sustainability, and benefits related to congestion will not be realized by AVs if they are personally owned by individuals instead of shared.
While improvement in access to transportation for those with mobility limitations is indeed a positive possible outcome of widespread AV adoption, there is reason for trepidation if personally owned or single rider AVs are preferred over shared AVs (SAVs). have been witnessed to make up for these unmet travel needs when given access to an AV-like transportation option [17].
Though the visibility of AVs is increasing as developers extend their service ranges to more urban centers, the availability to experience vehicle automation is still quite limited anywhere outside of these zones. This means that the operationalization research conducted after giving individuals experience with AV technology usage-informed factors has shown that perceived ease of use (PEOU) of AVs, intention to use the technology, and perceived barriers have also been found to be significant indicators of attitudes toward AVs [19] yet Nordhoff et al.’s [6] review found at the time of its publication that only 6% of studies of AV acceptance attitudes considered experience and knowledge and/or exposure to AVs. Collectively, this all suggests efforts to familiarize individuals with AV technology by bolstering the accuracy and amount of their knowledge about their capabilities and limitations and/or increasing their exposure to and experience of how AVs operate in the complex real-world environments that they will be deployed in.

1.1. Will Sharing Rides Increase Acceptance of AVs?

Shared automated vehicles (SAVs), defined in this paper as an AV where the passenger is paired with other riders requesting transportation along a similar route, could lead to several additional benefits, including reduced traffic, reduced pollution from vehicles, and improved parking availability [5,11]. These vehicles would be a form of public transportation rather than privately owned vehicles. However, for these benefits to be realized, there needs to be high levels of public acceptance for SAVs [20]. For many, ridesharing can be a convenient and cost-effective transportation alternative to a personal car and can potentially help solve first-mile-last-mile problems (i.e., getting from home to a metro station and back) when using high throughput public transit systems [21]. Previous studies have examined what factors influence a traveler’s decision to use ridesharing services offered by transportation network companies (TNCs), such as UberPool or Lyft Shared Ride, where users are paired with other passengers requesting a ride along a similar route. Motivations for using ridesharing services include cost savings, travel time compared to public transportation, and comfort [22]. Demographic factors, such as gender, have seen mixed results regarding ridesharing use, quite possibly due to cultural differences between the regions studied and/or sampling differences in the studies. Some research found that males were more likely to use ridesharing services than females [5], while others found no gender differences [22]. Age, on the other hand, has been found to be a significant factor in current trends in TNC ridesharing use, with younger individuals being more likely to use these services than older individuals [5,22]. There is some concern that there will be reticence to share the vehicle with strangers for a number of reasons, such as security and privacy concerns [23,24] or inconvenience [25] associated with having other unknown riders share the ride.
There is some evidence from other work on advanced vehicle technologies that typical patterns of age and technology adoption/use might differ from the norms found with information communication technologies (ICT). Classen and colleagues found no difference in age for AV acceptance in a study that provided participants an opportunity to obtain first-hand experience riding in an automated shuttle as well as a simulated AV [11]. Older adults have been shown to place higher monetary value on advanced driver assistance systems (ADAS) like blind spot monitors [26]. They are also more willing to adopt other driving technologies. Familiarity with and trust in automated technologies have been shown to positively correlate to positive attitudes toward AVs [5,27]. Given these findings, it is possible that older adults’ attitudes toward AVs could be improved by increasing familiarity with and highlighting the benefits of the technology. Trust in AVs has been shown to increase with first-hand experience riding in one [27,28], and perceived safety influences both intention-to-use and perceived usefulness of AVs [2].

1.2. Computer-Mediated Communication to Improve SAV-Related Attitudes?

Computer-mediated communication has become an appealing approach for marketing and consumer research due to its low cost, speed, and breadth of reachable audiences [29], much less expensive than incentive programs that have been suggested to increase the adoption of connected and automated vehicles (CAVs; [30]). While the use of online videos as a persuasion tool is still a relatively new field compared to more traditional computer-mediated communications, such as email campaigns, there has been some investigation into how effective different types of online videos are at appealing to their intended audience. For example, within healthcare, one study found that the instructional use of online videos on using a common psoriasis severity measure was able to improve the accuracy in assigning severity scores for both physicians and patients [31]. In another recent study, the effectiveness of an educational, narrative-based online video was compared to that of traditional printed pamphlets in improving individuals’ beliefs in their own ability to taper their opioid use as well as their behavioral intentions to do so [32]. This research found that patients who viewed the online video displayed significant improvements in their attitudes toward the effectiveness of tapering their opioid use as well as their tapering self-efficacy when compared to those patients who viewed a pamphlet instead [32]. This shows that the online video medium’s enhanced communicative and persuasive effectiveness may be better for changing hard-to-change attitudes than printed materials. Video interventions have also been shown to be effective in modifying certain types of health behaviors, such as breast self-examination, prostate cancer screening, and sunscreen adherence [33]. These are promising indicators for stakeholders that want or need to use broadly distributable and easily consumable online videos to inform consumers about novel technologies: by developing online media showing the technology in action, they can educate consumers and/or address any misconceptions they may have.

1.3. Study Purpose

AVs have the potential to provide many benefits to their users, but again, only if the technology is accepted. SAVs should increase AV-related benefits to communities, as their use should optimally lead to reductions in the number of vehicles on the road if widespread adoption takes place. The current geographical limitations associated with providing in-person experience with AVs or SAVs raise the question of whether online methods of information and ‘experience’ distribution could be effective in improving attitudes toward these technologies with a broader audience. Our study focuses prospectively on age-related differences in attitudes after exposure to different types of information promoting shared automated vehicle (SAV) use. Gender is included as a covariate since there may be gender differences in using conventional ridesharing services like those offered by Uber/Lyft that may affect attitudes toward SAVs unrelated to the AV technology [5,22]. We aim to explore how the type and delivery method of information aimed at improving potential consumers’ attitudes toward SAVs are affected by potential age-related differences in attitudes. While much of previous research has focused on age differences in ridesharing usage or factors influencing acceptance of AVs, our study aims to combine these factors by looking at age differences in the malleability of anticipated acceptance of SAVs and the factors influencing anticipated acceptance. For the purposes of this study, we define SAVs as Society of Automotive Engineers (SAE) Levels 4 and 5, which are considered fully autonomous vehicles capable of driving themselves in most (L4) or all situations a human driver could manage (L5; SAE, 2016) being shared by riders traveling similar routes to their various destinations. SAE Level 3 (L3) was not considered because this study focuses on shared autonomous driving, where the vehicle is primarily responsible for the safety and performance of the driving and the human is a passenger, whereas, in L3, the human operator is still ultimately responsible for driving performance and is likely the owner of the personal vehicle with that L3 system. We also specify anticipated acceptance because SAVs are not currently widely available for consumer use. Our hypotheses are as follows:
Hypotheses 1 (H1):
The educational video will have a positive effect on the participants’ attitudes towards SAVs;
Hypotheses 2 (H2):
The experiential video will have a positive effect on participants’ attitudes toward SAVs;
Hypotheses 3 (H3):
When viewed together, the educational and experiential videos will have a more positive effect on participants’ attitudes toward SAVs than either alone;
Hypotheses 4 (H4):
Younger participants will have a greater change in attitudes toward SAVs after watching the educational and/or experiential videos than middle-aged or older adult participants;
Hypotheses 5 (H5):
Younger participants will have more positive attitudes toward SAVs than middle-aged or older participants.
Attitudes toward advanced vehicle technologies might be improved by increasing exposure and, thus, familiarity with them. Previous research has shown that first-hand experience with AVs can increase trust, which influences intent-to-use [27,28]. Because first-hand experience is difficult to make available to a wide audience at this point in the technology’s development, as well as persistent pandemic conditions (their study’s data collection was interrupted), we aim to look at whether and what types of online videos (educational or experiential) would be effective in influencing potential user’s attitudes toward SAVs.

2. Materials and Methods

2.1. Experimental Design

This study employed a 3 × 4 (age group × video condition) longitudinal mixed experimental design, with the between-subjects dependent variables coming from attitudinal changes in the different condition assignments (control, educational video only, experiential video only, and both educational and experiential videos), and the within-subjects component coming from changes to SAV attitudes before and after viewing their randomly assigned video(s).

2.2. Participants

To determine how many participants were necessary to detect an effect size of ~0.25 using F-test repeated measured within-between interaction, an a priori power analysis was performed using G*Power [34]. A Cohen’s f effect size of 0.25 was used during the analysis because this was the smallest significant effect size found by Classen and colleagues [28] in their study that used a similar scale to make the pre-post measurements we used for our pre-post condition main effects. Using three groups of 20 measurements (10 measures each from the pre- and post-condition surveys) with an alpha level of 0.95, we calculated the minimum total sample size should be 335 participants.
Prior to participant recruitment, we sought and gained approval from Clemson University’s institutional review board (approval # IRB2020-315). We recruited three different age groups of adults: younger adults aged 18–25, middle-aged adults aged 30–64, and older adults aged 65 and over. We recruited middle-aged and older adults through Prolific (www.prolific.com), an online data collection service, paying participants $9.50/hour. Younger adults were conveniently recruited through Clemson University’s SONA system (www.sona-systems.com) for course credit. Students were given three-course credits in return for their participation. All participants were US residents, and the survey took 35–45 min to complete. Data were collected in February and March 2021.

2.3. Materials

Respondents’ attitudes towards SAVs might be influenced by several factors, including their current comfort with ridesharing services and their existing attitudes towards technology. To account for participants’ comfort with ridesharing services, we used the measures implemented in Sarriera and colleagues’ [22] study on dynamic ridesharing usage, with responses given using a 7-point Likert scale (see Appendix A). To account for respondents’ perceptions of technology, we used a combination of preconceptions measures from Lee and colleagues [35] and experience measures from Mason and colleagues [36] using a 100-point slider scale, with greater values signaling more positive views of technology (see Appendix B). Older participants additionally completed an online version of the Montreal Cognitive Assessment [37] to capture any cognitive impairment.
Our dependent measure was the Shared Automated Vehicle User Perception Survey (SAVUPS), which consisted of a modified version of the Automated Vehicle User Perception Survey (AVUPS; see [36] for the original version; see Appendix C for our modified SAVUPS) that was lightly modified to specifically assess attitudes toward SAV services. The AVUPS has established face and content validity [36] as well as construct validity and test–retest validity [19]. We delivered the SAVUPS before and after participants watched the video(s) assigned to their condition. Responses from this survey can be broken down into the following dimensions that affect an individual’s attitude towards AVs: intention to use, trust/reliability, perceived usefulness (PU), perceived ease of use (PEOU), safety, desire for control/driving-efficacy, cost, authority, media, and social influence. Finally, the post-video SAVUPS also concluded with four open-ended questions regarding respondents’ attitudes toward AVs.
Our four conditions included several videos (control, educational, experiential, and both educational and experiential) we found or produced and were differentiated based on the videos’ content. We produced a seven-minute educational video using information gathered from the Partners for Automated Vehicle Education (PAVE) website (www.pavecampaign.org) that introduced the different technologies that enable automated driving, what kinds of tasks automation performs better than or worse than human drivers, and the potential benefits of AV acceptance. The seven-minute educational video is intended to be objective and informational only rather than persuasive, but the information presented may cast AVs in a positive light because only the potential benefits of AVs are discussed. Our experiential video used raw footage provided by an AV developer (Zoox, Inc.; www.zoox.com) of one of their AVs driving around San Francisco, which included both a representation of what the automated driving system (ADS) ‘sees’ and footage from cameras mounted on the hood and both side mirrors (Figure 1). This experiential video contains only footage of an AV successfully navigating various driving conditions, so it frames AVs in a positive light, but only contains examples of the current state of the technology and does not discuss what the future might look like once technology advances far enough for fully automated vehicles to be the standard. For the video employed in the control condition, we used a two and a half minute long pre-made video describing how ridesharing services like Uber and Lyft work that we found on YouTube [38].

2.4. Procedure

Once participants signed up for our study via SONA or Prolific, they were provided a link to a Qualtrics survey that randomly assigned them to either the educational video condition, the experiential condition, both educational and experiential videos, or a control condition that contained a video detailing how to use TNC services. Participants first filled out standard demographic information—gender, age, whether they lived in an urban/suburban/rural area, etc.—and filled out the comfort with ridesharing and perceptions of technology sections. Older adults completed the MoCA in between the demographics and ridesharing comfort sections. Next, participants completed the SAV pre-video survey, watched their condition’s video(s), and then completed the post-video SAV survey and questions about comfort with human vs automated drivers. Figure 2 illustrates the procedure participants completed during their involvement in the online study.
Because it was critical to our results that participants viewed the video(s) assigned to their conditions and retained their content before conducting analysis, we removed participants who did not spend half the video length or more in the video block to watch their video(s). We also removed participants who failed either of the two attention check questions we inserted into the survey (i.e., questions that explicitly instruction to select a certain answer). Whether or not the videos were watched was determined by the length of time spent on the question with the video embedded. If the timing was less than 200 s or more than 1000 s, the participant’s data were removed from the pool of data for analysis. These numbers were based on the educational video and experiential video lengths being 442 and 420 s, respectively. The minimum of 200 s was chosen to account for the possibility that participants may choose to watch the videos at 2× speed. Spending longer than 1000 s on the page with the video(s) we took as an indication that the participant clicked ‘play’ then walked away or turned their attention to another task. Additional video comprehension questions gave us insight into how much of the information in the videos the respondent retained.

3. Results

3.1. Analysis

To assess the effects of age and our videos on respondents’ attitudes towards SAVs, we performed a 3 × 4 MANCOVA analysis on the SAVUPS dimension difference scores (intent to use SAVs, trust in SAVs, perceived usefulness of SAVs, perceived ease of use of SAVs, and perceived AV safety) using the independent variables age group (younger (18–25), middle (30–64), and older (65+)) and video condition (ridesharing control video, educational video only, experiential video only, both educational and experiential videos). We included the covariates gender, ridesharing comfort (i.e., how comfortable the respondent was sharing a ridesharing vehicle with another passenger), past and present ridesharing experience, perceptions of technology, as well as the pre-video SAVUPS dimensions cost (i.e., how much cost influences their intent to use SAVs) and desire for control/driving-efficacy (i.e., their preference to drive themselves despite having automation available). To ensure participants watched the videos we added a timer on the video pages of the survey and removed any participants who spent less than half the time on the page or more than time and half on the page. That range was chosen to allow for participants who watched on double speed or rewatched portions. We also included video comprehension questions and removed participants who failed one or more comprehension questions.

3.2. Participants

Table 1 provides a breakdown of several participant characteristics by both the four video conditions as well as the three age groups. We were able to recruit 239 younger adults, 173 middle-aged adults, and 173 older adults, giving us a total of 585 participants. Older adults’ MoCA scores were checked to ensure all participants showed no signs of cognitive impairment. No participants needed to be removed from the sample based on cognitive ability. Once participants were screened according to the criteria mentioned above, our final sample consisted of 147 younger adults, 145 middle-aged adults, and 144 older adults, giving us a total of 436 participants included in our analysis. See Figure 3 for the baseline SAVUPS dimension scores by age group and Figure 4 for the SAVUPS dimension difference scores (post-video scores minus pre-video scores).

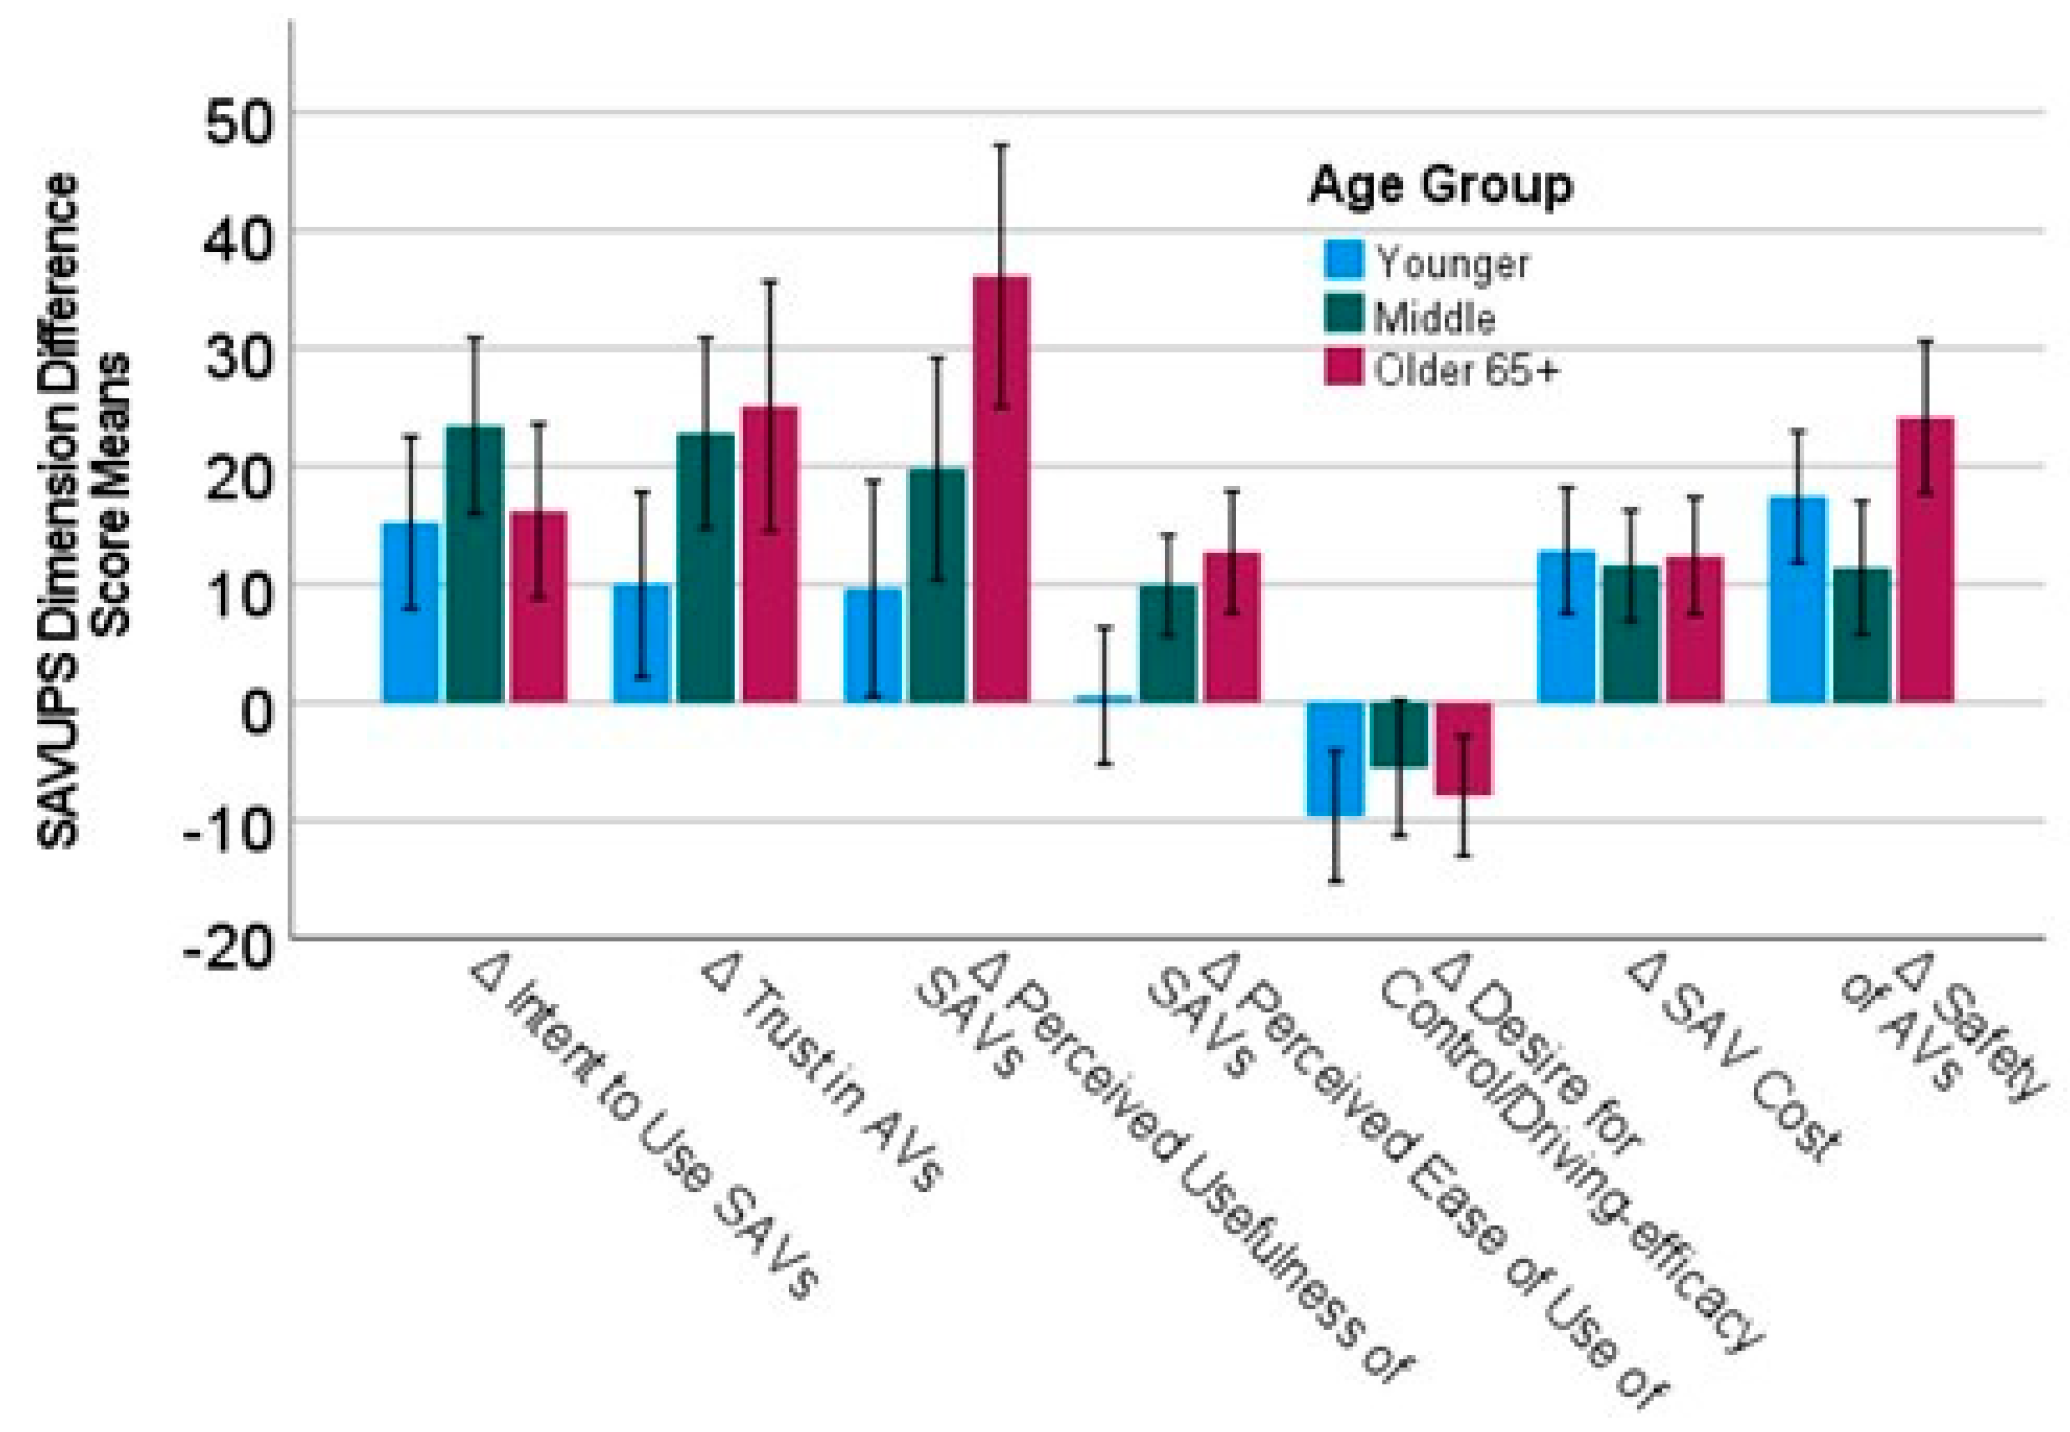
3.3. SAVUPS Difference Score MANCOVA

Levene’s test was performed and was not found to be significant for any of the dependent variables, so the assumption of homogeneity of variance was not violated. Box’s M test was also not statistically significant, so the assumption of covariance homogeneity was also not violated. Multivariate tests showed rideshare experience to be the only significant covariate (Pillai’s Trace = 0.034, F (5, 414) = 2.87, p < 0.016, ηp2 = 0.034), with more rideshare experience associated with significantly lower intent to use difference scores (F(1, 418) = 4.52, p < 0.036, ηp2 = 0.011) and PEOU difference scores (F(1, 418) = 7.18, p < 0.009, ηp2 = 0.017).
No significant interactions were found in the multivariate tests (Pillai’s Trace = 0.082, F(30, 2090) = 1.16, p = 0.25, ηp2 = 0.016), but a significant between-subjects test interaction between video condition and age group was observed (F(6, 418) = 2.65, p < 0.02, ηp2 = 0.037). Explored graphically (see Figure 5), it revealed that older participants in the control condition reported significantly higher PEOU difference scores after watching the control video on how to use ridesharing services than other age groups in their video condition. While such inconsistencies are to be questioned, we believe this has meaningful implications, which we will elaborate on during the Discussion.
The main effects observed between the video conditions and age groups are detailed in the paragraphs that follow. See the descriptive statistics for the SAVUPS difference scores in Table 2 and the full results of this analysis in Table 3. It is worth noting that the relatively high variability seen in Table 2 is due to individual differences in how much scores changed; some people’s attitudes change a lot some only a little bit. Covariates appearing in the model are evaluated at the following values: gender = 1.60, technology perceptions = 73.54, rideshare experience = 3.84, rideshare comfort = 4.07, SAVUPS driving = 211.47, SAVUPS cost = 71.77.

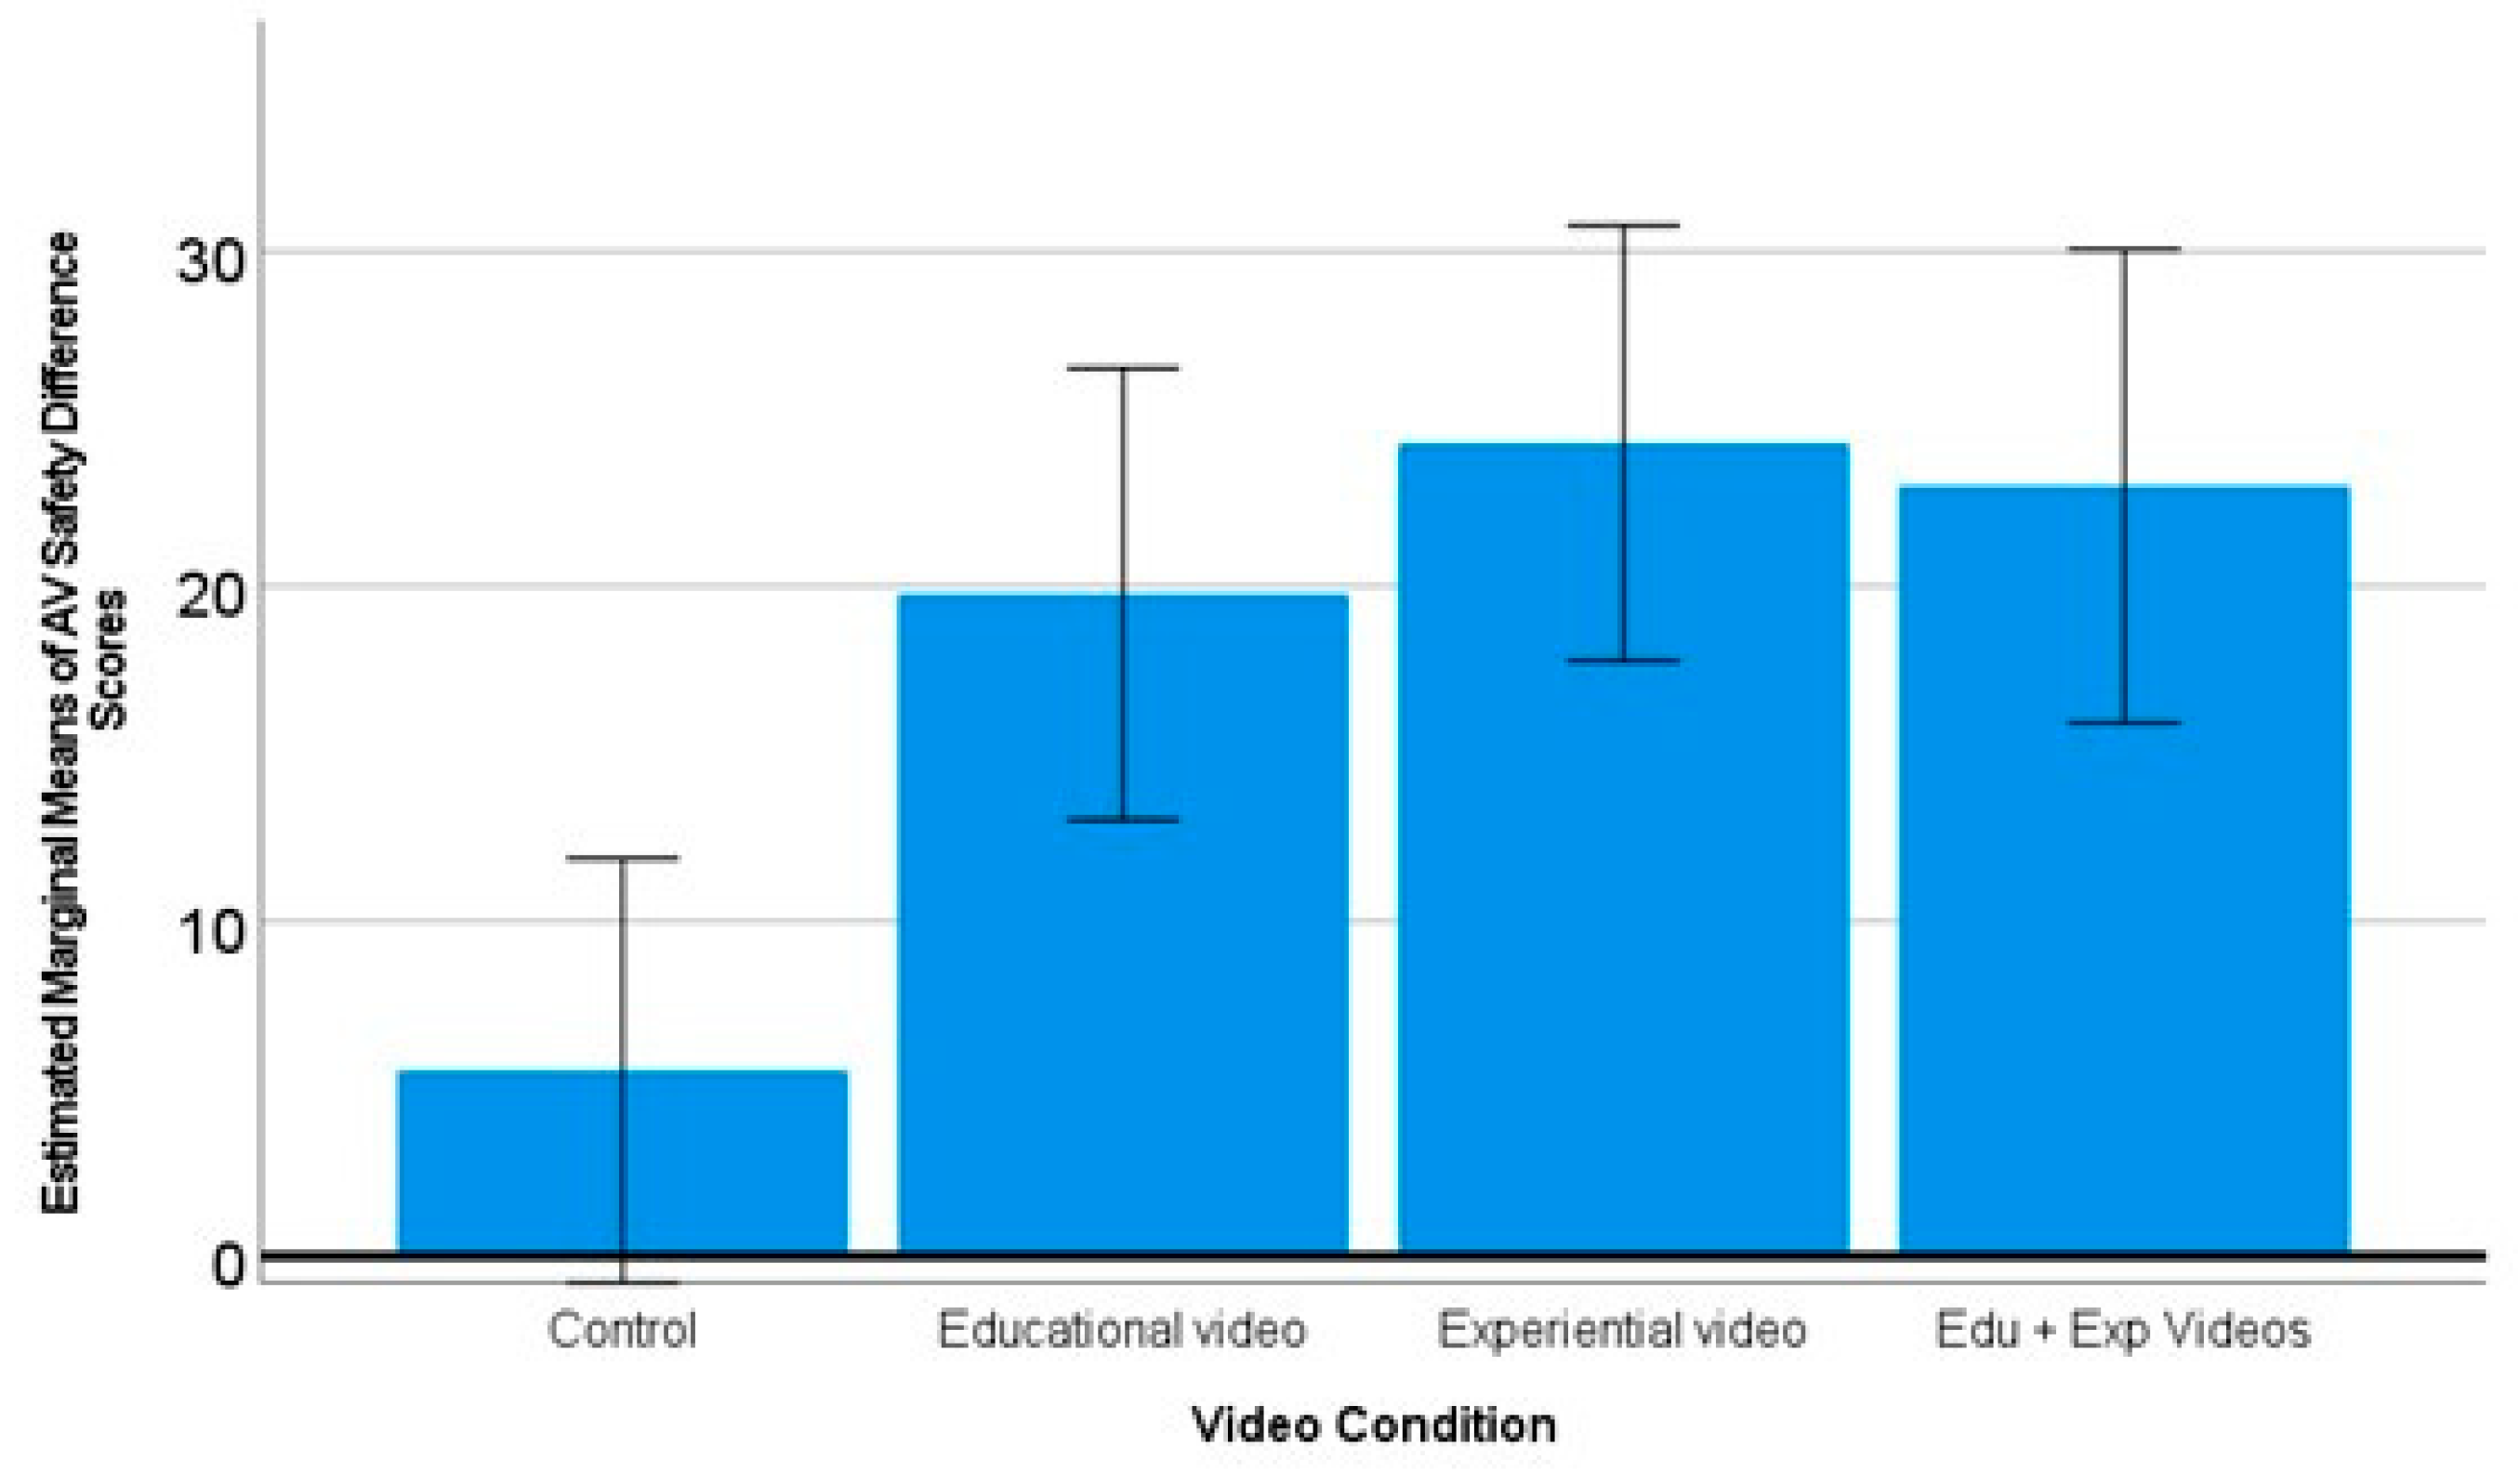
3.4. Video Condition Findings

Multivariate testing showed that watching the educational and/or the experiential video had a significant effect on participants’ SAV attitude difference scores, with a Pillai’s Trace of 0.090 F(15, 1248) = 2.56, p < 0.002, ηp2 = 0.030. Tests of between-subjects effects revealed that intent to use increased significantly more after watching the video(s) in the Both and Experiential conditions F(3, 418) = 3.47, p < 0.017, ηp2 = 0.024 (see Figure 6). Perceived safety difference scores also increased significantly more after viewing any of the intervention videos compared to the control condition F(3, 418) = 6.88, p < 0.0001, ηp2 = 0.47 (see Figure 7).

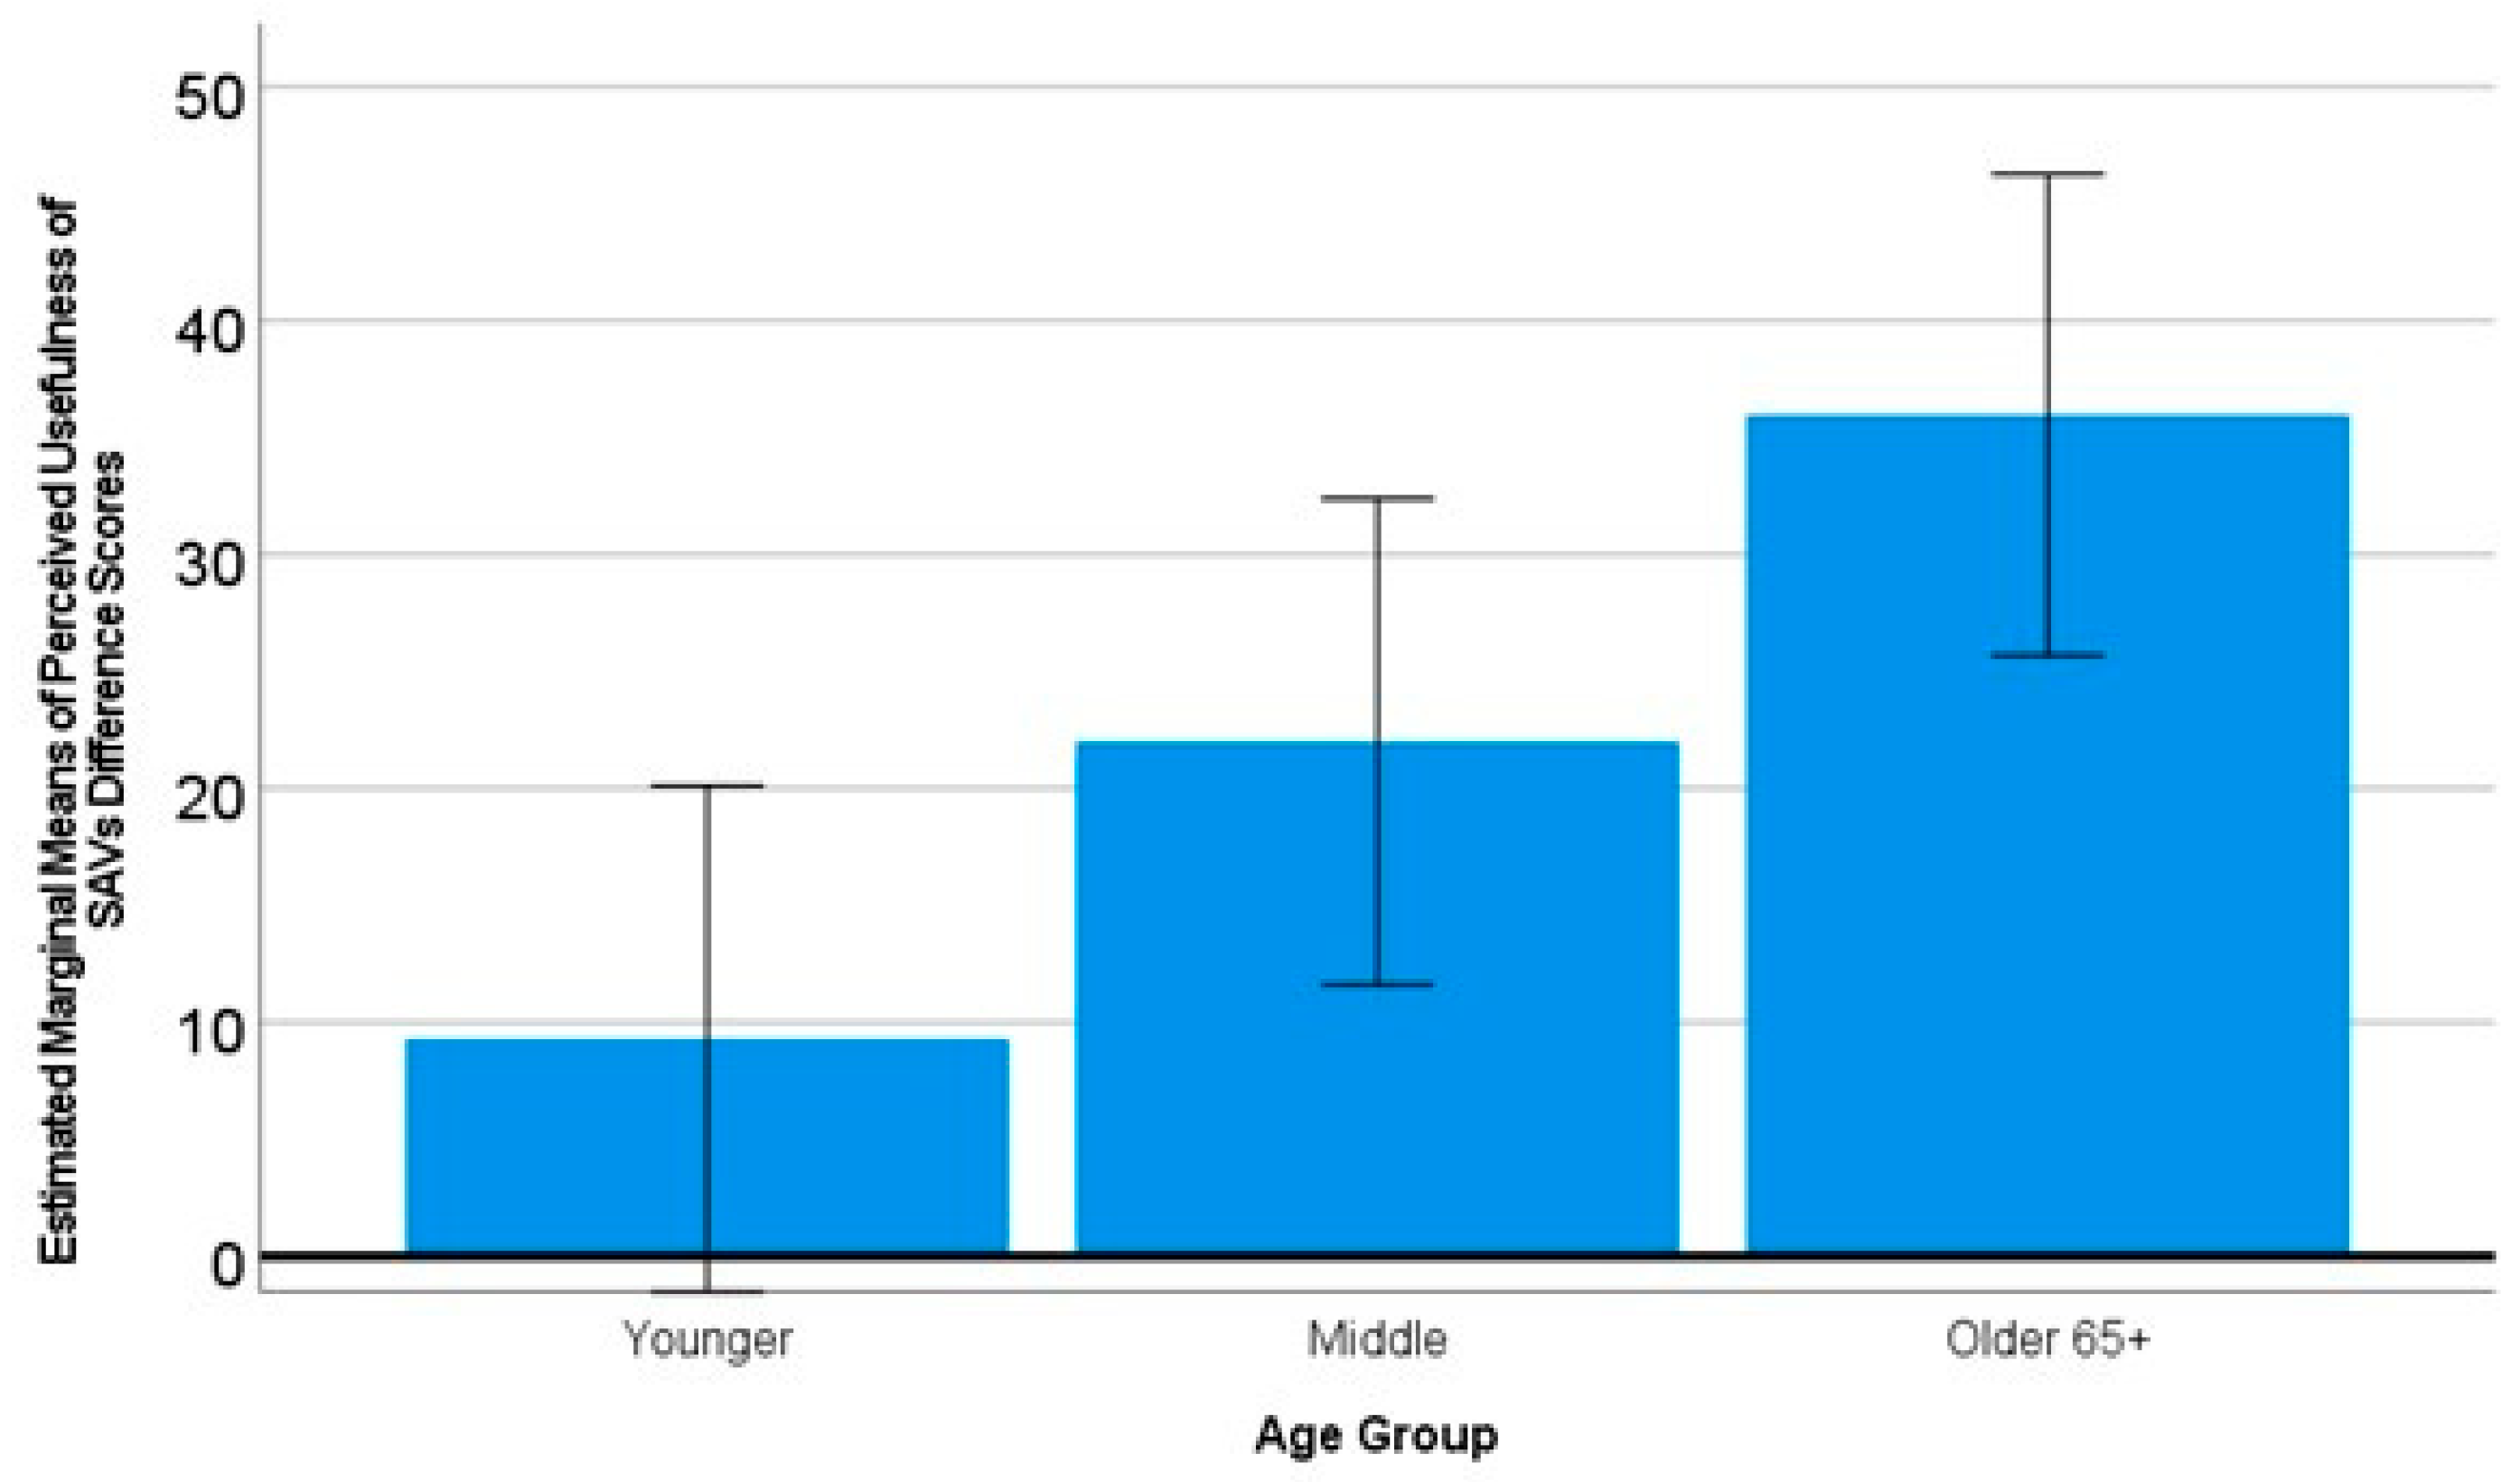
3.5. Age Group Findings

For differences between age groups, multivariate testing showed that older adults had greater improvements in their attitudes towards SAVs than younger respondents, with Pillai’s Trace of 0.078, F(10, 830) = 3.39, p < 0.0001, ηp2 = 0.039. Tests of between-subjects effects showed that older adults’ trust toward AVs increased significantly more than younger adults (F(2, 418) = 4.09, p < 0.018, ηp2 = 0.019; see Figure 8). Older adults also increased significantly more in PU of SAVs than younger adults (F(2, 418) = 5.94, p < 0.004, ηp2 = 0.28; see Figure 9), as well as PEOU increasing more for older adults than either middle-aged or younger adults (F(2, 418) = 4.64, p < 0.02, ηp2 = 0.022; see Figure 10) after watching their randomly assigned video(s).

4. Discussion

As seen in Figure 3, the baseline attitudes toward SAVs were low to middling for all age groups. Interestingly, there was not a large difference between younger and older participants’ baseline attitudes toward SAVs, as we expected based on previous literature [5,11,36]. After viewing one of our intervention videos, attitudes shifted in a positive direction, but the observed effect sizes were only in the small to medium range (ηp2 values typically fell below 0.04). For example, average intent to use SAVs scores suggested a slight reluctance at baseline. After our online video intervention, the average intent to use scores suggested a neutral intent to use SAVs. It is worth noting that this stated intent to use a shared mode of transportation may have been muted by pandemic conditions at the time of data collection in the spring of 2021, when shared modes were justifiably extremely limited in availability and/or their use [39,40]. While this shift in behavioral intentions to use SAVs is in a positive direction, it may only make someone strongly opposed to SAVs slightly more open to the idea of them. Trends of participants being slightly more positive about their attitudes toward SAVs after educational or experiential online video exposure can be seen across the other SAVUPS dimensions. This finding adds improving positive attitudes toward SAVs to a growing list of topics for which easily deployable online instruction methods prove to be either adequate substitutes for or useful boosters in domains such as the treatment for patients in psychotherapy [41], teachers earning credentials [42], as well as brief online interventions to reduce social anxiety [43]. Cases that do not align fully are enlightening as well, as some online programs are deemed insufficient alone, and an in-person component must be included [44].
We found that short online videos were useful in improving attitudes toward SAVs, supporting H1 and H2. Both types of videos were similarly effective from a statistical standpoint, so H3 (i.e., that the combination condition would be more positively inclined than any single type of video) was not supported. Still, this is promising for future promotional campaigns that companies intending to offer SAV services may want to initiate to increase their profile among potential riders. While the subjective results observed in this study may not directly impact use behavior, they can serve as indicators for future behavior. Both video conditions that contained the experiential video showed the potential to increase participants’ intent to use SAVs, which provides evidence that short online videos showing AVs safely navigating different, somewhat difficult driving conditions improve the likelihood of SAV services intending to be used by individuals of all ages that view them. Both educational and experiential videos also positively impacted perceptions of safety across the age groups in this study, suggesting that either knowing more about how SAVs work or seeing them in action may improve perceived safety. Findings from this study suggest that both experiential and educational video approaches can have a positive effect on potential users’ perception of SAVs and could be integrated into strategies for preparing the public for a future where SAVs play an important part in everyday transportation.
Knowing which methods different age groups respond to most positively when it comes to learning about and accepting SAVs can help stakeholders planning to launch these kinds of services target their messaging. For example, older adults displayed significantly greater increases in PU, trust, and PEOU than their younger counterparts after watching 7–15 min of online videos, which shows that the usefulness, trustworthiness, and ease of use of SAVs can be effectively demonstrated using such a brief, easily distributable medium. SAV stakeholders could host promotional events aimed at older populations, giving potential users experience with these technologies. In fact, evidence of the potential utility of providing general training on how to use currently available TNC services was observed in an unanticipated between-subjects tests interaction (Figure 5).
For the most part, middle-aged adults did not differ significantly from older or younger adults and fell somewhere in between the two. The exception is for PEOU, where older participants’ PEOU ratings of SAV services were significantly higher than both middle-aged and younger adults. Younger adults, in fact, had non-significant but slightly negative changes in PEOU after watching the educational video, failing to support H4 and H5 that they would show greater positive shifts (H4), leading to higher overall attitudes towards SAVs (H5). This may have been because of either the technology explanation content or because younger adults had overly optimistic views of the technologies, and the explanation brought their expectations down a bit. Interestingly, older adults’ PEOU ratings benefitted from viewing the control condition’s instructional TNC ridesharing video rather than just viewing the educational and/or experiential videos. This implies that older participants, relative to younger and middle-aged participants, had a lack of understanding of how currently available TNC services might be hailed from their smartphones. Only roughly 4 in 10 older adults are smartphone users [45], and this number seems to be increasing. This lack of familiarity and/or comfort with using such technology may be an inhibiting factor limiting older adults’ use of current and future ridesharing services. It is possible that these older participants might be conflating the TNC services described in the control video with SAV services, but recent divestitures and/or partnerships made by TNCs regarding their self-driving ventures [46,47] suggest that future SAV services might be hailed quite similarly to today’s TNC rides.
While it is promising that promotional campaigns delivered via online video can be modestly effective in improving attitudes, it is worth keeping in mind that there were individual differences in the video’s effectiveness and that it is still likely that the in-person experience would be more effective. Classen and colleagues [28] observed moderate to large effect sizes in their in-person study, whereas ours had smaller effect sizes. However, due to the costs of such in-person demonstrations and the wider range of people an online campaign could reach compared to smaller, targeted, in-person interventions, we believe that online videos like the ones used in this study have the potential to have a more widespread impact on the general public’s SAV attitudes than in-person demonstrations. It is also worth noting that interventions like these could be safely deployed during a global pandemic rather than waiting for it to be safe to return to in-person interactions.
This online survey study was not without limitations. One was our limited control over participants’ attentiveness to our video interventions. We mitigated the issue of video attentiveness by removing any participants who spent less than half the video length on the video page and who missed more than one video attention check question, but even with those measures in place, it is difficult to ascertain what extent the video content was absorbed by participants. Another limitation was due to the homogeneity of the sample, which was restricted to the continental US in the middle and older age groups and to a medium-sized university in the southeastern US. Different research has sought to collect data in multiple countries and also compare personal and shared ride models, providing insights into differences in markets and business models [48]. Our younger adult sample was more homogenous than typical online samples due to local convenience sampling. Younger participants were all students at Clemson University, and their lack of changes in attitudes may have been due to their location in a rural area where there is low availability of any kind of TNC services, and SAV deployment in such areas is unlikely to happen any time soon. Additionally, another limitation is the complex and intertwined nature of SAV attitudes. It is difficult to tell from a single online study what criteria any given participant’s reasoning for the responses we collected was based upon. Is the threat of COVID-19 infection leading to a muted effect on participants’ willingness to participate in ridesharing? Is the potential physical threat from other unknown riders a consideration? Or is the primary driver of attitudes more the novel, relatively untested, safety-critical technology that AVs rely upon? All of these are questions that will need to be answered before we can say with certainty what kinds of interventions will work best for which age groups when it comes to SAV attitudes.

5. Conclusions

Participants of varying ages participated in an online survey study to gauge the impact of educational and experiential videos on their SAV attitudes, which were measured before and after watching the intervention videos. Participants viewed videos with different information presentation strategies (experiential, educational, and ridesharing control). Significant changes were found between the pre- and post-video scores both between video types and across age groups. We observed small to medium effect sizes with online information dissemination. While the effect sizes were not as large as in-person experiences with AVs [28], online videos make it easier to reach potential users than having to bring users to a physical space, particularly older adults. These results are promising for the scalability of information dissemination for SAV stakeholders and potential riders.

Author Contributions

Conceptualization, D.J.S. and K.B.; methodology, D.J.S., K.B. and J.L.; formal analysis, K.B. and D.J.S.; funding acquisition, D.J.S.; Investigation, D.J.S.; data curation, K.B. and D.J.S.; writing—original draft preparation, K.B.; writing—review and editing, K.B., D.J.S. and J.L; visualization, K.B., J.L. and D.J.S.; supervision, D.J.S. All authors have read and agreed to the published version of the manuscript.

Funding

This research received no external funding.

Institutional Review Board Statement

The study was conducted in accordance with the Declaration of Helsinki and approved by the Institutional Review Board (or Ethics Committee) of Clemson University (# IRB2020-315).

Informed Consent Statement

Informed consent was obtained from all subjects involved in the study.

Data Availability Statement

Dataset available on request from the authors.

Acknowledgments

We would like to thank the Partners for Automated Vehicle Education (PAVE) for providing the materials we used to create our educational video and Zoox, Inc. for providing the footage used in our experiential video.

Conflicts of Interest

The authors declare no conflicts of interest.

Appendix A. Comfort with Ridesharing

Measured on a 7-point Likert “Strongly Agree—Strongly Disagree” scale.
If I were to choose ridesharing over traditional services:
I would feed safer because there would be another passenger in the car.
I would feel less safe because there would be more strangers in the car, in addition to the driver.
I would look forward to having positive interactions with other passengers.
I would be worried about having negative interactions with other passengers.
I feel it would be necessary to have a driver who can act as a mediator between passengers if needed.
I would be excited about the potential to meet someone who is different from me.
I would be uncomfortable if I were paired with someone who were different from me.

Appendix B. Perceptions of Technology

Measured on a 100-point slider.
ItemScale
What is your level of experience with technology? “Very inexperienced” to “Very experienced”.
Do you self-identify as being an avoider or and early adopter of new technology? “Avoid as long as possible” to “Try as soon as possible”.
Please rate your ability to learn how to operate a new technology. “Very poor” to “Very good”.
What is your overall trust in technology? “Very distrustful” to “Very trustful”.
Please rate your level of trust in established car technologies (e.g., cruise control).“Very distrustful” to “Very trustful”.
Please rate your level of trust in new technologies that are being introduced into cars (e.g., automatic emergency braking, lane-keeping assist). “Very distrustful” to “Very trustful”.
I have had bad experiences when I try to use new technology instead of doing things “the old-fashioned way”.“Never” to “Always”.

Appendix C. Shared Automated Vehicle User Perception Survey

Definition: An automated vehicle (i.e., self-driving vehicle, driverless car, self-driving shuttle) is a vehicle that is capable of sensing its environment and navigating without human input. Full-time automation of all driving tasks on any road, under any conditions, and does not require a driver or a steering wheel.
Directions: Please place a vertical dash (|) on the scale (by moving the slider) to display the degree to which you agree or disagree with the statement. One hundred-point slider from “Disagree” to “Agree”.
I am open to the idea of using shared automated vehicles.
I am suspicious of automated vehicles.
I believe I can trust automated vehicles.
I would engage in other tasks while riding in an automated vehicle.
I believe automated ridesharing services would reduce traffic congestion.
I believe automated ridesharing services will alleviate parking headaches.
I believe automated ridesharing services will allow me to stay active.
Automated ridesharing services will allow me to stay involved in my community.
Automated ridesharing services will enhance my quality of life/well-being.
I expect that automated ridesharing services will be easy to use.
I expect that it would require a lot of effort to figure out how to use automated ridesharing services.
I would us an automated ridesharing service on a daily basis.
I would rarely use an automated ridesharing service.
Even if I had access to an automated ridesharing service, I would still want to drive myself occasionally.
It will be important for there to be the option for a human to drive when using an automated ridesharing service.
My driving abilities would decline due to relying on an automated ridesharing service.
I would be willing to pay more for an automated ridesharing service compared to what I would pay for a traditional ridesharing service.
If cost was not an issue, I would use an automated ridesharing service.
I would use an automated vehicle if the National Highway Traffic Safety Administration (NHTSA) deems them as being safe.
Media portrays automated vehicles in a positive way.
My family and friends would encourage/support me when I use an automated ridesharing service.
When I’m riding in an automated vehicle, other road users will be safe.
I believe that automated vehicles will increase the number of crashes.
I would feel safe riding in an automated vehicle.
I feel hesitant about using an automated vehicle.

References

  1. Shi, E.; Gasser, T.M.; Seeck, A.; Auerswald, R. The Principles of Operation Framework: A Comprehensive Classification Concept for Automated Driving Functions. SAE Int. J. CAV 2020, 3, 12-03-01-0003. Available online: https://www.sae.org/content/12-03-01-0003/ (accessed on 15 December 2023). [CrossRef]
  2. Motamedi, S.; Wang, P.; Zhang, T.; Chan, C.Y. Acceptance of Full Driving Automation: Personally Owned and Shared-Use Concepts. Hum. Factors 2020, 62, 288–309. Available online: http://journals.sagepub.com/doi/10.1177/0018720819870658 (accessed on 4 December 2023). [CrossRef] [PubMed]
  3. Kyriakidis, M.; Happee, R.; de Winter, J.C.F. Public Opinion on Automated Driving: Results of an International Questionnaire among 5000 Respondents. Transp. Res. Part F Traffic Psychol. Behav. 2015, 32, 127–140. Available online: https://www.sciencedirect.com/science/article/pii/S1369847815000777 (accessed on 13 December 2023). [CrossRef]
  4. Charness, N.; Yoon, J.S.; Souders, D.; Stothart, C.; Yehnert, C. Predictors of Attitudes toward Autonomous Vehicles: The Roles of Age, Gender, Prior Knowledge, and Personality. Front. Psychol. 2018, 9, 410319. Available online: https://www.frontiersin.org/articles/10.3389/fpsyg.2018.02589 (accessed on 13 December 2023). [CrossRef]
  5. Wang, S.; Jiang, Z.; Noland, R.B.; Mondschein, A.S. Attitudes towards Privately-Owned and Shared Autonomous Vehicles. Transp. Res. Part F Traffic Psychol. Behav. 2020, 72, 297–306. Available online: https://linkinghub.elsevier.com/retrieve/pii/S1369847820304368 (accessed on 4 December 2023). [CrossRef]
  6. Nordhoff, S.; Kyriakidis, M.; van Arem, B.; Happee, R. A Multi-Level Model on Automated Vehicle Acceptance (MAVA): A Review-Based Study. Theor. Issues Ergon. Sci. 2019, 20, 682–710. [Google Scholar] [CrossRef]
  7. Blumenberg, E.; Taylor, B.D.; Smart, M.; Ralph, K.; Wander, M.; Brumbagh, S. What’s Youth Got to Do with It? Exploring the Travel. Behavior of Teens and Young Adults. 2012. Available online: https://escholarship.org/uc/item/9c14p6d5 (accessed on 15 December 2023).
  8. Luiu, C.; Tight, M.; Burrow, M. An Investigation into the Factors Influencing Travel Needs during Later Life. J. Transp. Health 2018, 11, 86–99. Available online: https://linkinghub.elsevier.com/retrieve/pii/S221414051830313X (accessed on 15 December 2023). [CrossRef]
  9. An, Z.; Heinen, E.; Watling, D. When You Are Born Matters: An Age-Period-Cohort Analysis of Multimodality. Travel Behav. Soc. 2021, 22, 129–145. Available online: https://www.sciencedirect.com/science/article/pii/S2214367X20302167 (accessed on 15 December 2023). [CrossRef]
  10. Scheiner, J.; Holz-Rau, C. A Comprehensive Study of Life Course, Cohort, and Period Effects on Changes in Travel Mode Use. Transp. Res. Part A Policy Pract. 2013, 47, 167–181. Available online: https://www.sciencedirect.com/science/article/pii/S0965856412001589 (accessed on 15 December 2023). [CrossRef]
  11. Classen, S.; Mason, J.R.; Hwangbo, S.W.; Sisiopiku, V. Predicting Autonomous Shuttle Acceptance in Older Drivers Based on Technology Readiness/Use/Barriers, Life Space, Driving Habits, and Cognition. Front. Neurol. 2021, 12, 798762. Available online: https://www.frontiersin.org/articles/10.3389/fneur.2021.798762 (accessed on 13 December 2023). [CrossRef]
  12. McLoughlin, S.; Prendergast, D.; Donnellan, B. Autonomous Vehicles for Independent Living of Older Adults—Insights and Directions for a Cross-European Qualitative Study. In Proceedings of the 7th International Conference on Smart Cities and Green ICT Systems, Funchal, Madeira, Portugal, 16–18 March 2018; SCITEPRESS—Science and Technology Publications: Lisboa, Portugal, 2018; pp. 294–303. Available online: http://www.scitepress.org/DigitalLibrary/Link.aspx?doi=10.5220/0006777402940303 (accessed on 15 December 2023).
  13. Litman, T. The Future Isn’t What It Used to Be: Changing Trends and Their Implications for Transport Planning; Institute: Victoria, BC, Canada, 2017; Volume 48. [Google Scholar]
  14. Alexiou, G. How Passengers with Disabilities Can Drive the Autonomous Vehicle Revolution. Forbes. Available online: https://www.forbes.com/sites/gusalexiou/2021/04/11/how-passengers-with-disabilities-can-drive-the-autonomous-vehicle-revolution/ (accessed on 15 December 2023).
  15. Bennett, R.; Vijaygopal, R.; Kottasz, R. Attitudes towards Autonomous Vehicles among People with Physical Disabilities. Transp. Res. Part A Policy Pract. 2019, 127, 1–17. Available online: https://linkinghub.elsevier.com/retrieve/pii/S0965856418308917 (accessed on 15 December 2023). [CrossRef]
  16. Haghzare, S.; Campos, J.L.; Bak, K.; Mihailidis, A. Older Adults’ Acceptance of Fully Automated Vehicles: Effects of Exposure, Driving Style, Age, and Driving Conditions. Accid. Anal. Prev. 2021, 150, 105919. Available online: https://www.sciencedirect.com/science/article/pii/S0001457520317395 (accessed on 15 December 2023). [CrossRef]
  17. Harb, M.; Xiao, Y.; Circella, G.; Mokhtarian, P.L.; Walker, J.L. Projecting Travelers into a World of Self-Driving Vehicles: Estimating Travel Behavior Implications via a Naturalistic Experiment. Transportation 2018, 45, 1671–1685. Available online: http://link.springer.com/10.1007/s11116-018-9937-9 (accessed on 28 August 2023). [CrossRef]
  18. Harb, M.; Malik, J.; Circella, G.; Walker, J. Glimpse of the Future: Simulating Life with Personally Owned Autonomous Vehicles and Their Implications on Travel Behaviors. Transp. Res. Rec. 2022, 2676, 492–506. [Google Scholar] [CrossRef]
  19. Mason, J.; Classen, S.; Wersal, J.; Sisiopiku, V. Construct Validity and Test–Retest Reliability of the Automated Vehicle User Perception Survey. Front. Psychol. 2021, 12, 626791. Available online: https://www.frontiersin.org/articles/10.3389/fpsyg.2021.626791 (accessed on 13 December 2023). [CrossRef] [PubMed]
  20. Sperling, D. Three Revolutions: Steering Automated, Shared, and Electric Vehicles to a Better Future; Island Press: Washington, DC, USA, 2018. [Google Scholar]
  21. Gurumurthy, K.M.; Kockelman, K.M.; Zuniga-Garcia, N. First-Mile-Last-Mile Collector-Distributor System using Shared Autonomous Mobility. Transp. Res. Rec. 2020, 2674, 638–647. [Google Scholar] [CrossRef]
  22. Sarriera, J.M.; Álvarez, G.E.; Blynn, K.; Alesbury, A.; Scully, T.; Zhao, J. To Share or Not to Share: Investigating the Social Aspects of Dynamic Ridesharing. Transp. Res. Rec. 2017, 2605, 109–117. Available online: http://journals.sagepub.com/doi/10.3141/2605-11 (accessed on 4 December 2023). [CrossRef]
  23. Lavieri, P.S.; Bhat, C.R. Modeling Individuals’ Willingness to Share Trips with Strangers in an Autonomous Vehicle Future. Transp. Res. Part A Policy Pract. 2019, 124, 242–261. Available online: https://linkinghub.elsevier.com/retrieve/pii/S0965856418309819 (accessed on 4 December 2023). [CrossRef]
  24. Triantafillidi, E.; Tzouras, P.G.; Spyropoulou, I.; Kepaptsoglou, K. Identification of Contributory Factors That Affect the Willingness to Use Shared Autonomous Vehicles. Future Transp. 2023, 3, 970–985. Available online: https://www.mdpi.com/2673-7590/3/3/53 (accessed on 1 March 2024). [CrossRef]
  25. König, A.; Grippenkoven, J. Travellers’ Willingness to Share Rides in Autonomous Mobility on Demand Systems Depending on Travel Distance and Detour. Travel Behav. Soc. 2020, 21, 188–202. Available online: https://www.sciencedirect.com/science/article/pii/S2214367X20301903 (accessed on 28 February 2024). [CrossRef]
  26. Souders, D.J.; Best, R.; Charness, N. Valuation of Active Blind Spot Detection Systems by Younger and Older Adults. Accid. Anal. Prev. 2017, 106, 505–514. Available online: https://linkinghub.elsevier.com/retrieve/pii/S0001457516303062 (accessed on 28 August 2023). [CrossRef] [PubMed]
  27. Paddeu, D.; Parkhurst, G.; Shergold, I. Passenger Comfort and Trust on First-Time Use of a Shared Autonomous Shuttle Vehicle. Transp. Res. Part C Emerg. Technol. 2020, 115, 102604. Available online: https://linkinghub.elsevier.com/retrieve/pii/S0968090X19301901 (accessed on 4 December 2023). [CrossRef]
  28. Classen, S.; Mason, J.; Wersal, J.; Sisiopiku, V.; Rogers, J. Older Drivers’ Experience with Automated Vehicle Technology: Interim Analysis of a Demonstration Study. Front. Sustain. Cities 2020, 2, 27. Available online: https://www.frontiersin.org/article/10.3389/frsc.2020.00027/full (accessed on 4 December 2023). [CrossRef]
  29. Lee, M.; Kent, R. Using the Internet for Market Research: A Study of Private Trading on the Internet. Mark. Res. Soc. J. 1999, 41, 1–10. [Google Scholar] [CrossRef]
  30. Penmetsa, P.; Dhondia, S.; Adanu, E.K.; Harper, C.; Nambisan, S.; Jones, S. Incentives to Encourage the Adoption of Connected and Automated Vehicles: Lessons Learned from Hybrid-Electric Vehicle Incentive Programs. Future Transp. 2023, 3, 986–995. Available online: https://www.mdpi.com/2673-7590/3/3/54 (accessed on 1 March 2024). [CrossRef]
  31. Armstrong, A.W.; Parsi, K.; Schupp, C.W.; Mease, P.J.; Duffin, K.C. Standardizing Training for Psoriasis Measures: Effectiveness of an Online Training Video on Psoriasis Area and Severity Index Assessment by Physician and Patient Raters. JAMA Dermatol. 2013, 149, 577–582. [Google Scholar] [CrossRef] [PubMed]
  32. Feng, B.; Malloch, Y.Z.; Kravitz, R.L.; Verba, S.; Iosif, A.M.; Slavik, G.; Henry, S.G. Assessing the Effectiveness of a Narrative-Based Patient Education Video for Promoting Opioid Tapering. Patient Educ. Couns. 2021, 104, 329–336. Available online: https://www.sciencedirect.com/science/article/pii/S0738399120304468 (accessed on 13 December 2023). [CrossRef] [PubMed]
  33. Tuong, W.; Larsen, E.R.; Armstrong, A.W. Videos to influence: A systematic review of effectiveness of video-based education in modifying health behaviors. J. Behav. Med. 2014, 37, 218–233. [Google Scholar] [CrossRef]
  34. Faul, F.; Erdfelder, E.; Buchner, A.; Lang, A.G. Statistical power analyses using G*Power 3.1: Tests for correlation and regression analyses. Behav. Res. Methods 2009, 41, 1149–1160. [Google Scholar] [CrossRef]
  35. Lee, C.; Mehler, B.; Reimer, B.; Coughlin, J.F. User Perceptions Toward In-Vehicle Technologies: Relationships to Age, Health, Preconceptions, and Hands-On Experience. Int. J. Hum.-Comput. Interact. 2015, 31, 667–681. Available online: http://www.tandfonline.com/doi/full/10.1080/10447318.2015.1070545 (accessed on 13 December 2023). [CrossRef]
  36. Mason, J.; Classen, S.; Wersal, J.; Sisiopiku, V.P. Establishing Face and Content Validity of a Survey to Assess Users’ Perceptions of Automated Vehicles. Transp. Res. Rec. 2020, 2674, 538–547. Available online: http://journals.sagepub.com/doi/10.1177/0361198120930225 (accessed on 21 April 2023). [CrossRef]
  37. Nasreddine, Z.S.; Phillips, N.A.; Bédirian, V.; Charbonneau, S.; Whitehead, V.; Collin, I.; Chertkow, H. The Montreal Cognitive Assessment, MoCA: A Brief Screening Tool for Mild Cognitive Impairment. J. Am. Geriatr. Soc. 2005, 53, 695–699. Available online: https://onlinelibrary.wiley.com/doi/abs/10.1111/j.1532-5415.2005.53221.x (accessed on 25 September 2021). [CrossRef]
  38. What is Ridesharing? [Full Overview]. 2018. Available online: https://www.youtube.com/watch?v=LjZH_W-1JPM (accessed on 13 December 2023).
  39. Das, S.; Boruah, A.; Banerjee, A.; Raoniar, R.; Nama, S.; Maurya, A.K. Impact of COVID-19: A Radical Modal Shift from Public to Private Transport Mode. Transp. Policy 2021, 109, 1–11. Available online: https://www.sciencedirect.com/science/article/pii/S0967070X21001438 (accessed on 28 February 2024). [CrossRef] [PubMed]
  40. Ozbilen, B.; Slagle, K.M.; Akar, G. Perceived Risk of Infection while Traveling during the COVID-19 Pandemic: Insights from Columbus, OH. Transp. Res. Interdiscip. Perspect. 2021, 10, 100326. Available online: https://linkinghub.elsevier.com/retrieve/pii/S2590198221000336 (accessed on 4 December 2023). [CrossRef] [PubMed]
  41. Schröder, J.; Berger, T.; Meyer, B.; Lutz, W.; Hautzinger, M.; Späth, C.; Moritz, S. Attitudes towards Internet Interventions among Psychotherapists and Individuals with Mild to Moderate Depression Symptoms. Cogn. Ther. Res. 2017, 41, 745–756. Available online: http://link.springer.com/10.1007/s10608-017-9850-0 (accessed on 28 February 2024). [CrossRef]
  42. Becker, K.D.; Bohnenkamp, J.; Domitrovich, C.; Keperling, J.P.; Ialongo, N.S. Online Training for Teachers Delivering Evidence-Based Preventive Interventions. Sch. Ment. Health 2014, 6, 225–236. Available online: http://link.springer.com/10.1007/s12310-014-9124-x (accessed on 28 February 2024). [CrossRef]
  43. Tobias, M.R.; Landy, L.N.; Levin, M.E.; Arch, J.J. A Randomized Trial of Brief Online Interventions to Facilitate Treatment Seeking for Social Anxiety. Behav. Modif. 2022, 46, 1137–1166. Available online: http://journals.sagepub.com/doi/10.1177/01454455211040051 (accessed on 28 February 2024). [CrossRef]
  44. Apolinário-Hagen, J.; Harrer, M.; Kählke, F.; Fritsche, L.; Salewski, C.; Ebert, D.D. Public Attitudes toward Guided Internet-Based Therapies: Web-Based Survey Study. JMIR Ment. Health 2018, 5, e10735. Available online: https://mental.jmir.org/2018/2/e10735 (accessed on 28 February 2024). [CrossRef]
  45. Anderson, M.; Perrin, A. Technology Use among Seniors. Available online: https://www.pewresearch.org/internet/2017/05/17/technology-use-among-seniors/ (accessed on 13 December 2023).
  46. Conger, K. Lyft Sells Self-Driving Project, Cutting a Big Expense; The New York Times: New York, NY, USA, 2021; Available online: https://www.nytimes.com/live/2021/04/26/business/stock-market-today (accessed on 13 December 2023).
  47. Somerville, H. Uber Sells Self-Driving-Car Unit to Autonomous-Driving Startup. Wall Str. J. 2020. Available online: https://www.wsj.com/articles/uber-sells-self-driving-car-unit-to-autonomous-driving-startup-11607380167 (accessed on 13 December 2023).
  48. Dijkhuijs, T.; Israel, F.; van Lierop, D. To Share or to Own? Understanding the Willingness to Adopt Shared and Owned Electric Automated Vehicles on Three Continents. Future Transp. 2023, 3, 1108–1123. Available online: https://www.mdpi.com/2673-7590/3/3/61 (accessed on 28 February 2024). [CrossRef]
Figure 1. Driver’s view and automated driving system’s view of the AV’s surroundings.
Futuretransp 04 00016 g001
Figure 2. Survey Flow. NOTE: Edu Vid = Educational Video, Exp Vid = Experiential Video.
Futuretransp 04 00016 g002
Figure 3. Baseline SAVUPS dimension scores by age group. NOTE: Error bars are 95% confidence intervals (CIs).
Futuretransp 04 00016 g003
Figure 4. SAVUPS dimension difference scores by age group. NOTE: Error bars are 95% Cis.
Futuretransp 04 00016 g004
Figure 5. Observed between-subjects tests video condition by age group interaction on perceived ease of use. NOTE: Error bars are 95% CIs.
Futuretransp 04 00016 g005
Figure 6. SAVUPS Intent to Use Difference Scores by Video Condition. Error bars are 95% CIs.
Futuretransp 04 00016 g006
Figure 7. SAVUPS AV safety difference scores by video condition. Error bars are 95% CIs.
Futuretransp 04 00016 g007
Figure 8. SAVUPS trust in AVs difference scores by age group. Error bars are 95% CIs.
Futuretransp 04 00016 g008
Figure 9. SAVUPS perceived usefulness of SAVs difference scores by age group. Error bars are 95% CIs.
Futuretransp 04 00016 g009
Figure 10. SAVUPS perceived ease of use of SAVs difference scores by age group. Error bars are 95% CIs.
Futuretransp 04 00016 g010
Table 1. Video condition and age group participant characteristics.
Area Type
N# FemaleAge# RuralSuburbanUrbanEducationIncomeRideshare
Experience
Rideshare ComfortTechnology PerceptionsMOCA Score
Video Condition
Control1247240.4 (21.9)1790193.57 (1.33)7.51 (3.85)3.95 (2.34)4.10 (1.15)73.7 (12.03)24.9 (1.96)
Educational1045945.5 (21.1)2153293.87 (1.69)6.79 (3.92)3.90 (2.17)4.07 (1.02)73.2 (15.8)25.2 (2.02)
Experiential1117243.3 (21.7)2465224.05 (1.59)6.82 (3.72)3.77 (2.19)4.03 (0.975)74.1 (13.95)25.1 (1.95)
Both975245.4 (20.4)1955234.05 (1.54)6.70 (3.83)3.64 (1.86)4.09 (1.03)73.2 (13.3)25.4 (1.56)
Age Group
Younger1479919.9 (1.28)2211882.56 (0.598)8.35 (4.27)4.59 (2.39)4.34 (0.911)73.0 (13.1)
Middle1457341 (8.79)2573474.37 (1.45)6.44 (3.58)3.94 (2.19)3.81 (1.13)73.8 (14.6)
Older1448370.2 (3.91)3472384.71 (1.42)6.12 (3.18)2.91 (1.42)4.07 (1.03)73.8 (13.6)25.2 (1.85)
NOTE: Values are Mean (SD). Education values: 1 = “Some high school”, 2 = “High school graduate”, 3 = “Some college”, 4 = “Associate degree (2-year)”, 5 = “Bachelor’s degree”, 6 = “Master’s degree”, 7 = “Doctoral degree”, 8 = “Professional degree (JD, MD)”; Income values: 1 = “$0–$9999”, 2 = “$10K–$19,999”, 3 = “$20K–$29,999”, 4 = “$30K–$39,999”, 5 = “$40K–$49,999”, 6 = “$50K–$59,999”, 7 = “$60K–$69,999”, 8 = “$70K–$79,999”, 9 = “$80K–$89,999”, 10 = “$90K–$99,999”, 11 = “$100K–$149,999”, 12 = “$150K+”; Rideshare Experience Values: 1 = “Never”, 2 = “3–4 Times a year”, 3 = “Once a month”, 4 = “2–3 times a month”, 5 = “2–3 Times a week”, 6 = “Daily”; Rideshare Comfort Values: 1 = “Strongly disagree”, 7 = “Strongly agree”.
Table 2. Video condition and age group SAVUPS difference scores.
NIntent to Use SAVsTrust in AVsPerceived Usefulness of SAVsPerceived Ease of Use of SAVsDesire for
Control/Driving
Efficacy
SAV CostSafety of AVs
Video
Condition
mean (SD)mean (SD)mean (SD)mean (SD)mean (SD)mean (SD)mean (SD)
Control1247.46 (45.83)11.86 (50.82)13.75 (60.61)8.27 (31.1)−6.5 (30.17)11.16 (33.34)6.47 (30.54)
Educational10419.68 (42.23)19.86 (54.32)34.34 (72.13)5.25 (36.16)−6.36 (39)10.46 (26.14)20.11 (32.06)
Experiential11123.41 (43.79)21.41 (53.53)16.23 (49.16)10.22 (31.93)−5.54 (30.6)12.8 (28.14)24.25 (36.91)
Edu + Exp9725.06 (46.61)25.66 (60.21)24.89 (60.64)6.69 (26.66)−13.1 (34.15)15.18 (33.86)21.97 (43.46)
Age Group
Younger14715.25 (44.86)9.99 (48.28)9.64 (56.23)0.57 (35.58)−9.6 (34.1)12.87 (32.86)17.43 (34.32)
Middle14523.42 (45.58)22.81 (49.3)19.79 (57.6)9.94 (26.07)−5.53 (35.21)11.6 (28.65)11.41 (34.53)
Older14416.24 (44.66)25.11 (64.06)36.14 (67.15)12.74 (31.39)−7.89 (30.97)12.42 (30.18)24.18 (39.11)
NOTE: Edu + Exp = Educational and Experiential Videos.
Table 3. Results of SAVUPS difference score MANCOVA (tests of between-subjects effects).
Dependent
Variable
Type III Sum of SquaresDFMean SquareFSig.ηp2
Corrected ModelIntent to Use SAVs50,050.898 a172944.171.470.1020.056
Trust in AVs66,060.116 b173885.8891.3160.1780.051
PU of SAVs123,566.599 c177268.6232.0010.0010.075
PEOU of SAVs45,034.118 d172649.0662.822<0.0010.103
Safety of AVs72,625.436 e174272.0843.549<0.0010.126
InterceptIntent to Use SAVs425.4591425.4590.2120.6450.001
Trust in AVs342.8261342.8260.1160.7330
PU of SAVs2486.4812486.480.6850.4080.002
PEOU of SAVs1391.6711391.671.4830.2240.004
Safety of AVs362.1761362.1760.3010.5840.001
Covariate—GenderIntent to Use SAVs45.832145.8320.0230.880
Trust in AVs0.9210.92000.9960
PU of SAVs2526.36212526.3620.6960.4050.002
PEOU of SAVs999.0721999.0721.0640.3030.003
Safety of AVs284.3421284.3420.2360.6270.001
Covariate—Tech PerceptionsIntent to Use SAVs241.0021241.0020.120.7290
Trust in AVs6659.39416659.3942.2560.1340.005
PU of SAVs1323.18911323.1890.3640.5460.001
PEOU of SAVs2759.13712759.1372.940.0870.007
Safety of AVs6971.91416971.9145.7920.0170.014
Covariate—Rideshare ExperienceIntent to Use SAVs9059.51719059.5174.5220.3610.011
Trust in AVs426.2731426.2730.1440.3840
PU of SAVs1335.09811335.0980.3680.7440.001
PEOU of SAVs6737.37416737.3747.1780.9350.017
Safety of AVs701.6481701.6480.5830.0070.001
Covariate—Rideshare ComfortIntent to Use SAVs1671.85111671.8510.8350.3610.002
Trust in AVs2246.49112246.4910.7610.3840.002
PU of SAVs386.7291386.7290.1060.7440
PEOU of SAVs6.20716.2070.0070.9350
Safety of AVs8719.72918719.7297.2440.0070.017
Covariate—SAVUPS DrivingIntent to Use SAVs4823.11614823.1162.4080.1220.006
Trust in AVs9333.66719333.6673.1610.0760.008
PU of SAVs1931.39111931.3910.5320.4660.001
PEOU of SAVs1163.0711163.071.2390.2660.003
Safety of AVs5212.92715212.9274.3310.0380.01
Covariate—SAVUPS CostIntent to Use SAVs38.854138.8540.0190.8890
Trust in AVs2053.67312053.6730.6960.4050.002
PU of SAVs7378.96517378.9652.0320.1550.005
PEOU of SAVs8.54318.5430.0090.9240
Safety of AVs4074.29314074.2933.3850.0670.008
Video ConditionIntent to Use SAVs20,844.21636948.0723.4680.0160.024
Trust in AVs8348.18832782.7290.9430.4200.007
PU of SAVs24,772.70338257.5682.2740.0790.016
PEOU of SAVs2296.3613765.4540.8150.4860.006
Safety of AVs24,843.86738281.2896.8800.047
Age GroupIntent to Use SAVs9226.07724613.0392.3030.1010.011
Trust in AVs24,162.239212,081.1194.0920.0170.019
PU of SAVs43,131.142221,565.5715.9380.0030.028
PEOU of SAVs8700.89524350.4484.6350.0100.022
Safety of AVs6396.63723198.3192.6580.0710.013
Video Condition x Age GroupIntent to Use SAVs5172.3056862.0510.430.8590.006
Trust in AVs15,712.06262618.6770.8870.5040.013
PU of SAVs23,272.26563878.7111.0680.3810.015
PEOU of SAVs14,942.11962490.3532.6530.0150.037
Safety of AVs1521.476253.5780.2110.9730.003
ErrorIntent to Use SAVs837,383.2394182003.309
Trust in AVs1,234,128.5884182952.461
PU of SAVs1,518,138.1624183631.909
PEOU of SAVs39,350.855418938.638
Safety of AVs503,145.5984181203.698
TotalIntent to Use SAVs1,032,394436
Trust in AVs1,463,375436
PU of SAVs1,849,660436
PEOU of SAVs463,402436
Safety of AVs711,087436
Corrected TotalIntent to Use SAVs887,434.138435
Trust in AVs13,000,188.7435
PU of SAVs1,641,704.761435
PEOU of SAVs437,384.972435
Safety of AVs575,771.034435
NOTE: a. R2 = 0.056 (Adjusted R2 = 0.018); b. R2 = 0.051 (Adjusted R2 = 0.012); c. R2 = 0.075 (Adjusted R2 = 0.038); d. R2= 0.103 (Adjusted R2 = 0.066); e. R2 = 0.126 (Adjusted R2 = 0.091).
Disclaimer/Publisher’s Note: The statements, opinions and data contained in all publications are solely those of the individual author(s) and contributor(s) and not of MDPI and/or the editor(s). MDPI and/or the editor(s) disclaim responsibility for any injury to people or property resulting from any ideas, methods, instructions or products referred to in the content.

